23
Earnings Conference Call Q1 Fiscal Year 2019 June 4, 2018

Earnings Conference CallQ1 Fiscal Year 2019
June 4, 2018

Title and Content
Forward-Looking StatementsThis presentation (including the accompanying oral presentation) contains forward-looking statements within the meaning of the federal securities laws, including statements regarding future financial performance, business strategy and objectives, potential market and growth opportunities, technological or market trends, and projected sales and customer retention rates.
We have based these forward-looking statements largely on our current expectations and projections about future events and financial trends that we believe may affect our financial condition, results of operations, business strategy, short-term and long-term business operations, and objectives and financial needs. These forward-looking statements are subject to a number of risks, uncertainties, assumptions, and other factors including, but not limited to, those described in our SEC filings. Moreover, we operate in a competitive and rapidly changing environment in which new risks emerge from time to time. It is not possible for us to predict all risks, nor can we assess the impact of all factors on our business or the extent to which any factor, or combination of factors, may cause our actual results or performance to differ materially from those contained in any forward-looking statements we may make. Although we believe that the expectations reflected in the forward looking statements are reasonable, these and other factors may cause our actual results, performance, or achievements to differ materially and adversely from those anticipated or implied in our forward-looking statements.
All forward-looking statements contained herein are based on information available to us as of the date hereof and we do not assume any obligation to update these statements as a result of new information or future events, except as required by law. We may not actually achieve the plans, intentions, or expectations disclosed in our forward-looking statements and you should not place undue reliance on our forward-looking statements.
In addition to U.S. GAAP financials, this presentation includes certain non-GAAP financial measures, including non-GAAP gross margin, calculated billings, free cash flow, non-GAAP operating expenses, and non-GAAP loss per share. These non-GAAP measures are in addition to, not a substitute for or superior to, measures of financial performance prepared in accordance with U.S. GAAP. Our non-GAAP financial measures may differ from the non-GAAP financial measures used by other companies. A reconciliation of these measures to the most directly comparable U.S. GAAP measure is included in the Appendix to these slides.
Additional risks and uncertainties that could affect our financial results are included in filings we make with the SEC from time to time, including under the captions “Risk Factors” and “Management’s Discussion and Analysis of Financial Condition and Results of Operations.” These filings are available on our Investor Relations website at https://investors.smartsheet.com and on the SEC website at www.sec.gov.

Title and Content
Mark Mader President & CEO
Business Highlights

Title and Content
Jennifer Ceran CFO
Financial Highlights

Title and Content
Strong Start to FY19• Q1 Revenue of $36.3M, up 63% YoY• Q1 Billings of $45.4M, up 50% YoY
Investing in Market Opportunity• Q1 Non-GAAP Operating Loss was $11.0M• Q1 Non-GAAP Net Loss per Share was $0.12• Free Cash Flow was negative $9.7M
Strengthening Balance Sheet• Ended Q1 with cash and cash equivalents of $49.7M, raised additional $163.8M in IPO*
Providing Q2 and Full Year 2019 Guidance • Reflects top line strength, while continuing to make investments in our business
Financial Highlights
*The amount raised in IPO was not received until closing of the IPO which took place on May 1, 2018.

Title and Content
Revenue
• Q1 FY19 Subscription revenue was $32.1M, up 57% YoY
• Q1 FY19 Services revenue was $4.3M, up 129% YoY, and represented 12% of revenue
• Strength in Services driven by customer demand for consulting & training
QoQ 13% 20% 10% 12% 10%YoY 63% 69% 65% 68% 63%
Note: QoQ and YoY based on same months in quarter in prior years.

Title and Content
Subscription Metrics Q1
FY18Q2
FY18Q3
FY18Q4
FY18Q1
FY19YoY
Change
Domain Customers(1) 69,039 71,021 72,529 74,116 75,642 10%
All customers w/ ACV >=$5k 2,437 2,823 3,275 3,790 4,349 78%
All customers w/ ACV >=$50k 100 121 145 189 239 139%
Domain Average ACV(2) $1,230 $1,346 $1,491 $1,640 $1,808 47%
Dollar Retention Rate(3) 124% 126% 129% 130% 130% 6 Pts
(1) Domain customers are all customers with a unique domain name. This excludes ISP customers of 18K.(2) Average annualized contract value (ACV) is the annualized subscription value for domain customers over the number of domain customers.(3) Dollar retention rate is defined as the net % of ACV retained from all customers, after expansion, reductions and cancellations as of the end of the
quarter. This metric is calculated by dividing total customers’ ACV as of the end of the fiscal quarter by their ACV 12 months ago. Includes domain customers and ISP customers.

Title and Content
Non-GAAP Gross Margin
• Q1 FY19 Subscription gross margin down vs. prior quarter due to planned increase in headcount in tech support function
• Q1 FY19 Services gross margin higher vs. prior quarter due to timing of hiring, and larger amount of training which has higher gross margins
Q1 FY19 GAAP Total Gross Margin was 80%

Title and Content
Total OPEX $24.4M $28.1M $33.2M $34.4M $40.2M
• Q1 FY19 G&A as a % of revenue driven by higher costs associated with being a public company
• Q1 FY19 R&D as a % of revenue driven by engineering hires and more professional services
• Q1 FY19 S&M as a % of revenue lower vs. year ago quarter due to lower professional services and a modest increase in marketing, partially offset by higher personnel costs
Non-GAAP Operating Expenses as a % of Revenue Q1 FY19 GAAP Total OPEX was $42M, 116% of Revenue

Title and Content
Non-GAAP Operating and Free Cash Flow Margins
● 67% of Q1 FY19 expense driven by personnel
● Q1 FY19 cash flow impacted by annual bonus payout
● Q1 FY19 CAPEX and principal lease payments as a % of revenue was 4%
1 Free cash flow is defined as net cash used in operating activities less cash used for purchases of property and equipment and payments on capital lease obligations.
1
Q1 FY19 GAAP Operating Loss was $13M, -36% Op. Margin
Title and Content
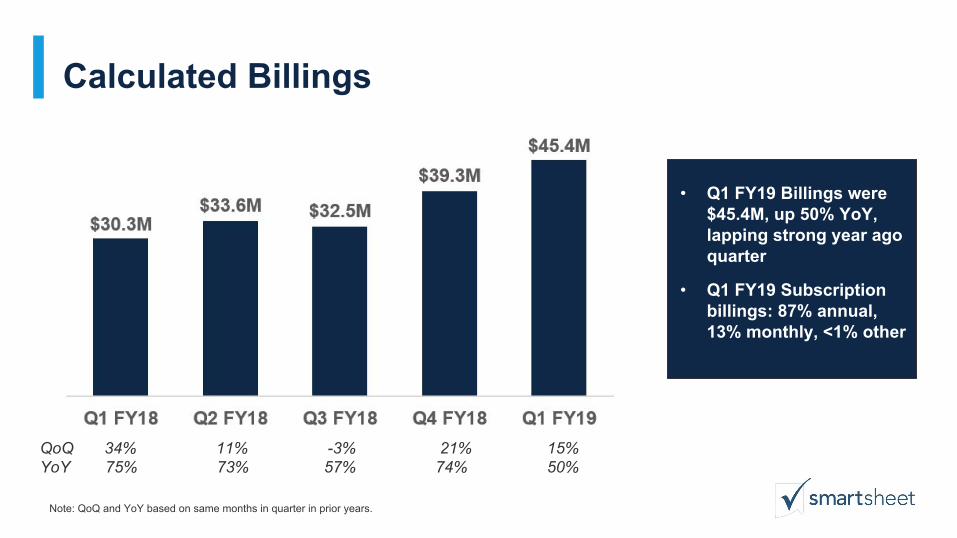
Calculated Billings
• Q1 FY19 Billings were $45.4M, up 50% YoY, lapping strong year ago quarter
• Q1 FY19 Subscription billings: 87% annual, 13% monthly, <1% other
Note: QoQ and YoY based on same months in quarter in prior years.
QoQ 34% 11% -3% 21% 15%YoY 75% 73% 57% 74% 50%

Title and Content
Q2 non-GAAP weighted average basic and diluted shares estimated to be 102M.Full year non-GAAP weighted average basic and diluted shares estimated to be 99M.
● Quarterly Billings are expected to follow a sequential cadence similar to fiscal year 2018
● Free Cash Flow of up to negative $25M. Burn improves sequentially each quarter
Q2 and FY19 Guidance

Blank
Q&A

Blank
Appendix

Title Only
Reconciliation from GAAP to Non-GAAP Gross Profit and Gross Margin
Title Only
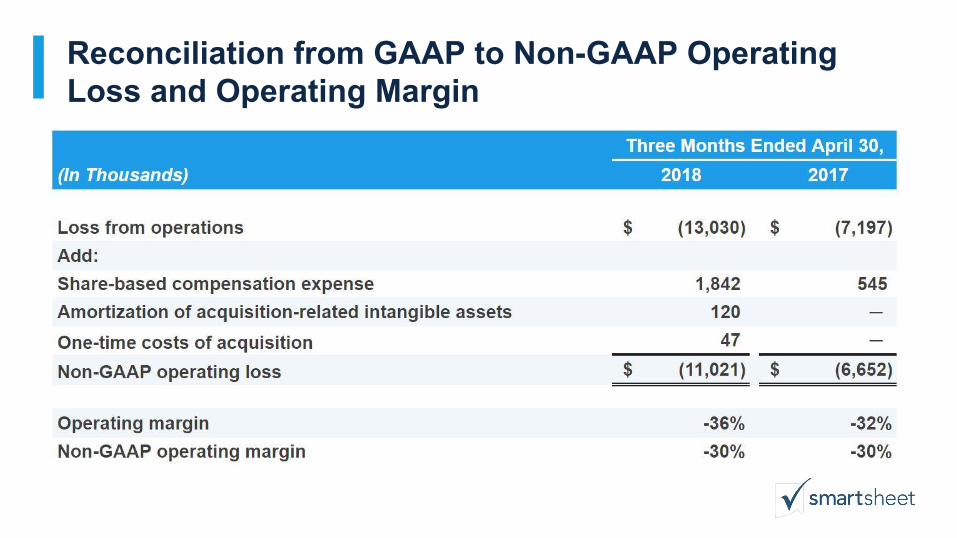
Reconciliation from GAAP to Non-GAAP Operating Loss and Operating Margin

Title Only
Reconciliation from GAAP to Non-GAAP Net Loss

Title Only
Reconciliation from GAAP to Non-GAAP Weighted Average Shares Outstanding (Basic and Diluted)

Title Only
Anti-Dilutive Shares at Period End
An additional 11,745,088 shares were issued in the initial public offering which closed on May 1, 2018

Title Only
Reconciliation from Net Operating Cash Flow to Free Cash Flow

Title Only
Reconciliation from Revenue to Calculated Billings

Title Only
Reconciliation from GAAP to Non-GAAP Operating Loss Guidance

Title Only
Reconciliation from GAAP to Non-GAAP Net Loss Guidance
Q2 GAAP weighted average basic shares estimated to be 102MFull year GAAP weighted average basic shares estimated to be 82M


