27
Q1 FY19 RESULT UPDATE August 2018
Q1 FY19 RESULT UPDATEAugust 2018
2
• Q1 FY19 RESULT HIGHLIGHTS
• Q1 FY19 PORTFOLIO UPDATE
• AMUSEMENT PARK, BANGALORE
• RESORT, BANGALORE
• AMUSEMENT PARK, KOCHI
• AMUSEMENT PARK, HYDERABAD
• FINANCIALS
• COMPANY OVERVIEW
Q1 FY19 RESULT HIGHLIGHTS
3
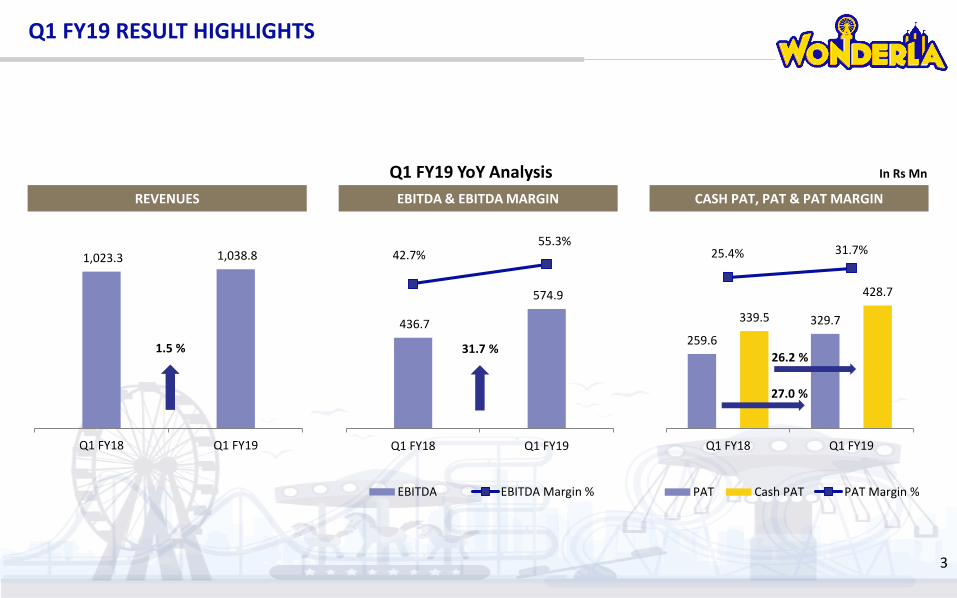
In Rs Mn
REVENUES EBITDA & EBITDA MARGIN CASH PAT, PAT & PAT MARGIN
1,023.3 1,038.8
Q1 FY18 Q1 FY19
Q1 FY19 YoY Analysis
42.7%55.3%
436.7
574.9
Q1 FY18 Q1 FY19
EBITDA EBITDA Margin %
25.4% 31.7%
259.6
329.7339.5
428.7
Q1 FY18 Q1 FY19
PAT Cash PAT PAT Margin %
27.0 %
26.2 %1.5 % 31.7 %
Q1 FY19 RESULT HIGHLIGHTS
4
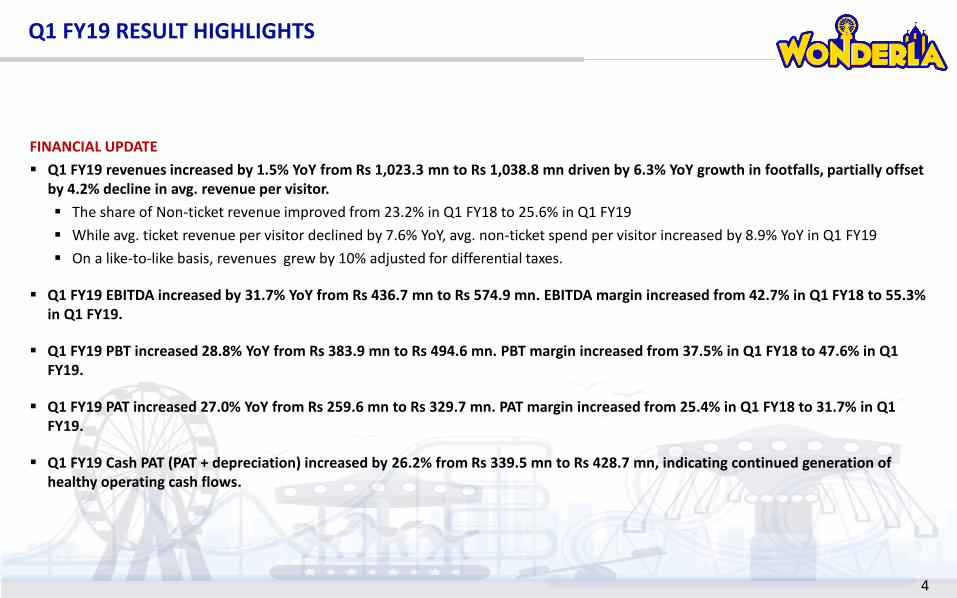
FINANCIAL UPDATE
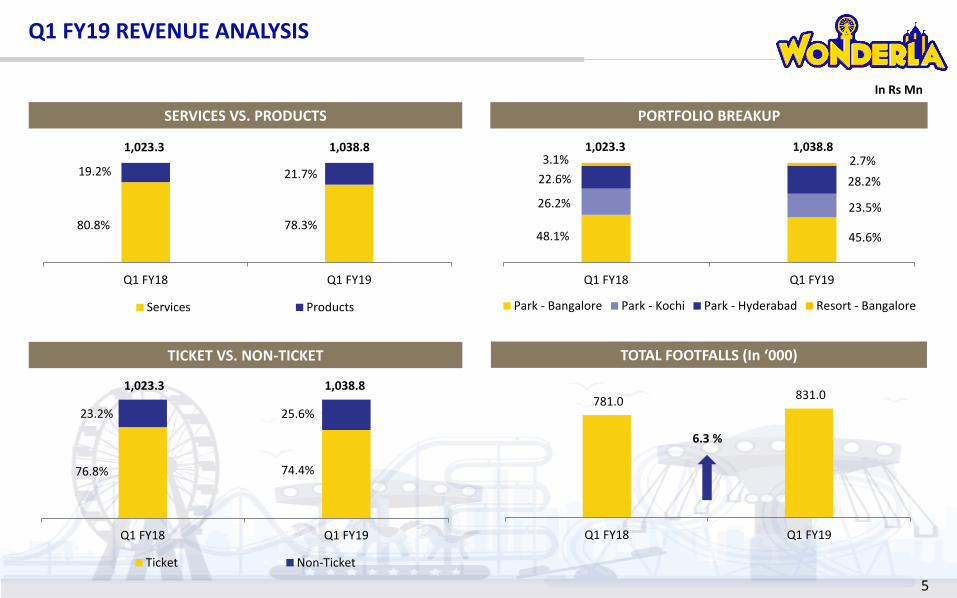
▪ Q1 FY19 revenues increased by 1.5% YoY from Rs 1,023.3 mn to Rs 1,038.8 mn driven by 6.3% YoY growth in footfalls, partially offset by 4.2% decline in avg. revenue per visitor.
▪ The share of Non-ticket revenue improved from 23.2% in Q1 FY18 to 25.6% in Q1 FY19
▪ While avg. ticket revenue per visitor declined by 7.6% YoY, avg. non-ticket spend per visitor increased by 8.9% YoY in Q1 FY19
▪ On a like-to-like basis, revenues grew by 10% adjusted for differential taxes.
▪ Q1 FY19 EBITDA increased by 31.7% YoY from Rs 436.7 mn to Rs 574.9 mn. EBITDA margin increased from 42.7% in Q1 FY18 to 55.3% in Q1 FY19.
▪ Q1 FY19 PBT increased 28.8% YoY from Rs 383.9 mn to Rs 494.6 mn. PBT margin increased from 37.5% in Q1 FY18 to 47.6% in Q1 FY19.
▪ Q1 FY19 PAT increased 27.0% YoY from Rs 259.6 mn to Rs 329.7 mn. PAT margin increased from 25.4% in Q1 FY18 to 31.7% in Q1 FY19.
▪ Q1 FY19 Cash PAT (PAT + depreciation) increased by 26.2% from Rs 339.5 mn to Rs 428.7 mn, indicating continued generation of healthy operating cash flows.
Q1 FY19 REVENUE ANALYSIS
SERVICES VS. PRODUCTS
80.8% 78.3%
19.2% 21.7%
Q1 FY18 Q1 FY19
Services Products
In Rs Mn
TICKET VS. NON-TICKET
76.8% 74.4%
23.2% 25.6%
Q1 FY18 Q1 FY19
Ticket Non-Ticket
TOTAL FOOTFALLS (In ‘000)
781.0 831.0
Q1 FY18 Q1 FY19
48.1% 45.6%
26.2% 23.5%
22.6% 28.2%
3.1% 2.7%
Q1 FY18 Q1 FY19
Park - Bangalore Park - Kochi Park - Hyderabad Resort - Bangalore
PORTFOLIO BREAKUP
1,023.3 1,038.8 1,023.3 1,038.8
5
1,023.3 1,038.8
6.3 %

Q1 FY19 REVENUE ANALYSIS
6
AVG. REVENUE PER VISITOR (PARKS) (In Rs) *
1,269 1,216
Q1 FY18 Q1 FY19
* Includes sale of services, sales of products & other operating income.6
AVG. TICKET REVENUE PER VISITOR (PARKS) (In Rs)
1,006930
Q1 FY18 Q1 FY19
AVG. NON-TICKET REVENUE PER VISITOR (PARKS) (In Rs) BREAK-UP OF NON-TICKET REVENUE (PARKS + RESORT) (In Rs Mn) *
Q3 FY15
35.8% 42.3%
41.5% 38.2%
13.4% 10.7%9.3%
8.8%
Q1 FY18 Q1 FY19
Restaurants Products Resort Others
263286
Q1 FY18 Q1 FY19
4.2 % 7.6 %
8.9 %
7
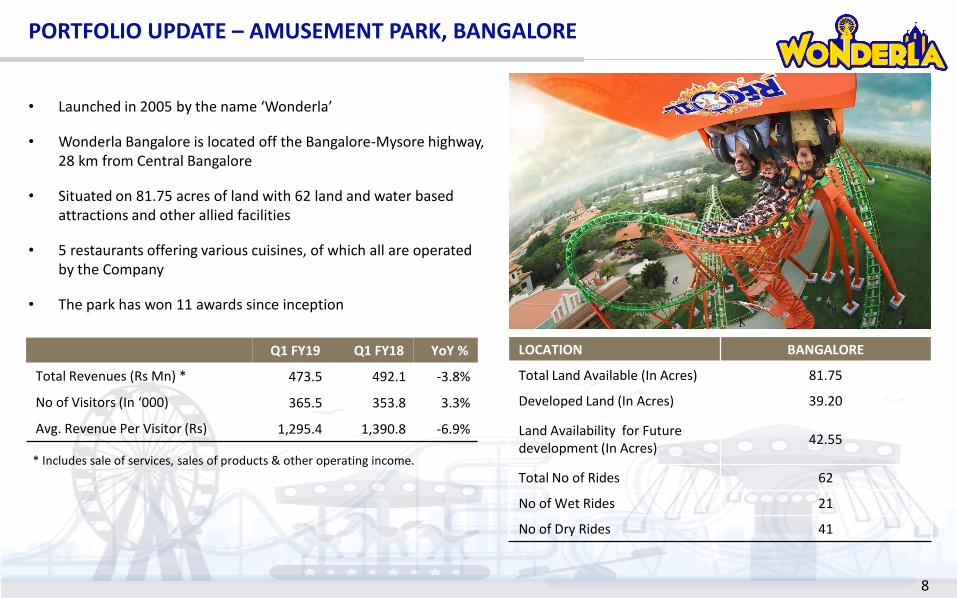
PORTFOLIO UPDATE – AMUSEMENT PARK, BANGALORE
LOCATION BANGALORE
Total Land Available (In Acres) 81.75
Developed Land (In Acres) 39.20
Land Availability for Futuredevelopment (In Acres)
42.55
Total No of Rides 62
No of Wet Rides 21
No of Dry Rides 41
• Launched in 2005 by the name ‘Wonderla’
• Wonderla Bangalore is located off the Bangalore-Mysore highway, 28 km from Central Bangalore
• Situated on 81.75 acres of land with 62 land and water based attractions and other allied facilities
• 5 restaurants offering various cuisines, of which all are operated by the Company
• The park has won 11 awards since inception
* Includes sale of services, sales of products & other operating income.
8
Q1 FY19 Q1 FY18 YoY %
Total Revenues (Rs Mn) * 473.5 492.1 -3.8%
No of Visitors (In ‘000) 365.5 353.8 3.3%
Avg. Revenue Per Visitor (Rs) 1,295.4 1,390.8 -6.9%
9
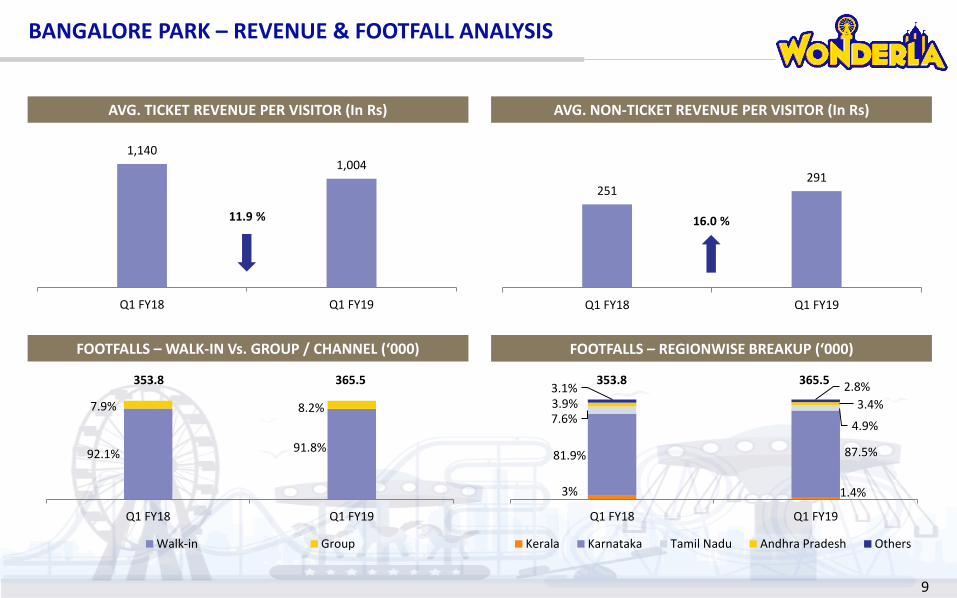
BANGALORE PARK – REVENUE & FOOTFALL ANALYSIS
FOOTFALLS – WALK-IN Vs. GROUP / CHANNEL (‘000) FOOTFALLS – REGIONWISE BREAKUP (‘000)
AVG. TICKET REVENUE PER VISITOR (In Rs)
1,1401,004
Q1 FY18 Q1 FY19
AVG. NON-TICKET REVENUE PER VISITOR (In Rs)
251291
Q1 FY18 Q1 FY19
92.1% 91.8%
7.9% 8.2%
Q1 FY18 Q1 FY19
Walk-in Group
3% 1.4%
7.6%4.9%
3.9% 3.4%3.1% 2.8%
81.9% 87.5%
Q1 FY18 Q1 FY19
Kerala Karnataka Tamil Nadu Andhra Pradesh Others
353.8 365.5 365.5353.8
11.9 % 16.0 %

PORTFOLIO UPDATE – WONDERLA RESORT, BANGALORE
• Three Star leisure resort attached to the amusement park; launched in March 2012
• The resort has 84 luxury rooms
• The resort also has 4 banquet halls / conference rooms, totalling 8,900 sq. ft. with a capacity to hold 800 guests and a well equipped board room
• Suitable for hosting wedding receptions, parties and other corporate events and meetings
• Other amenities include a multi-cuisine restaurant, rest-o-bar, solar heated swimming pool, recreation area, kids’ activity centre and a well equipped gym
10
Q1 FY19 Q1 FY18 YoY %
Total Revenues (Rs Mn) * 28.5 31.9 -10.6%
Total No of Room Nights Available (No.) to Guests 7,515 7,495 -
Occupancy % 45% 50% -
Avg. Room Rental for the period (Rs) 5,059 5,000 1.2%
* Includes other operating income.

11
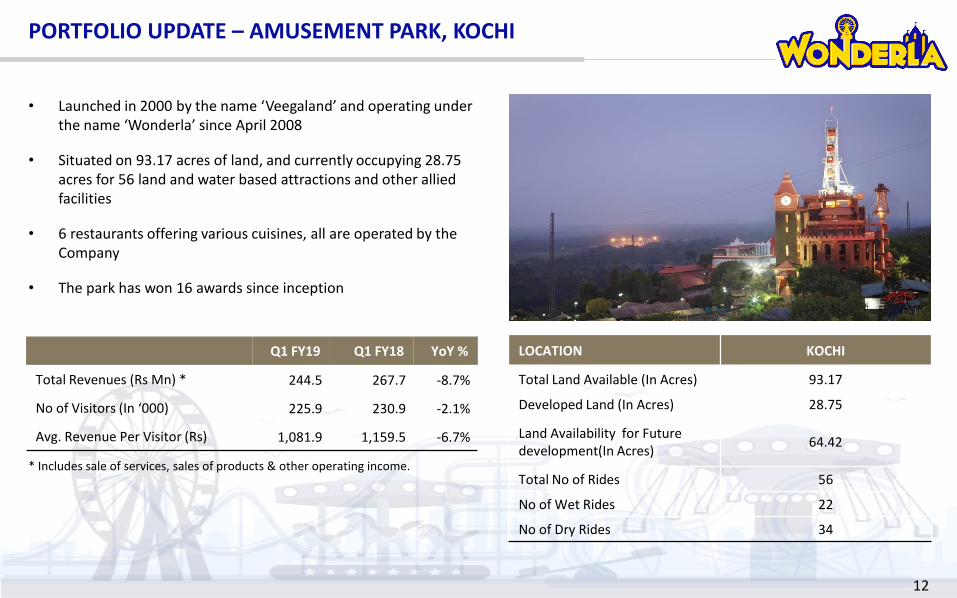
PORTFOLIO UPDATE – AMUSEMENT PARK, KOCHI
LOCATION KOCHI
Total Land Available (In Acres) 93.17
Developed Land (In Acres) 28.75
Land Availability for Futuredevelopment(In Acres)
64.42
Total No of Rides 56
No of Wet Rides 22
No of Dry Rides 34
• Launched in 2000 by the name ‘Veegaland’ and operating under the name ‘Wonderla’ since April 2008
• Situated on 93.17 acres of land, and currently occupying 28.75 acres for 56 land and water based attractions and other allied facilities
• 6 restaurants offering various cuisines, all are operated by the Company
• The park has won 16 awards since inception
12
* Includes sale of services, sales of products & other operating income.
Q1 FY19 Q1 FY18 YoY %
Total Revenues (Rs Mn) * 244.5 267.7 -8.7%
No of Visitors (In ‘000) 225.9 230.9 -2.1%
Avg. Revenue Per Visitor (Rs) 1,081.9 1,159.5 -6.7%

13
KOCHI PARK – REVENUE & FOOTFALL ANALYSIS
FOOTFALLS – WALK-IN Vs. GROUP / CHANNEL (‘000)
AVG. TICKET REVENUE PER VISITOR (In Rs)
910832
Q1 FY18 Q1 FY19
AVG. NON-TICKET REVENUE PER VISITOR (In Rs)
249 250
Q1 FY18 Q1 FY19
86.5% 86.3%
13.5% 13.7%
Q1 FY18 Q1 FY19
Walk-in Group
230.8
FOOTFALLS – REGIONWISE BREAKUP (‘000)
66.3% 67.9%
1.2% 1.1%
29.0% 27.4%
0.7% 1%3.4% 3.0%
Q1 FY18 Q1 FY19
Kerala Karnataka Tamil Nadu Andhra Pradesh Others
225.9
8.6 % 0.2 %
230.8 225.9

14

PORTFOLIO UPDATE – AMUSEMENT PARK, HYDERABAD
LOCATION HYDERABAD
Total Land Available (In Acres) 49.5
Developed Land (In Acres) 27.0
Land Availability for Future development(In Acres)
22.5
Total No of Rides 44
No of Wet Rides 18
No of Dry Rides 26
• Launched in April 2016 by the name ‘Wonderla’.
• Situated on 49.5 acres of land, and currently occupying 27.0 acres for 44 land and water based attractions and other allied facilities.
• 4 restaurants offering various cuisines, all are operated by the Company.
• Mission Interstellar - India’s first space flying experience ride, developed in collaboration with leading US and European theme park design companies. Largest screen and first time in India: 3,500 sq ft parabolic screen with a 4K resolution Laser projector
15
* Includes sale of services, sales of products & other operating income.
Q1 FY19 Q1 FY18 YoY %
Total Revenues (Rs Mn) * 292.4 231.7 26.2%
No of Visitors (In ‘000) 239.5 196.8 21.7%
Avg. Revenue Per Visitor (Rs) 1,220.9 1,177.3 3.7%
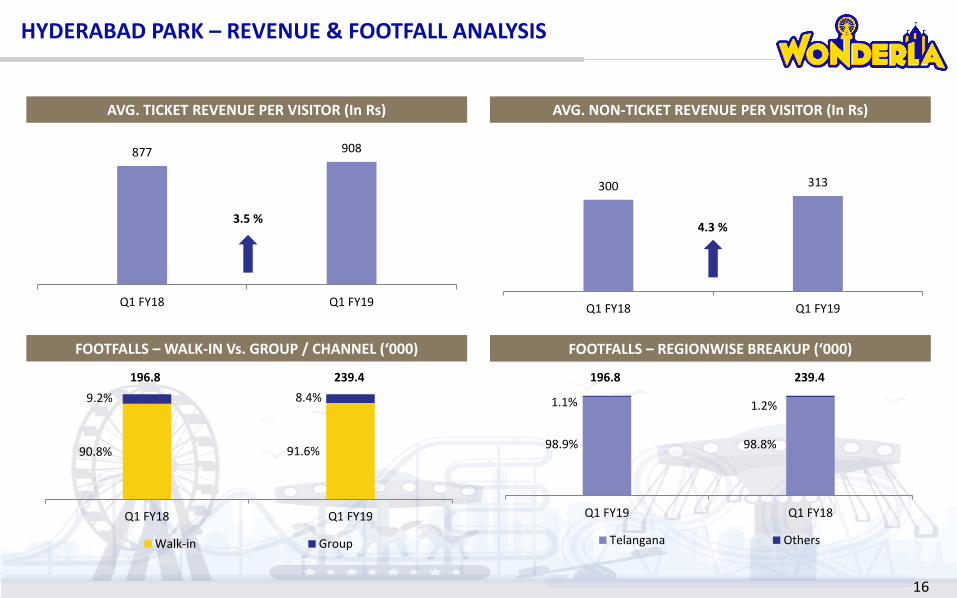
HYDERABAD PARK – REVENUE & FOOTFALL ANALYSIS
16
FOOTFALLS – WALK-IN Vs. GROUP / CHANNEL (‘000) FOOTFALLS – REGIONWISE BREAKUP (‘000)
AVG. TICKET REVENUE PER VISITOR (In Rs)
877 908
Q1 FY18 Q1 FY19
AVG. NON-TICKET REVENUE PER VISITOR (In Rs)
300 313
Q1 FY18 Q1 FY19
90.8% 91.6%
9.2% 8.4%
Q1 FY18 Q1 FY19
Walk-in Group
196.8
98.9% 98.8%
1.1% 1.2%
Q1 FY19 Q1 FY18
Telangana Others
239.4
3.5 %
196.8 239.4
4.3 %

FINANCIALS – P&L STATEMENT
17
Note –Income from services includes income from sale of entry tickets, share of revenue from restaurant sales and income from resort. Income from sale of products includes income from sale of traded goods, packaged food and other merchandise sold within amusement parks
Particulars (Rs Mn) Q1 FY19 Q1 FY18 YoY % FY18
Sale of Services 813.0 827.2 -1.7% 2,109.6
Sale of products 225.8 196.1 15.1% 595.4
Total Revenue from Operations 1,038.8 1,023.3 1.5% 2,704.9
Cost of Materials Consumed 42.0 43.9 -4.4% 124.3
Purchase of Stock-in-Trade 58.3 52.2 11.6% 162.2
Changes in Inventories of Stock-in-trade -1.0 1.2 -184.4% 7.3
Employee Expenses 106.9 113.2 -5.6% 414.2
Other Expenses 257.8 376.2 -31.5% 1,105.8
EBITDA 574.9 436.7 31.7% 891.1
EBITDA Margin % 55.3% 42.7% 1267.1 bps 32.9%
Depreciation 98.9 80.0 23.7% 365.1
Other Income 22.3 30.9 -27.9% 78.5
Finance Cost 3.6 3.7 -2.0% 12.1
PBT 494.6 383.9 28.8% 592.4
Tax Expense 164.9 124.3 32.6% 207.4
PAT 329.7 259.6 27.0% 385.0
PAT Margin % 31.7% 25.4% 637.6 bps 14.2%
Earnings Per Share (EPS) 5.84 4.59 27.2% 6.81
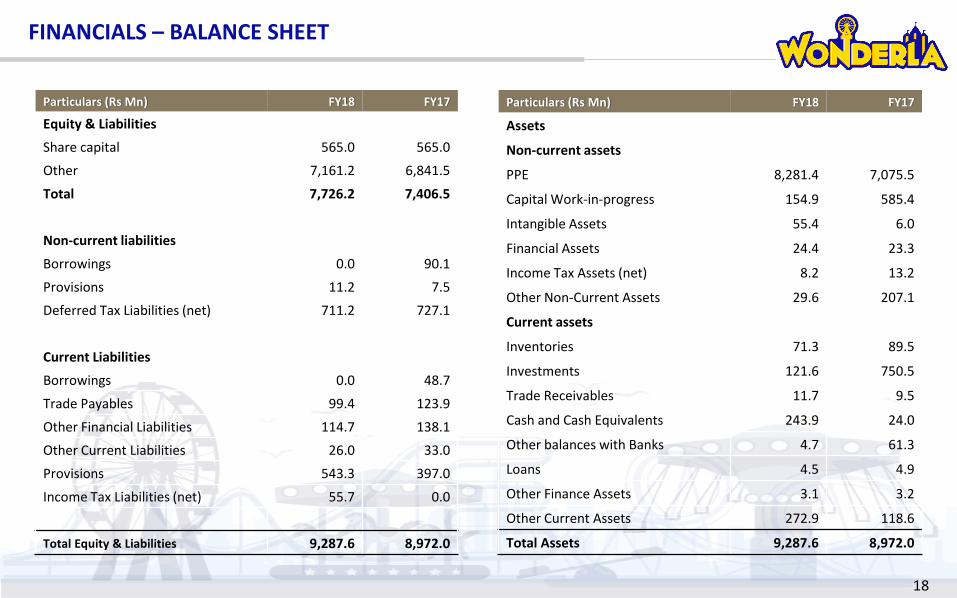
FINANCIALS – BALANCE SHEET
18
Particulars (Rs Mn) FY18 FY17
Equity & Liabilities
Share capital 565.0 565.0
Other 7,161.2 6,841.5
Total 7,726.2 7,406.5
Non-current liabilities
Borrowings 0.0 90.1
Provisions 11.2 7.5
Deferred Tax Liabilities (net) 711.2 727.1
Current Liabilities
Borrowings 0.0 48.7
Trade Payables 99.4 123.9
Other Financial Liabilities 114.7 138.1
Other Current Liabilities 26.0 33.0
Provisions 543.3 397.0
Income Tax Liabilities (net) 55.7 0.0
Total Equity & Liabilities 9,287.6 8,972.0
Particulars (Rs Mn) FY18 FY17
Assets
Non-current assets
PPE 8,281.4 7,075.5
Capital Work-in-progress 154.9 585.4
Intangible Assets 55.4 6.0
Financial Assets 24.4 23.3
Income Tax Assets (net) 8.2 13.2
Other Non-Current Assets 29.6 207.1
Current assets
Inventories 71.3 89.5
Investments 121.6 750.5
Trade Receivables 11.7 9.5
Cash and Cash Equivalents 243.9 24.0
Other balances with Banks 4.7 61.3
Loans 4.5 4.9
Other Finance Assets 3.1 3.2
Other Current Assets 272.9 118.6
Total Assets 9,287.6 8,972.0

COMPANY OVERVIEW – ABOUT US
19
• Own and operate three amusement parks under the brand name Wonderla situated at Kochi, Bangalore andHyderabad and a resort at Bangalore
• The Company and its first two parks have won 27 awards / certifications since inception, including National Awardsfor Excellence from Indian Association of Amusement Parks & Industries in the areas of total number and variety ofrides, most innovative ride, etc
• In-house manufacturing facility located at Kochi which manufactures / constructs rides and attractions for both theparks
• Reduction in GST rates from 28% to 18% effective from 25th January 2018 to reduced inflationary pressure on pricing
OUR PEDIGREE
BUSINESS OVERVIEW
STRONG FINANCIALS
• One of the largest amusement park operators in India with over 16 years of successful operations. Management hasoperational experience in the amusement park industry for over a decade
• The promoters launched the first amusement park in 2000 in Kochi under the name Veegaland and later successfullylaunched the second park in Bangalore in 2005 and third park in Hyderabad in 2016 under the name “Wonderla”
• Promoted by Mr. Kochouseph Chittilappilly and Mr. Arun Chittilappilly – Mr. Kochouseph Chittilappilly alsoincorporated V-Guard Industries Ltd., a publicly listed company since 2008
• Consolidated Revenues, EBITDA and PAT were Rs. 2,704.9 mn, Rs 891.1 mn and Rs 385.0 mn in FY18.
• All Business Units- Parks and Resorts are generating positive cash flows from operations.
• Robust balance sheet with zero Debt as of FY18.
• The Company has acquired 61.87 acres of land in Chennai for the new Amusement Park project.
• Construction is expected to commence once the representation given to Tamil Nadu State Government on the localbody tax is considered favourably.
NEW PROJECT
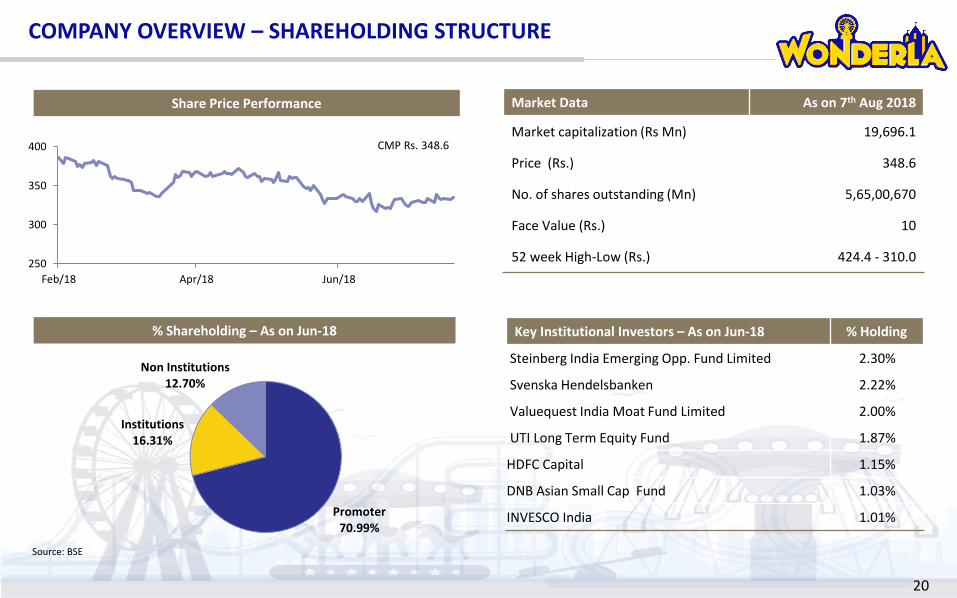
COMPANY OVERVIEW – SHAREHOLDING STRUCTURE
20
Market Data As on 7th Aug 2018
Market capitalization (Rs Mn) 19,696.1
Price (Rs.) 348.6
No. of shares outstanding (Mn) 5,65,00,670
Face Value (Rs.) 10
52 week High-Low (Rs.) 424.4 - 310.0
% Shareholding – As on Jun-18
Promoter70.99%
Institutions16.31%
Non Institutions12.70%
Source: BSE
Key Institutional Investors – As on Jun-18 % Holding
Steinberg India Emerging Opp. Fund Limited 2.30%
Svenska Hendelsbanken 2.22%
Valuequest India Moat Fund Limited 2.00%
UTI Long Term Equity Fund 1.87%
HDFC Capital 1.15%
DNB Asian Small Cap Fund 1.03%
INVESCO India 1.01%
CMP Rs. 348.6
Share Price Performance
250
300
350
400
Feb/18 Apr/18 Jun/18

21
COMPANY OVERVIEW – BOARD OF DIRECTORS & MANAGEMENT TEAM
KOCHOUSEPH CHITTILAPPILLYPROMOTER ANDEXECUTIVE VICE CHAIRMAN
• 18 yrs in the industry
• Founded V-Guard Industries Ltd., a publicly listed company since 2008 and is currently its Chairman
• Post Graduate Degree in Physics
ARUN KOCHOUSEPH CHITTILAPPILLYPROMOTER ANDNON EXECUTIVE DIRECTOR
• 13+ yrs in the industry
• Holds a masters degree in industrial engineering
• Actively involved in day-to-day operations and management of Wonderla since 2003
GEORGE JOSEPHJOINT MANAGING DIRECTOR
• 38+ yrs of total work experience
• Director in MuthootFinance Ltd.
GOPAL SRINIVASANINDEPENDENT DIRECTOR
• 25+ yrs of work experience
• Chairman of TVS Capital Funds & Independent Director in TVS & Sons Limited.
PRIYA SARAH CHEERANJOSEPHEXECUTIVE DIRECTOR
• 13+ yrs in the Industry
• Involved in F&B Operations and HR department of Wonderlasince 2005
SIVADAS M.PRESIDENT –OPERATIONS
• 27 yrs of experience
• Bachelor’s Degree in Physics
AJIKRISHNAN A. G.VP – PROJECTS
• 18 yrs of experience
• B.E, MBA
MAHESH M.B.AVP –COMMERCIAL
• 21 yrs of experience
• MBA in International Business
NANDAKUMAR NCHIEF FINANCIAL OFFICER (CFO)
• 22 yrs of experience. ACMA, ACS & BGL
• Prior experience with large corporates like Raymond, Ashok Leyland, Lucas – TVS and MNC’s like Coke, Levi Strauss
R LAKSHMINARAYANANINDEPENDENT DIRECTOR
• 10+ yrs of work experience in Retail
• Independent Director in Jyothi Laboratories Limited
M RAMACHANDRAN CHAIRMAN & INDEPENDENT DIRECTOR
• 43+ years of work experience
• Served as partner for 20 years with audit firm Deloitte Haskins & Sells LLP
• Member of ICAI & ICSI
22
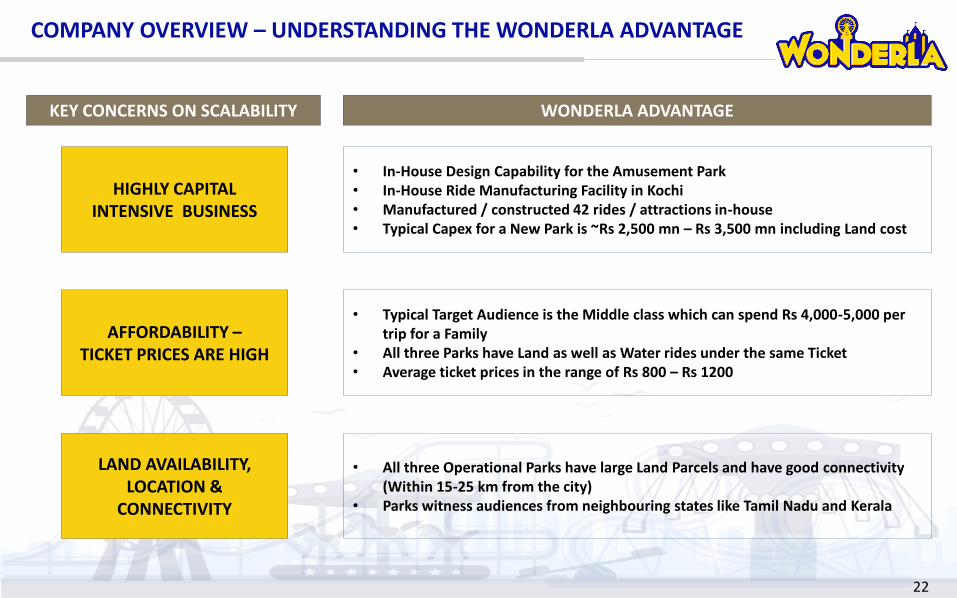
COMPANY OVERVIEW – UNDERSTANDING THE WONDERLA ADVANTAGE
HIGHLY CAPITAL INTENSIVE BUSINESS
AFFORDABILITY –TICKET PRICES ARE HIGH
LAND AVAILABILITY, LOCATION &
CONNECTIVITY
KEY CONCERNS ON SCALABILITY WONDERLA ADVANTAGE
• In-House Design Capability for the Amusement Park• In-House Ride Manufacturing Facility in Kochi• Manufactured / constructed 42 rides / attractions in-house• Typical Capex for a New Park is ~Rs 2,500 mn – Rs 3,500 mn including Land cost
• Typical Target Audience is the Middle class which can spend Rs 4,000-5,000 per trip for a Family
• All three Parks have Land as well as Water rides under the same Ticket• Average ticket prices in the range of Rs 800 – Rs 1200
• All three Operational Parks have large Land Parcels and have good connectivity (Within 15-25 km from the city)
• Parks witness audiences from neighbouring states like Tamil Nadu and Kerala

COMPANY OVERVIEW – SUSTAINABLE COMPETITIVE ADVANTAGES
23
OVER A DECADE OF OPERATIONALEXPERIENCE AND BRAND EQUITY
• 18+ yrs of successful operations of the parks has built significant brand equity
• Mr. Kochouseph and Mr. Arun have over 18 yrs and 13+ yrs of experience respectively in amusement park industry
• Won several awards, including ‘best tourism destination’ and ‘highest number and variety of innovative rides’
PROXIMITY TO CITY WITH AMPLE LAND AVAILABLE FOR FUTURE DEVELOPMENT
• Owns 93.17 acres in Kochi, 81.75 acres in Bangalore and 49.50 acres in Hyderabad, within which further expansion of existing parks can be undertaken
• All the three parks - Kochi, Bangalore and Hyderabad - are situated in the proximity of the main city.
IN-HOUSE MANUFACTURING FACILITYAT WONDERLA KOCHI
• Benefits from certain cost efficiencies and improves maintenance efficiency of rides
• Enables customisation and modification of rides purchased
• Manufactured / constructed 42 rides / attractions in-house
STRONG CUSTOMER INSIGHTS -CONSTANTLY INNOVATING NEW
ATTRACTIONS
• In-depth understanding of customer preference and needs helps while conceptualising new rides
• Won the IAAPI excellence award for the highest number and variety of innovative rides four times
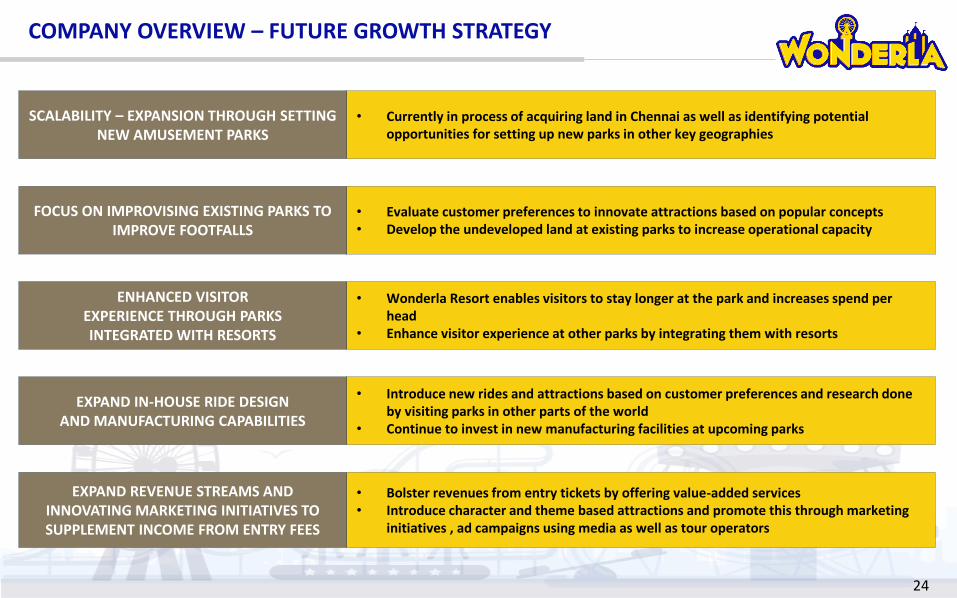
COMPANY OVERVIEW – FUTURE GROWTH STRATEGY
24
SCALABILITY – EXPANSION THROUGH SETTING NEW AMUSEMENT PARKS
• Currently in process of acquiring land in Chennai as well as identifying potential opportunities for setting up new parks in other key geographies
FOCUS ON IMPROVISING EXISTING PARKS TO IMPROVE FOOTFALLS
• Evaluate customer preferences to innovate attractions based on popular concepts• Develop the undeveloped land at existing parks to increase operational capacity
ENHANCED VISITOREXPERIENCE THROUGH PARKSINTEGRATED WITH RESORTS
• Wonderla Resort enables visitors to stay longer at the park and increases spend per head
• Enhance visitor experience at other parks by integrating them with resorts
EXPAND IN-HOUSE RIDE DESIGNAND MANUFACTURING CAPABILITIES
• Introduce new rides and attractions based on customer preferences and research done by visiting parks in other parts of the world
• Continue to invest in new manufacturing facilities at upcoming parks
EXPAND REVENUE STREAMS ANDINNOVATING MARKETING INITIATIVES TOSUPPLEMENT INCOME FROM ENTRY FEES
• Bolster revenues from entry tickets by offering value-added services• Introduce character and theme based attractions and promote this through marketing
initiatives , ad campaigns using media as well as tour operators

COMPANY OVERVIEW – GLOBAL RANKING AND RECOGNITION
Wonderla parks in Bangalore, Kochi and Hyderabad
were ranked at #2, #3 and #8 in India by Tripadvisor
Wonderla Bangalore ranked 7th Best and Wonderla
Kochi ranked 11th Best in Asia.
25
DISCLAIMER
26
This presentation and the following discussion may contain “forward looking statements” by Wonderla Holidays Limited
(“Wonderla” or the Company) that are not historical in nature. These forward looking statements, which may include statements
relating to future results of operations, financial condition, business prospects, plans and objectives, are based on the current
beliefs, assumptions, expectations, estimates, and projections of the management of Wonderla about the business, industry and
markets in which Wonderla operates.
These statements are not guarantees of future performance, and are subject to known and unknown risks, uncertainties, and other
factors, some of which are beyond Wonderla’s control and difficult to predict, that could cause actual results, performance or
achievements to differ materially from those in the forward looking statements. Such statements are not, and should not be
construed, as a representation as to future performance or achievements of Wonderla.
In particular, such statements should not be regarded as a projection of future performance of Wonderla. It should be noted that
the actual performance or achievements of Wonderla may vary significantly from such statements.

FOR FURTHER QUERIES -
27
Mr. Nandakumar NCFOEmail – [email protected]
Nilesh Dalvi / Nachiket KaleIR ConsultantDickenson Seagull IR Contact No : +91 9819289131 / 9920940808Email – [email protected]


