23
Q1’2015 RESULTS PRESENTATION 6 May 2015
| Date post: | 26-May-2018 |
| Category: |
Documents |
| Upload: | duongkhuong |
| View: | 213 times |
| Download: | 0 times |
Q1’2015 RESULTS PRESENTATION
6 May 2015

EURONEXT PRESENTING TEAM
2
Jos Dijsselhof
Interim Chief Executive
Officer &
Chief Operating Officer
Amaury Dauge
Group Chief Financial
Officer
Lee Hodgkinson
Head of Markets &
Global Sales
CEO of Euronext London

EXECUTIVE SUMMARY
1Strong financial performance in Q1’2015
2Strategy is on track
4Medium term objectives will be delivered
3
� Increase in third party revenue by +9.6% (adjusted)� Substantial reduction in operational expenses: -8.8% (adjusted)� Quarterly EBITDA margin of 52.2% underpinned by favorable economic
conditions and ECB quantitative easing� €43.6m of cumulated efficiencies achieved on an accrual basis
� Euronext ambition to position the Group as the leading financing centre in continental Europe is fully on track
� The strategy is fully aligned with this ambition� The business profile is being remixed and the cost structure adapted
� Revenue growth of 5% CAGR over the period 2013 – 2016� Efficiencies announced (€60 million by the end of H1 2015 on a run-rate basis
- €80 million by the end of 2016 on a run-rate basis) to be delivered� EBITDA margin to stand close to 53% by the end of 2016.
3 Management continuity
� Interim CEO appointed� Commitment remains to deliver on strategy� Process to appoint new CEO has begun

A STRONG AND HIGHLY DIVERSIFIED COMPANY
4
Q1 2015 Third party
revenues by product1
€130m
Cash trading
40%
Market data & indices
19%
Listing
12%
Derivatives
trading
9%
Market
solutions
& other
7%
Settlement
& Custody
4%
Clearing
9%
Source: TAG Audit. All figures based on Q1’2015 results. Above revenues are for 3rd-parties revenues only. Revenues shown in pie charts excluding €0.8m of other income.1 The revenues are not audited. They may not be indicative of future revenues2 These flows are across a variety of clients; 3 Both legs of the transaction are counted (double counted)
46%
21%
15%
8%
4% 2% 4%
Multi-type2
HFT
Institutional
Agency Broker
Own Account
Retail
Other
32%
10%
15% 9%
24%
2% 8%
Cash trading3
Derivatives trading3
Client flow (ADV as of
31/03/2015)
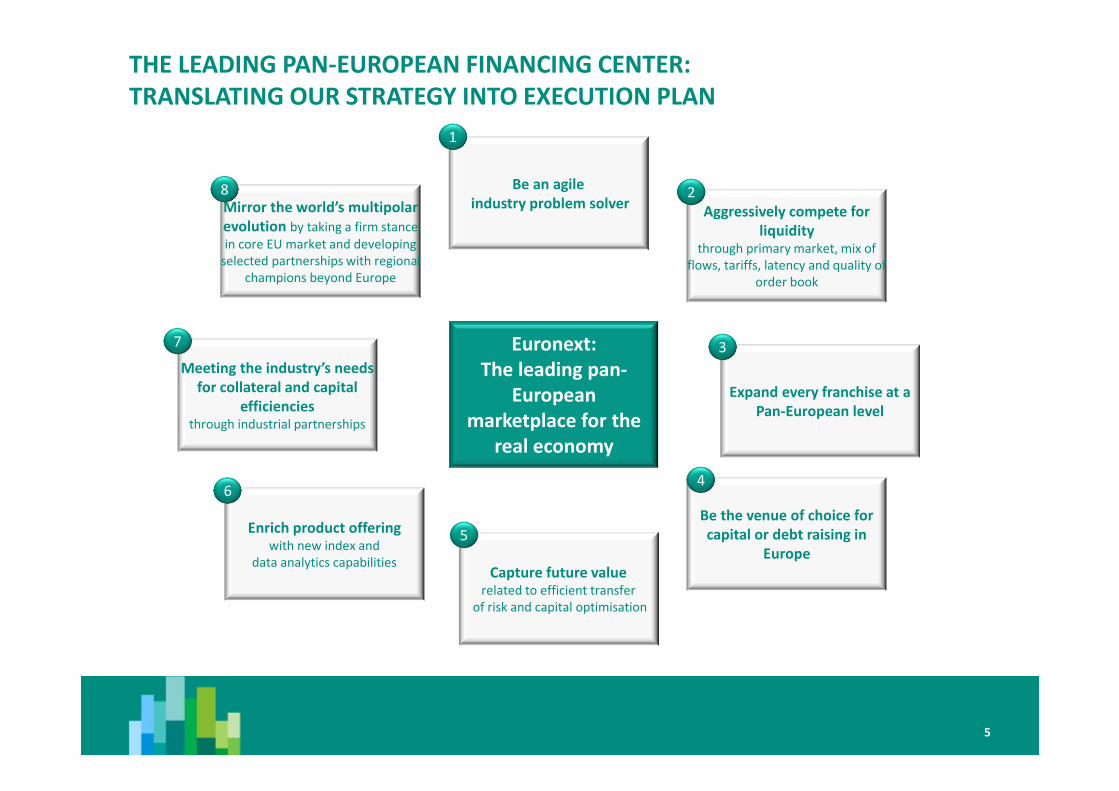
THE LEADING PAN-EUROPEAN FINANCING CENTER:
TRANSLATING OUR STRATEGY INTO EXECUTION PLAN
5
Euronext:
The leading pan-
European
marketplace for the
real economy
Mirror the world’s multipolar
evolution by taking a firm stance
in core EU market and developing
selected partnerships with regional
champions beyond Europe
Be an agile
industry problem solverAggressively compete for
liquidity through primary market, mix of
flows, tariffs, latency and quality of
order book
Expand every franchise at a
Pan-European level
Enrich product offering with new index and
data analytics capabilitiesCapture future value
related to efficient transfer
of risk and capital optimisation
Be the venue of choice for
capital or debt raising in
Europe
Meeting the industry’s needs
for collateral and capital
efficienciesthrough industrial partnerships
8
1
2
3
4
5
6
7
5

II EURONEXT BUSINESS OVERVIEW

LISTING: MOMENTUM CONTINUES FROM A SUCCESSFUL 2014
4
102
4
Q1'2014 Q1'2015
Q1’2015 Listing Activity
Large Cap
SME
7.5 8.0
1.4 3.0
2.8
2.91.9
1.4
Q1'2014 Q1'2015
Q1’ 2015 Listing Revenue (in €m)
Other
IPOs
Follow on
Fixed fees
� Strong increase in listing revenue: +12.6%, to €15.3 million
� Sustained secondary market activity: €40 billion of equity and bond raised in Q1’2015 (vs €24.2 billion in Q1’2014)
� Ongoing healthy IPO market: three of the six largest IPOs in Europe were on our markets (GrandVision and Refresco in Amsterdam – Elis in Paris) – Cnova dual-listing adding €3 billion in market cap
� Impressive secondary equity issuance among Large Caps Issuers (€8.7 billion, o/w Banco Santander €7.3 billion)
� Ongoing expansion of our footprint in the issuing of RMB denominated bonds (CADES: RMB 3 billion, BNP: RMB 1.5 billion, BPCE: RMS 750 million)
� New successful quarter for Enternext: 10 IPOs against 4 in Q1’2014, €2.4 billion raised across primary and secondary offerings, more than twice the Q1’2014 level
7
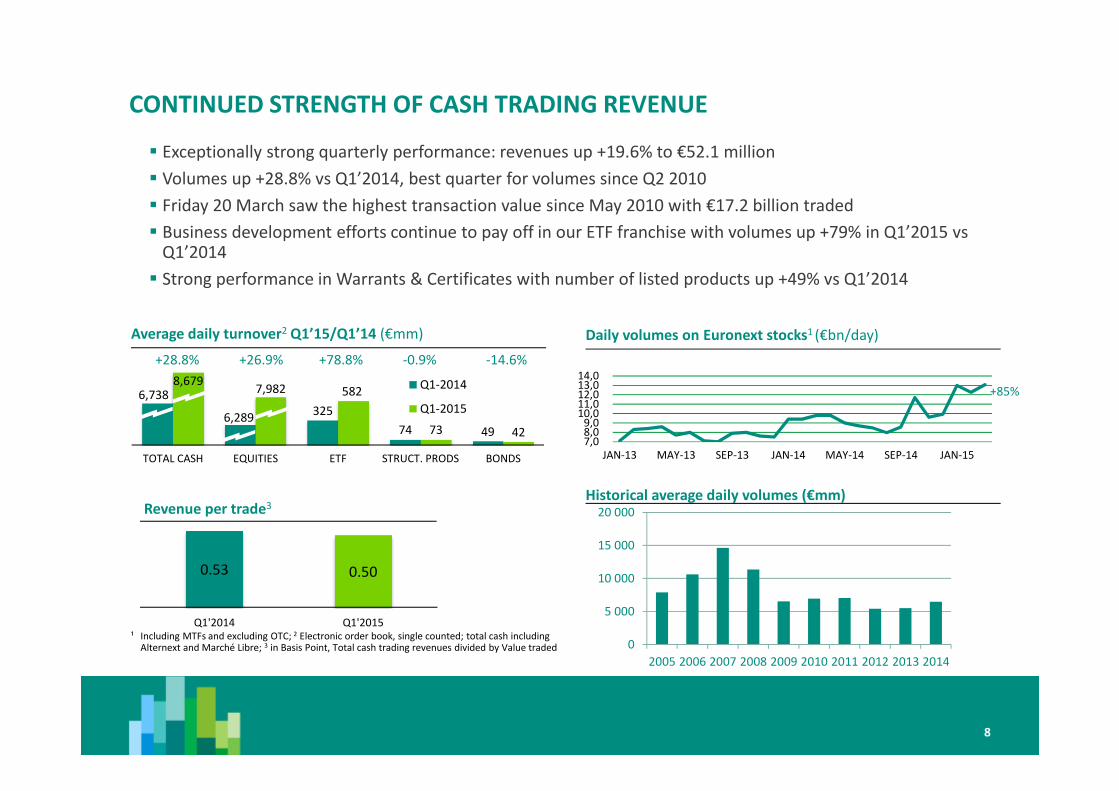
CONTINUED STRENGTH OF CASH TRADING REVENUE
¹ Including MTFs and excluding OTC; 2 Electronic order book, single counted; total cash including Alternext and Marché Libre; 3 in Basis Point, Total cash trading revenues divided by Value traded
Historical average daily volumes (€mm)
� Exceptionally strong quarterly performance: revenues up +19.6% to €52.1 million
� Volumes up +28.8% vs Q1’2014, best quarter for volumes since Q2 2010
� Friday 20 March saw the highest transaction value since May 2010 with €17.2 billion traded
� Business development efforts continue to pay off in our ETF franchise with volumes up +79% in Q1’2015 vs Q1’2014
� Strong performance in Warrants & Certificates with number of listed products up +49% vs Q1’2014
0
5 000
10 000
15 000
20 000
2005 2006 2007 2008 2009 2010 2011 2012 2013 2014
+85%
Average daily turnover2 Q1’15/Q1’14 (€mm)
6,738
6,289 325
74 49
8,679 7,982 582
73 42
TOTAL CASH EQUITIES ETF STRUCT. PRODS BONDS
Q1-2014
Q1-2015
+28.8% +26.9% +78.8% -0.9% -14.6%
Daily volumes on Euronext stocks1 (€bn/day)
8
7,08,09,0
10,011,012,013,014,0
JAN-13 MAY-13 SEP-13 JAN-14 MAY-14 SEP-14 JAN-15
0.53 0.50
Q1'2014 Q1'2015
Revenue per trade3

DERIVATIVES PERFORMING INLINE WITH PEERS AMID LOWER VOLATILITY
¹ Total derivatives trading revenues divided by total derivatives number of contracts traded
Average daily volume Q1’14/Q1’15 (‘000)
614291
199
74 51
550 245
193
61 50
TTL DERIVS. EQUITY OPTS INDEX FUTURES INDEX OPTS COMMODITIES
Q1 2014
Q1 2015
-10.4% -15.7% -3% -17% -1%
Euronext – number of contracts traded (lots in mm)
40 3734 34
39 32 34 39 35
Q1'13 Q2'13 Q3'13 Q4'13 Q1'14 Q2'14 Q3'14 Q4'14 Q1'15
� Revenues down 11.3% to €11.2 million due to
� The dampening effects of low volatility in February and March
� Competition in the Dutch individual equity option business
� Volumes on index products decreased by 7%, individual equity derivatives decreased by 15% and commodities decreased by 1%
� In commodities:
� The New Market Participant programme saw 319,000 lots in March (16,5% of overall volume) from 280 registered traders
� A number of initiatives were launched: superior quality spec for milling wheat, revamping of our barley offering, signing of a license agreement with Johannesburg Stock Exchange for milling wheat, dairy going live
9
0,33 0,32
Q1'2014 Q1'2015
Revenue per lot1

MARKET DATA & INDICES POST STRONG GROWTH
� Quarterly revenue up +12.3% vs Q1’2014, to €24.6 million
� Price increase in Level 2 Data effective 1st January 2015, reflecting the investment made in systems and networks to reduce the latency of the depth or order book data
� Index business goes from strength to strength
� 40% increase in issuance of structured products.
� Enterprise deal with Deutsche Bank for leveraged products on the CAC 40, following Goldman in Q4 2014
� 18 one-off index licence agreements for baskets products including the CAC 40 with Leonteq.
10

POST TRADE & MARKET SOLUTIONS ACTIVITIES
Clearing
� Revenues were down -6.3%, to €11.7 million
� Decrease in derivatives volumes impacted clearing revenues in a lesser extent thanks to volumes mix
Settlement & Custody
� A 6% decrease in assets under custody still resulting from the overall reduction of securities market value in Portugal impacted the revenues, down by 9.3% to €5 million.
� Focus will be on three specific topics:
� Ongoing close work with LCH.Clearnet SA to expand our commodity and financial derivatives franchises through strong product innovation;
� Implementation of a suite of pre-trade risk management and collateral optimisation services to help clients better manage their intraday exposures;
� Rigorous focus on Interbolsa’s development plan for TARGET2-Securities (T2S) to be maintained, ensuring the readiness of our CSD for its migration in 2016.
Market solutions
� Revenues were up +4.3% vs Q1’2014, to €9.3 million
� Growth was driven primarily by ongoing service fees derived from Hosted Commercial markets & completion of project work
� Q1 ’15 SFTI / Colo included a one off adjustment offsetting partially the impact of change in accounting methodology
� Ongoing work on aligning Euronext UTP and NSC clients with the Euronext technology roadmap.
� Beginning of a partnering programme with specialist application providers. The first of these enables us to integrate our Euronext UTP solution with a third-party post-trade application to offer an end-to-end solution for new exchange clients.
� In Q1 we began a marketing initiative to introduce Euronext Market Solutions to potential new clients around the world.
12,5
5,6
11,7
5,0
CLEARING (ADJUSTED) SETTLEMENT & CUSTODY
Q1'2014
Q1'2015
11
2,22,6
4,1
2,82,4
4,1
SOLUTIONS SFTI COLO CONNECTION FEES & OTHER
Q1'2014
Q1'2015

QE DRIVING POSITIVE VOLUME DYNAMICS
12
1,12,4 2,6
1,4
1
7,1
0
2
4
6
8
10
12
0
5
10
15
20
25
30
Q1 2012 Q1 2013 Q1 2014 Q1 2015
Capital Raised (€ bn) - Euronext
Capital Raised (€ bn) - Rest Eurozone
Number of deal - Rest Eurozone
Number of deals Euronext
Eurozone IPO Market - Number of deals and capital raised
Source: EPFR, Jefferies, BAML, Dealogic
Western Europe Equity Funds Flows
Western Europe Bond Funds
� Record European equity inflows continue
� More than US$ 54bn added in equities in the first 14 weeks of
2015 – strongest Q1 on record
� If this pace continues, European equities could see >US$
200bn of inflows in 2015
� Eurozone IPO market continues strong momentum
� Euronext volume in Q1 +29% compared to Q1 2014
� €2.6 billion raised in 14 new listings, high success of Enternext
III FINANCIALS

FINANCIAL HIGHLIGHTS
14
€140m of term loan have been
repaid / Undrawn RCF has been
increased with the same amount
in March 2015
Appeal on capital requirements
lodged at the District Court of
Rotterdam on 31 March 2015
Upcoming €0.84 dividend
payment:
� Ex date: 11 May
� Record date: 12 May
� Payment date: 13 May
THIRD PARTY
REVENUE
€130m
+9.6% (adjusted*)
€43.6mof
cumulated
efficiencies (accrual basis)
OPERATING
EXPENSES
ex. D&A
€62.2m
-8.8% (adjusted*)
Quarterly
EBITDA
MARGIN
52.2%
NET PROFIT
€48.0m
x6
CASH
POSITION
€162m by 31st
March 2015
EARNING
PER SHARE
€0.69(basic)
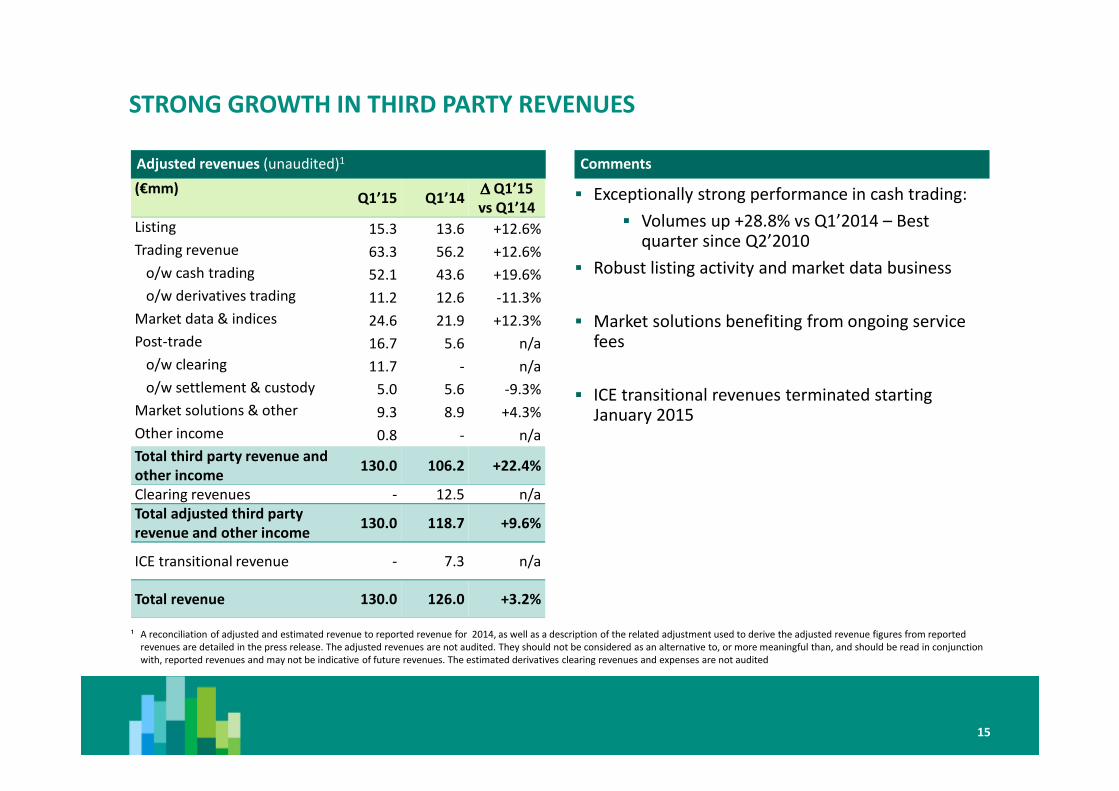
� Exceptionally strong performance in cash trading:
� Volumes up +28.8% vs Q1’2014 – Best quarter since Q2’2010
� Robust listing activity and market data business
� Market solutions benefiting from ongoing service fees
� ICE transitional revenues terminated starting January 2015
STRONG GROWTH IN THIRD PARTY REVENUES
(€mm)Q1’15 Q1’14
∆∆∆∆ Q1’15
vs Q1’14
Listing 15.3 13.6 +12.6%
Trading revenue 63.3 56.2 +12.6%
o/w cash trading 52.1 43.6 +19.6%
o/w derivatives trading 11.2 12.6 -11.3%
Market data & indices 24.6 21.9 +12.3%
Post-trade 16.7 5.6 n/a
o/w clearing 11.7 - n/a
o/w settlement & custody 5.0 5.6 -9.3%
Market solutions & other 9.3 8.9 +4.3%
Other income 0.8 - n/a
Total third party revenue and
other income130.0 106.2 +22.4%
Clearing revenues - 12.5 n/a
Total adjusted third party
revenue and other income130.0 118.7 +9.6%
ICE transitional revenue - 7.3 n/a
Total revenue 130.0 126.0 +3.2%
Adjusted revenues (unaudited)1
¹ A reconciliation of adjusted and estimated revenue to reported revenue for 2014, as well as a description of the related adjustment used to derive the adjusted revenue figures from reported
revenues are detailed in the press release. The adjusted revenues are not audited. They should not be considered as an alternative to, or more meaningful than, and should be read in conjunction
with, reported revenues and may not be indicative of future revenues. The estimated derivatives clearing revenues and expenses are not audited
Comments
15

SUBSTANTIAL REDUCTION IN OPERATING EXPENSES
16
Adjusted Operating expenses (unaudited)1
� Decrease in all costs items:
� Staff costs and professional services benefited from the decrease in IT headcount during the course of 2014
� System and communications and professional services were reduced following the end of most of the SLAs with ICE
� Accommodation costs benefited from the end of CBH
� Depreciation & amortisation are stable
Comments
(€mm)Q1’15 Q1’14
∆∆∆∆Q1’15
vs Q1’14
Salaries and employee benefits (28.7) (31.4) -8.6%
System and communications (4.9) (5.7) -13.4%
Professional services (10.7) (12.5) -15.2%
Clearing expenses (6.7) - n/a
Accommodation (5.0) (4.9) +1.1%
Other expenses (6.3) (6.9) -8.6%
Total operational expenses
(excl. D&A)(62.2) (61.4) +1.4%
Depreciation and amortisation (4.6) (4.7) -3.6%
Clearing expenses - (6.9) n/a
Total adjusted operational expenses (66.8) (73.0) -8.5%
¹ A reconciliation of adjusted and estimated revenue to reported revenue for the 2014, as well as a description of the related adjustment used to derive the adjusted revenue figures from reported
revenues are detailed in the press release. The adjusted revenues are not audited. They should not be considered as an alternative to, or more meaningful than, and should be read in conjunction
with, reported revenues and may not be indicative of future revenues. The estimated derivatives clearing revenues and expenses are not audited

SIMPLIFIED INCOME STATEMENT
17
Income statement (unaudited)
(€mm) Q1’15 Q1’14
EBITDA 67.8 52.1
Margin 52.2% 45.9%
Depreciation and amortisation (4.6) (4.7)
Total expenses (66.8) (66.1)
Operating profit (before exceptional items) 63.3 47.4
Margin 48.6% 41.8%
Exceptional items 6.3 (12.2)
Operating profit 69.6 35.3
Net financing income/(expense) (2.1) (1.3)
Results from equity investments and other
income- 0.2
Profit before income tax 67.4 34.2
Income tax expense (19.4) (26.6)
Tax rate 28.7% 77.7%
Profit for the quarter 48.0 7.6
Comments
� EBITDA margin of 52.2% benefited from exceptional market conditions in cash trading
� Exceptional items are positive for Q1 2015, mainly due to:
� Restructuring costs of €7.4 million
� Offset by a reversal of provision of €14.7 million linked to the positive outcome of the negotiation with the landlord on CBH
� Increase in net financing expense due to the one-off cost of the debt partial reimbursement end of March
� Income tax of 28.7% in Q1 2015 was positively impacted by the release of the provision created in 2014 in conjunction with CBH
� Tax rate in Q1 2014 was impacted by some one-off items
� Q1 2015 EPS of €0.69 basic & €0.68 diluted) vs €0.11 (basic) in Q1 2014
BALANCE SHEET
18
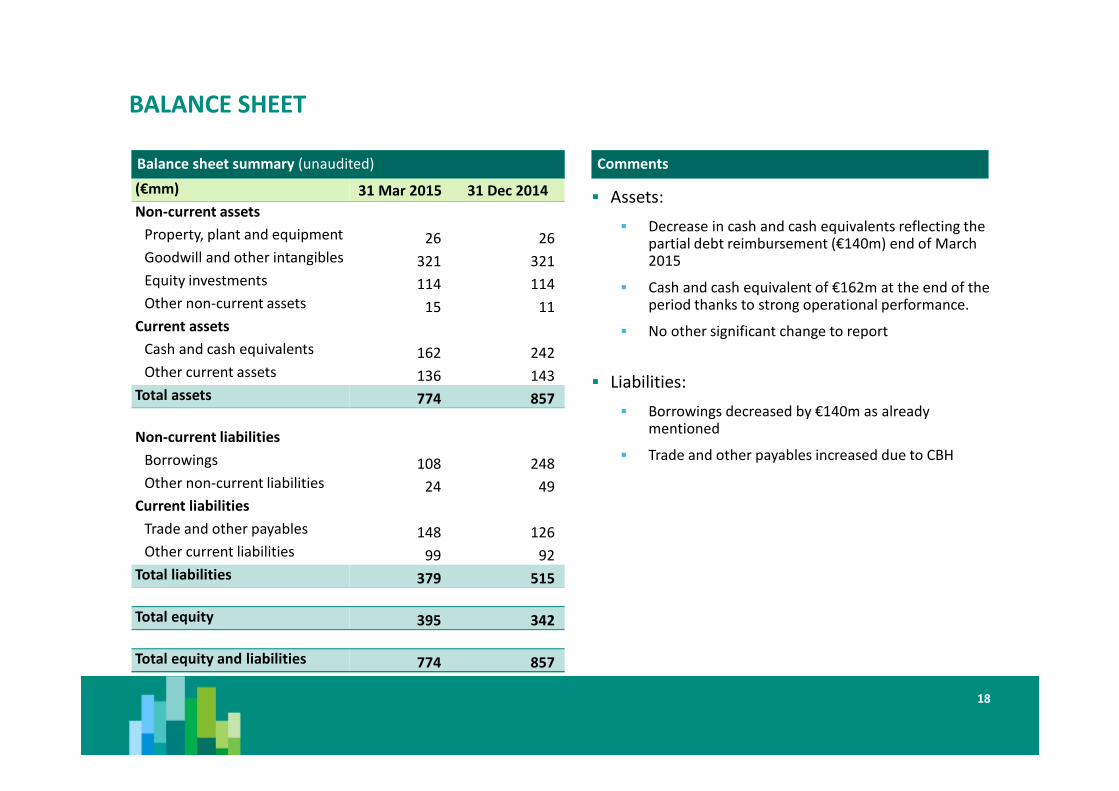
(€mm) 31 Mar 2015 31 Dec 2014
Non-current assets
Property, plant and equipment 26 26
Goodwill and other intangibles 321 321
Equity investments 114 114
Other non-current assets 15 11
Current assets
Cash and cash equivalents 162 242
Other current assets 136 143
Total assets 774 857
Non-current liabilities
Borrowings 108 248
Other non-current liabilities 24 49
Current liabilities
Trade and other payables 148 126
Other current liabilities 99 92
Total liabilities 379 515
Total equity 395 342
Total equity and liabilities 774 857
Balance sheet summary (unaudited)
� Assets:
� Decrease in cash and cash equivalents reflecting the partial debt reimbursement (€140m) end of March 2015
� Cash and cash equivalent of €162m at the end of the period thanks to strong operational performance.
� No other significant change to report
� Liabilities:
� Borrowings decreased by €140m as already mentioned
� Trade and other payables increased due to CBH
Comments

REPORTED CASH FLOW STATEMENT
19
(€mm) Q1’15 Q1’14
Net cash provided by/(used in) operating activities 51.1 28.3
Net cash provided by/(used in) investing activities 5.9 (4.5)
o/w capital expenditures (4.1) (4.7)
Net cash provided by/(used in) financing activities (142.0) (43.2)
Net increase/(decrease) in cash and cash equivalents (79.6) (19.3)
Cash and cash equivalents – beginning of period 241.6 80.8
Cash and cash equivalents – end of period 162.0 61.5
Cash flow statement (unaudited)
� Operating cash-flow
- Higher profit before tax
- Negative impact of the decrease in working capital, mainly due to the release of CBH provision
� Investing cash flow
- Net purchase of Financial investments increased with €10 million, due to return of two short term deposits
amounting of €5.0 million each
� Financing cash flow
- Partial repayment of Term Loan including transaction costs

CONCLUSION
20
� Euronext’s strategy on track
� Revenue growth on target
� Cost reduction on target
� Mid-term objectives will be
delivered
2015
Q1 Q2 Q3 Q4 Q1
+8.2% +5.2% +10.3% +12.0% +9.6%
+9.6%
€60m by end of H1'15
(run rate)
€80m by end of 2016
(run rate)
45.9% 46.3% 44.1% 46.7% 52.2% Close to 53%
52.2%
Cumulated
restructuring
expenses
€12m €20m €26m €45m €38m ~€90m
€43.6m
EBITDA margin45.8%
2014 Mid term objectives 2013 -
2016
Third party revenue
growth (adjusted)+5% CAGR
+9.0%
Cumulated
optimisation &
efficiencies
€15m €22m €29m €38m

APPENDIX
LEADING CASH EQUITIES TRADING VENUE AND ESTABLISHED DERIVATIVES
PLATFORM CREATING UNRIVALLED DEPTH AND LIQUIDITY
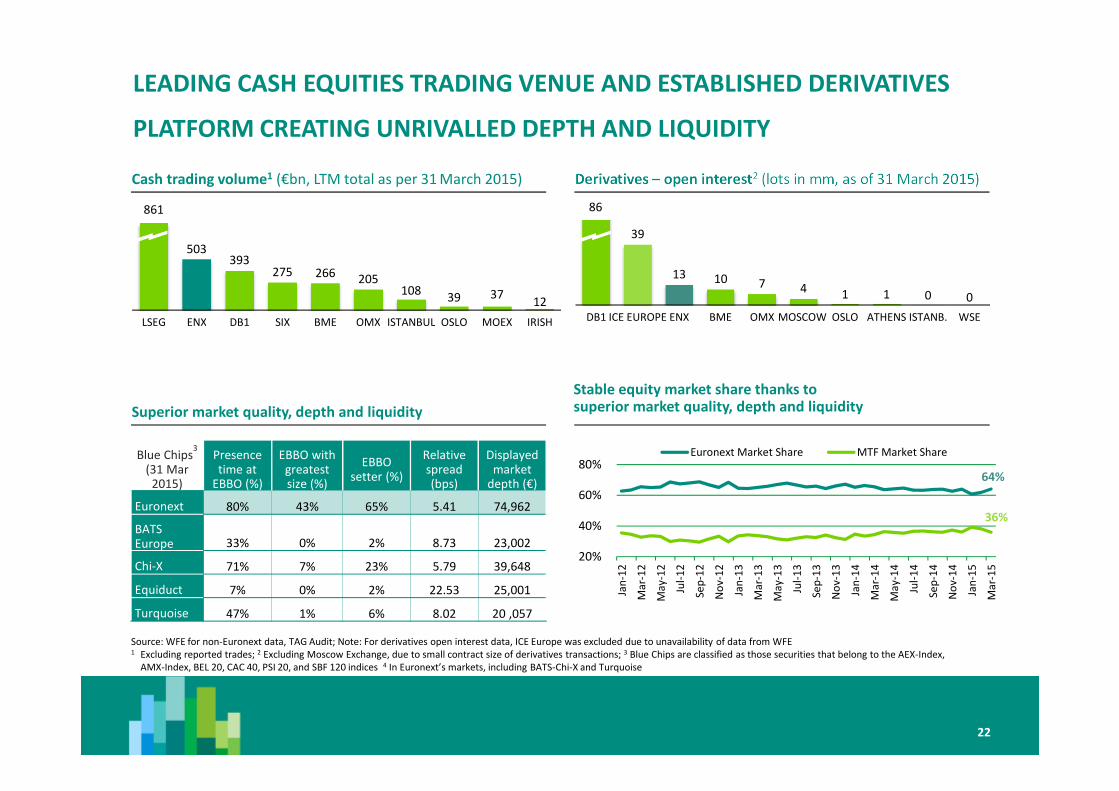
Source: WFE for non-Euronext data, TAG Audit; Note: For derivatives open interest data, ICE Europe was excluded due to unavailability of data from WFE 1 Excluding reported trades; 2 Excluding Moscow Exchange, due to small contract size of derivatives transactions; 3 Blue Chips are classified as those securities that belong to the AEX-Index,
AMX-Index, BEL 20, CAC 40, PSI 20, and SBF 120 indices 4 In Euronext’s markets, including BATS-Chi-X and Turquoise
Blue Chips3
(31 Mar 2015)
Presence time at
EBBO (%)
EBBO with greatest size (%)
EBBO setter (%)
Relative spread (bps)
Displayed market
depth (€)
Euronext 80% 43% 65% 5.41 74,962
BATS Europe 33% 0% 2% 8.73 23,002
Chi-X 71% 7% 23% 5.79 39,648
Equiduct 7% 0% 2% 22.53 25,001
Turquoise 47% 1% 6% 8.02 20 ,057
Cash trading volume1 (€bn, LTM total as per 31 March 2015)
861
503 393
275 266 205 108
39 37 12
LSEG ENX DB1 SIX BME OMX ISTANBUL OSLO MOEX IRISH
Mil
lio
ns
Derivatives – open interest2 (lots in mm, as of 31 March 2015)
39
13 10 7 4 1 1 0 0
DB1 ICE EUROPE ENX BME OMX MOSCOW OSLO ATHENS ISTANB. WSE
Mil
lio
ns
Superior market quality, depth and liquidity
Stable equity market share thanks to superior market quality, depth and liquidity
20%
40%
60%
80%
Jan
-12
Ma
r-1
2
Ma
y-1
2
Jul-
12
Sep
-12
No
v-1
2
Jan
-13
Ma
r-1
3
Ma
y-1
3
Jul-
13
Sep
-13
No
v-1
3
Jan
-14
Ma
r-1
4
Ma
y-1
4
Jul-
14
Sep
-14
No
v-1
4
Jan
-15
Ma
r-1
5
Euronext Market Share MTF Market Share
86
64%
36%
22
DISCLAIMER
23
This presentation is for information purposes only and is not a recommendation to engage in investment activities. The information and materials contained in this
presentation are provided ‘as is’ and Euronext does not warrant the accuracy, adequacy or completeness of the information and materials and expressly disclaims
liability for any errors or omissions. This presentation is not intended to be, and shall not constitute in any way a binding or legal agreement, or impose any legal
obligation on Euronext. All proprietary rights and interest in or connected with this publication shall vest in Euronext. No part of it may be redistributed or reproduced
without the prior written permission of Euronext.
This presentation may include forward-looking statements, which are based on Euronext’s current expectations and projections about future events. By their nature,
forward-looking statements involve known and unknown risks, uncertainties, assumptions and other factors because they relate to events and depend on
circumstances that will occur in the future whether or not outside the control of Euronext. Such factors may cause actual results, performance or developments to
differ materially from those expressed or implied by such forward-looking statements. Accordingly, no undue reliance should be placed on any forward-looking
statements. Forward-looking statements speak only as at the date at which they are made. Euronext expressly disclaims any obligation or undertaking to update,
review or revise any forward-looking statements contained in this presentation to reflect any change in its expectations or any change in events, conditions or
circumstances on which such statements are based unless required to do so by applicable law.
Financial objectives are internal objectives of the Company to measure its operational performance and should not be read as indicating that the Company is
targeting such metrics for any particular fiscal year. The Company’s ability to achieve these financial objectives is inherently subject to significant business, economic
and competitive uncertainties and contingencies, many of which are beyond the Company’s control, and upon assumptions with respect to future business decisions
that are subject to change. As a result, the Company’s actual results may vary from these financial objectives, and those variations may be material.
Efficiencies are net, before tax and on a run-rate basis, ie taking into account the full-year impact of any measure to be undertaken before the end of the period
mentioned. The expected operating efficiencies and cost savings were prepared on the basis of a number of assumptions, projections and estimates, many of which
depend on factors that are beyond the Company’s control. These assumptions, projections and estimates are inherently subject to significant uncertainties and actual
results may differ, perhaps materially, from those projected. The Company cannot provide any assurance that these assumptions are correct and that these
projections and estimates will reflect the Company's actual results of operations
Euronext refers to Euronext N.V. and its affiliates. Information regarding trademarks and intellectual property rights of Euronext is located at
https://www.euronext.com/terms-use.
© 2015, Euronext N.V. - All rights reserved.
#417362300


