energy.gov/sunshot Q1/Q2 2017 Solar Industry Update David Feldman DOE Robert Margolis NREL August 10, 2017 NREL/PR-6A42-69107 NREL is a national laboratory of the U.S. Department of Energy, Office of Energy Efficiency and Renewable Energy, operated by the Alliance for Sustainable Energy, LLC.
Transcript
energy.gov/sunshot
Q1/Q2 2017 Solar Industry Update
David Feldman DOE Robert Margolis NREL August 10, 2017
NREL/PR-6A42-69107 NREL is a national laboratory of the U.S. Department of Energy, Office of Energy Efficiency and Renewable Energy, operated by the Alliance for Sustainable Energy, LLC.
energy.gov/sunshot
Executive Summary
2
• The United States installed 2.0 GWDC of PV in Q1 2017—42.9 GW total. – Utility-scale PV added more than 1 GWDC for the sixth straight quarter. – The distributed PV sector has been more challenged this year as large integrators pursue
profitability at the expense of growth, customer acquisition remains a challenge, the potential for increased tariffs on modules and cells, and unseasonably rainy weather reduced installations in California.
• Solar accounted for approximately 25% of all new electricity generating capacity for the first five months of 2017, behind wind and natural gas. PV installations in the second half of the year are expected to be much larger than the first half of 2017.
• Seven states produced more than 6.5% of total net generation from solar in in the first five months of 2017, and an additional seven states produced more than 2.5% of total net generation from solar.
– California generated 20% of its electricity from solar in May 2017. • States continue to revise laws and regulations to manage continued growth of distributed and utility-
scale PV. – Thus far in 2017, five states have passed laws or regulations transitioning away from traditional
retail net metering, and 24 states took action on net metering. • From January 2017 to July 2017, module prices for larger buyers fell 8% to $0.33/W due to leveling off
of global demand and increased competition for market share. – U.S. module prices, however, increased to $0.40−$0.50/W due to fears of tariffs being put in
place on all foreign c-Si modules and cells.
A list of acronyms is available at the end of the presentation.
energy.gov/sunshot
Agenda
• State Updates • U.S. Deployment • U.S. Pricing • Global Manufacturing • Component Pricing • Market Activity
3
energy.gov/sunshot
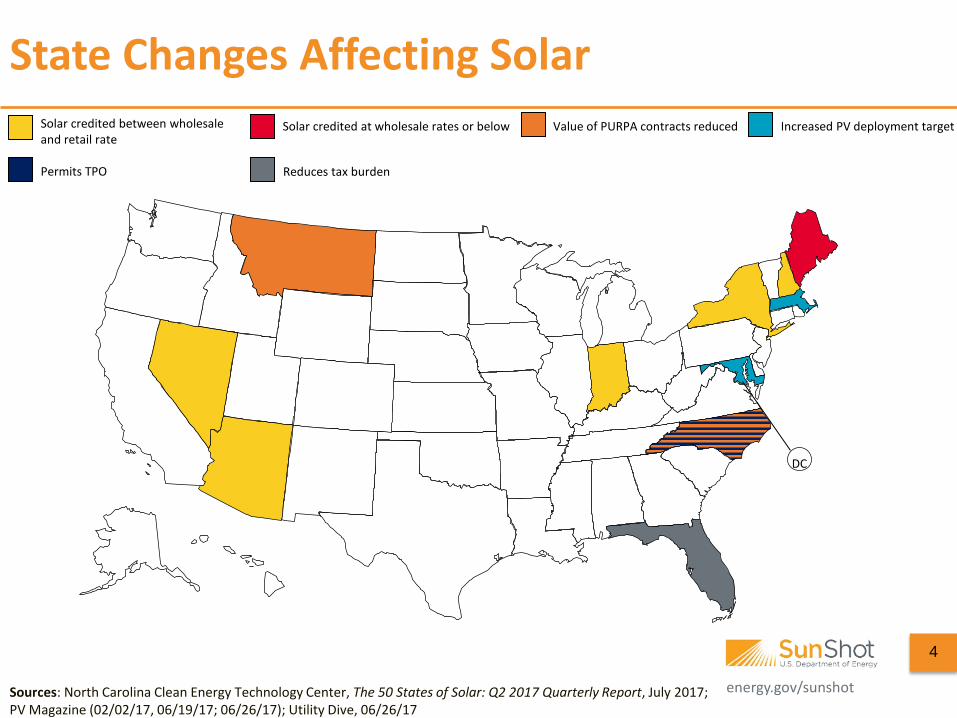
State Changes Affecting Solar
4
Solar credited between wholesale and retail rate
Increased PV deployment target Solar credited at wholesale rates or below Value of PURPA contracts reduced
Permits TPO Reduces tax burden
DC
Sources: North Carolina Clean Energy Technology Center, The 50 States of Solar: Q2 2017 Quarterly Report, July 2017; PV Magazine (02/02/17, 06/19/17; 06/26/17); Utility Dive, 06/26/17
energy.gov/sunshot
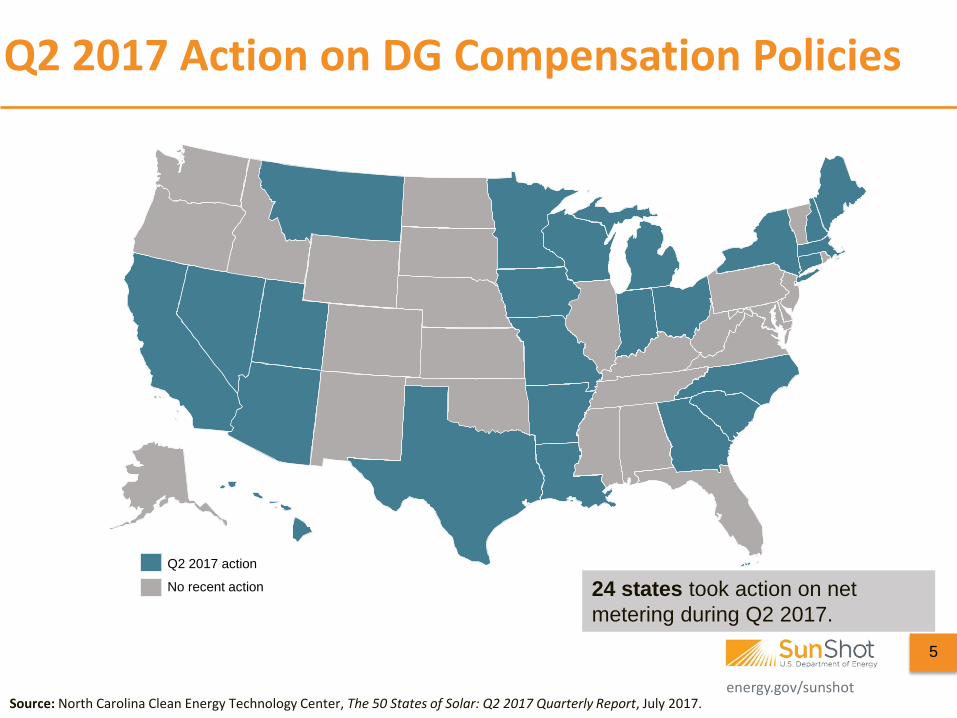
Q2 2017 action No recent action
Q2 2017 Action on DG Compensation Policies
24 states took action on net metering during Q2 2017.
Source: North Carolina Clean Energy Technology Center, The 50 States of Solar: Q2 2017 Quarterly Report, July 2017.
5
energy.gov/sunshot
State Changes Affecting Solar, cont.
Source: North Carolina Clean Energy Technology Center, The 50 States of Solar: Q2 2017 Quarterly Report, July 2017.
6
• In July 2017, a judge recommended that the Arizona utility commission approve a settlement between APS and solar companies that pays new rooftop solar customers $0.129/kWh for exported energy (locked in for 10 years), and the rate would decline no more than 10% annually.
• In May 2017, the Governor of Indiana signed a law that ends retail rate net metering for new customers in July 2022 or once net-metered capacity reaches 1.5% of utilities’ peak load. After 2022, excess energy will be credited at 1.25 times the wholesale energy rate.
• In June 2017, the New Hampshire PUC issued a decision in the state’s net metering successor tariff proceeding, applying some non-bypassable charges to grid imports, as well as a reduced net excess generation credit rate.
• In June 2017, the Governor of Nevada signed a law that increases the credit rate for excess generation from avoided cost to 95% of the retail rate. This rate will step down over time to a floor of 75% of the retail rate as certain installed capacity thresholds are reached.
• In March 2017, the New York PSC published a net metering transition order, providing direction on how DERs should transition from net metering to a tariff that reflects the costs and benefits of DERs on the grid.
Solar credited between wholesale and retail rate
Increased PV deployment target Solar credited at wholesale rates or below Value of PURPA contracts reduced
Permits TPO Reduces tax burden
energy.gov/sunshot
State Changes Affecting Solar, cont.
Sources: North Carolina Clean Energy Technology Center, The 50 States of Solar: Q2 2017 Quarterly Report, July 2017; PV Magazine (02/02/17, 06/19/17; 06/26/17); Utility Dive, 06/26/17
7
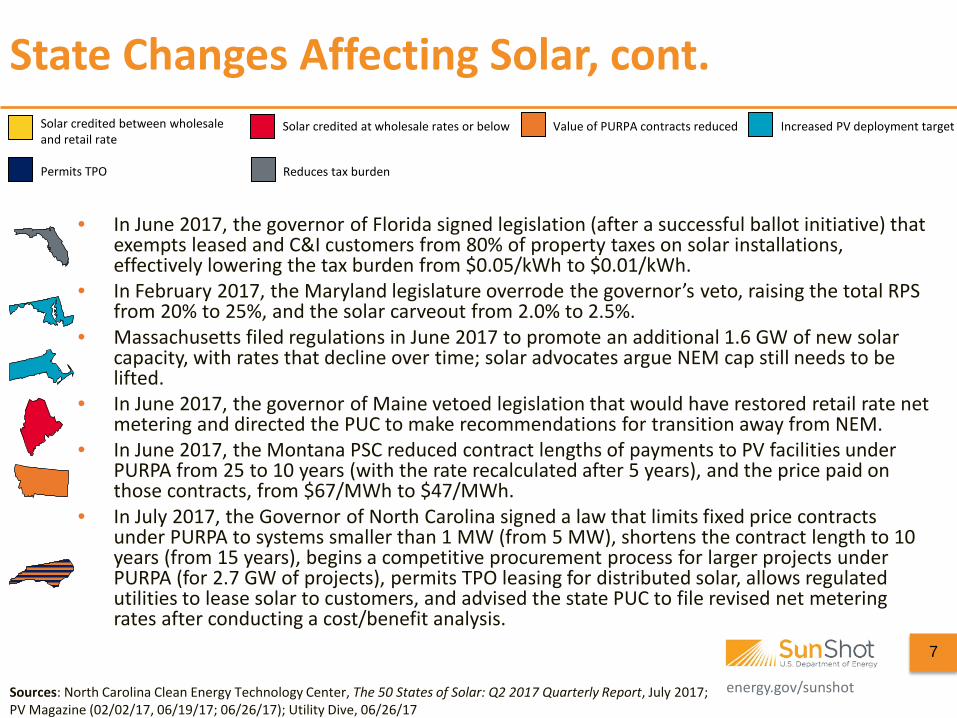
• In June 2017, the governor of Florida signed legislation (after a successful ballot initiative) that exempts leased and C&I customers from 80% of property taxes on solar installations, effectively lowering the tax burden from $0.05/kWh to $0.01/kWh.
• In February 2017, the Maryland legislature overrode the governor’s veto, raising the total RPS from 20% to 25%, and the solar carveout from 2.0% to 2.5%.
• Massachusetts filed regulations in June 2017 to promote an additional 1.6 GW of new solar capacity, with rates that decline over time; solar advocates argue NEM cap still needs to be lifted.
• In June 2017, the governor of Maine vetoed legislation that would have restored retail rate net metering and directed the PUC to make recommendations for transition away from NEM.
• In June 2017, the Montana PSC reduced contract lengths of payments to PV facilities under PURPA from 25 to 10 years (with the rate recalculated after 5 years), and the price paid on those contracts, from $67/MWh to $47/MWh.
• In July 2017, the Governor of North Carolina signed a law that limits fixed price contracts under PURPA to systems smaller than 1 MW (from 5 MW), shortens the contract length to 10 years (from 15 years), begins a competitive procurement process for larger projects under PURPA (for 2.7 GW of projects), permits TPO leasing for distributed solar, allows regulated utilities to lease solar to customers, and advised the state PUC to file revised net metering rates after conducting a cost/benefit analysis.
Solar credited between wholesale and retail rate
Increased PV deployment target Solar credited at wholesale rates or below Value of PURPA contracts reduced
Permits TPO Reduces tax burden
energy.gov/sunshot
Agenda
• State Updates • U.S. Deployment • U.S. Pricing • Global Manufacturing • Component Pricing • Market Activity
8
energy.gov/sunshot
9
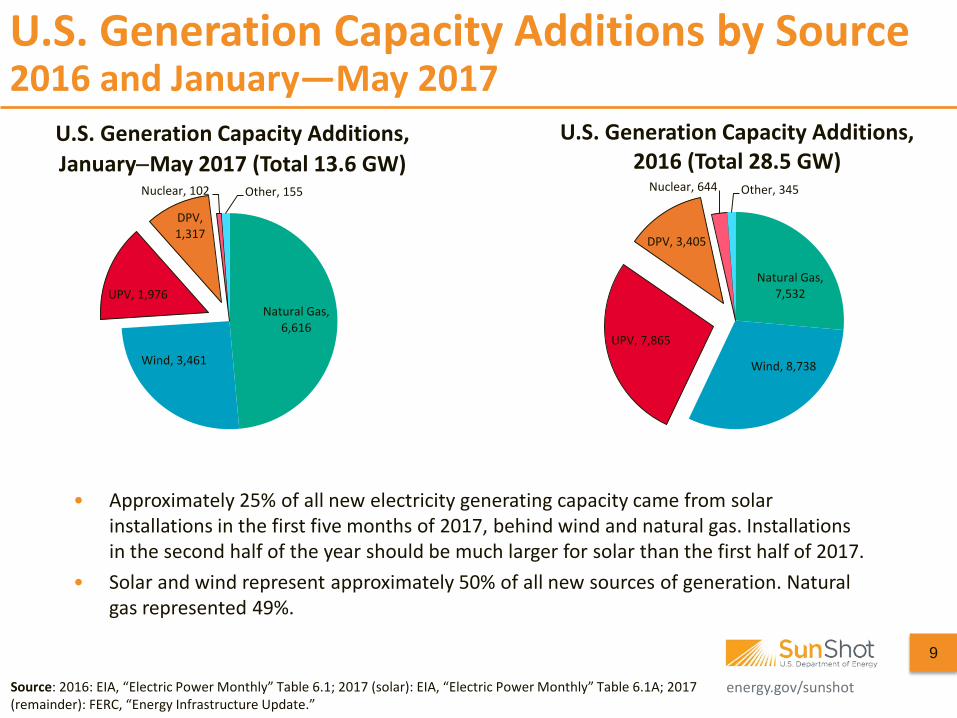
• Approximately 25% of all new electricity generating capacity came from solar installations in the first five months of 2017, behind wind and natural gas. Installations in the second half of the year should be much larger for solar than the first half of 2017.
• Solar and wind represent approximately 50% of all new sources of generation. Natural gas represented 49%.
U.S. Generation Capacity Additions by Source 2016 and January—May 2017
Natural Gas, 7,532
Wind, 8,738
UPV, 7,865
DPV, 3,405
Nuclear, 644 Other, 345
U.S. Generation Capacity Additions, 2016 (Total 28.5 GW)
Natural Gas, 6,616
Wind, 3,461
UPV, 1,976
DPV, 1,317
Nuclear, 102 Other, 155
U.S. Generation Capacity Additions, January−May 2017 (Total 13.6 GW)
energy.gov/sunshot
U.S. Installation Breakdown
• The United States installed 2.0 GWDC of PV in Q1 2017—42.9 GW total. – Utility-scale PV added more than 1 GWDC for the sixth straight quarter.
• The distributed PV sector has been more challenged this year as large integrators pursue profitability at the expense of growth, customer acquisition remains a challenge, the potential for increased tariffs on modules and cells, and unseasonably rainy weather reduced installations in California.
– However, deployment of distributed PV has been helped by community solar programs and VNEM, as well as a growing diversity of active states.
10
Source: GTM Research/SEIA: U.S. Solar Market Insight Q2 2017.
0.7 0.9 1.0
2.1
1.4 1.3 1.4
2.2
1.3 1.4 1.4
3.3
2.1 2.2
4.2
6.5
2.0
0.0
1.0
2.0
3.0
4.0
5.0
6.0
7.0
Q1'13
Q2'13
Q3'13
Q4'13
Q1'14
Q2'14
Q3'14
Q4'14
Q1'15
Q2'15
Q3'15
Q4'15
Q1'16
Q2'16
Q3'16
Q4'16
Q1'17
Qua
rter
ly P
V In
stal
led
(GW
DC)
U.S. PV Installations by Market Segment
Utility
Non-Residential
Residential
CA, 507
NC, 200
AZ, 168 MN, 140
ID, 132
Other, 896
U.S. PV Installations by State (MWDC), Q1 2017
energy.gov/sunshot
4,526 1,131
860 831
617 446 408
270 212 202
1,810
0 1,000 2,000 3,000 4,000 5,000
CaliforniaNew Jersey
MassachusettsArizona
New YorkMaryland
HawaiiColorado
ConnecticutNevada
Rest of U.S.
Distributed PV Installed Capacity, Top 10 States, as of May 2017 Megawatts (MWAC)
8,758 2,752
1,684 1,495
970 968
857 607 504 471
2,679
0 2,000 4,000 6,000 8,000 10,000
CaliforniaNorth Carolina
ArizonaNevada
TexasGeorgia
UtahNew Jersey
New MexicoMassachusetts
Rest of U.S.
Utility-Scale PV Installed Capacity, Top 10 States, as of May 2017 Megawatts (MWAC)
U.S. Installation Breakdown
• At the end of May 2017, there were 36.2 GWAC of solar systems in the United States. – Of the 36.2 GW, 21.7 GW were utility-scale PV and 14.5 GW were distributed PV.
• Half of the top 10 states led in both the utility-scale and distributed sectors, while the other states on the list had less diverse deployment – Six of the top 10 states with utility-scale PV were in the Southwest while 5 of the top
10 states with distributed PV were in Northeast.
Source: EIA, “Electric Power Monthly,” forms EIA-023, EIA-826, and EIA-861 (July 2017). Note: EIA monthly data for 2017 are not final. Additionally, smaller utilities report information to EIA on a yearly basis, and therefore, a certain amount of solar data has not yet been reported.
11
energy.gov/sunshot
Solar Generation as a Percentage of Total Generation, January—May 2017
• Seven states produced more than 6.5% of total net generation from solar in in the first five months of 2017, and an additional six states produced more than 2.5% of total net generation from solar.
• Solar technology contribution varied by state, with Hawaii generating most of its energy from distributed PV, while North Carolina generated the vast majority of its energy from utility-scale PV. – During the same period, CSP generated more than 1% of California’s electricity and
more 0.8% of Arizona’s.
Source: EIA, “Electric Power Monthly,” forms EIA-023, EIA-826, and EIA-861 (February 2017). Note: EIA monthly data for 2017 are not final. Additionally, smaller utilities report information to EIA on a yearly basis, and therefore, a certain amount of solar data has not yet been reported. “Net Generation” includes DPV generation.
12
15.3%
11.4% 10.0% 9.7%
7.0% 6.5% 6.5% 4.5% 4.3% 3.8% 3.4% 3.1% 2.6% 1.9%
0%2%4%6%8%
10%12%14%16%18%
Sola
r Gen
erat
ion
as a
Per
cent
age
of
Tota
l Net
Gen
erat
ion
CSP DPV UPV
energy.gov/sunshot
Solar Generation as a Percentage of Total Generation, Monthly
• In May 2017, solar generated more than 5% of electric generation in 10 states, and more than 10% in 5 states. – California, whose solar production dipped more than normal in the beginning of the
year due to a tremendous amount of rain, generated 20% of its electricity from solar in May 2017.
– Utah, which generated less than 1% of its electricity from solar in 2015, generated almost 10% of its electricity from solar in April 2017.
Source: EIA, “Electric Power Monthly,” forms EIA-023, EIA-826, and EIA-861. Note: EIA monthly data for 2016 are not final. Additionally, smaller utilities report information to EIA on a yearly basis, and therefore, a certain amount of solar data has not yet been reported.
13
0%
5%
10%
15%
20%
25%
Sola
r Gen
erat
ion
as a
Per
cent
age
of
Tota
l Net
Gen
erat
ion
CaliforniaNevadaHawaiiVermontArizonaUtahMassachusettsNew JerseyNorth CarolinaNew MexicoU.S. Total
energy.gov/sunshot
• Residential solar installations have historically been dominated by a few large integrators; however, over the past five quarters, these companies have been losing market share to smaller installers.
– Tesla/Vivint/Sunrun represented approximately 43% of the residential market in Q1 2017—the lowest level since Q4 2013.
• With the acquisition of SolarCity by Tesla, the company has emphasized “cash preservation over growth” and has shifted from leasing to selling systems.
– In Q1 2017, direct sales represented 31% and 19% of Tesla’s and Vivint Solar’s installations respectively. In Q1 2016, direct sales only represented 9% of Tesla’s installations.
• Tesla and Sunrun are also expanding product offerings through PV+storage. – Tesla announced 60 MWh of energy storage installed in Q1 2017 (98 MWh in Q4 2016).
Tesla, Vivint Solar, and Sunrun Residential Market Share
Source: Corporate filing, GTM/SEIA Solar Market Insight Q2 2017. Note: Tesla Q4 2016 and Q1 2017 residential deployment are assumed to have the same percentage of total deployment that occurred in Q3 2016.
• State Updates • U.S. Deployment • U.S. Pricing • Global Manufacturing • Component Pricing • Market Activity
15
energy.gov/sunshot
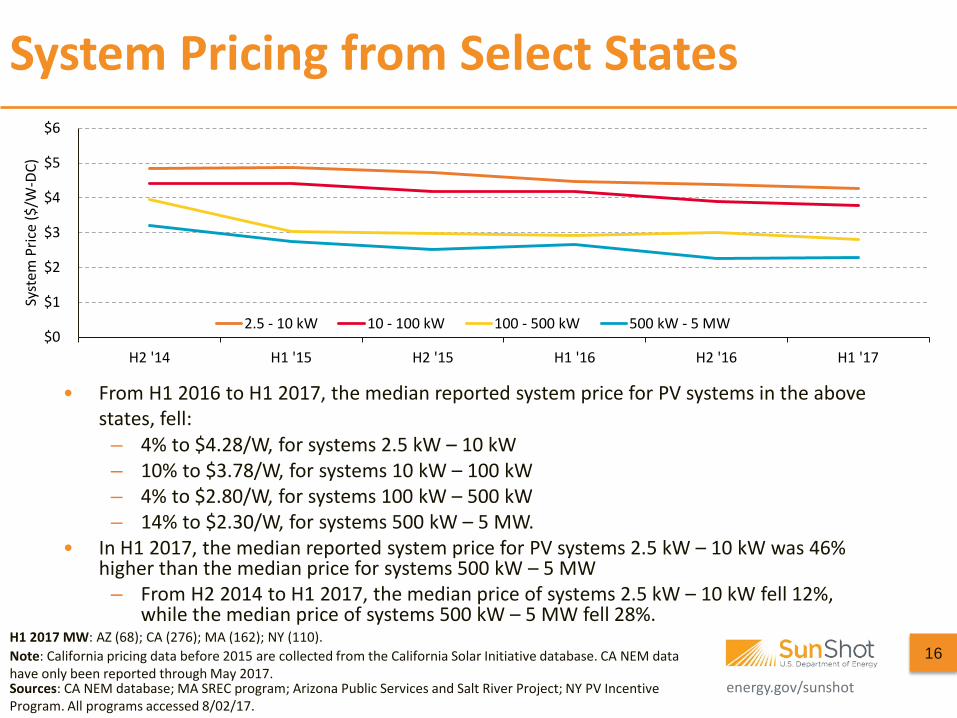
System Pricing from Select States
16
• From H1 2016 to H1 2017, the median reported system price for PV systems in the above states, fell:
– 4% to $4.28/W, for systems 2.5 kW – 10 kW – 10% to $3.78/W, for systems 10 kW – 100 kW – 4% to $2.80/W, for systems 100 kW – 500 kW – 14% to $2.30/W, for systems 500 kW – 5 MW.
• In H1 2017, the median reported system price for PV systems 2.5 kW – 10 kW was 46% higher than the median price for systems 500 kW – 5 MW
– From H2 2014 to H1 2017, the median price of systems 2.5 kW – 10 kW fell 12%, while the median price of systems 500 kW – 5 MW fell 28%.
H1 2017 MW: AZ (68); CA (276); MA (162); NY (110).
Sources: CA NEM database; MA SREC program; Arizona Public Services and Salt River Project; NY PV Incentive Program. All programs accessed 8/02/17.
Note: California pricing data before 2015 are collected from the California Solar Initiative database. CA NEM data have only been reported through May 2017.
*Bars represent the median, with error bars representing 80th and 20th percentiles
H1 2017 MW: AZ (68); CA (276); MA (162); NY (110).
Sources: CA NEM database; MA SREC program; Arizona Public Services and Salt River Project; NY PV Incentive Program. All programs accessed 8/02/17
Note: California pricing data before 2015 are collected from the California Solar Initiative database. CA NEM data have only been reported through May 2017.
energy.gov/sunshot
• From Q1 ‘16 to Q1 ’17, Vivint Solar and Sunrun systems total costs decreased 11% and 17% respectively.
– Vivint Solar’s and Sunrun’s installation costs decreased 19% and 10% y/y respectively; however, Vivint Solar’s overhead costs increased 9% over that time, while Sunrun’s overhead costs decreased 34%. Vivint Solar’s installations have decreased while Sunrun’s installations have increased.
• Sunrun reported a profit (or net value) of $0.83/W in Q1 2017; however, $0.63/W of that comes from assumed contract renewals and O&M costs.
• With Tesla’s acquisition of SolarCity there is less transparency of their costs.
SolarCity, Vivint Solar, and Sunrun Cost and Value
Sources: Corporate filings.
18
$1.94 $2.58
$2.14
$0.65
$0.51 $0.39
$0.29
$0.83
$0.0
$0.5
$1.0
$1.5
$2.0
$2.5
$3.0
$3.5
$4.0
$4.5
$5.0
Vivint Solar Sunrun Avg. Sunrun Built
Inst
alle
d Co
st ($
/W)
Q1 2017
Net Value
G&A
Sales
Installation
$0.0
$0.5
$1.0
$1.5
$2.0
$2.5
$3.0
$3.5
$4.0
$4.5
$5.0
Q4'12
Q1'13
Q2'13
Q3'13
Q4'13
Q1'14
Q2'14
Q3'14
Q4'14
Q1'15
Q2'15
Q3'15
Q4'15
Q1'16
Q2'16
Q3'16
Q4'16
Q1'17
$/W
att
Vivint - Installation, SG&ASolarCity - Installation, SG&ASunrun - Installation, SG&ASolarCity - Net ValueSunrun - Net Value
energy.gov/sunshot
System Prices from Sol Systems 500 kW−2 MW and 2 MW+
• Sol Systems reports than from Q4 2016 to Q2 2017 the median all-in asking price for systems 500 kW – 2 MW fell approximately 6%, and the median all-in asking price for systems greater than 2 MW fell 10%.
Sources: Sol Systems, “The Sol Source,” March 2014—June 2017.
Sol Systems reports values on a monthly basis. Values for each quarter from Q2 2016 to Q2 2017 represent the average of the three monthly medians reported each quarter. Prior to Q2 2016 Sol Systems only reported a high and low value for each market segment; values prior to Q2 2016 represent the midpoint between the reported high and low value.
19
energy.gov/sunshot
Agenda
• State Updates • U.S. Deployment • U.S. Pricing • Global Manufacturing • Component Pricing • Market Activity
20
energy.gov/sunshot
21
Note: First Solar reports production, not shipments. Only ReneSola modules are represented. Sources: Company figures based on Q1 ‘17 (and previous) SEC filings by the respective companies.
Manufacturers’ Shipments Major Publicly Reported Cell/Module Manufacturers
• In Q1 ’17, the above companies shipped 6.8 GW, a 10% increase from Q1 ’16. – Shipments typically slump in Q1, but most of these companies expect an increase in shipments
SunPowerYingliReneSolaFirst SolarJA SolarCanadian SolarJinko Solar
energy.gov/sunshot energy.gov/sunshot
PV Manufacturers’ Margins
• After several PV companies incurred restructuring costs in Q4 2016, as well as a significant decline in module pricing, margins recovered to some degree in Q1 2017.
– The median gross margins was 10% and the median operating margin was 0% for the above companies in Q1 2017.
• However, companies are currently not making money and many companies continue their efforts to lower costs to return to profitability.
22
Sources: Company figures based on Q1 2017 (and previous) SEC filings by the respective companies.
*Line represents the median, with error bars representing 80th and 20th percentiles for the following companies: Canadian Solar, First Solar, Hanwha Q Cells, JA Solar, Jinko Solar, ReneSola, SunPower, Trina Solar, and Yingli Solar.
-40%
-30%
-20%
-10%
0%
10%
20%
30%
40%
Q1'10
Q2'10
Q3'10
Q4'10
Q1'11
Q2'11
Q3'11
Q4'11
Q1'12
Q2'12
Q3'12
Q4'12
Q1'13
Q2'13
Q3'13
Q4'13
Q1'14
Q2'14
Q3'14
Q4'14
Q1'15
Q2'15
Q3'15
Q4'15
Q1'16
Q2'16
Q3'16
Q4'16
Q1'17
Mar
gins
Operating Margin
Gross Margin
energy.gov/sunshot
Agenda
• State Updates • U.S. Deployment • U.S. Pricing • Global Manufacturing • Component Pricing • Market Activity
23
energy.gov/sunshot
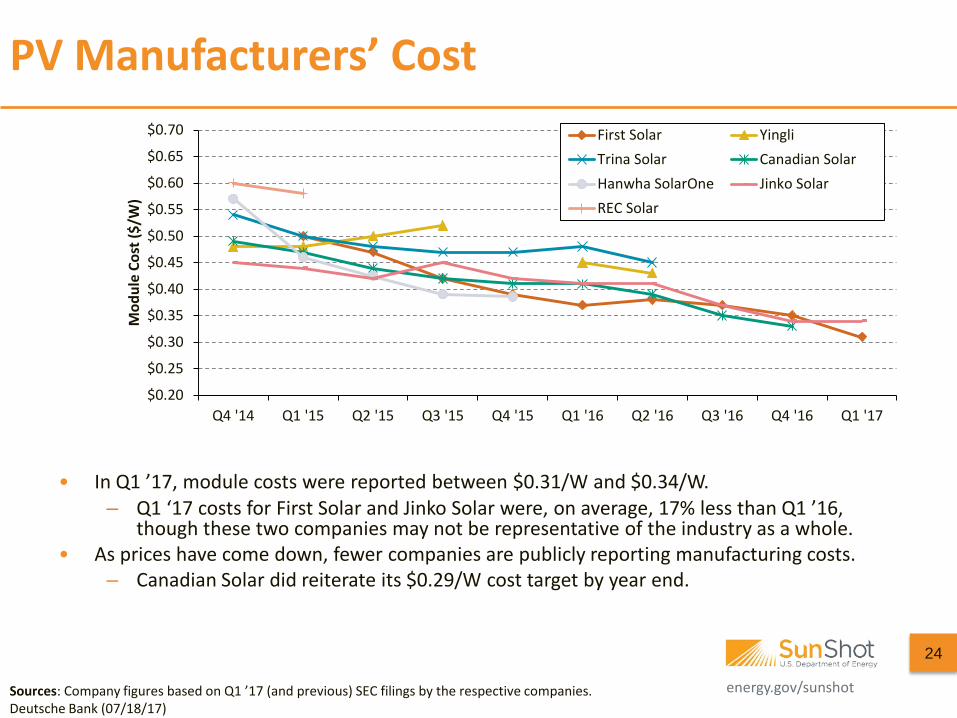
PV Manufacturers’ Cost
• In Q1 ’17, module costs were reported between $0.31/W and $0.34/W.
– Q1 ‘17 costs for First Solar and Jinko Solar were, on average, 17% less than Q1 ’16, though these two companies may not be representative of the industry as a whole.
• As prices have come down, fewer companies are publicly reporting manufacturing costs. – Canadian Solar did reiterate its $0.29/W cost target by year end.
24
Sources: Company figures based on Q1 ’17 (and previous) SEC filings by the respective companies. Deutsche Bank (07/18/17)
) First Solar YingliTrina Solar Canadian SolarHanwha SolarOne Jinko SolarREC Solar
energy.gov/sunshot energy.gov/sunshot
$13.42
$0.49
$0.33 $0.25
$0.15
$0.00
$0.10
$0.20
$0.30
$0.40
$0.50
$0.60
$0.70
$0$2$4$6$8
$10$12$14$16$18
$/W
att (
Nom
inal
)
Poly
silic
on ($
/kg)
Polysilicon (left axis)
Modules (small buyers)
Modules (large buyers)
Multi Cells
Multi Wafers
• From January 2017 to July 2017, module prices for larger buyers and polysilicon prices fell 8% and 10% respectively due to the leveling off of global demand and increased competition for market share.
– Module pricing for small buyers fell 24% from January 2017 to July 2017 – Cell and wafer pricing increased 4% over that same period.
• Despite the continued drop in global module pricing, many analysts report an increase in U.S. module pricing due to fears of tariffs being put in place on all foreign c-Si modules and cells due to the Section 201 filing by SolarWorld and Suniva (ITC determination on Section 201 case is set for September 22nd; however, the implementation may not happen until 2018, if at all)
– U.S. module pricing reported between $0.40/W to $0.50/W. – Many developers and distributors are stockpiling panels in preparation for a potential tariff. – The $0.78/W minimum module price that is requested in the filing was
approximately the average ASP in 2012.
Module, Cell, Wafer, and Polysilicon Price
25 Sources: “Modules (large buyers)” from PVInsights, accessed 07/26/17. Remaining data from BNEF Solar Spot Price Index (07/26/17). Other information from: BNEF (07/05/17); Cowen & Co. (07/13/17); Deutsche Bank (07/13/17); Mercom (04/04/17, 05/08/17); SPV Market Research (April 2017).
• Central and string inverter prices were relatively flat from Q3 2016 to Q1 2017 – Central and string inverter prices have dropped 43%−57% since Q1 2014 – As prices have dropped, manufacturers have included new standards and features.
Enphase Microinverters and SolarEdge DC-Optimized Inverter Systems
27 1 Costs per Watt in graph above include all costs reported in COGS and apparently include some costs Enphase does not include in its cost per Watt target of a 50% cost reduction to $0.10/W. Sources: Enphase/SolarEdge public filings
• From Q1 ‘16 to Q1 ’17, Enphase and SolarEdge MLPE prices fell 12% and 16% respectively. – Enphase and SolarEdge MLPE costs also decreased by 6% and 17% respectively over the same period.
• Enphase MLPE cost approximately double that of SolarEdge’s. – Enphase initiated a plan in late 2015 to cut inverter costs 50% in 24 months, to $0.10/W.1 They reported in
July 2017 that they are months beyond schedule – Enphase also announced in July 2017 the introduction of an AC module (in partnership with LG and
JinkoSolar) achieved through its products successful reductions in size and weight. • From Q1 ‘16 to Q1 ’17, SolarEdge MLPE shipments rose 9% to 455 MW while
• State Updates • U.S. Deployment • U.S. Pricing • Global Manufacturing • Component Pricing • Market Activity
28
energy.gov/sunshot
SREC Pricing
29
• From January 2017 to July 2017, after significant price reductions in 2016, spot SREC pricing fell 8%−9% in New Jersey and D.C., 50% in Pennsylvania and Ohio, and 61% in Maryland.
– Most states markets have an oversupply of SRECs, which have pushed prices lower. – PV system pricing is also at an all-time low and is expected to decrease in the future.
• Massachusetts SRECs have remained relatively flat over the past five years as the state continues to expand its solar requirements and update its programs.
Stock Market Activity • Solar stocks made significant gains from May to July 2017—up 25% from the beginning of the year.
– Analysts have attributed the gain to the continued decrease in the cost of solar, the growth in global shipments, the announcement by the President of a “solar wall” to be built between the United States and Mexico, and the potential for higher pricing in the United States caused by a tariff on foreign PV c-Si modules and cells.
– While many companies would be hurt if the United States placed a tariff on all foreign-made c-Si modules, others could benefit greatly, such as First Solar (the most heavily weighted company in the Guggenheim Solar ETF).
• While solar stocks are up in 2017, they have historically had more volatility and performed poorly than the stock market as a whole.
– Over the past 10 years, only solar investments made in 2013 and 2017, and held until today, would have returned a profit.
– Over the past 10 years, solar stocks have only had a positive year three times compared to seven years for the S&P500.
Notes: Average market cap. of securities in TAN was $9.8 billion (12/31/16), Russell 2000, $1.6 billion (6/27/16). Sources: Stock market: Yahoo Finance (07/28/17)
30 -5%
0%
5%
10%
15%
20%
25%
30%
Jan-17 Feb-17 Mar-17 Apr-17 May-17 Jun-17 Jul-17
% C
hang
e (In
dex:
1/3
/17
Adju
sted
Clo
se)
YTD Returns
S&P 500 IndexRussell 2000Guggenheim Solar ETF (TAN)
Year of investment
Guggenheim Solar ETF S&P 500 Index
Hold stock 1-yr investment Hold stock 1-yr investment
2008 -21% -76% 7% -40%
2009 -13% 14% 12% 22%
2010 -16% -30% 11% 12%
2011 -14% -61% 11% 0%
2012 -1% -32% 13% 14%
2013 8% 134% 12% 25%
2014 -13% -9% 9% 12%
2015 -15% -8% 7% -2%
2016 -19% -42% 14% 12%
2017 48% 48% 18% 18%
RoR by Year and Length of Investment
energy.gov/sunshot
David Feldman Senior Financial Analyst
Contractor to the United States Department of Energy 310-266-2679
The authors are highly indebted to the following individuals for their insights and contributions to this brief: Jenny Chase (BNEF), Shayle Kann (GTM Research), Jeffrey Logan (NREL), David Mooney (NREL), Nathan Serota (BNEF), MJ Shiao (GTM Research), and Scott Stephens (NRG Energy, Inc.).
energy.gov/sunshot energy.gov/sunshot Sources: Company figures based on Q1 2017 (and previous) SEC filings by the respective companies.
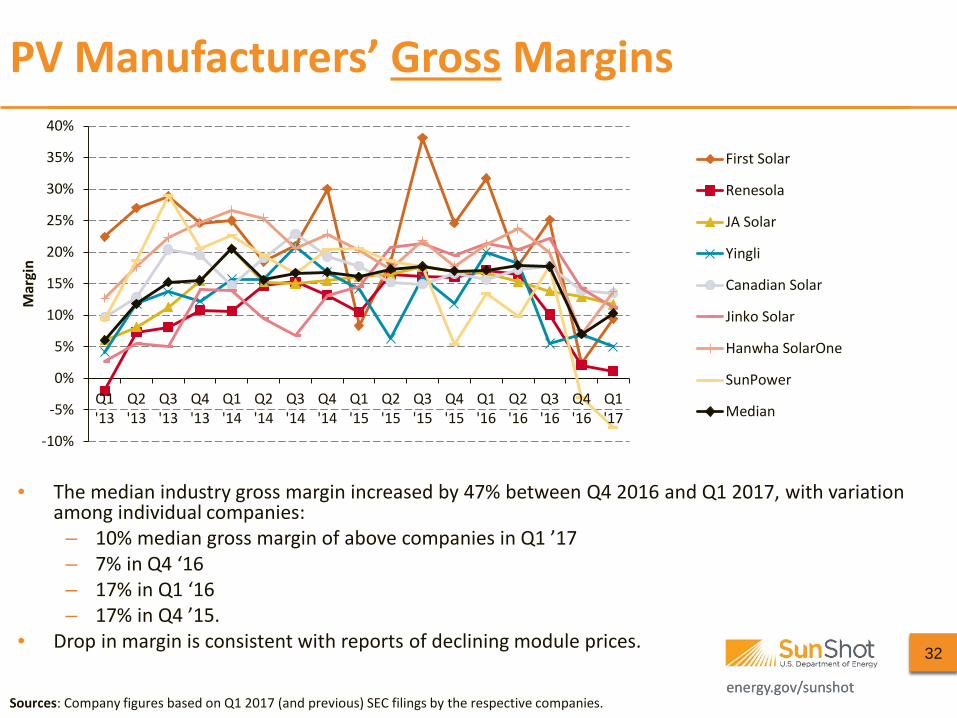
PV Manufacturers’ Gross Margins
• The median industry gross margin increased by 47% between Q4 2016 and Q1 2017, with variation among individual companies:
– 10% median gross margin of above companies in Q1 ’17 – 7% in Q4 ‘16 – 17% in Q1 ‘16 – 17% in Q4 ’15.
• Drop in margin is consistent with reports of declining module prices. 32
-10%
-5%
0%
5%
10%
15%
20%
25%
30%
35%
40%
Q1'13
Q2'13
Q3'13
Q4'13
Q1'14
Q2'14
Q3'14
Q4'14
Q1'15
Q2'15
Q3'15
Q4'15
Q1'16
Q2'16
Q3'16
Q4'16
Q1'17
Mar
gin
First Solar
Renesola
JA Solar
Yingli
Canadian Solar
Jinko Solar
Hanwha SolarOne
SunPower
Median
energy.gov/sunshot energy.gov/sunshot Sources: Company figures based on Q1 2017 (and previous) SEC filings by the respective companies.
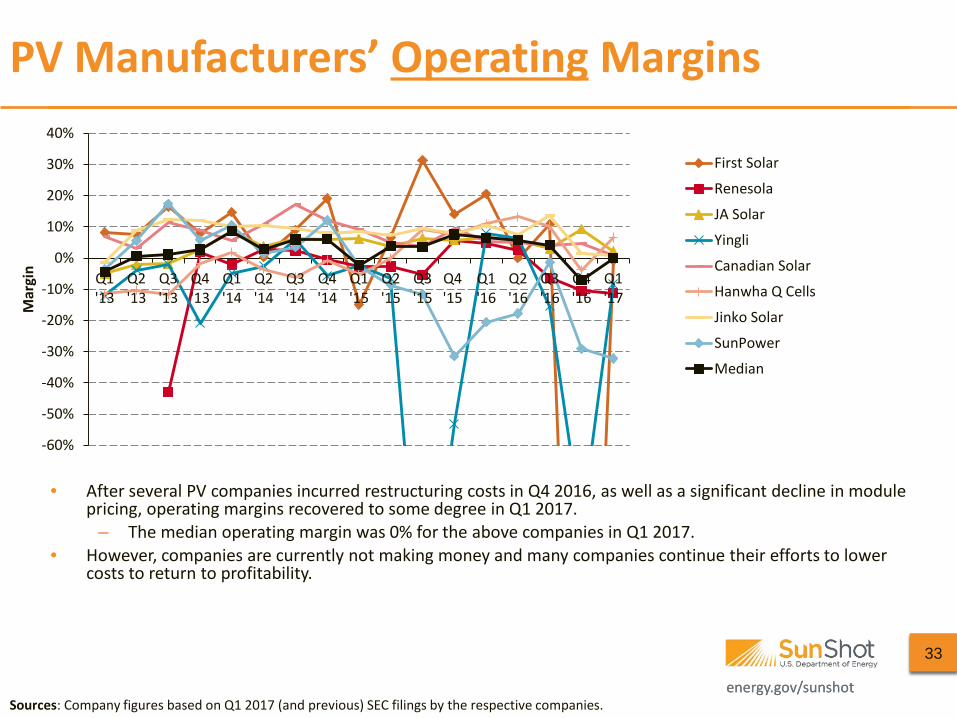
PV Manufacturers’ Operating Margins
• After several PV companies incurred restructuring costs in Q4 2016, as well as a significant decline in module pricing, operating margins recovered to some degree in Q1 2017.
– The median operating margin was 0% for the above companies in Q1 2017. • However, companies are currently not making money and many companies continue their efforts to lower
costs to return to profitability.
33
-60%
-50%
-40%
-30%
-20%
-10%
0%
10%
20%
30%
40%
Q1'13
Q2'13
Q3'13
Q4'13
Q1'14
Q2'14
Q3'14
Q4'14
Q1'15
Q2'15
Q3'15
Q4'15
Q1'16
Q2'16
Q3'16
Q4'16
Q1'17
Mar
gin
First Solar
Renesola
JA Solar
Yingli
Canadian Solar
Hanwha Q Cells
Jinko Solar
SunPower
Median
energy.gov/sunshot
$3.0
$3.5
$4.0
$4.5
$5.0
$5.5
$6.0
AZ CA MA NY
Syst
em P
rice
($/W
-DC)
H1 2017
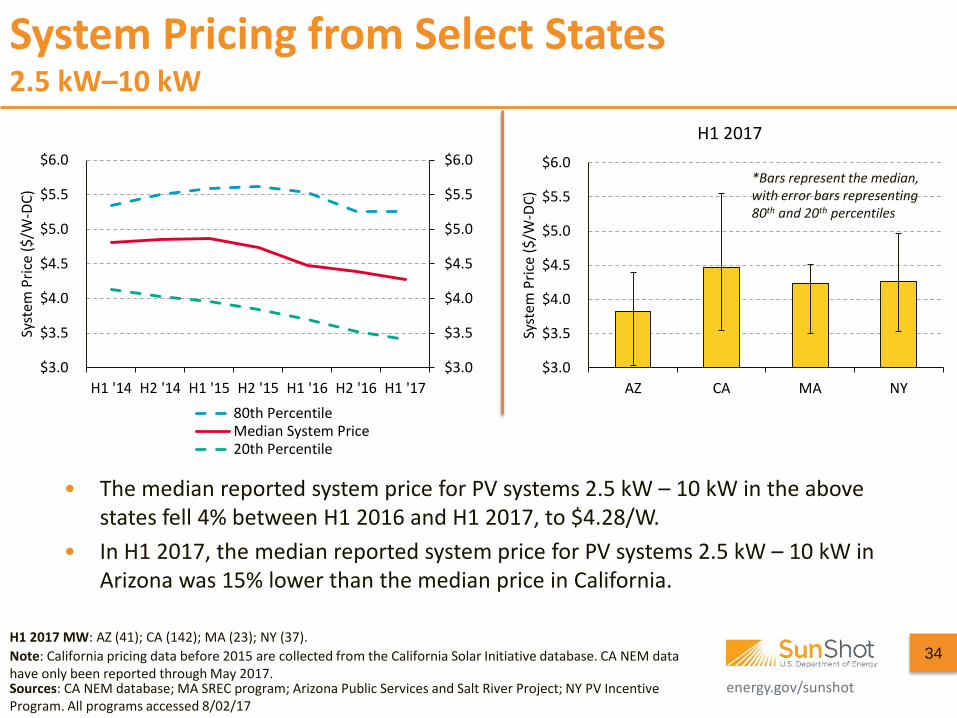
System Pricing from Select States 2.5 kW–10 kW
34
• The median reported system price for PV systems 2.5 kW – 10 kW in the above states fell 4% between H1 2016 and H1 2017, to $4.28/W.
• In H1 2017, the median reported system price for PV systems 2.5 kW – 10 kW in Arizona was 15% lower than the median price in California.
H1 2017 MW: AZ (41); CA (142); MA (23); NY (37).
Sources: CA NEM database; MA SREC program; Arizona Public Services and Salt River Project; NY PV Incentive Program. All programs accessed 8/02/17
$3.0
$3.5
$4.0
$4.5
$5.0
$5.5
$6.0
$3.0
$3.5
$4.0
$4.5
$5.0
$5.5
$6.0
H1 '14 H2 '14 H1 '15 H2 '15 H1 '16 H2 '16 H1 '17
Syst
em P
rice
($/W
-DC)
80th PercentileMedian System Price20th Percentile
Note: California pricing data before 2015 are collected from the California Solar Initiative database. CA NEM data have only been reported through May 2017.
*Bars represent the median, with error bars representing 80th and 20th percentiles
energy.gov/sunshot
$2.0
$2.5
$3.0
$3.5
$4.0
$4.5
$5.0
$5.5
$6.0
AZ CA MA NY
Syst
em P
rice
($/W
-DC)
H1 2017
$2.0
$2.5
$3.0
$3.5
$4.0
$4.5
$5.0
$5.5
$6.0
$2.0
$2.5
$3.0
$3.5
$4.0
$4.5
$5.0
$5.5
$6.0
H1 '14 H2 '14 H1 '15 H2 '15 H1 '16 H2 '16 H1 '17
Syst
em P
rice
($/W
-DC)
80th PercentileMedian System Price20th Percentile
System Pricing from Select States 10 kW–100 kW
35
• The median reported system price for PV systems 10 kW – 100 kW, in the above states, fell 10% between H1 2016 and H1 2017, to $3.78/W.
• In H1 2017 the median reported system price for PV systems 10 kW – 100 kW in Arizona was 16% lower than the median price in New York.
H1 2017 MW: AZ (28); CA (57); MA (18); NY (26).
Sources: CA NEM database; MA SREC program; Arizona Public Services and Salt River Project; NY PV Incentive Program. All programs accessed 08/02/17
Note: California pricing data before 2015 is collected from the California Solar Initiative database. CA NEM data have only been reported through May 2017.
*Bars represent the median, with error bars representing 80th and 20th percentiles
energy.gov/sunshot
$2.0
$2.5
$3.0
$3.5
$4.0
$4.5
CA MA NY
Syst
em P
rice
($/W
-DC)
H1 2017
$2
$3
$4
$5
$6
$7
$8
$9
$2
$3
$4
$5
$6
$7
$8
$9
H1 '14 H2 '14 H1 '15 H2 '15 H1 '16 H2 '16 H1 '17
Syst
em P
rice
($/W
-DC)
80th PercentileMedian System Price20th Percentile
System Pricing from Select States 100 kW–500 kW
36
• The median reported system price for PV systems 100 kW – 500 kW in the above states fell 4% between H1 2016 and H1 2017, to $2.80/W.
• In H1 2017, the median reported system price for PV systems 100 kW – 500 kW in Massachusetts was 15% lower than the median price in California.
H1 2017 MW: CA (41); MA (20); NY (17).
Sources: CA NEM database; MA SREC program; NY PV Incentive Program. All programs accessed 08/02/17
Note: California pricing data before 2015 are collected from the California Solar Initiative database. CA NEM data have only been reported through May 2017.
*Bars represent the median, with error bars representing 80th and 20th percentiles
energy.gov/sunshot
$1.5
$2.0
$2.5
$3.0
$3.5
CA MA NY
Syst
em P
rice
($/W
-DC)
H1 2017
$1
$2
$3
$4
$5
$6
$7
$1
$2
$3
$4
$5
$6
$7
H1 '14 H2 '14 H1 '15 H2 '15 H1 '16 H2 '16 H1 '17
Syst
em P
rice
($/W
-DC)
80th PercentileMedian System Price20th Percentile
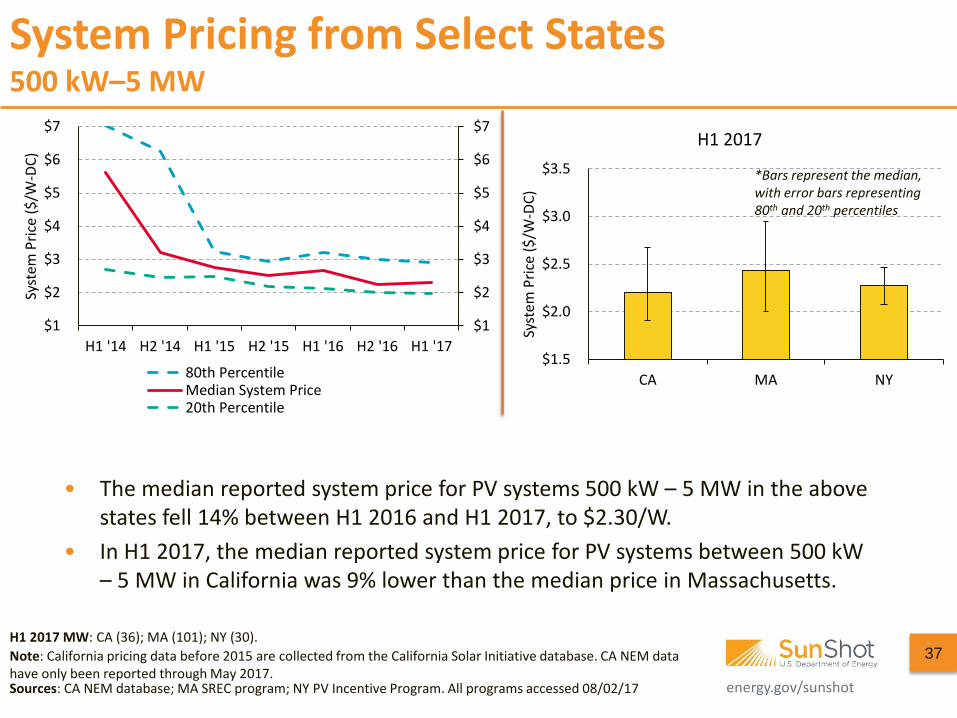
System Pricing from Select States 500 kW–5 MW
37
• The median reported system price for PV systems 500 kW – 5 MW in the above states fell 14% between H1 2016 and H1 2017, to $2.30/W.
• In H1 2017, the median reported system price for PV systems between 500 kW – 5 MW in California was 9% lower than the median price in Massachusetts.
H1 2017 MW: CA (36); MA (101); NY (30).
Sources: CA NEM database; MA SREC program; NY PV Incentive Program. All programs accessed 08/02/17
Note: California pricing data before 2015 are collected from the California Solar Initiative database. CA NEM data have only been reported through May 2017.
*Bars represent the median, with error bars representing 80th and 20th percentiles
energy.gov/sunshot energy.gov/sunshot
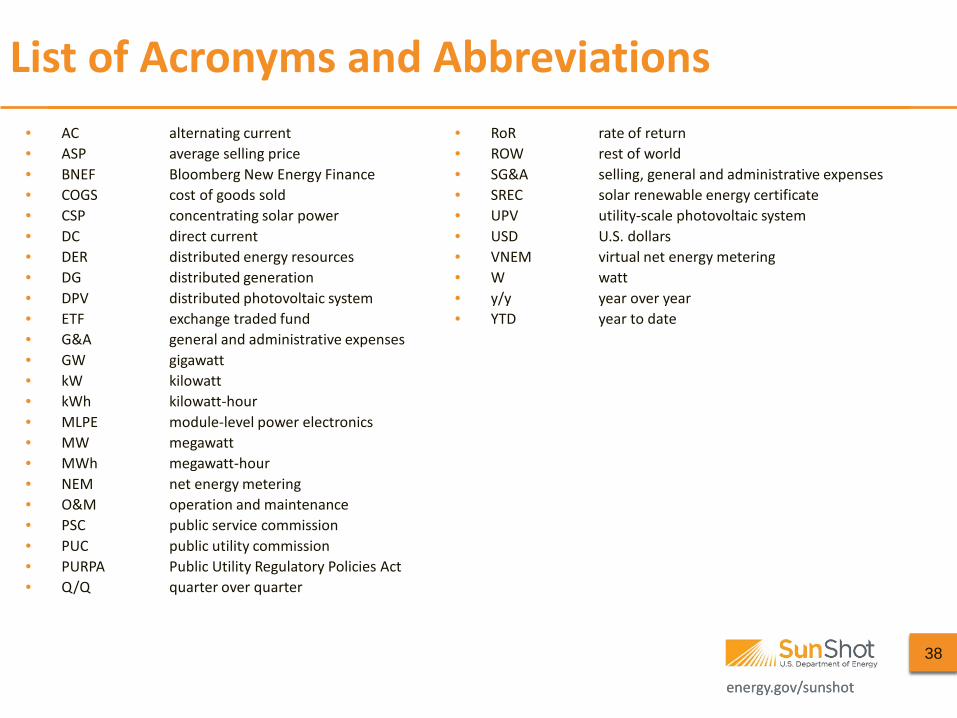
List of Acronyms and Abbreviations • AC alternating current • ASP average selling price • BNEF Bloomberg New Energy Finance • COGS cost of goods sold • CSP concentrating solar power • DC direct current • DER distributed energy resources • DG distributed generation • DPV distributed photovoltaic system • ETF exchange traded fund • G&A general and administrative expenses • GW gigawatt • kW kilowatt • kWh kilowatt-hour • MLPE module-level power electronics • MW megawatt • MWh megawatt-hour • NEM net energy metering • O&M operation and maintenance • PSC public service commission • PUC public utility commission • PURPA Public Utility Regulatory Policies Act • Q/Q quarter over quarter
• RoR rate of return • ROW rest of world • SG&A selling, general and administrative expenses • SREC solar renewable energy certificate • UPV utility-scale photovoltaic system • USD U.S. dollars • VNEM virtual net energy metering • W watt • y/y year over year • YTD year to date