16
QUARTERLY INVESTMENT REVIEW SECOND QUARTER 2010 Crestline Capital, LLC CC
| Date post: | 28-Mar-2016 |
| Category: |
Documents |
| Upload: | crestline-capital |
| View: | 216 times |
| Download: | 3 times |
QUARTERLYINVESTMENTREVIEW
SECONDQUARTER2010
Crestline Capital, LLCCC

USLargeCompaniesStocks
USSmallCompanyStocks
USREITStocks
InternaAonalDevelopedStocks
USBondMarket
USTreasuryOneMonthTreasuryBills
‐11.43% ‐9.93% ‐4.13% ‐13.97% +3.49% +0.02%
Marketsegment(IndexrepresentaAon)asfollows:USLargeCompanyStocks(S&P500Index);USSmallCompanyStocks(Russell2000Index),USValueStocks(Russell1000ValueIndex).USRealEstateMarket(DowJonesUSSelectREITIndex),InternaAonalDeveloped(MSCIEAFEIndex(netdiv.)),EmergingMarkets(MSCIEmergingMarketsIndex(grossdiv)),USBondMarket(BarclaysCapitalUSAggregateBondIndex),andTreasury(One‐MonthUSTreasuryBills).TheS&PdataareprovidedbyStandard&Poor'sIndexServicesGroup.Russelldatacopyright©RussellInvestmentGroup1995‐2010,all rightsreserved.MSCIdatacopyrightMSCI2010,all rightsreserved.DowJonesdata(formerlyDowJonesWilshire)providedbyDowJones Indexes.BarclaysCapitaldataprovidedbyBarclaysBankPLC.USlong‐termbonds,bills,andinflaAondata©Stocks,Bonds,Bills,andInflaAonYearbook™,IbbotsonAssociates,Chicago(annuallyupdatedworkbyRogerG.IbbotsonandRexA.Sinquefield).Indexperformancedoesnotreflecttheexpensesassociatedwiththemanagementofanactualporholio.Pastperformanceisnotaguaranteeoffutureresults.
MarketsUpdate:AQuarterinReviewSecondQuarter2010
EmergingMarketsStocks
‐8.29%
2
BONDSSTOCKS
USValueStocks
‐11.14%

MarketsUpdate:AQuarterinReviewSecondQuarter2010
3
• Aker four consecuAvequarterswith very strong performance,which conAnued intoApril, theUS equitymarket saw asharpreversalinMayandJuneandendedthesecondquarterwithlargenegaAvereturns.ThebroadUSmarketlostover11%inthequarter,withmostassetclassesdeliveringdouble‐digitnegaAvereturns.
• Performanceinotherdevelopedmarketsaroundtheworldwasgenerallyworse,especiallyinEurope.Indeed,theworst‐performingdevelopedmarketsinthequarterweremainlyEuropeancountriesinthemidstofseveresovereign‐debtcrisessuchasGreeceandSpain.DevelopedmarketsintheAsiaPacificregiongenerallyfaredbeler,especiallySingapore,whichhadaflatreturnandwasbyfarthebest‐performingdevelopedmarketinthesecondquarter.TheUSdollargainedgroundagainstmostmajorcurrencies,especiallytheeuroandtheAustraliandollar,whichhurtthedollar‐denominatedreturnsofdevelopedmarketequiAes.
• Akerbeingthetop‐performingassetclassin2009,emergingmarketsconAnuedtocooloffinthesecondquarter,althoughreturns thereweregenerallybeler than indevelopedcountries.As in thecaseofdevelopedmarkets, therewasmuchdispersion in theperformanceofdifferentemergingmarketsandasset classes. The fall in commoditypricesnegaAvelyimpactedtwoofthelargercommodity‐richemergingcountries,RussiaandBrazil,whichhadsharplynegaAvereturns.Ontheotherhand,somesmalleremergingmarkets,suchasChile, Indonesia,andthePhilippinesmanagedtopostposiAvereturns for the quarter. TheUS dollar also gained ground against themain emergingmarket currencies in the secondquarter,whichhurtthedollar‐denominatedreturnsofemergingmarketequiAes.
• Value stockshadmixedperformance relaAve togrowthstocks in theUSduring the secondquarter. Inotherdevelopedmarkets, value stocks greatly underperformed growth stocks across all market capitalizaAon segments. In emergingmarkets,valuestocksoutperformedgrowthstocksacrossallmarketcapitalizaAonsegments.
• AlongthemarketcapitalizaAondimension,smallcapsoutperformedlargecapsintheUS,inotherdevelopedmarkets,andinemergingmarkets.
• NotwithstandingtheconAnuedweaknessinthecommercialandresidenAalrealestatemarkets,realestatesecuriAeshadnegaAvereturns,butgoodperformancerelaAvetootherassetclasses.
• FixedincomesecuriAeshadgoodreturnsinthesecondquarter,astherewasaflighttosafetyinthesecondquarterasaresultofthesovereigndebtproblemsinEuropeandweakeconomicdataintheUSandabroad.IntermediategovernmentsecuriAesandinflaAon‐protectedsecuriAesdidparAcularlywell.
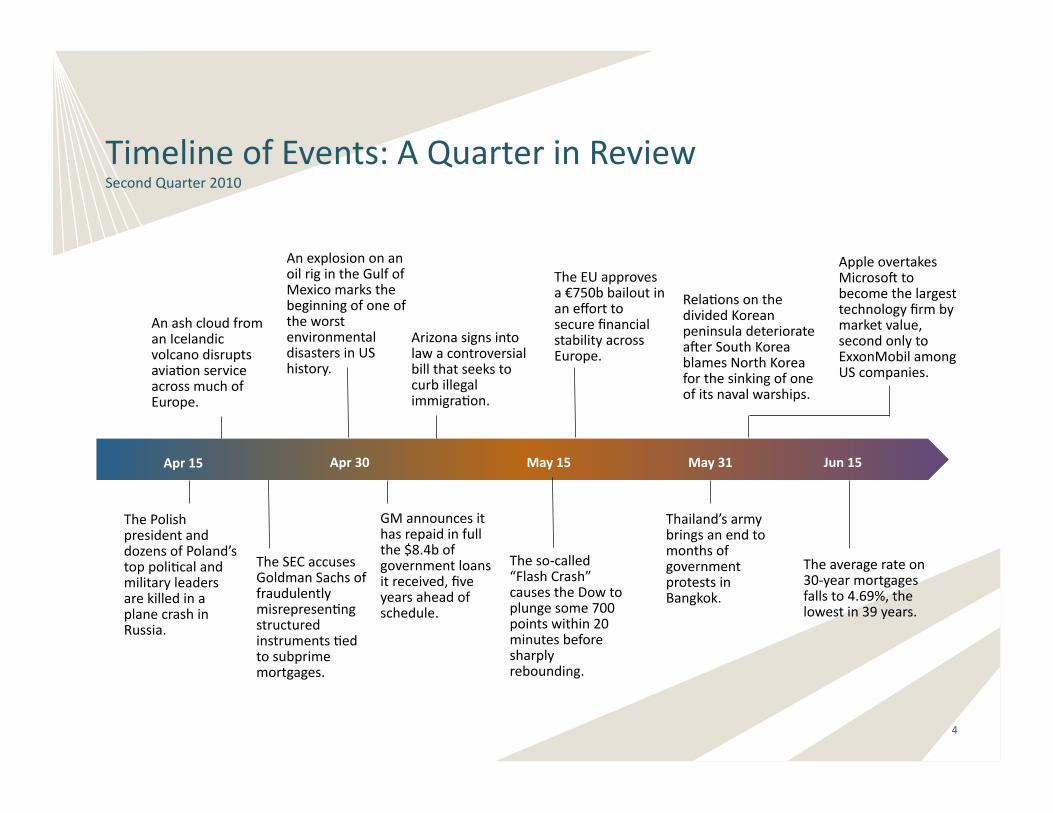
TimelineofEvents:AQuarterinReviewSecondQuarter2010
ThePolishpresidentanddozensofPoland’stoppoliAcalandmilitaryleadersarekilledinaplanecrashinRussia.
Thailand’sarmybringsanendtomonthsofgovernmentprotestsinBangkok.
GMannouncesithasrepaidinfullthe$8.4bofgovernmentloansitreceived,fiveyearsaheadofschedule.
Apr15 May31 Jun15
AnexplosiononanoilrigintheGulfofMexicomarksthebeginningofoneoftheworstenvironmentaldisastersinUShistory.
ArizonasignsintolawacontroversialbillthatseekstocurbillegalimmigraAon.
Theso‐called“FlashCrash”causestheDowtoplungesome700pointswithin20minutesbeforesharplyrebounding.
May15
TheEUapprovesa€750bbailoutinanefforttosecurefinancialstabilityacrossEurope.
Apr30
AnashcloudfromanIcelandicvolcanodisruptsaviaAonserviceacrossmuchofEurope.
TheSECaccusesGoldmanSachsoffraudulentlymisrepresenAngstructuredinstrumentsAedtosubprimemortgages.
RelaAonsonthedividedKoreanpeninsuladeteriorateakerSouthKoreablamesNorthKoreaforthesinkingofoneofitsnavalwarships.
Theaveragerateon30‐yearmortgagesfallsto4.69%,thelowestin39years.
AppleovertakesMicrosoktobecomethelargesttechnologyfirmbymarketvalue,secondonlytoExxonMobilamongUScompanies.
4
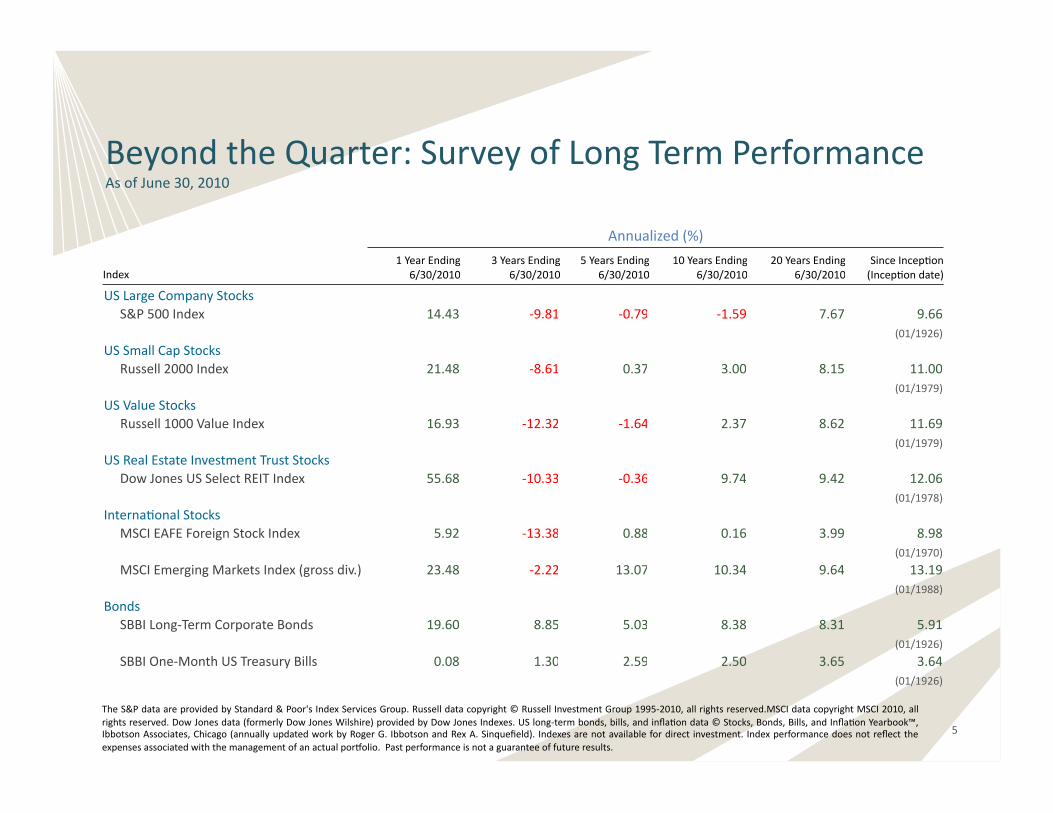
Annualized(%)
Index1YearEnding
6/30/20103YearsEnding
6/30/20105YearsEnding
6/30/201010YearsEnding
6/30/201020YearsEnding
6/30/2010SinceIncepAon(IncepAondate)
USLargeCompanyStocksS&P500Index 14.43 ‐9.81 ‐0.79 ‐1.59 7.67 9.66
(01/1926)
USSmallCapStocksRussell2000Index 21.48 ‐8.61 0.37 3.00 8.15 11.00
(01/1979)
USValueStocksRussell1000ValueIndex 16.93 ‐12.32 ‐1.64 2.37 8.62 11.69
(01/1979)
USRealEstateInvestmentTrustStocksDowJonesUSSelectREITIndex 55.68 ‐10.33 ‐0.36 9.74 9.42 12.06
(01/1978)
InternaAonalStocksMSCIEAFEForeignStockIndex 5.92 ‐13.38 0.88 0.16 3.99 8.98
(01/1970)
MSCIEmergingMarketsIndex(grossdiv.) 23.48 ‐2.22 13.07 10.34 9.64 13.19(01/1988)
BondsSBBILong‐TermCorporateBonds 19.60 8.85 5.03 8.38 8.31 5.91
(01/1926)
SBBIOne‐MonthUSTreasuryBills 0.08 1.30 2.59 2.50 3.65 3.64(01/1926)
BeyondtheQuarter:SurveyofLongTermPerformanceAsofJune30,2010
5
TheS&PdataareprovidedbyStandard&Poor'sIndexServicesGroup.Russelldatacopyright©RussellInvestmentGroup1995‐2010,allrightsreserved.MSCIdatacopyrightMSCI2010,allrightsreserved.DowJonesdata(formerlyDowJonesWilshire)providedbyDowJonesIndexes.USlong‐termbonds,bills,andinflaAondata©Stocks,Bonds,Bills,andInflaAonYearbook™,IbbotsonAssociates,Chicago(annuallyupdatedworkbyRogerG.IbbotsonandRexA.Sinquefield). Indexesarenotavailablefordirect investment. Indexperformancedoesnotreflecttheexpensesassociatedwiththemanagementofanactualporholio.Pastperformanceisnotaguaranteeoffutureresults.
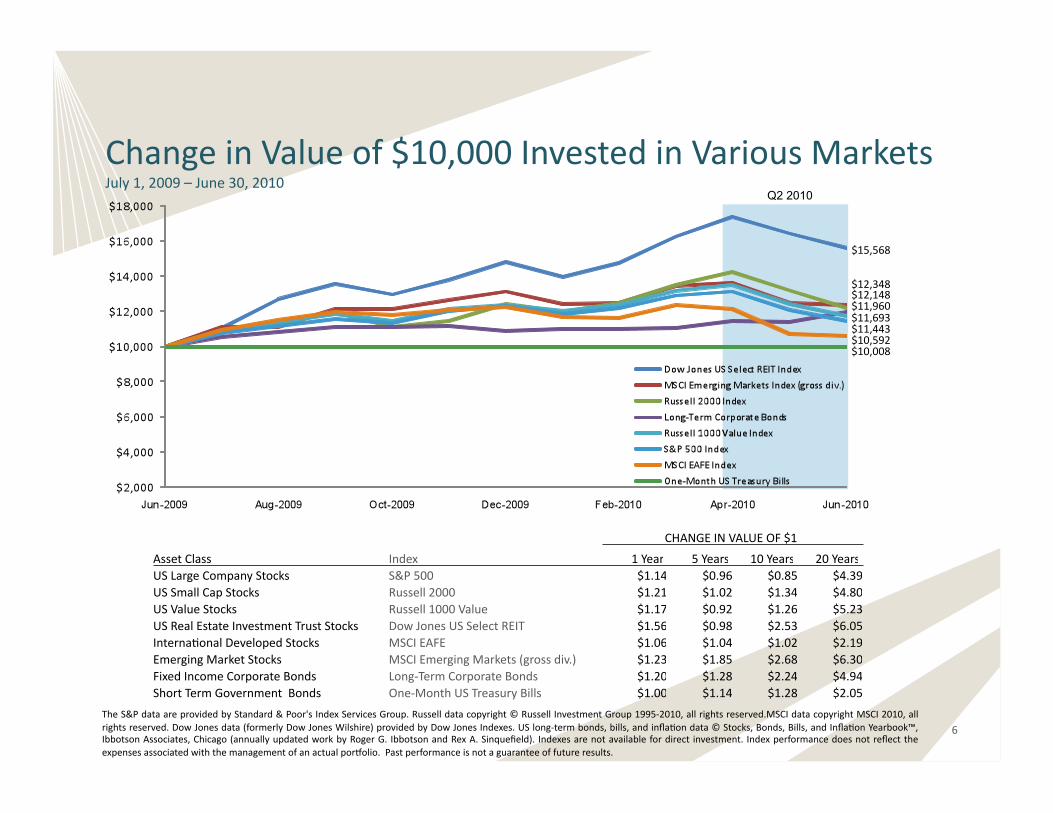
ChangeinValueof$10,000InvestedinVariousMarketsJuly1,2009–June30,2010
Q2 2010
$12,348$12,148$11,960
$11,443
$10,008
$11,693
$10,592
6
CHANGEINVALUEOF$1
AssetClass Index 1Year 5Years 10Years 20YearsUSLargeCompanyStocks S&P500 $1.14 $0.96 $0.85 $4.39USSmallCapStocks Russell2000 $1.21 $1.02 $1.34 $4.80USValueStocks Russell1000Value $1.17 $0.92 $1.26 $5.23USRealEstateInvestmentTrustStocks DowJonesUSSelectREIT $1.56 $0.98 $2.53 $6.05InternaAonalDevelopedStocks MSCIEAFE $1.06 $1.04 $1.02 $2.19EmergingMarketStocks MSCIEmergingMarkets(grossdiv.) $1.23 $1.85 $2.68 $6.30FixedIncomeCorporateBonds Long‐TermCorporateBonds $1.20 $1.28 $2.24 $4.94ShortTermGovernmentBonds One‐MonthUSTreasuryBills $1.00 $1.14 $1.28 $2.05
TheS&PdataareprovidedbyStandard&Poor'sIndexServicesGroup.Russelldatacopyright©RussellInvestmentGroup1995‐2010,allrightsreserved.MSCIdatacopyrightMSCI2010,allrightsreserved.DowJonesdata(formerlyDowJonesWilshire)providedbyDowJonesIndexes.USlong‐termbonds,bills,andinflaAondata©Stocks,Bonds,Bills,andInflaAonYearbook™,IbbotsonAssociates,Chicago(annuallyupdatedworkbyRogerG.IbbotsonandRexA.Sinquefield). Indexesarenotavailablefordirect investment. Indexperformancedoesnotreflecttheexpensesassociatedwiththemanagementofanactualporholio.Pastperformanceisnotaguaranteeoffutureresults.
$15,568
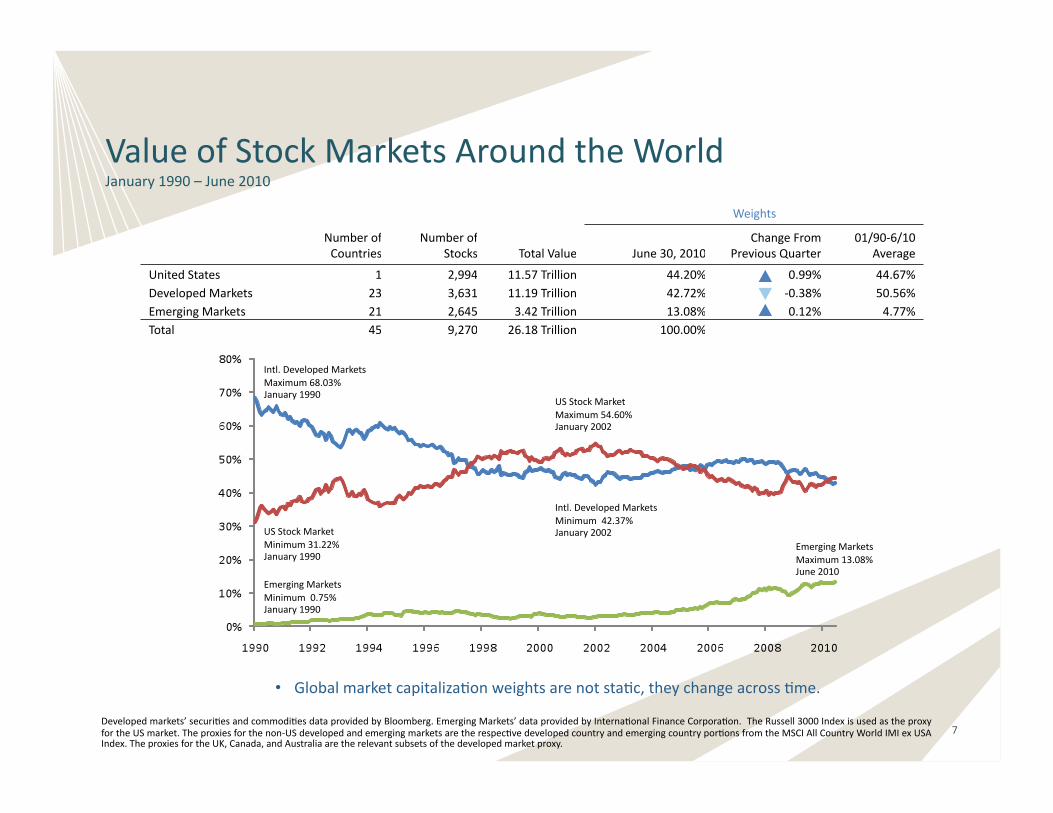
ValueofStockMarketsAroundtheWorldJanuary1990–June2010
• GlobalmarketcapitalizaAonweightsarenotstaAc,theychangeacrossAme.
Developedmarkets’securiAesandcommodiAesdataprovidedbyBloomberg.EmergingMarkets’dataprovidedbyInternaAonalFinanceCorporaAon.TheRussell3000IndexisusedastheproxyfortheUSmarket.Theproxiesforthenon‐USdevelopedandemergingmarketsaretherespecAvedevelopedcountryandemergingcountryporAonsfromtheMSCIAllCountryWorldIMIexUSAIndex.TheproxiesfortheUK,Canada,andAustraliaaretherelevantsubsetsofthedevelopedmarketproxy.
Weights
NumberofCountries
NumberofStocks TotalValue June30,2010
ChangeFromPreviousQuarter
01/90‐6/10Average
UnitedStates 1 2,994 11.57Trillion 44.20% 0.99% 44.67%DevelopedMarkets 23 3,631 11.19Trillion 42.72% ‐0.38% 50.56%EmergingMarkets 21 2,645 3.42Trillion 13.08% 0.12% 4.77%Total 45 9,270 26.18Trillion 100.00%
Intl.DevelopedMarketsMaximum68.03%January1990
USStockMarketMinimum31.22%January1990
EmergingMarketsMinimum0.75%January1990
Intl.DevelopedMarketsMinimum42.37%January2002
USStockMarketMaximum54.60%January2002
EmergingMarketsMaximum13.08%June2010
7
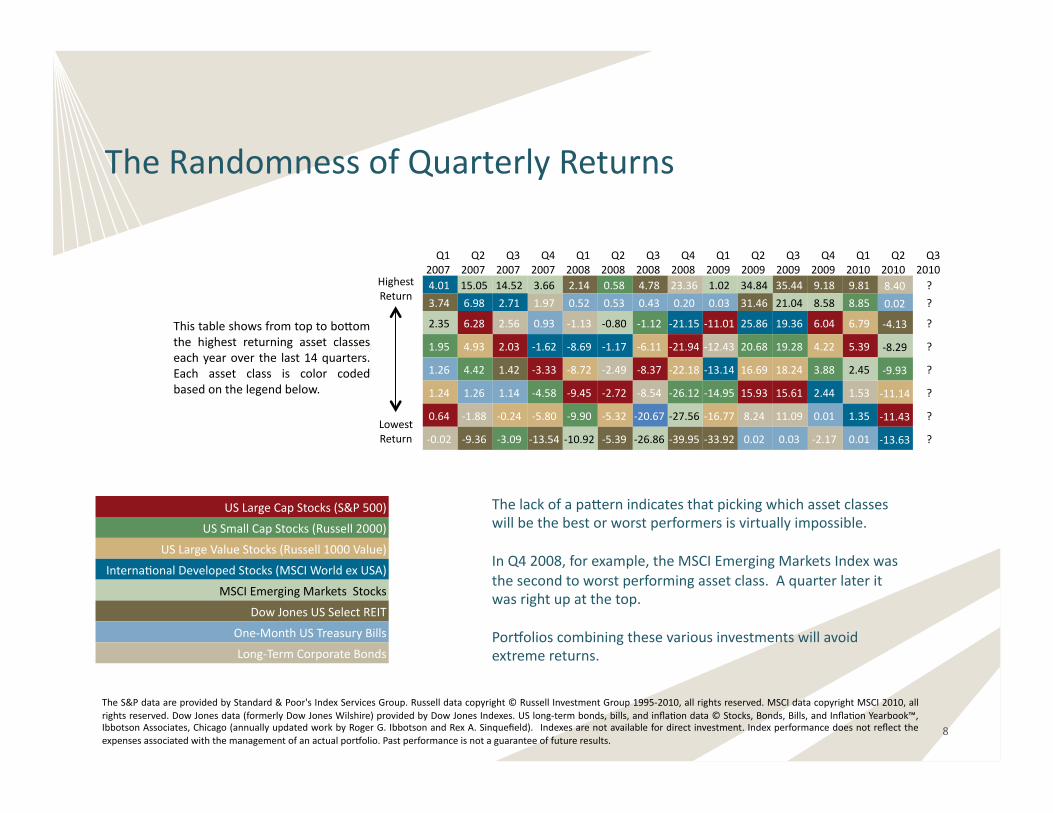
TheRandomnessofQuarterlyReturns
Q12007
Q22007
Q32007
Q42007
Q12008
Q22008
Q32008
Q42008
Q12009
Q22009
Q32009
Q42009
Q12010
Q22010
Q32010
4.01 15.05 14.52 3.66 2.14 0.58 4.78 23.36 1.02 34.84 35.44 9.18 9.81 8.40 ?
3.74 6.98 2.71 1.97 0.52 0.53 0.43 0.20 0.03 31.46 21.04 8.58 8.85 0.02 ?
2.35 6.28 2.56 0.93 ‐1.13 ‐0.80 ‐1.12 ‐21.15 ‐11.01 25.86 19.36 6.04 6.79 ‐4.13 ?
div.) 1.95 4.93 2.03 ‐1.62 ‐8.69 ‐1.17 ‐6.11 ‐21.94 ‐12.43 20.68 19.28 4.22 5.39 ‐8.29 ?
) 1.26 4.42 1.42 ‐3.33 ‐8.72 ‐2.49 ‐8.37 ‐22.18 ‐13.14 16.69 18.24 3.88 2.45 ‐9.93 ?
1.24 1.26 1.14 ‐4.58 ‐9.45 ‐2.72 ‐8.54 ‐26.12 ‐14.95 15.93 15.61 2.44 1.53 ‐11.14 ?
0.64 ‐1.88 ‐0.24 ‐5.80 ‐9.90 ‐5.32 ‐20.67 ‐27.56 ‐16.77 8.24 11.09 0.01 1.35 ‐11.43 ?
‐0.02 ‐9.36 ‐3.09 ‐13.54 ‐10.92 ‐5.39 ‐26.86 ‐39.95 ‐33.92 0.02 0.03 ‐2.17 0.01 ‐13.63 ?
TheS&PdataareprovidedbyStandard&Poor'sIndexServicesGroup.Russelldatacopyright©RussellInvestmentGroup1995‐2010,allrightsreserved.MSCIdatacopyrightMSCI2010,allrightsreserved.DowJonesdata(formerlyDowJonesWilshire)providedbyDowJonesIndexes.USlong‐termbonds,bills,andinflaAondata©Stocks,Bonds,Bills,andInflaAonYearbook™,IbbotsonAssociates,Chicago(annuallyupdatedworkbyRogerG.IbbotsonandRexA.Sinquefield). Indexesarenotavailablefordirectinvestment.Indexperformancedoesnotreflecttheexpensesassociatedwiththemanagementofanactualporholio.Pastperformanceisnotaguaranteeoffutureresults.
HighestReturn
LowestReturn
Thistableshowsfromtoptobolomthe highest returning asset classeseachyearover the last14quarters.Each asset class is color codedbasedonthelegendbelow.
Thelackofapalernindicatesthatpickingwhichassetclasseswillbethebestorworstperformersisvirtuallyimpossible.
InQ42008,forexample,theMSCIEmergingMarketsIndexwasthesecondtoworstperformingassetclass.Aquarterlateritwasrightupatthetop.
Porholioscombiningthesevariousinvestmentswillavoidextremereturns.
8
USLargeCapStocks(S&P500)
USSmallCapStocks(Russell2000)
USLargeValueStocks(Russell1000Value)
InternaAonalDevelopedStocks(MSCIWorldexUSA)
MSCIEmergingMarketsStocks
DowJonesUSSelectREIT
One‐MonthUSTreasuryBills
Long‐TermCorporateBonds
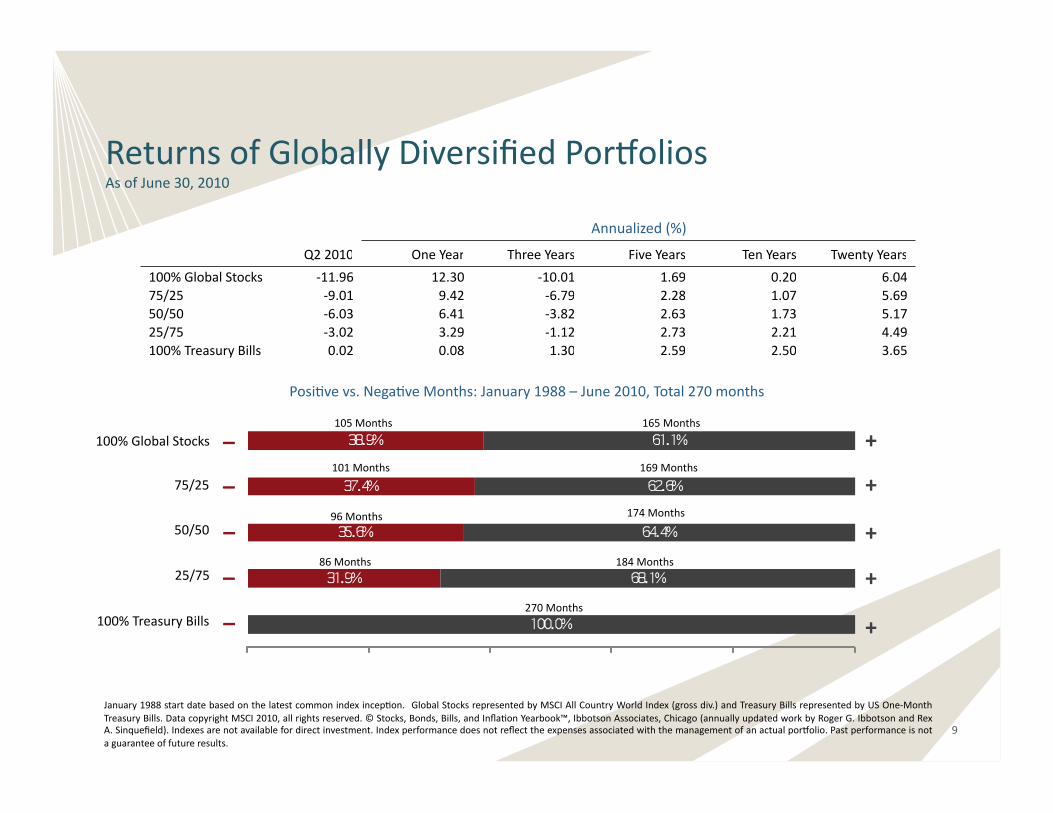
ReturnsofGloballyDiversifiedPorholiosAsofJune30,2010
January1988startdatebasedonthelatestcommonindexincepAon. GlobalStocksrepresentedbyMSCIAllCountryWorldIndex(grossdiv.)andTreasuryBillsrepresentedbyUSOne‐MonthTreasuryBills.DatacopyrightMSCI2010,allrightsreserved.©Stocks,Bonds,Bills,andInflaAonYearbook™,IbbotsonAssociates,Chicago(annuallyupdatedworkbyRogerG.IbbotsonandRexA.Sinquefield).Indexesarenotavailablefordirectinvestment.Indexperformancedoesnotreflecttheexpensesassociatedwiththemanagementofanactualporholio.Pastperformanceisnotaguaranteeoffutureresults.
Annualized(%)
Q22010 OneYear ThreeYears FiveYears TenYears TwentyYears
100%GlobalStocks ‐11.96 12.30 ‐10.01 1.69 0.20 6.0475/25 ‐9.01 9.42 ‐6.79 2.28 1.07 5.6950/50 ‐6.03 6.41 ‐3.82 2.63 1.73 5.1725/75 ‐3.02 3.29 ‐1.12 2.73 2.21 4.49100%TreasuryBills 0.02 0.08 1.30 2.59 2.50 3.65
100%GlobalStocks
50/50
25/75
100%TreasuryBills
75/25
105Months 165Months
101Months 169Months
96Months 174Months
86Months 184Months
270Months
–
–
–
–
–
+
+
+
+
+
PosiAvevs.NegaAveMonths:January1988–June2010,Total270months
9
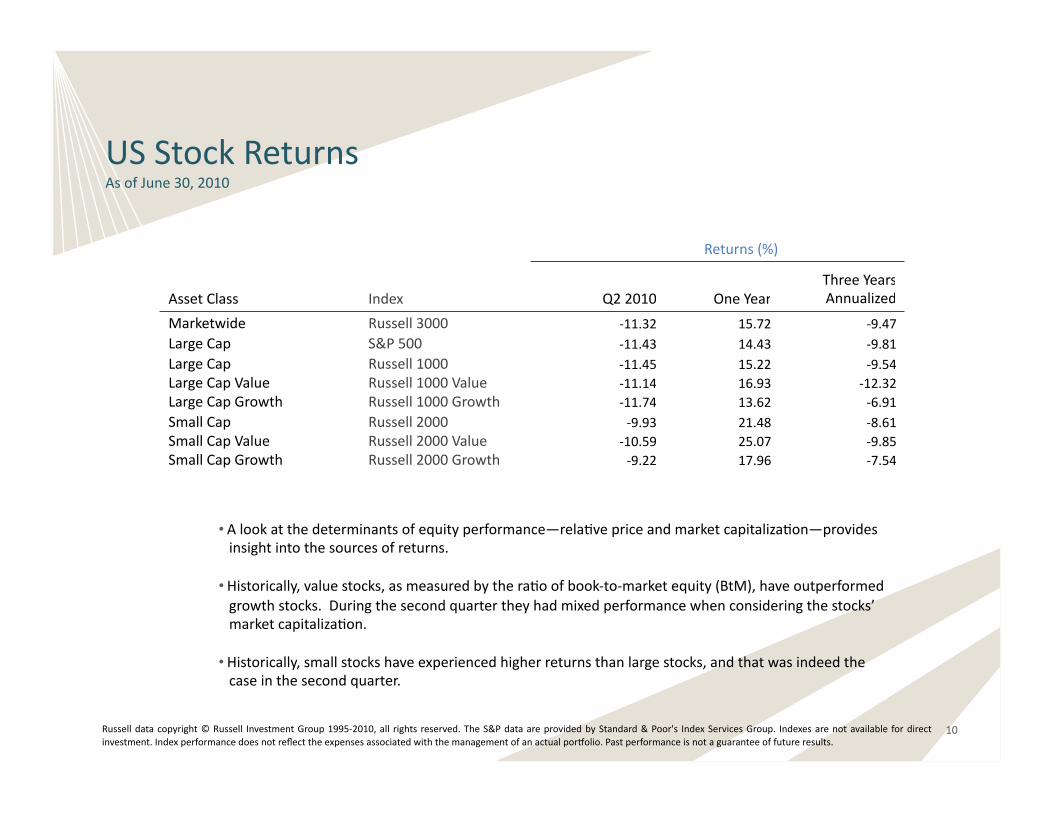
USStockReturnsAsofJune30,2010
Russelldatacopyright©Russell InvestmentGroup1995‐2010,all rights reserved.TheS&PdataareprovidedbyStandard&Poor's IndexServicesGroup. Indexesarenotavailable fordirectinvestment.Indexperformancedoesnotreflecttheexpensesassociatedwiththemanagementofanactualporholio.Pastperformanceisnotaguaranteeoffutureresults.
Returns(%)
AssetClass Index Q22010 OneYearThreeYearsAnnualized
Marketwide Russell3000 ‐11.32 15.72 ‐9.47LargeCap S&P500 ‐11.43 14.43 ‐9.81LargeCap Russell1000 ‐11.45 15.22 ‐9.54LargeCapValue Russell1000Value ‐11.14 16.93 ‐12.32LargeCapGrowth Russell1000Growth ‐11.74 13.62 ‐6.91SmallCap Russell2000 ‐9.93 21.48 ‐8.61SmallCapValue Russell2000Value ‐10.59 25.07 ‐9.85SmallCapGrowth Russell2000Growth ‐9.22 17.96 ‐7.54
• Alookatthedeterminantsofequityperformance—relaAvepriceandmarketcapitalizaAon—providesinsightintothesourcesofreturns.
• Historically,valuestocks,asmeasuredbytheraAoofbook‐to‐marketequity(BtM),haveoutperformedgrowthstocks.Duringthesecondquartertheyhadmixedperformancewhenconsideringthestocks’marketcapitalizaAon.
• Historically,smallstockshaveexperiencedhigherreturnsthanlargestocks,andthatwasindeedthecaseinthesecondquarter.
10
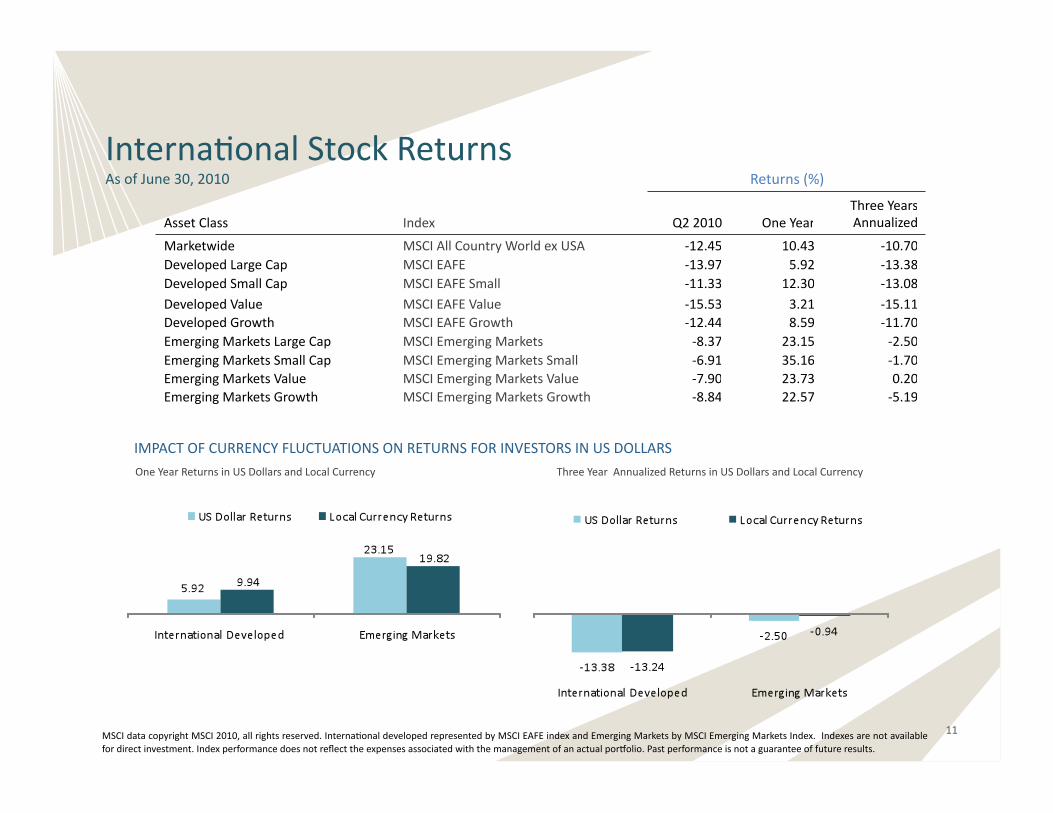
InternaAonalStockReturnsAsofJune30,2010 Returns(%)
AssetClass Index Q22010 OneYearThreeYearsAnnualized
Marketwide MSCIAllCountryWorldexUSA ‐12.45 10.43 ‐10.70DevelopedLargeCap MSCIEAFE ‐13.97 5.92 ‐13.38DevelopedSmallCap MSCIEAFESmall ‐11.33 12.30 ‐13.08DevelopedValue MSCIEAFEValue ‐15.53 3.21 ‐15.11DevelopedGrowth MSCIEAFEGrowth ‐12.44 8.59 ‐11.70EmergingMarketsLargeCap MSCIEmergingMarkets ‐8.37 23.15 ‐2.50EmergingMarketsSmallCap MSCIEmergingMarketsSmall ‐6.91 35.16 ‐1.70EmergingMarketsValue MSCIEmergingMarketsValue ‐7.90 23.73 0.20EmergingMarketsGrowth MSCIEmergingMarketsGrowth ‐8.84 22.57 ‐5.19
MSCIdatacopyrightMSCI2010,allrightsreserved.InternaAonaldevelopedrepresentedbyMSCIEAFEindexandEmergingMarketsbyMSCIEmergingMarketsIndex.Indexesarenotavailablefordirectinvestment.Indexperformancedoesnotreflecttheexpensesassociatedwiththemanagementofanactualporholio.Pastperformanceisnotaguaranteeoffutureresults.
IMPACTOFCURRENCYFLUCTUATIONSONRETURNSFORINVESTORSINUSDOLLARSOneYearReturnsinUSDollarsandLocalCurrency ThreeYearAnnualizedReturnsinUSDollarsandLocalCurrency
11
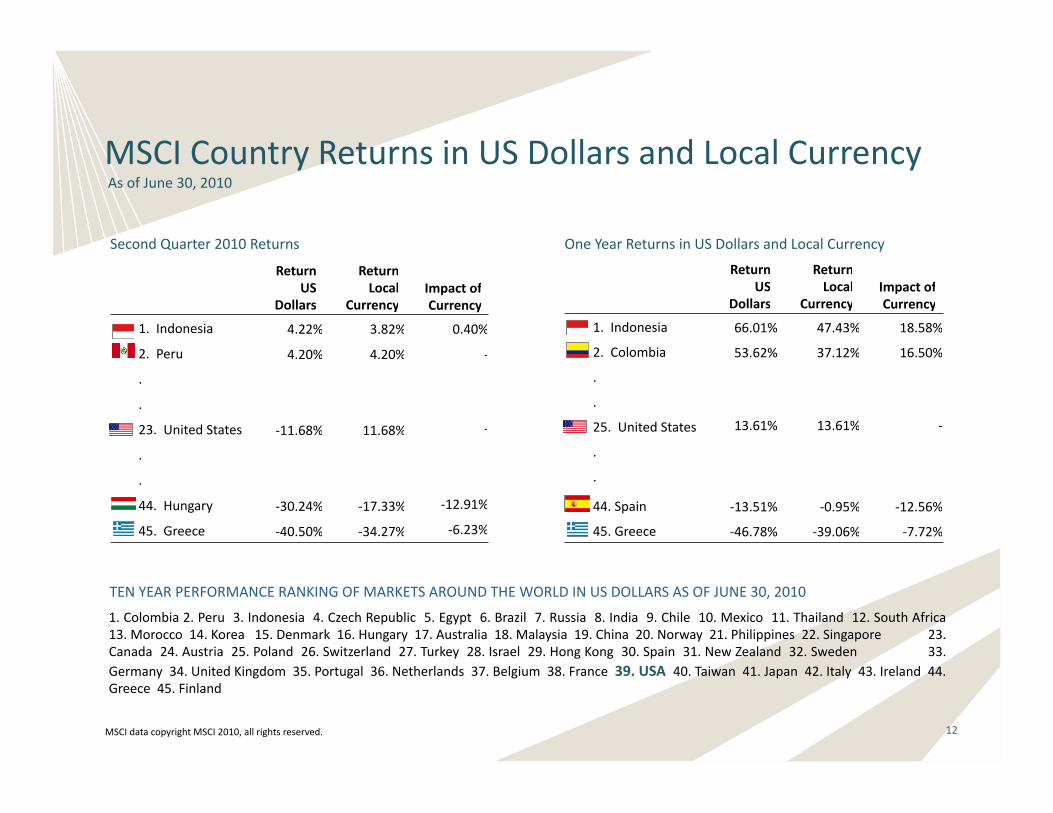
OneYearReturnsinUSDollarsandLocalCurrency
ReturnUS
Dollars
ReturnLocal
CurrencyImpactofCurrency
1.Indonesia 66.01% 47.43% 18.58%
2.Colombia 53.62% 37.12% 16.50%
.
.
25.UnitedStates 13.61% 13.61% ‐
.
.
44.Spain ‐13.51% ‐0.95% ‐12.56%
45.Greece ‐46.78% ‐39.06% ‐7.72%
SecondQuarter2010Returns
ReturnUS
Dollars
ReturnLocal
CurrencyImpactofCurrency
1. Indonesia 4.22% 3.82% 0.40%
2.Peru 4.20% 4.20% ‐
.
.
23.UnitedStates ‐11.68% 11.68% ‐
.
.
44.Hungary ‐30.24% ‐17.33% ‐12.91%
45.Greece ‐40.50% ‐34.27% ‐6.23%
MSCICountryReturnsinUSDollarsandLocalCurrencyAsofJune30,2010
12MSCIdatacopyrightMSCI2010,allrightsreserved.
TENYEARPERFORMANCERANKINGOFMARKETSAROUNDTHEWORLDINUSDOLLARSASOFJUNE30,2010
1.Colombia2.Peru3.Indonesia4.CzechRepublic5.Egypt6.Brazil 7.Russia8.India9.Chile10.Mexico11.Thailand12.SouthAfrica13.Morocco14.Korea15.Denmark16.Hungary17.Australia18.Malaysia19.China20.Norway21.Philippines22.Singapore23.Canada24.Austria25.Poland26.Switzerland27.Turkey28.Israel29.HongKong30.Spain31.NewZealand32.Sweden33.Germany34.UnitedKingdom35.Portugal36.Netherlands37.Belgium38.France39.USA40.Taiwan41.Japan42.Italy43.Ireland44.Greece45.Finland
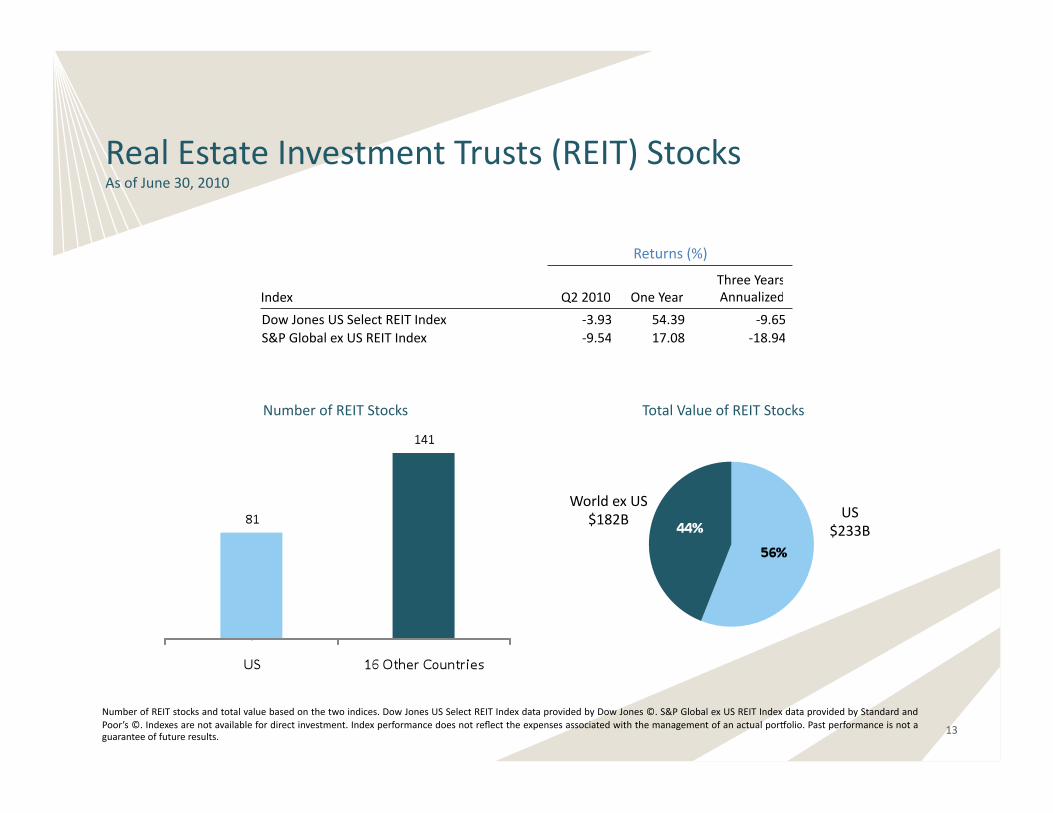
RealEstateInvestmentTrusts(REIT)StocksAsofJune30,2010
NumberofREITstocksandtotalvaluebasedonthetwoindices.DowJonesUSSelectREITIndexdataprovidedbyDowJones©.S&PGlobalexUSREITIndexdataprovidedbyStandardandPoor’s©.Indexesarenotavailablefordirectinvestment.Indexperformancedoesnotreflecttheexpensesassociatedwiththemanagementofanactualporholio.Pastperformanceisnotaguaranteeoffutureresults.
13
Returns(%)
Index Q22010 OneYearThreeYearsAnnualized
DowJonesUSSelectREITIndex ‐3.93 54.39 ‐9.65 S&PGlobalexUSREITIndex ‐9.54 17.08 ‐18.94
NumberofREITStocks TotalValueofREITStocks
56%
US$233B
WorldexUS$182B
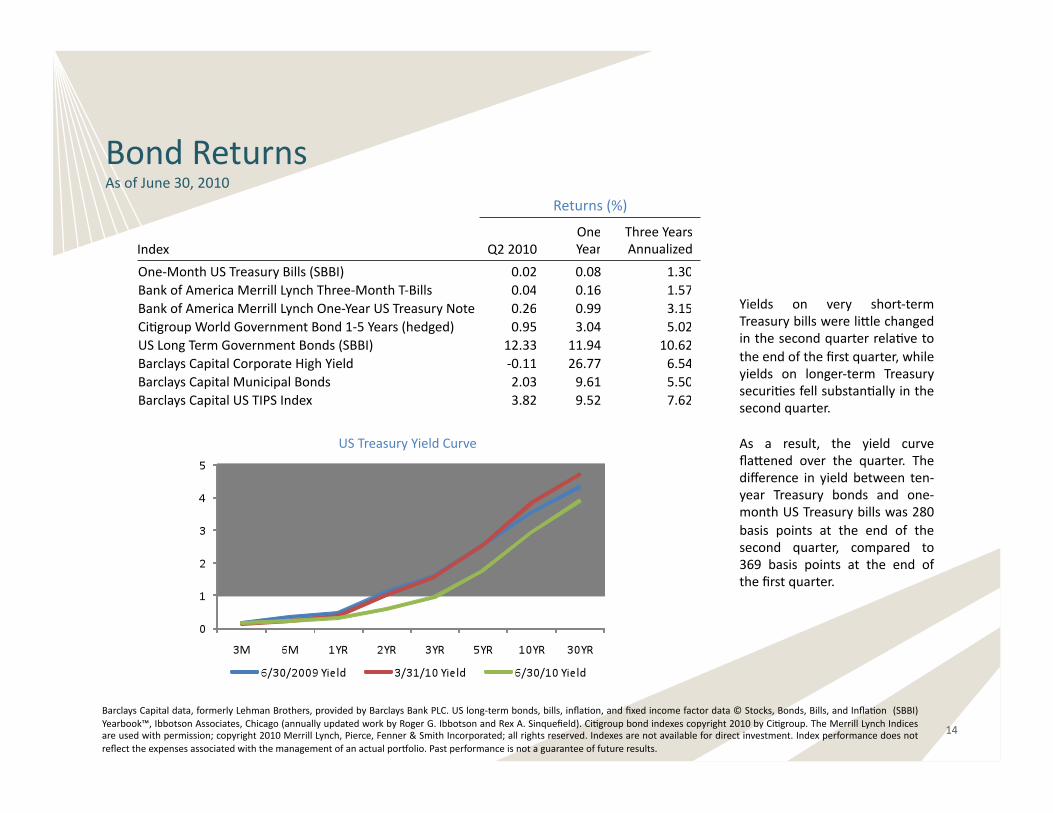
BondReturnsAsofJune30,2010
BarclaysCapitaldata,formerlyLehmanBrothers,providedbyBarclaysBankPLC.USlong‐termbonds,bills,inflaAon,andfixedincomefactordata©Stocks,Bonds,Bills,andInflaAon (SBBI)Yearbook™,IbbotsonAssociates,Chicago(annuallyupdatedworkbyRogerG.IbbotsonandRexA.Sinquefield).CiAgroupbondindexescopyright2010byCiAgroup.TheMerrillLynchIndicesareusedwithpermission;copyright2010MerrillLynch,Pierce,Fenner&SmithIncorporated;allrightsreserved.Indexesarenotavailablefordirectinvestment.Indexperformancedoesnotreflecttheexpensesassociatedwiththemanagementofanactualporholio.Pastperformanceisnotaguaranteeoffutureresults.
Returns(%)
Index Q22010OneYear
ThreeYearsAnnualized
One‐MonthUSTreasuryBills(SBBI) 0.02 0.08 1.30BankofAmericaMerrillLynchThree‐MonthT‐Bills 0.04 0.16 1.57BankofAmericaMerrillLynchOne‐YearUSTreasuryNote 0.26 0.99 3.15CiAgroupWorldGovernmentBond1‐5Years(hedged) 0.95 3.04 5.02USLongTermGovernmentBonds(SBBI) 12.33 11.94 10.62BarclaysCapitalCorporateHighYield ‐0.11 26.77 6.54BarclaysCapitalMunicipalBonds 2.03 9.61 5.50BarclaysCapitalUSTIPSIndex 3.82 9.52 7.62
USTreasuryYieldCurve
Yields on very short‐termTreasurybillswerelillechangedinthesecondquarterrelaAvetotheendofthefirstquarter,whileyields on longer‐term TreasurysecuriAesfellsubstanAallyinthesecondquarter.
As a result, the yield curveflalened over the quarter. Thedifference in yield between ten‐year Treasury bonds and one‐monthUSTreasurybillswas280basis points at the end of thesecond quarter, compared to369 basis points at the end ofthefirstquarter.
14
15TreasuryNotesdatasource:Bloomberg.WallStreetJournalsurveyavailableathlp://online.wsj.com/.
QuarterlyTopic:ForecasAngInterestRatesSecondQuarter2010
It seemed so obvious. With the economy slowly recovering last year from the worst recession in decades and the federalgovernmentspendingtensofbillionstosAmulatejobgrowth,bothlaymenandexpertsalikeseemedtoagreethatinterestrateshadnowheretogobutup.Theyieldontheten‐yearU.S.TreasurynoteasofJune30,2009was3.52%,downfrom5.25%inJune2007butwellabovethe2.09%levelregisteredamidsttheworstofthecreditcrisisthepreviousDecember.WithretailsalesandhousingacAvityshowingsignsofgradualimprovement,theonlyquesAonappearedtobehowmuchhigherinterestrateswouldgo.
Amongfikyeconomic forecasters surveyedby theWSJ in2009, forty‐threeexpected the ten‐yearU.S.Treasurynoteyield tomovehigherovertheyearahead,withanaverageesAmateof4.13%.Sevenexpectedarateof5.00%orhigherwhileonlytwopredictedratestofallbelow3.00%.Theresult?Theten‐yearTreasuryyieldslumpedto2.95%onJune30,2010andrateson30‐yearmortgagesfelltotheirlowestlevelsinceFannieMaebegantrackingthemin1971.
Someobserversmaybetemptedtopokefunatthesehapless“experts”,implyingtheyareincompetentorpoorlyinformed.ThisinterpretaAon is flawed since it suggests that a teamof beler expertswould achieve amore accurate result. AmoreusefulexplanaAon is that even the most talented analysts are unlikely to make reliable predicAons and the poor showing by thisparAculargroupissimplywhatwewouldexpecttosee,justasokenasnot,ifmarketsareworkingfreelyandfairly.Today’sbondpricesalreadyreflectexpectaAonsfortomorrow’sbusinesscondiAonsandinflaAonandtheseexpectaAonscanchangequicklyinresponsetonewinformaAon.HowevertempAngitmaybetobelievethatwecanpredictthefuturebelerthanothermarketparAcipants throughcareful study, the resultsof theWSJ surveyaswell asnumerousotherefforts suggest this confidence ismisplaced.
Whatisthemessageforinvestors?PredicAnginterestratesandbondpricesisnoeasierthanpredicAngstockprices,andmakingdecisionsbasedonwhatappeartobecertainoutcomesattheAmecanokenprovecostly.Many investorsreconfiguredtheirporholiosinanAcipaAonofhigherinterestratesandhavepenalizedtheirresultswhiletheyarewaiAng. Insteadofseekingtopredicttheunpredictable,investorsaremuchmorelikelytoenhancetheirresultsbyfocusingontheelementstheycancontrol–riskexposure,diversificaAonandminimizingcostsandtaxes.

16
MichaelMoore
1120CrestlineCourt•LakeOswego•OR97034
Telephone:503‐635‐4457
www.crestlinecapital.net
Crestline Capital, LLCCC


