Q2 2015 results July 29, 2015 FORENOTE All historic data are restated for comparison purposes, unless otherwise indicated. Solvay presents Adjusted Income Statement performance indicators that exclude non- cash Purchase Price Allocation (PPA) accounting impacts related to the Rhodia acquisition.
Transcript
Q2 2015 results
July 29, 2015
FORENOTE
All historic data are restated for comparison purposes, unless otherwise indicated.
Solvay presents Adjusted Income Statement performance indicators that exclude non-cash Purchase Price Allocation (PPA) accounting impacts related to the Rhodia acquisition.
Safe harbor
29/07/2015
Q2 2015 results 2
This presentation may contain forward-looking information. Forward-looking statements describe expectations, plans, strategies, goals, future events or intentions. The achievement of forward-looking statements contained in this presentation is subject to risks and uncertainties relating to a number of factors, including general economic factors, interest rate and foreign currency exchange rate fluctuations, changing market conditions, product competition, the nature of product development, impact of acquisitions and divestitures, restructurings, products withdrawals, regulatory approval processes, all-in scenario of R&D projects and other unusual items.
Consequently, actual results or future events may differ materially from those expressed or implied by such forward-looking statements. Should known or unknown risks or uncertainties materialize, or should our assumptions prove inaccurate, actual results could vary materially from those anticipated. The Company undertakes no obligation to publicly update or revise any forward-looking statements.
29/07/2015
Q2 2015 results 3
Growth supported by forex Volumes drop offset by pricing power
Supportive forex Across all operating segments Translation forex impact increasing
as hedging gradually rolls over
Volumes drop offset by pricing power Innovation-driven growth more than offset by persistent
substantial contraction of O&G and acetate tow market Pricing power across all operating segments, supported
by excellence programs and lower raw material prices
Portfolio transformation progressing INOVYN JV for European chlorovinyls created on July 1
Sale of refrigerants business (and PCC sale on-going) Ryton and Flux being integrated successfully
REBITDA
€ 500 m +8.1% yoy
Margin 19% + 66 bp
29/07/2015
Q2 2015 results 4
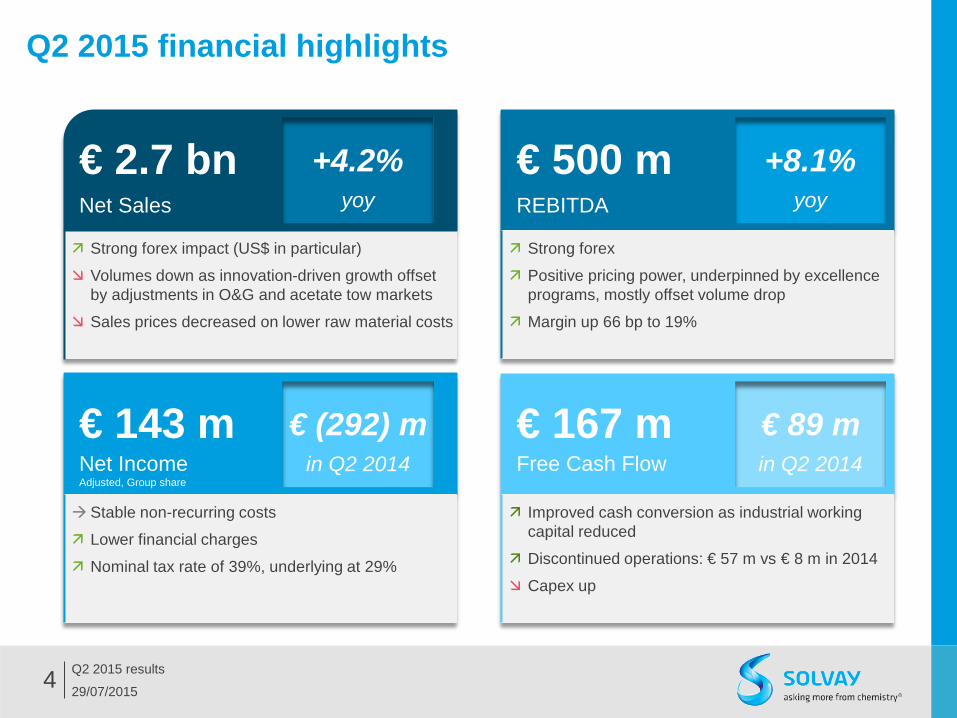
Q2 2015 financial highlights
Strong forex impact (US$ in particular)
Volumes down as innovation-driven growth offset by adjustments in O&G and acetate tow markets
Sales prices decreased on lower raw material costs
Strong forex
Positive pricing power, underpinned by excellence programs, mostly offset volume drop
Margin up 66 bp to 19%
+8.1% yoy
+4.2% yoy
€ 143 m Net Income Adjusted, Group share
€ (292) m in Q2 2014
€ 167 m Free Cash Flow
€ 2.7 bn Net Sales
€ 500 m REBITDA
€ 89 m in Q2 2014
Stable non-recurring costs
Lower financial charges
Nominal tax rate of 39%, underlying at 29%
Improved cash conversion as industrial working capital reduced
Discontinued operations: € 57 m vs € 8 m in 2014
Capex up
Special Chem Portfolio reshaping continues
13/11/2014
Q3 2014 results 5
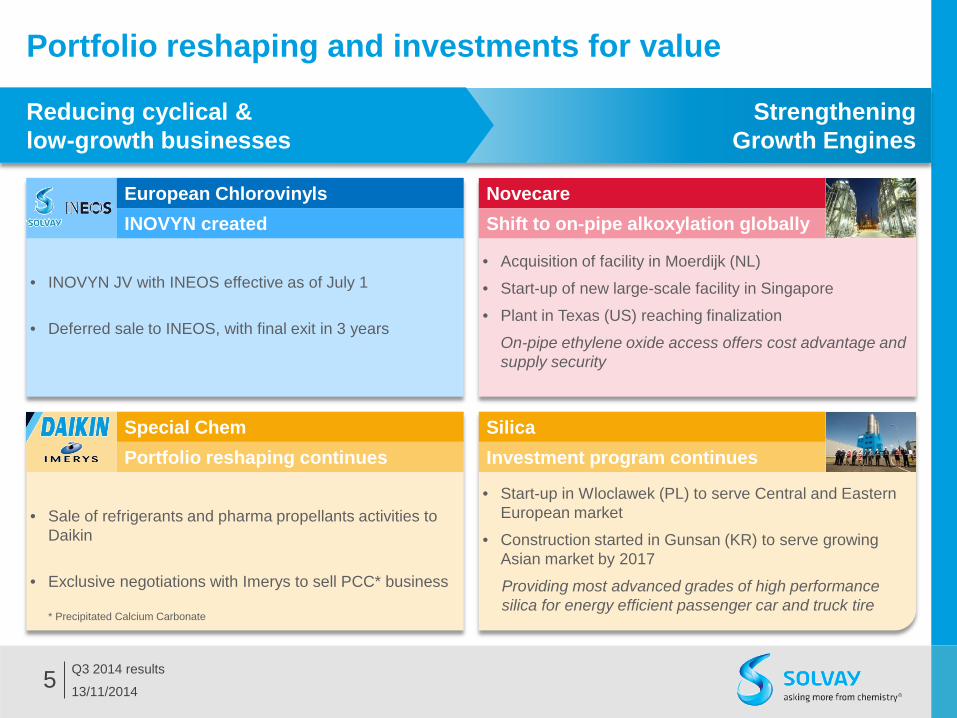
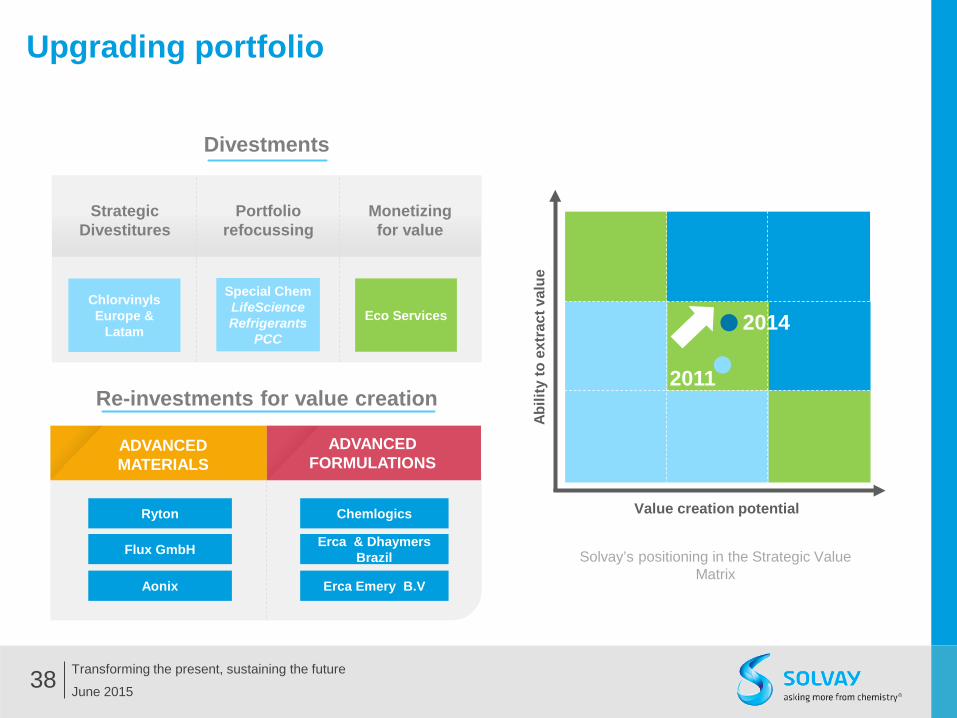
Portfolio reshaping and investments for value
• INOVYN JV with INEOS effective as of July 1
• Deferred sale to INEOS, with final exit in 3 years
European Chlorovinyls
• Start-up in Wloclawek (PL) to serve Central and Eastern European market
• Construction started in Gunsan (KR) to serve growing Asian market by 2017
Providing most advanced grades of high performance silica for energy efficient passenger car and truck tire
• Acquisition of facility in Moerdijk (NL)
• Start-up of new large-scale facility in Singapore
• Plant in Texas (US) reaching finalization
On-pipe ethylene oxide access offers cost advantage and supply security
Silica
Novecare INOVYN created
Investment program continues
Shift to on-pipe alkoxylation globally
Reducing cyclical & low-growth businesses
Strengthening Growth Engines
• Sale of refrigerants and pharma propellants activities to Daikin
• Exclusive negotiations with Imerys to sell PCC* business * Precipitated Calcium Carbonate
Q2 2014
Scope -
Conversion forex 12%
Volume (11)%
Price (7)%
Variable costs 19%
Fixed costs (5)%
Others (including
equity earnings)
(1)%
Q2 2015
463 2
55 (49)
(33)
89 (21) (6) 500
Pricing power € 57 m
8.1%
18% margin
19% margin
29/07/2015
Q2 2015 results 6
Forex and excellence more than offset substantial adjust-ments in O&G supply chain and acetate tow market
Pricing power underpinned by excellence programs
Volumes down overall as contraction in acetate tow and oil & gas markets offset innovation driven-demand in Advanced Materials
REBITDA in € m
66 bp
Q2 2014
Scope -
Conversion forex 9%
Volume (4)% Price
(1)%
Q2 2015
2,566 -
235 (93)
(33) 2,675
4.2%
Net Sales in € m
Supportive forex (USD and CNY mainly)
Fixed costs up with new plants; Excellence programs offset inflation
29/07/2015
Q2 2015 results 7
Net pricing & forex supportive across operating segments
REBITDA Q2 2015 (in € m)
Substantial drop in Novecare’s O&G market’s demand
Sales and profit improvement at Aroma Performance continued
margin
Advanced Formulations
16% 15%
113 100
Q2 2014 Q2 2015
(12)%
New REBITDA record on strong innovation-
driven growth Good integration of
Ryton and Flux
margin
Advanced Materials
27% 25%
181 214
Q2 2014 Q2 2015
18%
Solid pricing more than offset
volume drop in Acetow Strong progress in
breakthrough excellence programs
Performance Chemicals
margin 23% 25%
169 185
Q2 2014 Q2 2015
9% REBITDA up, on strengthened net pricing and volume increase in Polyamide
Ramp-up of RusVinyl; Good market environment
Functional Polymers
margin 8.1% 11.4%
36 45
Q2 2014 Q2 2015
23%
€ 500 m 18%
39%
34% 8%
29/07/2015
Q2 2015 results
Advanced Formulations Q2 2015 performance Favorable forex insufficient to offset further volume decline in Novecare’s O&G
Market contraction deepens for Novecare’s oil & gas activities Severe supply chain adjustments in unconventional
North American oil & gas market deepens
Cost reduction programs initiated
Growth in Agro and coatings benefiting from strong demand and lower raw material costs
Strong forex support overall
Industrial recovery in Aroma Performance Strong industrial
performance following issues production in 2014
Volume up with strong demand in Asia, especially for inhibitors
Q2 2014
Scope (1)%
Conversion forex 13%
Volume (14)% Price
(4)%
Q2 2015
725 (4) 97 (104)
(29) 686
(5.4)%
margin 70%
16% 14%
Novecare
Coatis Aroma Performance
113 100
16% 15%
Q2 2014 Q2 2015
(12)%
686
8
Net sales (in € m) REBITDA (in € m)
Coatis impacted by weak Brazilian economy Costly labor and rising
energy prices in Brazil eroded local industry competitiveness
Lower raw material prices allowed strengthening of net pricing
29/07/2015
Q2 2015 results
Advanced Materials Q2 2015 performance New REBITDA record on strong innovation-driven growth and favorable forex
Net sales (in € m) REBITDA (in € m)
margin
Significant innovation-driven sales growth in Specialty Polymers Smart devices, automotive and
industrial applications remain main growth drivers
Net pricing increased supported by lower raw material prices
Ryton contributing positively
Sustained solid demand at Silica Solid demand in North
America
Pick-up in Europe after slow year start
Demand in Asia subdued
Q2 2014
Scope 5%
Conversion forex 12%
Volume 9%
Price (0.1)%
Q2 2015
670 33 79
58 (1) 840
25%
57%
16% 28%
Specialty Polymers
Silica Special Chem
181 214
27% 25%
Q2 2014 Q2 2015
18%
9
840
Good dynamics in Special Chem Volume growth in mixed rare earths
oxides for automotive catalysis
Growth in fluor and electronic chemicals for brazing and semiconductor sectors
Flux contributing positively
29/07/2015
Q2 2015 results
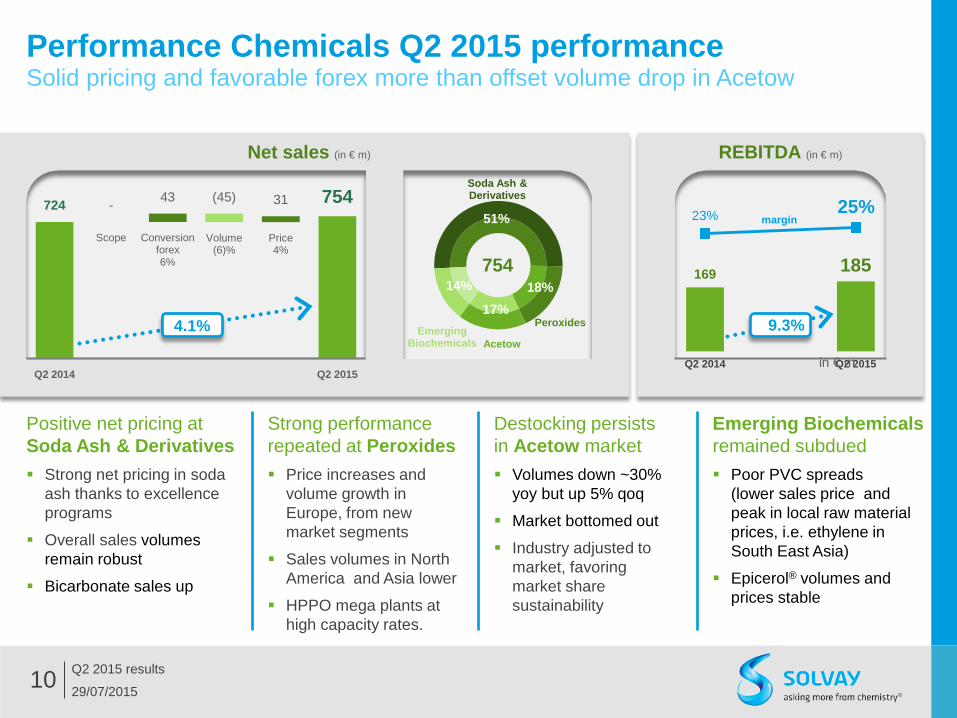
Performance Chemicals Q2 2015 performance Solid pricing and favorable forex more than offset volume drop in Acetow
Net sales (in € m) REBITDA (in € m)
margin
Q2 2014
Scope Conversion forex 6%
Volume (6)%
Price 4%
Q2 2015
724 - 43 (45) 31 754
4.1%
Positive net pricing at Soda Ash & Derivatives Strong net pricing in soda
ash thanks to excellence programs
Overall sales volumes remain robust
Bicarbonate sales up
Destocking persists in Acetow market Volumes down ~30%
yoy but up 5% qoq
Market bottomed out
Industry adjusted to market, favoring market share sustainability
10
754
Strong performance repeated at Peroxides Price increases and
volume growth in Europe, from new market segments
Sales volumes in North America and Asia lower
HPPO mega plants at high capacity rates.
Emerging Biochemicals remained subdued Poor PVC spreads
(lower sales price and peak in local raw material prices, i.e. ethylene in South East Asia)
Epicerol® volumes and prices stable
169 185
23% 25%
Q2 2014 Q2 2015in € m
9.3%
51%
18% 17%
14%
Soda Ash & Derivatives
Peroxides
Acetow Emerging
Biochemicals
29/07/2015
Q2 2015 results
Functional Polymers Q2 2015 performance REBITDA up on strengthened net pricing and supportive volume mix in Polyamide
Net sales (in € m) REBITDA (in € m)
margin
Operating performance well up in Polyamide based on excellence Net pricing up thanks to sustained
excellence efforts and as high proportion of raw material price decrease retained
Solid volume growth for PA 6.6 polymers
Poor economic conditions persist on Brazilian home market for Fibras
Chlorovinyls sales down due to scope Net sales down due to
divestment of Benvic early June 2014
RusVinyl production ramp-up pursued smoothly; Good business environment
11
Q2 2014
Scope (7)%
Conversion forex 3%
Volume (1)% Price
(8)%
Q2 2015
448 (29) 15 (4) (35) 395
(12)%
97%
3%
Polyamide
Chlorovinyls
36 45
8.1%
11.4%
Q2 2014 Q2 2015
23%
395
Contrasted performances in Discontinued Operations Net sales of € 752 m
REBITDA of € 93 m (+€ 58 m yoy)
Tight market conditions and forex-driven export for European chlorovinyls lead to increased spreads and volume growth
Challenging market conditions for Indupa in Latin America persist
(37) (43)
Q2 2014 Q2 2015
29/07/2015
Q2 2015 results
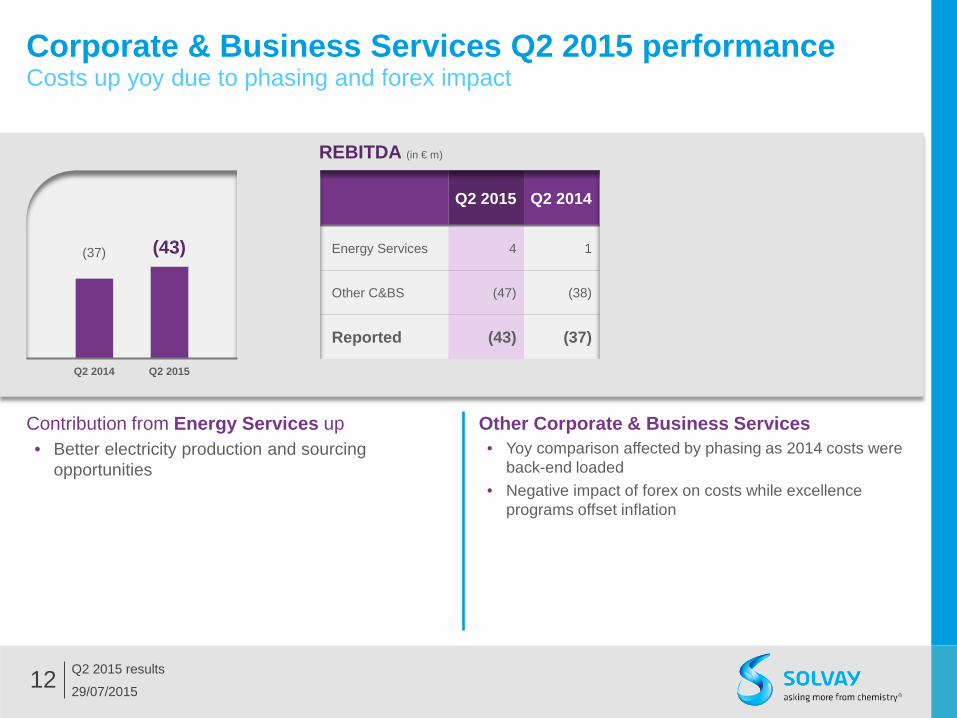
Corporate & Business Services Q2 2015 performance Costs up yoy due to phasing and forex impact
12
Contribution from Energy Services up • Better electricity production and sourcing
opportunities
REBITDA (in € m)
Q2 2015 Q2 2014
Energy Services 4 1
Other C&BS (47) (38)
Reported (43) (37)
Other Corporate & Business Services • Yoy comparison affected by phasing as 2014 costs were
back-end loaded • Negative impact of forex on costs while excellence
programs offset inflation
Adjusted* P&L
29/07/2015
Q2 2015 results 13
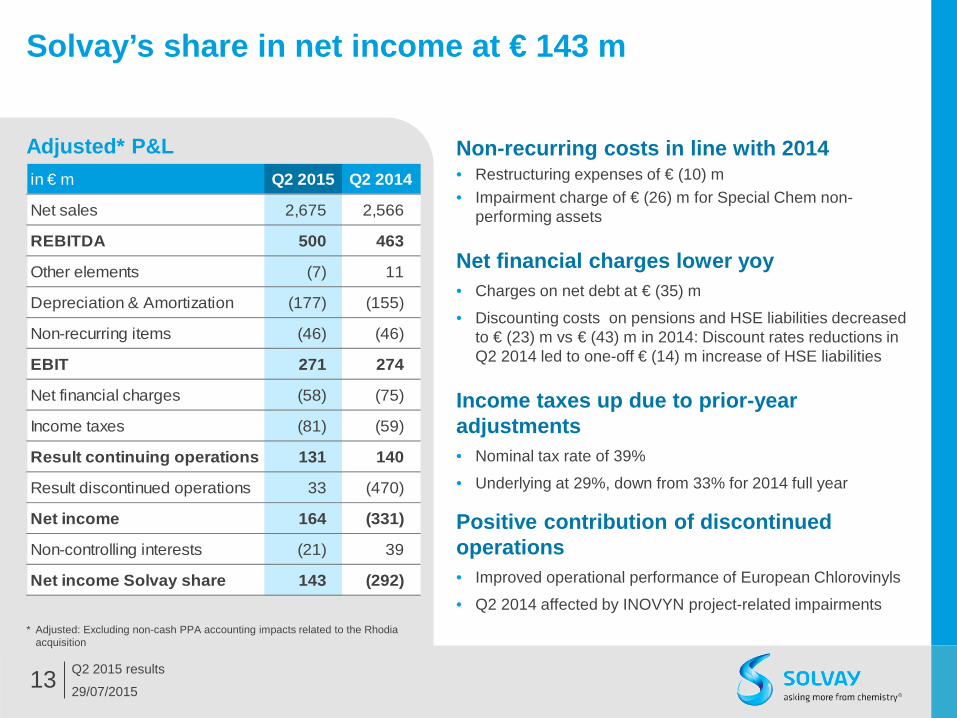
Solvay’s share in net income at € 143 m
* Adjusted: Excluding non-cash PPA accounting impacts related to the Rhodia acquisition
Non-recurring costs in line with 2014 • Restructuring expenses of € (10) m • Impairment charge of € (26) m for Special Chem non-
performing assets
Net financial charges lower yoy • Charges on net debt at € (35) m
• Discounting costs on pensions and HSE liabilities decreased to € (23) m vs € (43) m in 2014: Discount rates reductions in Q2 2014 led to one-off € (14) m increase of HSE liabilities
Income taxes up due to prior-year adjustments • Nominal tax rate of 39%
• Underlying at 29%, down from 33% for 2014 full year
Positive contribution of discontinued operations • Improved operational performance of European Chlorovinyls
• Q2 2014 affected by INOVYN project-related impairments
in € m Q2 2015 Q2 2014
Net sales 2,675 2,566
REBITDA 500 463
Other elements (7) 11
Depreciation & Amortization (177) (155)
Non-recurring items (46) (46)
EBIT 271 274
Net financial charges (58) (75)
Income taxes (81) (59)
Result continuing operations 131 140
Result discontinued operations 33 (470)
Net income 164 (331)
Non-controlling interests (21) 39
Net income Solvay share 143 (292)
29/07/2015
Q2 2015 results 14
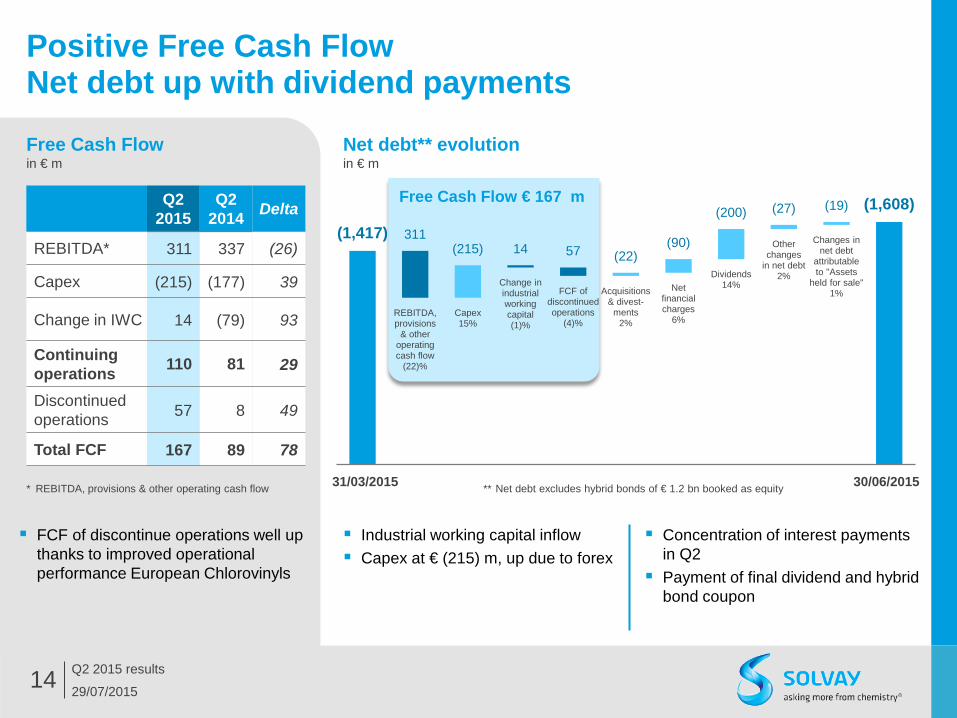
Positive Free Cash Flow Net debt up with dividend payments
31/03/2015
REBITDA, provisions
& other operating cash flow
(22)%
Capex 15%
Change in industrial working capital (1)%
FCF of discontinued operations
(4)%
Acquisitions & divest-
ments 2%
Net financial charges
6%
Dividends 14%
Other changes
in net debt 2%
Changes in net debt
attributable to "Assets
held for sale" 1%
30/06/2015
(1,417) 311 (215) 14 57 (22)
(90)
(200) (27) (19) (1,608) Free Cash Flow € 167 m
Net debt** evolution in € m
Concentration of interest payments in Q2
Payment of final dividend and hybrid bond coupon
FCF of discontinue operations well up thanks to improved operational performance European Chlorovinyls
Q2 2015
Q2 2014 Delta
REBITDA* 311 337 (26)
Capex (215) (177) 39
Change in IWC 14 (79) 93
Continuing operations 110 81 29
Discontinued operations 57 8 49
Total FCF 167 89 78
Free Cash Flow in € m
** Net debt excludes hybrid bonds of € 1.2 bn booked as equity * REBITDA, provisions & other operating cash flow
Industrial working capital inflow Capex at € (215) m, up due to forex
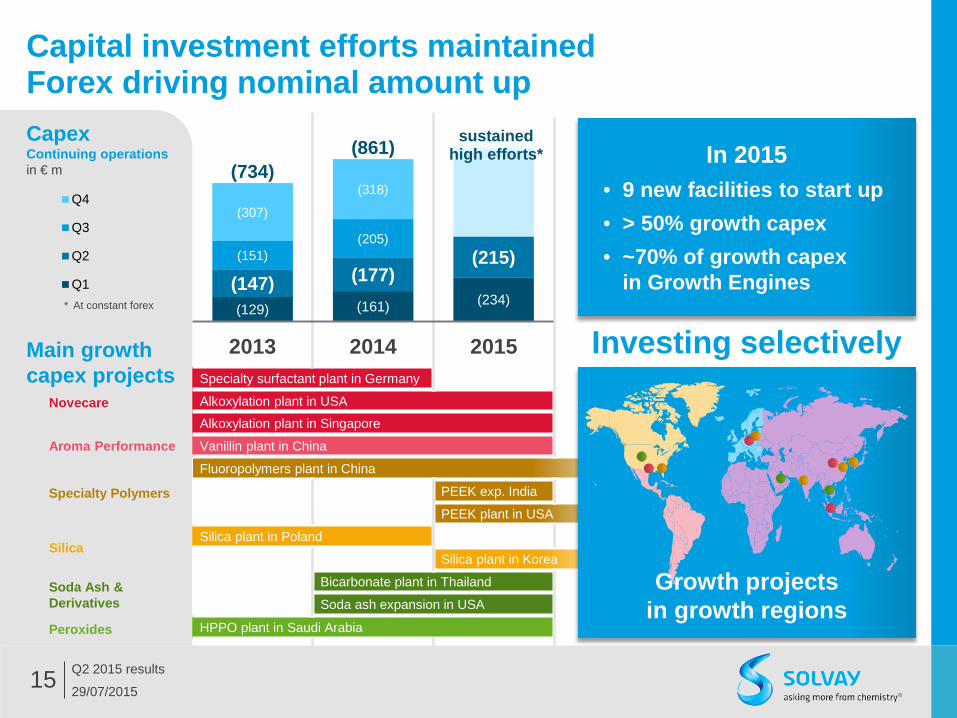
Novecare
Specialty surfactant plant in Germany
Alkoxylation plant in USA
Alkoxylation plant in Singapore
Aroma Performance Vanillin plant in China
Specialty Polymers
Fluoropolymers plant in China
PEEK exp. India
PEEK plant in USA
Silica Silica plant in Poland
Silica plant in Korea
Soda Ash & Derivatives
Bicarbonate plant in Thailand
Soda ash expansion in USA
Peroxides HPPO plant in Saudi Arabia
29/07/2015
Q2 2015 results 15
Capital investment efforts maintained Forex driving nominal amount up Capex Continuing operations in € m
In 2015 • 9 new facilities to start up • > 50% growth capex • ~70% of growth capex
in Growth Engines
Growth projects in growth regions
Investing selectively
(734) (861) sustained
high efforts*
(129) (161) (234) (147) (177)
(215) (151) (205)
(307)
(318)
2013 2014 2015e
Q4
Q3
Q2
Q1
Main growth capex projects
2013 2014 2015
* At constant forex
29/07/2015
Q2 2015 results 16
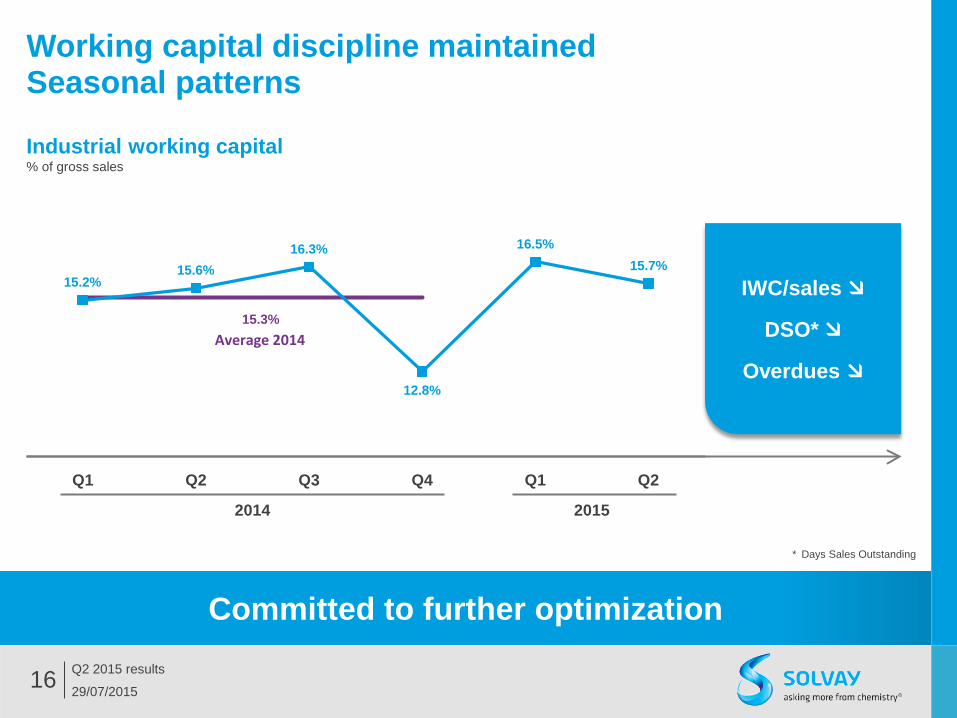
Working capital discipline maintained Seasonal patterns
Industrial working capital % of gross sales
Committed to further optimization
IWC/sales
DSO*
Overdues
* Days Sales Outstanding
15.3%
15.2% 15.6%
16.3%
12.8%
16.5% 15.7%
Average 2014
Q1
2014
Q2 Q3 Q4 Q1
2015
Q2
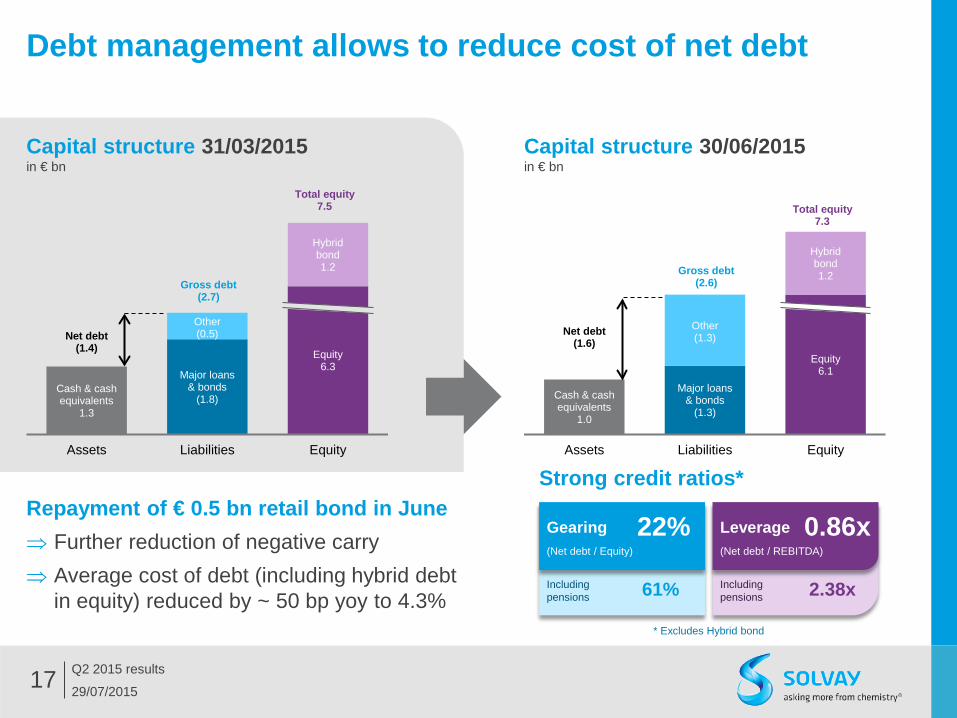
Cash & cash equivalents
1.3
Net debt (1.4)
Major loans & bonds
(1.8)
Other (0.5)
Equity 6.3
Hybrid bond 1.2
Assets Liabilities Equity
Gross debt (2.7)
Total equity 7.5
29/07/2015
Q2 2015 results 17
Debt management allows to reduce cost of net debt
Repayment of € 0.5 bn retail bond in June ⇒ Further reduction of negative carry ⇒ Average cost of debt (including hybrid debt
Forex and excellence more than offset adjustments in O&G and acetate tow markets
€ 12 m net one-off from favorable evolution on US post-retirement Medicare policy (€ 30 m) minus inventory devaluations
REBITDA in € m
81 bp
Net Sales in € m
H1 2014
Scope -
Conversion forex 9%
Volume (3)%
Price (1)%
H1 2015
5,054 (13)
445 (135) (30) 5,322
5.3%
Pricing power underpinned by excellence programs
Volumes down overall as significantly reduced activity levels in acetate tow and oil & gas markets offset innovation driven-demand in Advanced Materials
Supportive forex (USD and CNY mainly)
Fixed costs up with new plants; Excel-lence offset inflation
29/07/2015
Q2 2015 results 23
Income statement H1
in € m H1 2015 H1 2014
Net sales 5,322 5,054
REBITDA 1,002 911
Other elements (11) (5)
Depreciation & Amortization (351) (310)
Non-recurring items (64) (76)
EBIT 576 519
Net financial charges (119) (172)
Income taxes (174) (107)
Result continuing operations 284 240
Result discontinued operations 53 (450)
Net income 337 (210)
Non-controlling interests (36) 25
Net income Solvay share 301 (186)
Balance sheet
in € m 30/06/2015 31/12/2014
Fixed assets 10,423 10,080
Investment & shares 565 545 Loans & other non current financial receivables / payables 32 (10)
Assets held for sale 1,509 1,414 Taxes payable/receivable + Others 218 30
Working capital 1,526 1,101
Total invested capital 14,273 13,160
Equity 7,336 6,778
Provisions 4,177 4,328
Dividends 7 113
Net financial debt 1,608 778 Liabilities related to assets held for sale 1,145 1,162
Total financing 14,273 13,160
31/12/2014
REBITDA, provisions
& other operating cash flow
(74)%
Capex 58%
Change in industrial working capital 37%
FCF of discontinued operations
2%
Acquisitions & divest-
ments 34%
Net financial charges
15%
Dividends 40%
Other changes
in net debt (3)%
Changes in net debt
attributable to "Assets
held for sale" (2)%
30/06/2015
(778) 578 (449)
(288) (18)
(264) (117)
(311) 25 14 (1,608)
29/07/2015
Q2 2015 results 24
Lower discontinued operations contribution to FCF Seasonal uplift in net debt
Net debt** evolution in € m
H1 2015
H1 2014 Delta
REBITDA* 578 586 (9)
Capex (449) (337) (112)
Change in IWC (288) (334) 46
Continuing operations (159) (85) (75)
Discontinued operations (264) (46) (218)
Total FCF (177) (8) (169)
Free Cash Flow in € m
** Net debt excludes hybrid bonds of € 1.2 bn booked as equity * REBITDA, provisions & other operating cash flow
Concentration of interest payments in H1
Payment of (interim and final) dividend and hybrid bond coupon
Discontinued operations in Q1 2014 included last milestone payment linked to disposed Pharma business
IWC inflow vs outflow in 2014 Capex at € (449) m, slightly up due
to forex
Free Cash Flow € (177) m
29/07/2015
Q2 2015 results 25
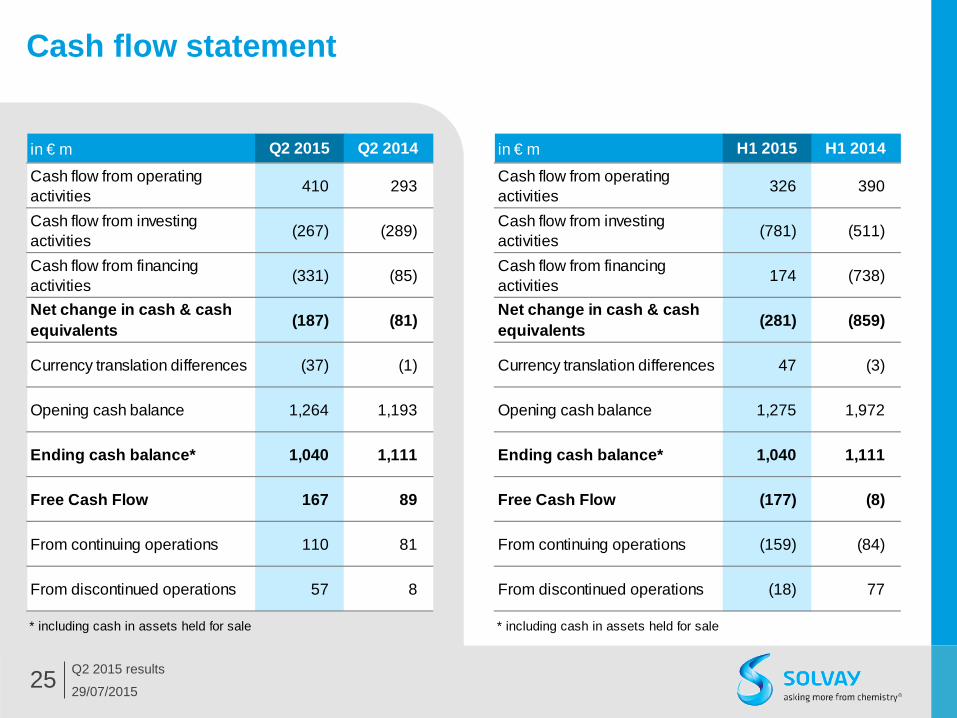
Cash flow statement
in € m H1 2015 H1 2014
Cash flow from operating activities 326 390
Cash flow from investing activities (781) (511)
Cash flow from financing activities 174 (738)
Net change in cash & cash equivalents (281) (859)
Currency translation differences 47 (3)
Opening cash balance 1,275 1,972
Ending cash balance* 1,040 1,111
Free Cash Flow (177) (8)
From continuing operations (159) (84)
From discontinued operations (18) 77
* including cash in assets held for sale
in € m Q2 2015 Q2 2014
Cash flow from operating activities 410 293
Cash flow from investing activities (267) (289)
Cash flow from financing activities (331) (85)
Net change in cash & cash equivalents (187) (81)
Currency translation differences (37) (1)
Opening cash balance 1,264 1,193
Ending cash balance* 1,040 1,111
Free Cash Flow 167 89
From continuing operations 110 81
From discontinued operations 57 8
* including cash in assets held for sale
29/07/2015
Q2 2015 results 26
Factors impacting Net income
in € m Q2 2015 Q2 2014
IFRS Net income, Group 125 (313)
Rhodia PPA (after tax) 18 21
Non-recurring items 46 46
M&A-related elements 14 10
Net financial charges 6 14
Adjustments RusVinyl - -
Discontinued operations - 497 Exceptional Tax and Tax related to exceptional items 1 (23)
Non-controlling interests - (54)Adj. Net income, Groupexcluding exceptionals 209 198
in € m H1 2015 H1 2014
IFRS Net income, Group 265 (225)
Rhodia PPA (after tax) 36 40
Non-recurring items 64 76
M&A-related elements 29 24
Net financial charges 10 44
Adjustments RusVinyl 20 -
Discontinued operations 4 501 Exceptional Tax and Tax related to exceptional items 16 (43)
Non-controlling interests (6) (47)Adj. Net income, Groupexcluding exceptionals 438 369
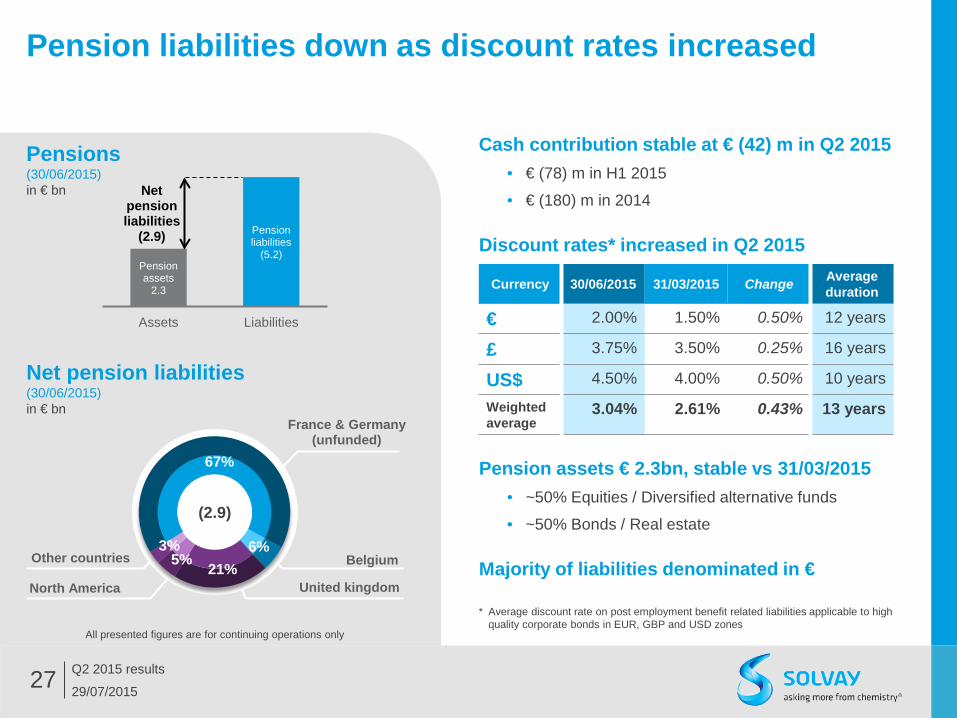
Pension assets
2.3
Pension liabilities
(5.2)
Net pension liabilities
(2.9)
Assets Liabilities
Cash contribution stable at € (42) m in Q2 2015 • € (78) m in H1 2015
• € (180) m in 2014
Discount rates* increased in Q2 2015
Pension assets € 2.3bn, stable vs 31/03/2015 • ~50% Equities / Diversified alternative funds
• ~50% Bonds / Real estate
Majority of liabilities denominated in €
29/07/2015
Q2 2015 results 27
Pension liabilities down as discount rates increased
* Average discount rate on post employment benefit related liabilities applicable to high quality corporate bonds in EUR, GBP and USD zones
Net pension liabilities (30/06/2015) in € bn
All presented figures are for continuing operations only
Currency 30/06/2015 31/03/2015 Change Average duration
€ 2.00% 1.50% 0.50% 12 years
£ 3.75% 3.50% 0.25% 16 years
US$ 4.50% 4.00% 0.50% 10 years
Weighted average
3.04% 2.61% 0.43% 13 years
(2.9)
67%
6% 21% 5%
3%
France & Germany (unfunded)
Belgium
United kingdom North America
Other countries
Pensions (30/06/2015) in € bn
Annexes
• Additional Q2 & H1 2015 financial data
• 2015 considerations
• Group presentation
• Segment & GBU presentation
29/07/2015 Q2 2015 results 28
Mainly linked to USD Immediate impact on conversion exposure
Deferred transactional impact due to hedging
29/07/2015
Q2 2015 results 29
REBIT(DA) considerations for 2015
Forex impact REBITDA adjustments
Scope effects
RusVinyl JV Consolidated through equity associates Adjusted for financial charges Volatility linked to €-denominated debt Impact 2014 at € (65) m, H1’15 at € (4) m
Chemlogics Retention payments of ~ € (2) m per Q until 2016
Acquisitions Ryton® PPS completed on 31/12/2014 Sales of ~ € 100 m in 2014 Meaningful REBITDA contribution from 2016
Smaller acquisitions end 2014: Flux Brazing, Dhaymers
Divestments Benvic on 04/06/2014: ~ € 75 m sales in H1 2014
Refrigerants on 05/05/2015: ~ € 50 m sales in 2014
Recurring depreciation & amortization FY 2015 ~ € (700) m
Rhodia PPA impact Excluded from adjusted figures
FY 2015 ~ € (105) m pre-tax; ~€ (70) m after tax
Depreciation & amortization
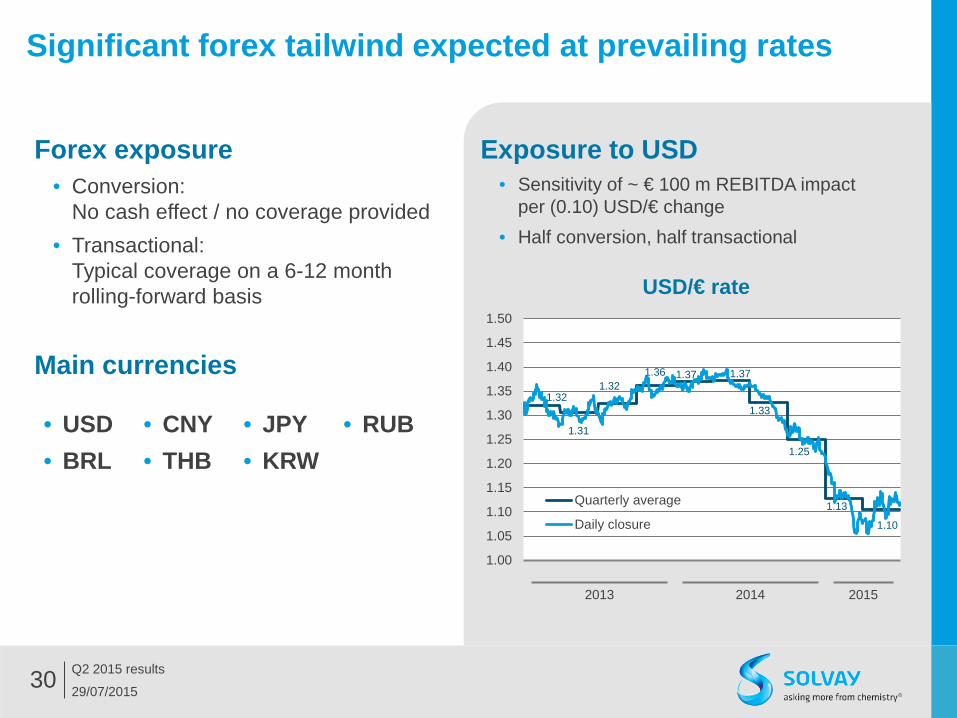
Exposure to USD • Sensitivity of ~ € 100 m REBITDA impact
per (0.10) USD/€ change • Half conversion, half transactional
Forex exposure • Conversion:
No cash effect / no coverage provided • Transactional:
Typical coverage on a 6-12 month rolling-forward basis
Main currencies
29/07/2015
Q2 2015 results 30
Significant forex tailwind expected at prevailing rates
USD/€ rate
2013 2014 2015
• USD • BRL
• CNY • THB
• JPY • KRW
• RUB 1.32
1.31
1.32 1.36 1.37 1.37
1.33
1.25
1.13
1.10
1.00
1.05
1.10
1.15
1.20
1.25
1.30
1.35
1.40
1.45
1.50
Quarterly average
Daily closure
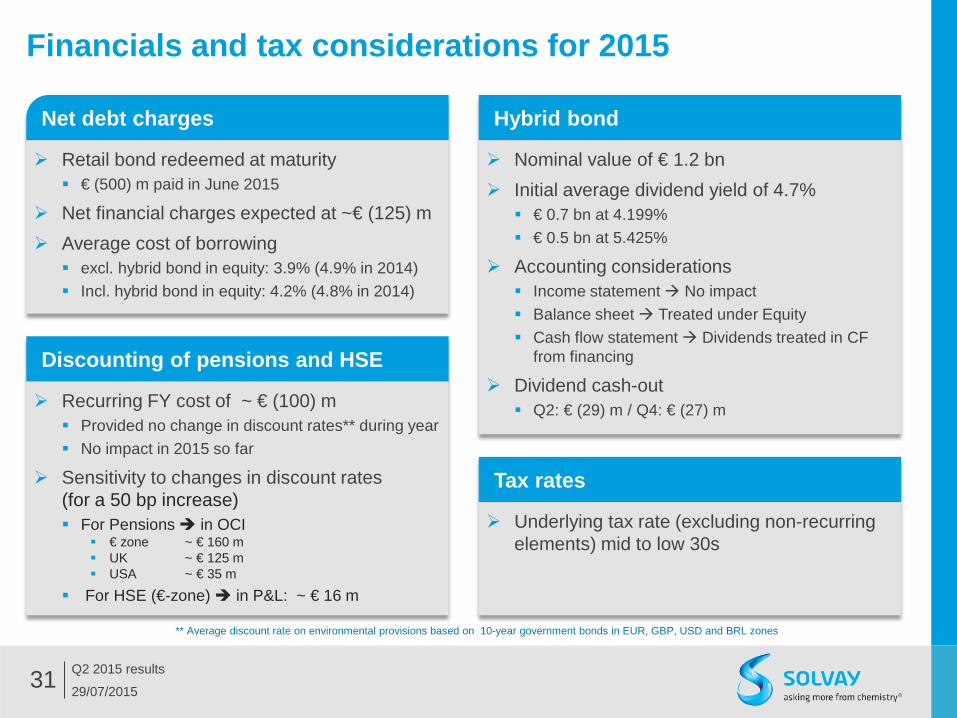
Discounting of pensions and HSE
Hybrid bond
29/07/2015
Q2 2015 results 31
Financials and tax considerations for 2015
Retail bond redeemed at maturity € (500) m paid in June 2015
Net financial charges expected at ~€ (125) m Average cost of borrowing excl. hybrid bond in equity: 3.9% (4.9% in 2014) Incl. hybrid bond in equity: 4.2% (4.8% in 2014)
Nominal value of € 1.2 bn Initial average dividend yield of 4.7% € 0.7 bn at 4.199% € 0.5 bn at 5.425%
Accounting considerations Income statement No impact Balance sheet Treated under Equity Cash flow statement Dividends treated in CF
from financing
Dividend cash-out Q2: € (29) m / Q4: € (27) m
Net debt charges
Recurring FY cost of ~ € (100) m Provided no change in discount rates** during year No impact in 2015 so far
Sensitivity to changes in discount rates (for a 50 bp increase) For Pensions in OCI
€ zone ~ € 160 m UK ~ € 125 m USA ~ € 35 m
For HSE (€-zone) in P&L: ~ € 16 m
** Average discount rate on environmental provisions based on 10-year government bonds in EUR, GBP, USD and BRL zones
Tax rates
Underlying tax rate (excluding non-recurring elements) mid to low 30s
Non-recurring elements
Discontinued operations
29/07/2015
Q2 2015 results 32
Other considerations for 2015
Restructuring costs
Impairments relative to business not under discontinued operations
HSE provisions on non-operational sites
Portfolio management-related gains & losses
Contingencies / litigations
Indupa sale CADE anti-trust veto to Braskem late Q4’14
Strategic intent untouched, disposal process re-launched
€ (65) m in CTA to be recycled through P&L at exit
Cash flow
FCF fluctuations Cash expenses for pensions of ~€ (180) m
Sustained high level of capex efforts, at constant forex
INOVYN™ JV with Ineos Effective as of July 1st 2015
Terms of deferred sale: • € 150 m upfront payment (adjusted for usual WC)
• ~€ (260) m transfer of liabilities
• Exit after 3 years with performance-based exit payment of € 280 m targeted (€ 95 m minimum)
Annexes
• Additional Q2 2015 financial data
• 2015 considerations
• Group presentation
• Segment & GBU presentation
29/07/2015 Q2 2015 results 33
June 2015
Transforming the present, sustaining the future 34
Solvay, a major global chemical player
€ 10.2 bn Net Sales
€ 1.8 bn REBITDA
17.5% REBITDA margin
€ 156 m Adjusted Net Income, Group share
Based on strengths 119 Industrial sites
15 Major R&I centers
26,033 Employees (FTEs)
52 Country presence
And with ambition
Well-balanced geographical spread and end-user markets
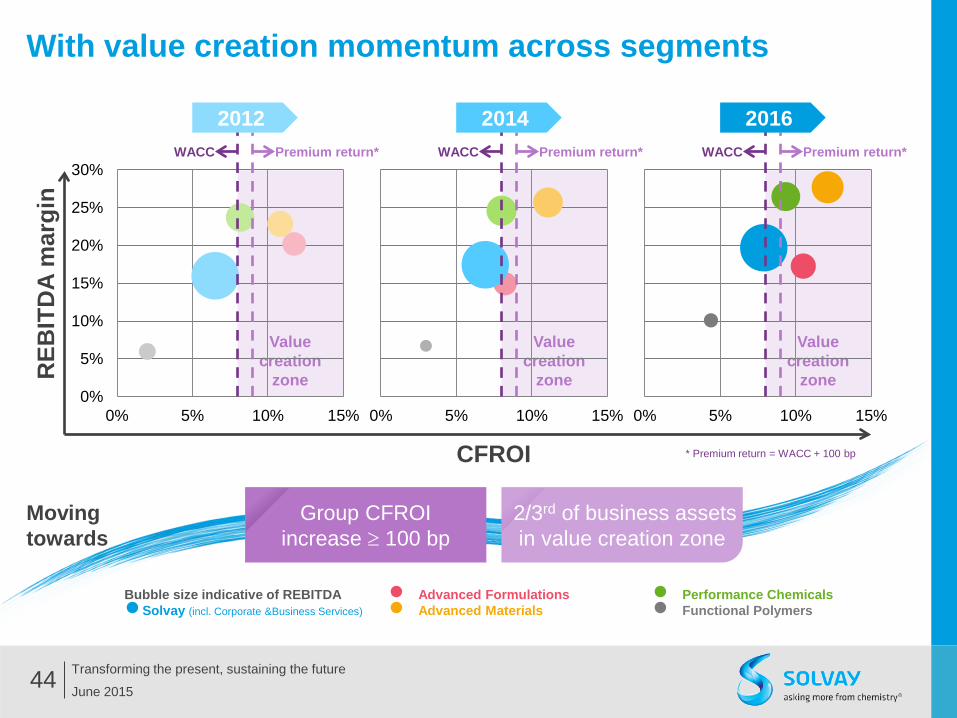
Transforming the present, sustaining the future 45
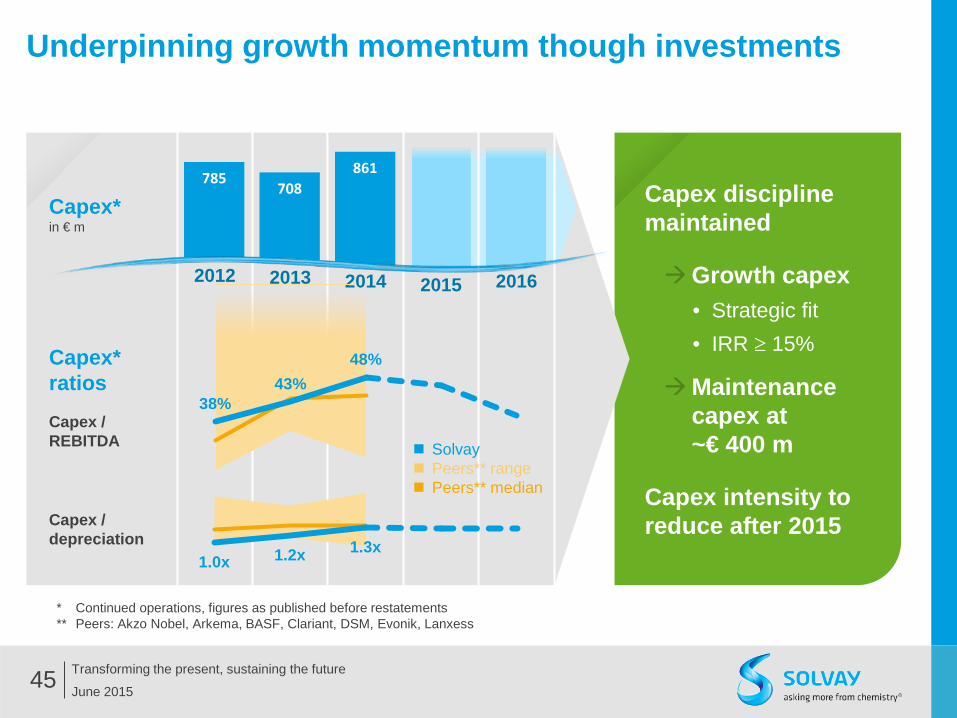
Underpinning growth momentum though investments
Capex* ratios
Capex discipline maintained
Growth capex • Strategic fit • IRR ≥ 15%
Maintenance capex at ~€ 400 m
Capex intensity to reduce after 2015
Capex* in € m
2016 2012 2013 2014 2015
* Continued operations, figures as published before restatements ** Peers: Akzo Nobel, Arkema, BASF, Clariant, DSM, Evonik, Lanxess
1.0x 1.2x 1.3x
38% 43%
48%
Capex / depreciation
Capex / REBITDA Solvay
Peers** range Peers** median
June 2015
Transforming the present, sustaining the future 46
Allocating capex strategically So
lvay
’s a
bilit
y to
ext
ract
val
ue
Value creation potential of industry segment
Selective investment in
cash-generative projects
GROWTH ENGINES
RESILIENT CHALLENGE
30%
60%
10%
High investment
level in value enhancers
Focused on excellence
drivers
Portfolio
Americas ~30%
Asia & RoW ~40%
Europe ~30%
Regional Solvay’s business matrix of GBUs, based on value generation potential Based on main projects
Growth capex 2015-2018
Growing to maturity in next 3 years
June 2015
Transforming the present, sustaining the future 47
With current pipeline starting to deliver in 2016
* IRR = Internal Return Rate
Major growth projects
Industrial start-up
Years to maturity
Projected IRR*
Total capex
GR
OW
TH E
NG
INES
Novecare Alkoxylation USA & Singapore 2015 ≤ 3 >20%
€ 50
0 m
Aroma Performance Vanillin Asia 2015 ≤ 3 >20%
Specialty Polymers Polymers China 2015 ≥ 6 ~15%
PEEK US & India 2016 ≥ 6 >20%
Silica HDS Poland & Korea 2015-2017 ≤ 3 >15%
RES
ILIE
NT Peroxides HPPO Saudi Arabia 2015 ≤ 3 >15%
€ 32
5 m
H2O2 China 2015 ≤ 3 >15%
Soda Ash & Derivatives
Bicarbonate Thailand 2015 ≤ 3 >15%
Operational excellence 2014 ≤ 3 >15%
(166) (186)
5.3% 4.9%
4.8%
2013 2014 2015e 2016e
Exceptionals
Hybrid debt in equity
Net financial charges
Cost of borrowing
Cost of borrowingincluding hybrid debt in equity
(4.2) (3.8)
2013 2014 2015e 2016e
Unused credit facilities
Cash & cash equivalents
June 2015
Transforming the present, sustaining the future 48
Supporting growth through strong financial framework
Strong liquidity position maintained in € bn
Financial expenses in € m
Lower financial costs
Lower cost of carry
Balancing value and risk management
Capital structure (31/03/2015)
in € bn
19%
0.77x
Gearing Net debt / Equity
Leverage Net debt / REBITDA
BBB+ Negative outlook S&P
Baa2 Stable outlook Moody’s
Sustained invest-ment grade ratings
Strong credit ratios
Cash & cash equivalents
1.3
Net debt (1.4)
Major loans & bonds (1.8)
Other (0.9)
Equity 6.3
Hybrid bond 1.2
Assets Liabilities Equity
Gross debt (2.7)
Total equity 7.5
June 2015
Transforming the present, sustaining the future 49
Converting REBITDA into cash for value
Capex
Other cash flow items
Income tax
Financing costs
Working capital
Dividends
REBITDA > 10% yoy on average
Intensity reduces after 2015
Pensions, environmental, restructuring, … ~ € 300 m net
Low to mid 30%’s
% charges to continue to fall
≤ 15% / sales
Stable to growing
07/09/2011 Rhodia acquisition
0
1
2
3
4
1982 1987 1992 1997 2002 2007 2012
June 2015
Transforming the present, sustaining the future 50
Rewarding shareholders with stable to growing dividend
Gross dividend in €/share
TSR* of 17% CAGR Since Rhodia acquisition
For >30 years ~40% average pay-out
Dividend 5.3
% CAGR
0%
50%
100%
150%
200%Total shareholder return Indexed (with re-invested net dividends)
TSR* 17
% CAGR
2012 2013 2014 2015
June 2015
Transforming the present, sustaining the future 51
Remuneration aligned to value creation
Applicable to Executive Committee & Business General Managers
35%
30%
35%
REBITDA*
CFROI*
REBITDA
Cash
Sustainability
FIXE
D
(*) Targets and KPIs aligned to 2016 ambitions
VAR
IAB
LE
Share-price
10/06/2015
Annexes
• Additional Q2 2015 financial data
• 2015 considerations
• Group presentation
• Segment & GBU presentation
29/07/2015 Q2 2015 results 52
2014
Polyamide
29/07/2015
Q2 2015 results 53
Organized in Operating segments and Global Business Units
Soda Ash & Derivatives
Aroma Performance
Novecare
Silica
Specialty Polymers
Acetow
Peroxide
P&I Engineering Plastics
Solvay Energy Services
Adva
nced
Mate
rials
Perfo
rman
ce C
hemi
cals
Func
tiona
l Poly
mers
Corp
orate
& B
usine
ss S
ervic
es
Adva
nced
For
mulat
ions
H1 2015
Coatis Special Chem
Emerging Biochemicals
Fibras Corporate Functions
REBITDA € 196 m € 415 m € 380 m € 75 m € (63) m YoY change 6.9% 18% 12% 1.2% 4.7%
REBITDA margin 14% 25% 25% 9.5% YoY change 98 bp 127 bp 163 bp 113 bp
REBITDA € 426 m € 709 m € 724 m € 111 m € (188) m YoY change 23% 14% 6.1% 25% 43%
REBITDA margin 15% 26% 25% 6.7% YoY change 66 bp 122 bp 109 bp 169 bp
Chlorovinyls
RusVinyl
FY 2014
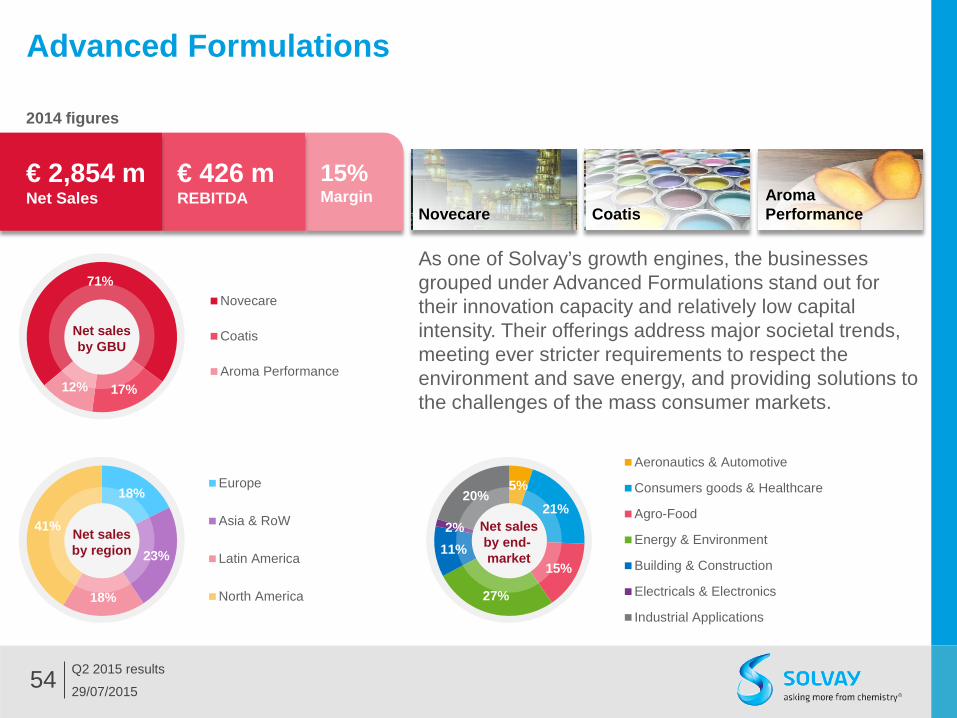
71%
17% 12%
Novecare
Coatis
Aroma Performance
5%
21%
15%
27%
11% 2%
20%
Aeronautics & Automotive
Consumers goods & Healthcare
Agro-Food
Energy & Environment
Building & Construction
Electricals & Electronics
Industrial Applications
18%
23%
18%
41%
Europe
Asia & RoW
Latin America
North America
29/07/2015
Q2 2015 results 54
Advanced Formulations
As one of Solvay’s growth engines, the businesses grouped under Advanced Formulations stand out for their innovation capacity and relatively low capital intensity. Their offerings address major societal trends, meeting ever stricter requirements to respect the environment and save energy, and providing solutions to the challenges of the mass consumer markets.
15% Margin
2014 figures
Coatis Aroma Performance
Net sales by region
Net sales by GBU
Novecare
€ 426 m REBITDA
€ 2,854 m Net Sales
Net sales by end- market
June 2015
Transforming the present, sustaining the future 55
Novecare Delivering sustainable solutions for surface chemistry
Net sales 2014
€ 2.0 bn Net sales 2014
~ 3,800 employees
31 Production sites
22 R&I & tech centers
Europe 7 production sites
4 R&I & tech centers
North America 12 production sites 12 R&I & tech centers
Asia & RoW 9 production sites
5 R&I & tech centers
Latin America 3 production sites 1 R&I center
Focused on key markets
Industrial
Agro
Home & Personal care
Coatings
Oil & Gas
16%
25% 6%
53% 20%
15%
20% 10%
35%
% of Novecare 2014 net sales
June 2015
Transforming the present, sustaining the future 56
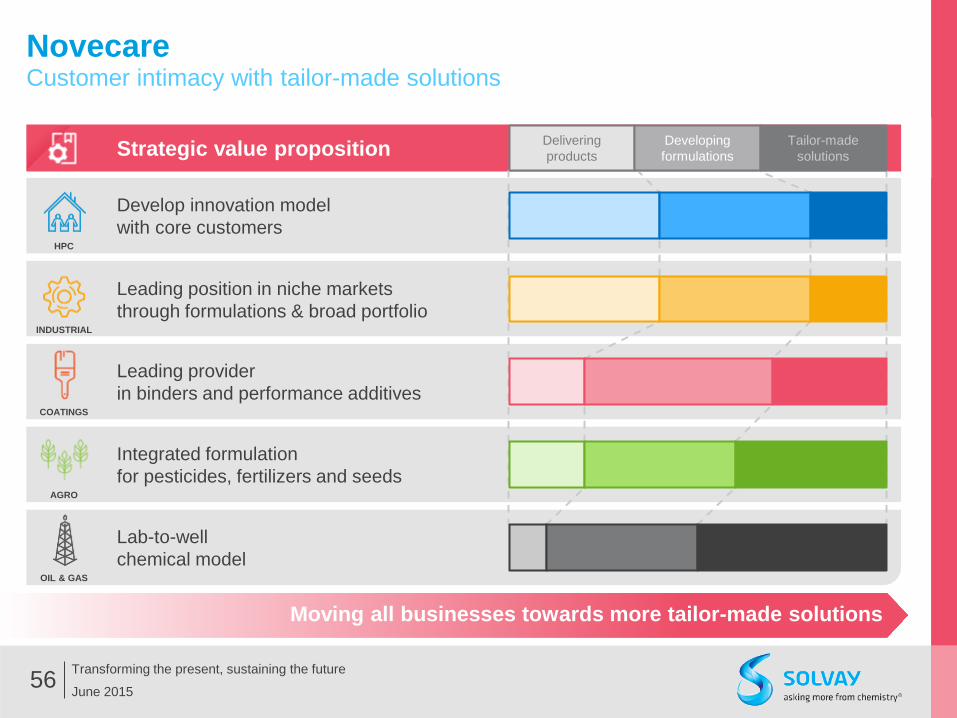
Novecare Customer intimacy with tailor-made solutions
Strategic value proposition
Leading position in niche markets through formulations & broad portfolio
Lab-to-well chemical model
OIL & GAS
INDUSTRIAL
Develop innovation model with core customers
HPC
Leading provider in binders and performance additives
COATINGS
Integrated formulation for pesticides, fertilizers and seeds
AGRO
Moving all businesses towards more tailor-made solutions
Delivering products
Developing formulations
Tailor-made solutions
June 2015
Transforming the present, sustaining the future 57
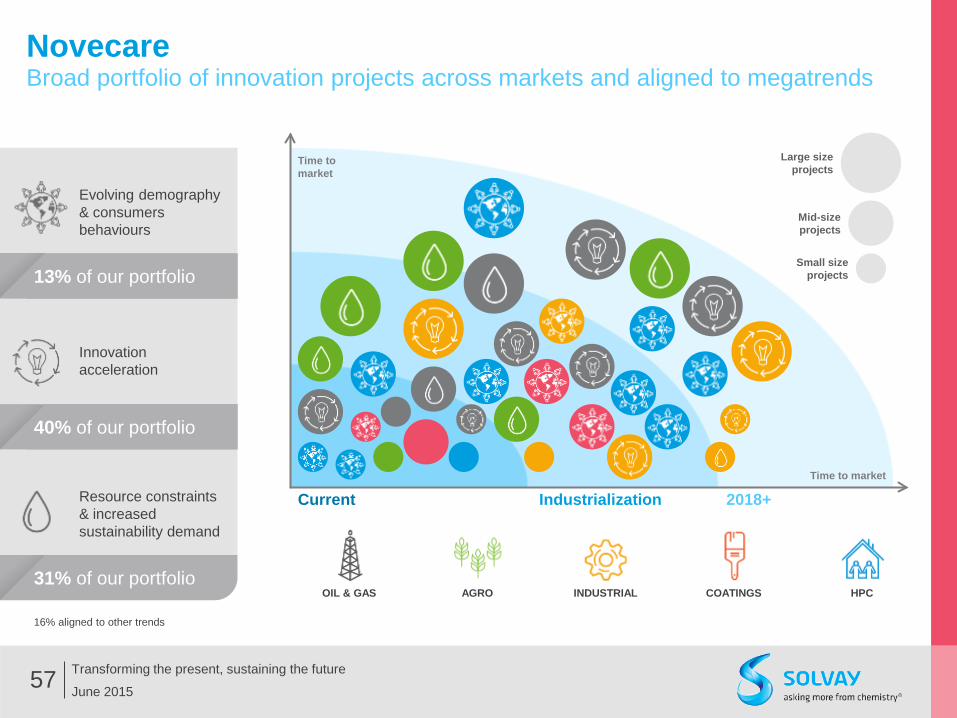
Novecare Broad portfolio of innovation projects across markets and aligned to megatrends
Expansion in Latin America Erca plant, acquisition 2013
Itatiba, Sao Paulo, Brazil
Dhaymers, acquisition 2014 Taboao da Serra, Sao Paulo, Brazil
Expansion in Germany to access Eastern Europe New plant, construction 2012-2014
Genthin, Germany
June 2015
Transforming the present, sustaining the future 59
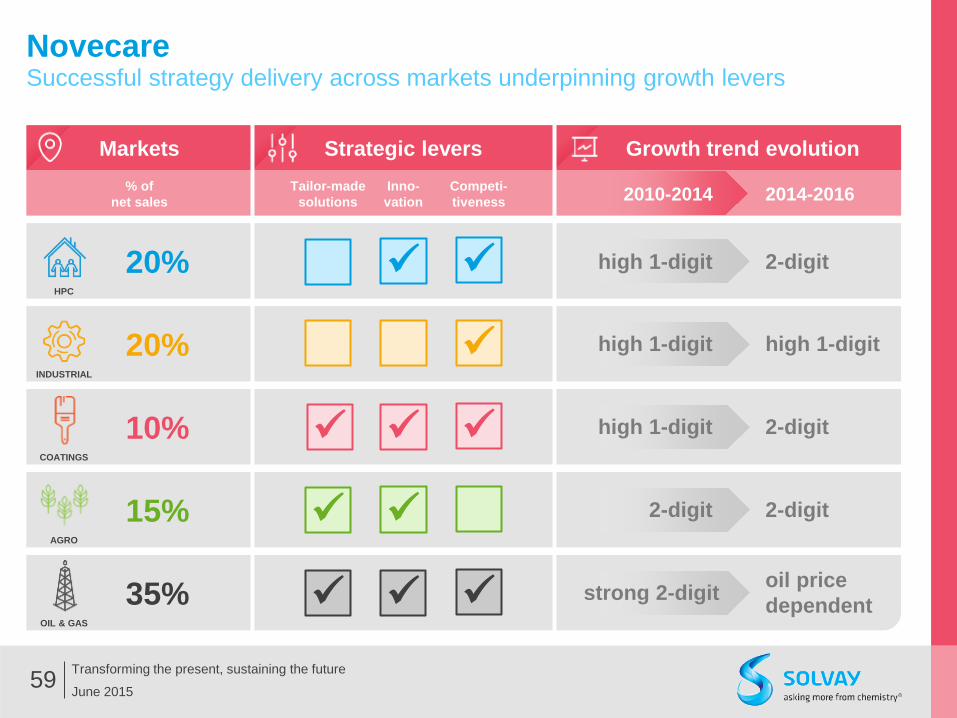
Novecare Successful strategy delivery across markets underpinning growth levers
Growth trend evolution
OIL & GAS
AGRO
HPC
15%
35%
20%
COATINGS
INDUSTRIAL
10%
20%
Strategic levers Tailor-made
solutions Inno- vation
Competi-tiveness
2-digit
high 1-digit
2-digit
2-digit
oil price dependent
high 1-digit
high 1-digit
high 1-digit
2-digit
strong 2-digit
2010-2014 2014-2016
Markets % of
net sales
Net
Sales 2014
Asia & RoW 1 R&I center
June 2015
Transforming the present, sustaining the future 60
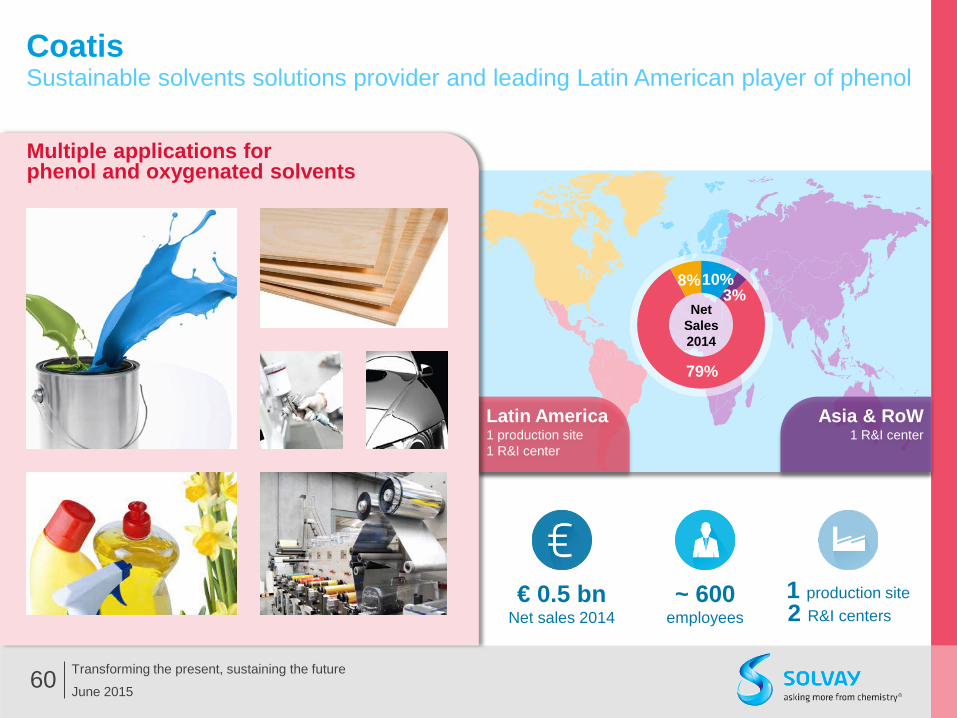
Coatis Sustainable solvents solutions provider and leading Latin American player of phenol
€ 0.5 bn Net sales 2014
~ 600 employees
1 production site 2 R&I centers
10% 3%
79%
8%
Latin America 1 production site 1 R&I center
Multiple applications for phenol and oxygenated solvents
Net
Sales 2014
Europe 3 production sites
1 R&I center
Asia & RoW 1 production site
2 R&I centers
North America 1 production site
June 2015
Transforming the present, sustaining the future 61
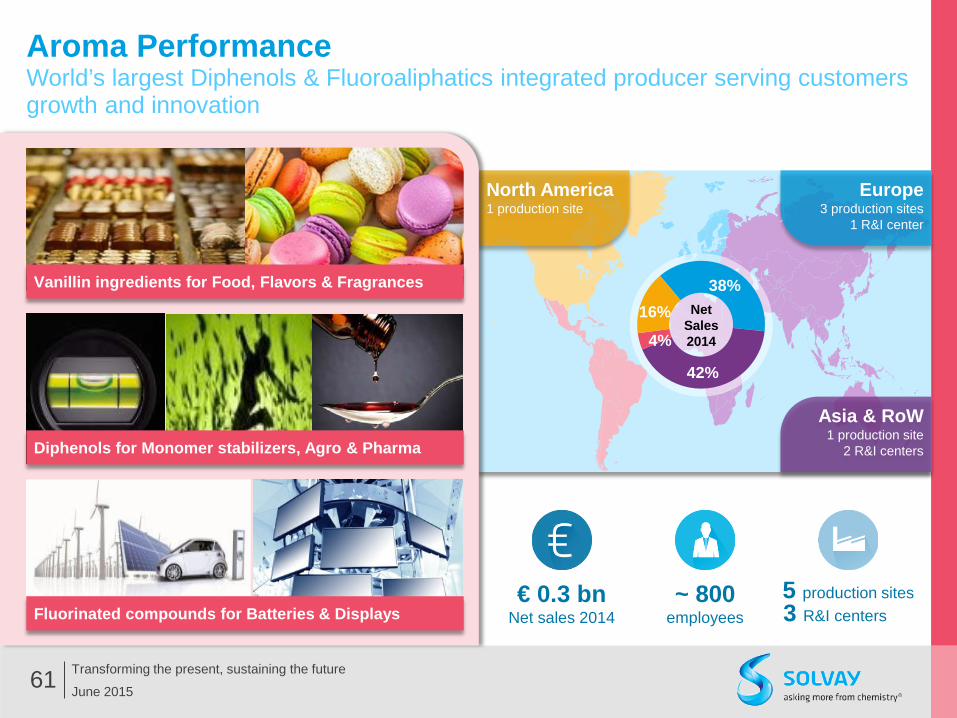
Aroma Performance World’s largest Diphenols & Fluoroaliphatics integrated producer serving customers growth and innovation
€ 0.3 bn Net sales 2014
~ 800 employees
5 production sites 3 R&I centers
38%
42%
4%
16%
Diphenols for Monomer stabilizers, Agro & Pharma
Fluorinated compounds for Batteries & Displays
Vanillin ingredients for Food, Flavors & Fragrances
36%
13% 5% 6% 10%
19%
12%
Aeronautics & Automotive
Consumers goods & Healthcare
Agro-Food
Energy & Environment
Building & Construction
Electricals & Electronics
Industrial Applications
37%
35%
5%
24% Europe
Asia & RoW
Latin America
North America
54%
16% 30%
Specialty Polymers
Silica
Special Chem
29/07/2015
Q2 2015 results 62
Advanced Materials
A leader in markets with high entry barriers and strong returns on investment, the Advanced Materials segment is a major contributor to the Group’s performance and growth. Innovation, its global presence and long-term partnerships with customers provide a compelling competitive edge with industries seeking increasingly energy efficiency and less polluting functionalities.
Specialty Polymers Silica Special Chem
Net sales by region
Net sales by GBU
26% Margin
2014 figures
€ 709 m REBITDA
€ 2,762 m Net Sales
Net sales by end- market
June 2015
Transforming the present, sustaining the future 63
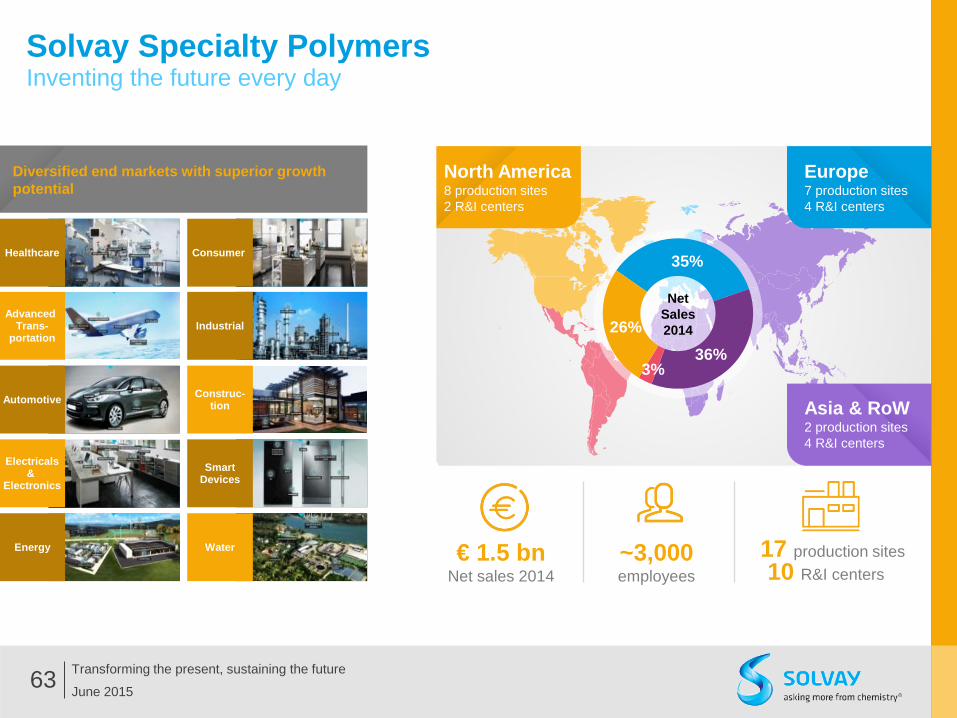
Solvay Specialty Polymers Inventing the future every day
North America 8 production sites 2 R&I centers
Net
Sales 2014
35%
36% 3%
26%
Europe 7 production sites 4 R&I centers
Asia & RoW 2 production sites 4 R&I centers
€ 1.5 bn Net sales 2014
~3,000 employees
17 production sites 10 R&I centers
Unmatched dynamic portfolio
Innovation edge
Diversified end markets with superior growth potential
Advanced Trans-
portation
Healthcare
Automotive
Electricals &
Electronics
Energy Water
Industrial
Construc- tion
Smart Devices
Consumer
June 2015
Transforming the present, sustaining the future 64
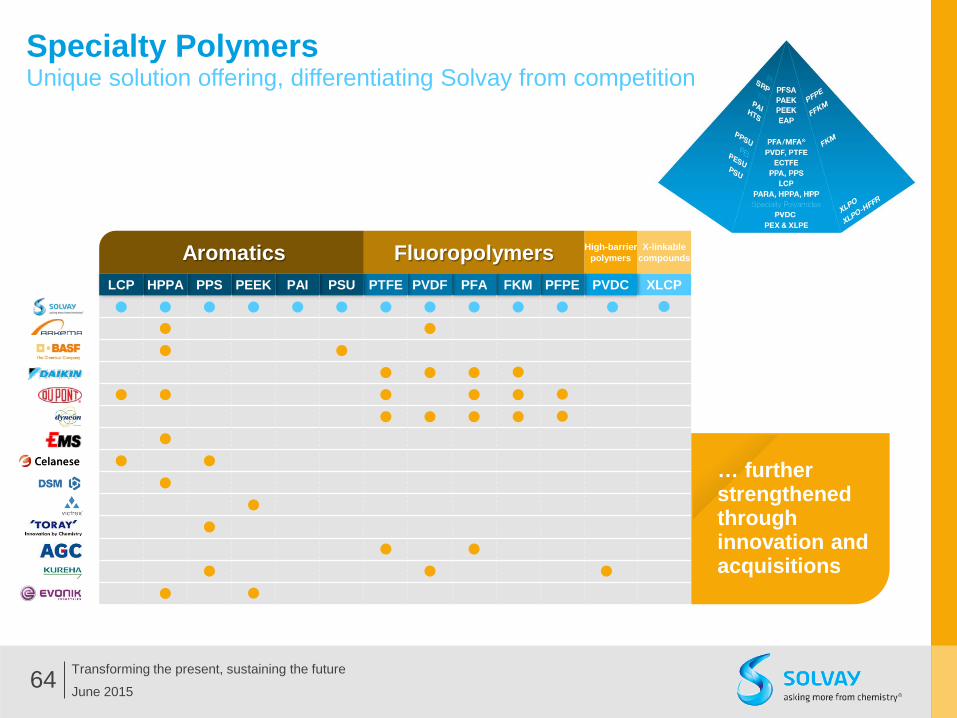
Specialty Polymers Unique solution offering, differentiating Solvay from competition
… further strengthened through innovation and acquisitions
3
June 2015
Transforming the present, sustaining the future 65
Specialty Polymers Outgrowing markets
Solvay Specialty Polymers 2014 sales by end markets
Sales CAGR 2013/15 ~ 15%
Addressable market growth
~ 8% p.a.*
Electrical/Electronics
Consumer
Construction
Industrial
Healthcare
Automotive
Advanced Transportation
Smart devices
Energy
Water
* CAGR 2013-2015
June 2015
Transforming the present, sustaining the future 66
Specialty Polymers Powerful innovation levers across the value chain
Downstream Alloys Polymers Monomers Precursors
of net sales realized with products < 5-y
2014 data
32%
New product grades 50+
Patents in force 3,300+
41%
31% 28%
Net Sales 2014
Europe 3 production sites
(1 in construction) 2 R&I centers
Asia & RoW 3 production sites
1 R&I center
Latin America 2 production sites 1 R&I center
North America 1 production site
June 2015
Transforming the present, sustaining the future 67
Silica Growth through innovation for sustainable mobility
€ 0.5 bn Net sales 2014
~ 700 employees
9 production sites 4 R&I centers
HDS (Highly Dispersible Silica) for fuel-efficient & performance tires
June 2015
Transforming the present, sustaining the future 68
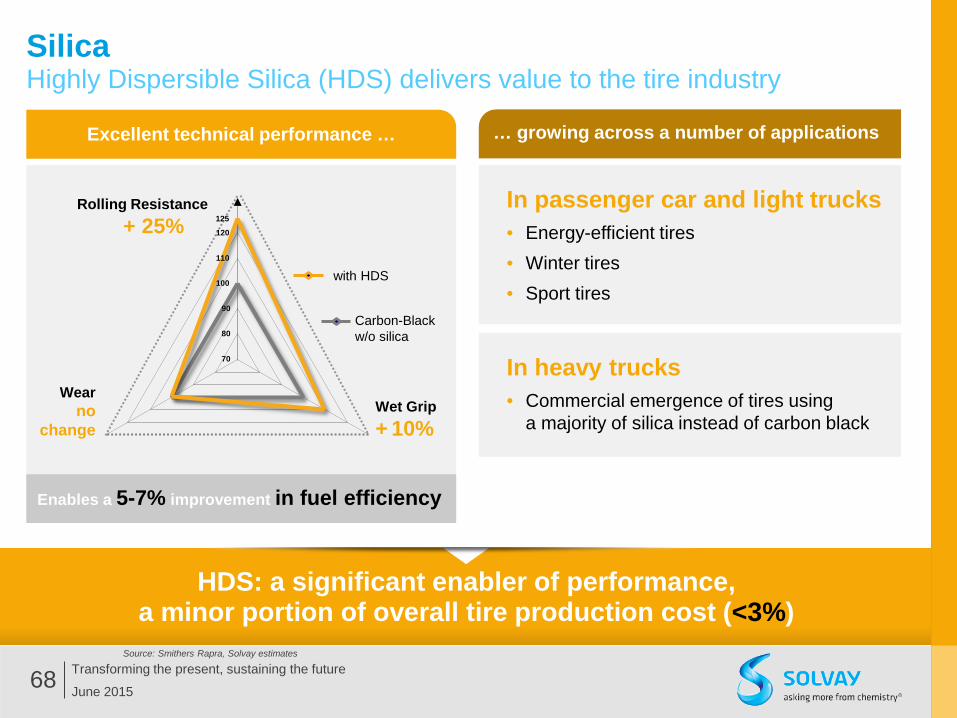
Silica Highly Dispersible Silica (HDS) delivers value to the tire industry
Enables a 5-7% improvement in fuel efficiency
Carbon-Black w/o silica
with HDS
Rolling Resistance + 25%
Wet Grip + 10%
Wear no
change
70
110
120
90
80
100
125 In passenger car and light trucks • Energy-efficient tires • Winter tires • Sport tires
HDS: a significant enabler of performance, a minor portion of overall tire production cost (<3%)
Source: Smithers Rapra, Solvay estimates
Excellent technical performance … … growing across a number of applications
In heavy trucks • Commercial emergence of tires using
a majority of silica instead of carbon black
Net sales 2014
June 2015
Transforming the present, sustaining the future 69
Special Chem, Innovative solutions for growth industries
39%
31% 3%
26%
Automotive
Energy
Electronics
Agro
Formulations
€ 0.9 bn Net sales 2014
> 3,000 employees
28 production sites
10 R&I centers
Europe 14 production sites
4 R&I centers
North America 3 production sites 2 R&I center
Asia & RoW 8 production sites
4 R&I centers
Latin America 2 production sites
Fluor Rare earths & other metals
Key end markets
Creating value
June 2015 Transforming the present, sustaining the future 70
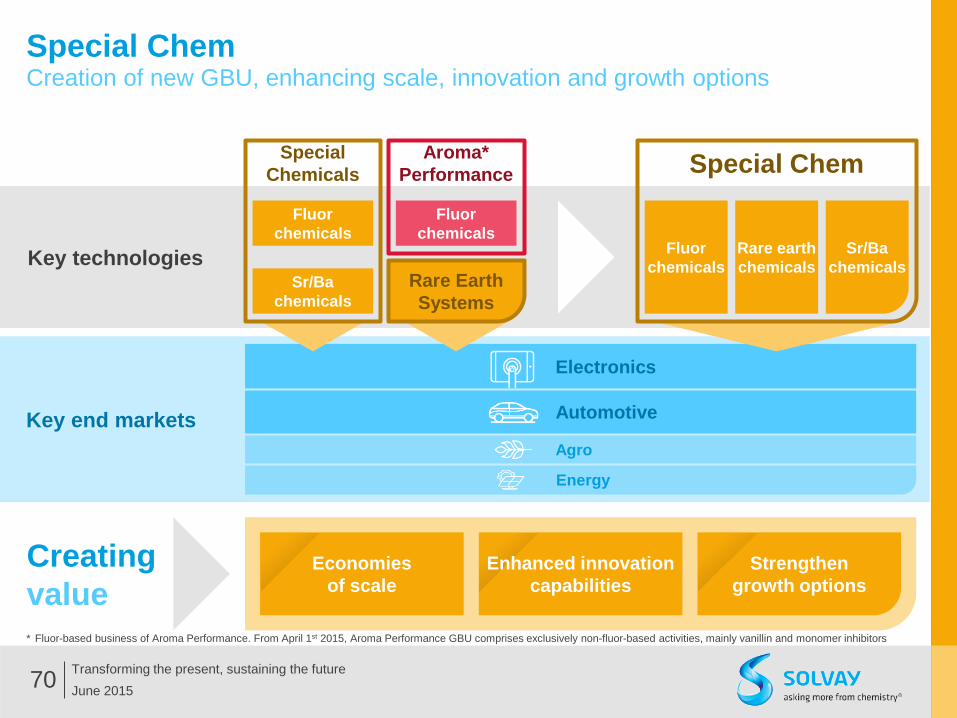
Special Chem Creation of new GBU, enhancing scale, innovation and growth options
* Fluor-based business of Aroma Performance. From April 1st 2015, Aroma Performance GBU comprises exclusively non-fluor-based activities, mainly vanillin and monomer inhibitors
Electronics
Automotive
Agro
Special Chemicals
Aroma* Performance
Sr/Ba chemicals
Fluor chemicals
Fluor chemicals
Special Chem
Fluor chemicals
Rare earth chemicals
Sr/Ba chemicals
Rare Earth Systems
Energy
Key technologies
Economies of scale
Enhanced innovation capabilities
Strengthen growth options
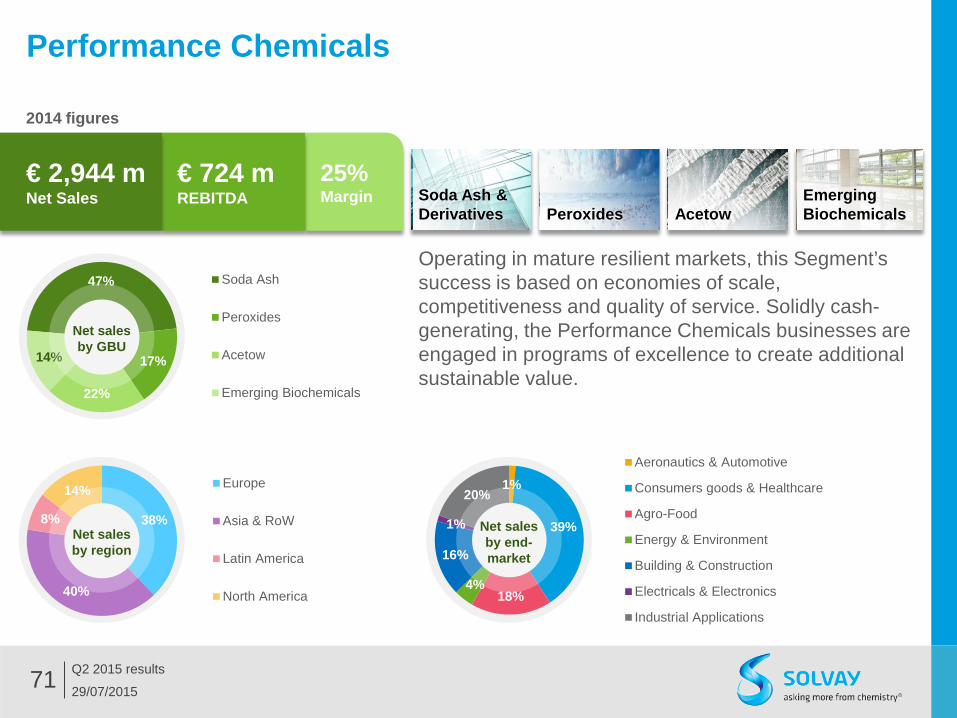
47%
17%
22%
14%
Soda Ash
Peroxides
Acetow
Emerging Biochemicals
38%
40%
8%
14% Europe
Asia & RoW
Latin America
North America
1%
39%
18% 4%
16%
1%
20%
Aeronautics & Automotive
Consumers goods & Healthcare
Agro-Food
Energy & Environment
Building & Construction
Electricals & Electronics
Industrial Applications
29/07/2015
Q2 2015 results 71
Performance Chemicals
Operating in mature resilient markets, this Segment’s success is based on economies of scale, competitiveness and quality of service. Solidly cash-generating, the Performance Chemicals businesses are engaged in programs of excellence to create additional sustainable value.
Soda Ash & Derivatives Peroxides Acetow
Emerging Biochemicals
Net sales by region
Net sales by GBU
25% Margin
2014 figures
€ 724 m REBITDA
€ 2,944 m Net Sales
Net sales by end- market
June 2015
Transforming the present, sustaining the future 72
Soda Ash & Derivatives Resilient cash generator for Solvay
Pharma
Container glass
Flat glass
Detergents
Net sales 2014
Europe 7 production sites
3 R&I centers
North America 2 production sites
Asia & RoW 1 production site (in construction)
45%
19% 12%
24%
€ 1.4 bn Net sales 2014
~ 3,500 employees
10 production sites
3 R&I centers
Soda ash in many applications
Building & Construction
Building & Construction
June 2015
Transforming the present, sustaining the future 73
Soda Ash & Derivatives Leading player with very competitive supply
Synthetic process
Vertically integrated with own mines
Largest soda ash & bicarbonate
producer worldwide
CO2 Carbon dioxide
Limestone
Salt brine
NaHCO3 Bicarbonate
Industrial applications
Building & Construction
Consumer goods & Healthcare
Agro, Feed & Food
Energy & Environment
Flux in glass (flat, container)
Water softener in detergents
Supplement in food & pharma
Flue gas agent
Additives in chemical and metallurgical applications
~20%
~20%
~20%
~30%
~10%
Solvay products
approximate main end-market exposures
Trona mineral
Raw materials Products Applications End-markets
Natural process
Na2Co3 Soda ash
Na2CO3 Soda ash
June 2015
Transforming the present, sustaining the future 74
Soda Ash & Derivatives Market leader with “world-class” assets
Solvay site
Bernburg Rheinberg
Dombasle Devnya
Torrelavega Rosignano
Alexandria
Green River
Green River (Wyoming, US) • Green River (US, Wyoming) • Natural soda ash production • 2.5 mt/yr capacity • 12% capacity increase
2014-2016
Devnya & Torrelavega (Europe) • At delivered cash cost
comparable to natural process • 2.0 mt/yr capacity
Solvay assets
“Local” assets addressing local markets 34%
66% “World-class” assets addressing regional and export markets
Solvay has 20% of North American capacity
Solvay has 36% of European capacity
June 2015
Transforming the present, sustaining the future 75
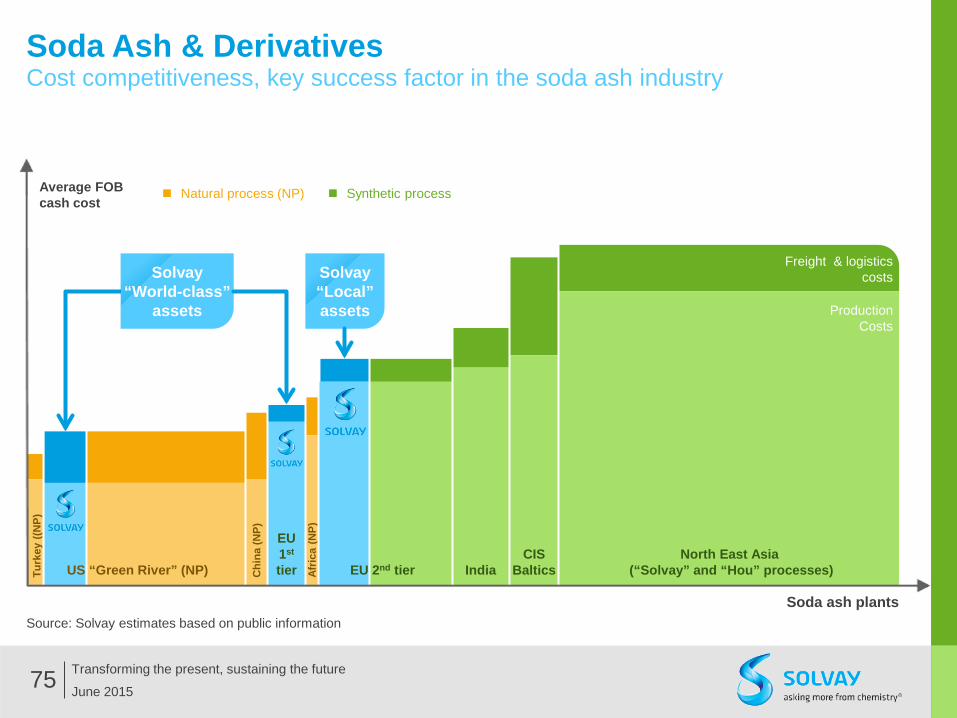
Soda Ash & Derivatives Cost competitiveness, key success factor in the soda ash industry
Source: Solvay estimates based on public information
Afric
a (N
P)
Chi
na (N
P)
Turk
ey ((
NP)
Soda ash plants
Average FOB cash cost
EU 1st tier India
CIS Baltics
North East Asia (“Solvay” and “Hou” processes) EU 2nd tier US “Green River” (NP)
Production Costs
Freight & logistics costs
Synthetic process Natural process (NP)
Solvay “World-class”
assets
Solvay “Local” assets
Global Bicarbonate demand
June 2015
Transforming the present, sustaining the future 76
Soda Ash & Derivatives Market maker in Bicarbonate, a diversified growth story
Ambition to grow at 2x bicarbonate market growth
Others 14%
Healthcare
5%
13%
5% Chemicals
13% Flue gas 30% Animal nutrition
20% Food
Total market volumes (2014)
Detergents
Unparalleled security of supply 8 facilities in Europe and North America
New 100 kt/yr plant in Thailand (07/2015) To serve Asian premium markets
SOLVAir Natural Solutions 50/50 JV with Natural Soda To accelerate development of SOLVAir for
Global market growth slightly above GDP driven by: Food needs
Environmental regulations Aging population
3.9 mt/yr
Solvay positioning
June 2015
Transforming the present, sustaining the future 77
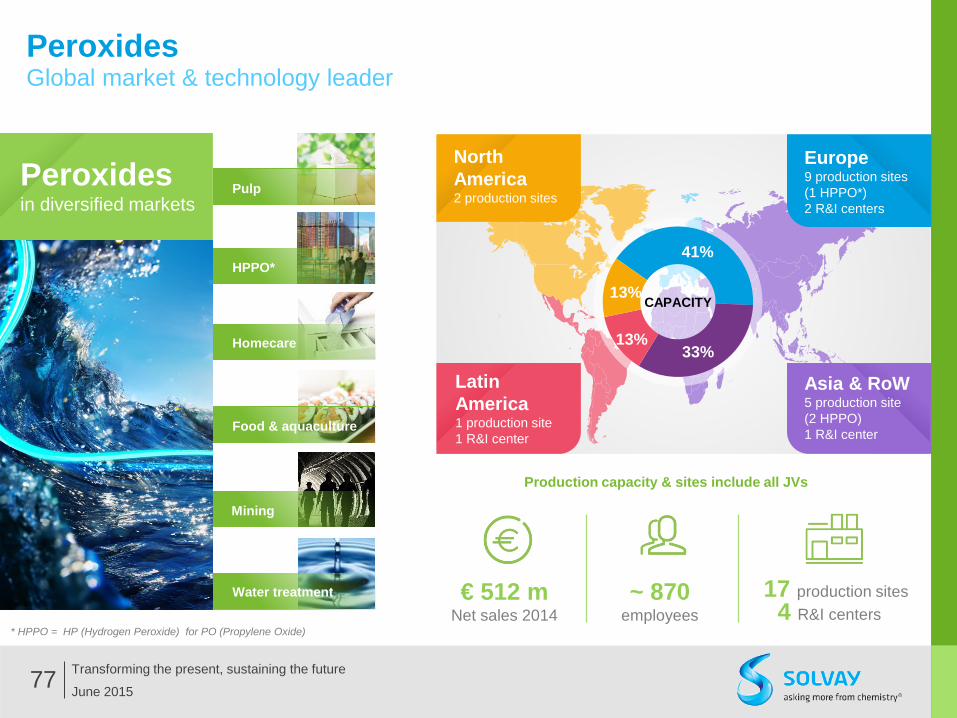
Peroxides Global market & technology leader
Peroxides in diversified markets
Homecare
North America 2 production sites
Pulp
Food & aquaculture
CAPACITY
41%
33% 13%
13%
Europe 9 production sites (1 HPPO*) 2 R&I centers
Asia & RoW 5 production site (2 HPPO) 1 R&I center
€ 512 m Net sales 2014
~ 870 employees
17 production sites 4 R&I centers
HPPO*
Mining
Water treatment
* HPPO = HP (Hydrogen Peroxide) for PO (Propylene Oxide)
Production capacity & sites include all JVs
Latin America 1 production site 1 R&I center
June 2015
Transforming the present, sustaining the future 78
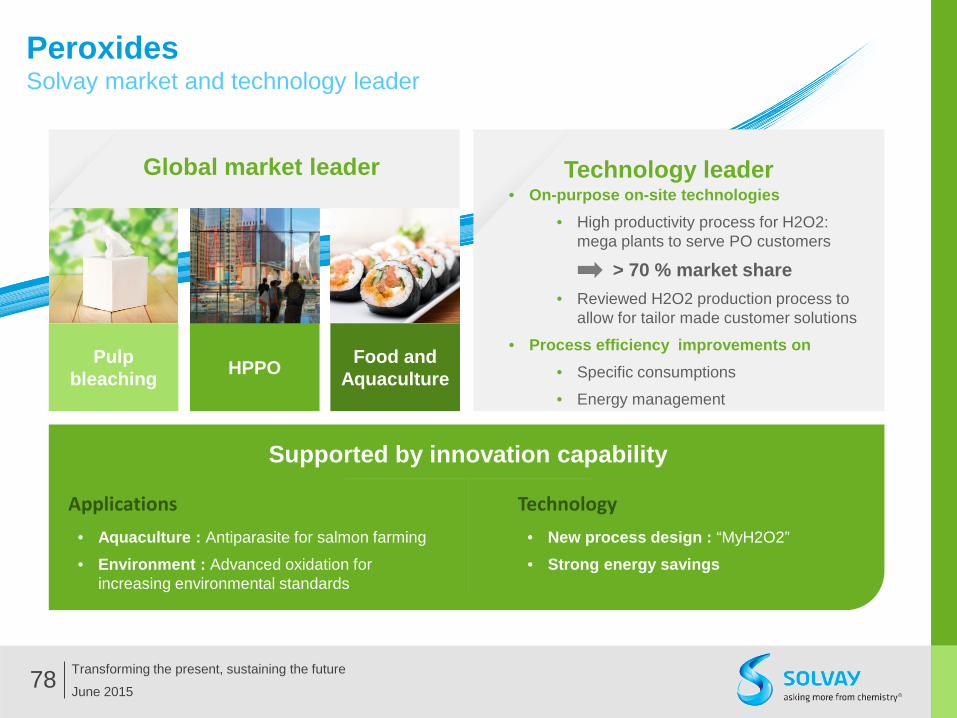
Peroxides Solvay market and technology leader
Global market leader Technology leader • On-purpose on-site technologies
• High productivity process for H2O2: mega plants to serve PO customers
> 70 % market share • Reviewed H2O2 production process to
allow for tailor made customer solutions
• Process efficiency improvements on • Specific consumptions
• Energy management
Applications • Aquaculture : Antiparasite for salmon farming
• Environment : Advanced oxidation for increasing environmental standards
Technology • New process design : “MyH2O2”
• Strong energy savings
Supported by innovation capability
Pulp bleaching HPPO Food and
Aquaculture
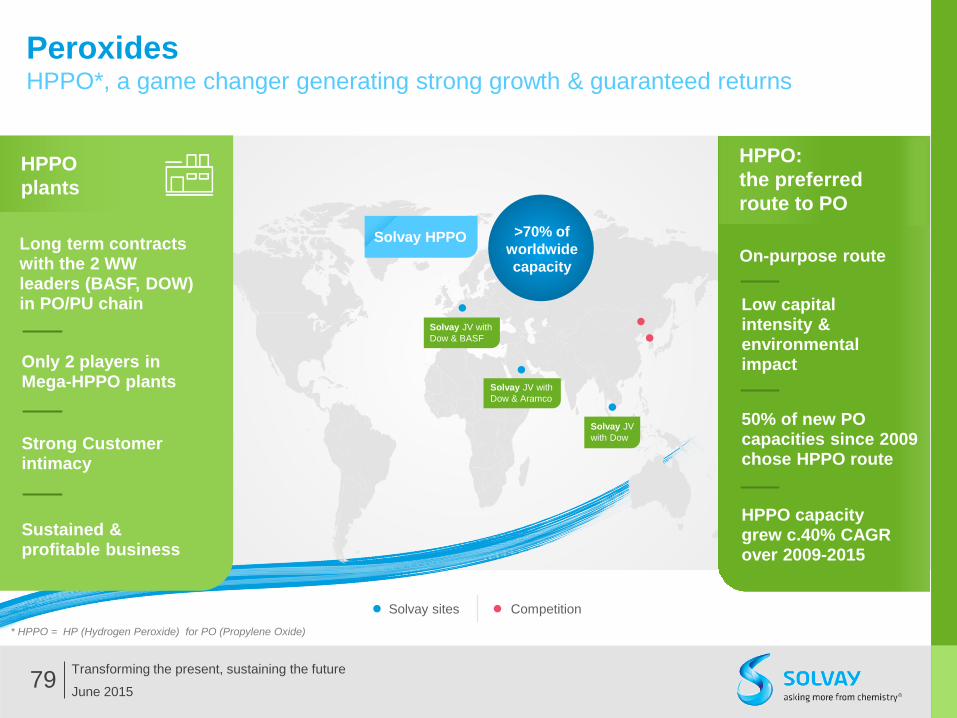
Solvay JV with Dow & BASF
Solvay JV with Dow & Aramco
Solvay JV with Dow
Solvay sites Competition
>70% of worldwide capacity
June 2015
Transforming the present, sustaining the future 79
Peroxides HPPO*, a game changer generating strong growth & guaranteed returns HPPO plants
Long term contracts with the 2 WW leaders (BASF, DOW) in PO/PU chain
Only 2 players in Mega-HPPO plants
Strong Customer intimacy
Sustained & profitable business
HPPO: the preferred route to PO
On-purpose route
Low capital intensity & environmental impact
50% of new PO capacities since 2009 chose HPPO route
HPPO capacity grew c.40% CAGR over 2009-2015
Solvay HPPO
* HPPO = HP (Hydrogen Peroxide) for PO (Propylene Oxide)
Net
Sales 2014
Europe 2 production sites
1 R&I center
Asia & RoW 1 production site
North America 1 production J/V
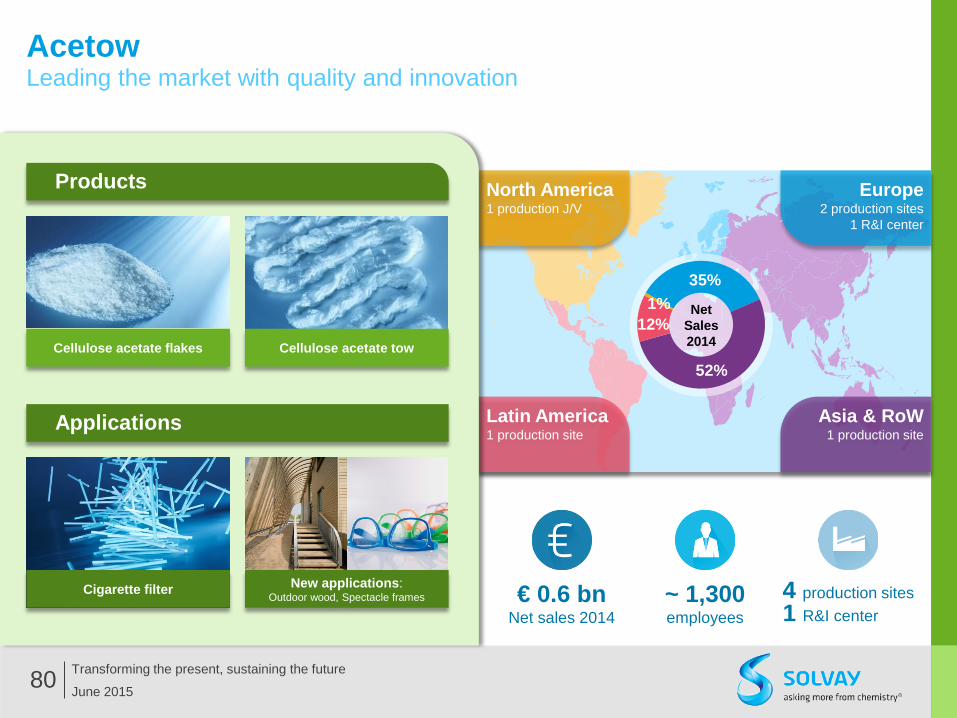
€ 0.6 bn Net sales 2014
~ 1,300 employees
4 production sites 1 R&I center
35%
52%
12% 1%
Latin America 1 production site
June 2015
Transforming the present, sustaining the future 80
Acetow Leading the market with quality and innovation
Products
Applications
Cellulose acetate flakes Cellulose acetate tow
New applications: Outdoor wood, Spectacle frames Cigarette filter
Net
Sales 2014
Europe 1 R&I center
Asia & RoW 1 production site
June 2015
Transforming the present, sustaining the future 81
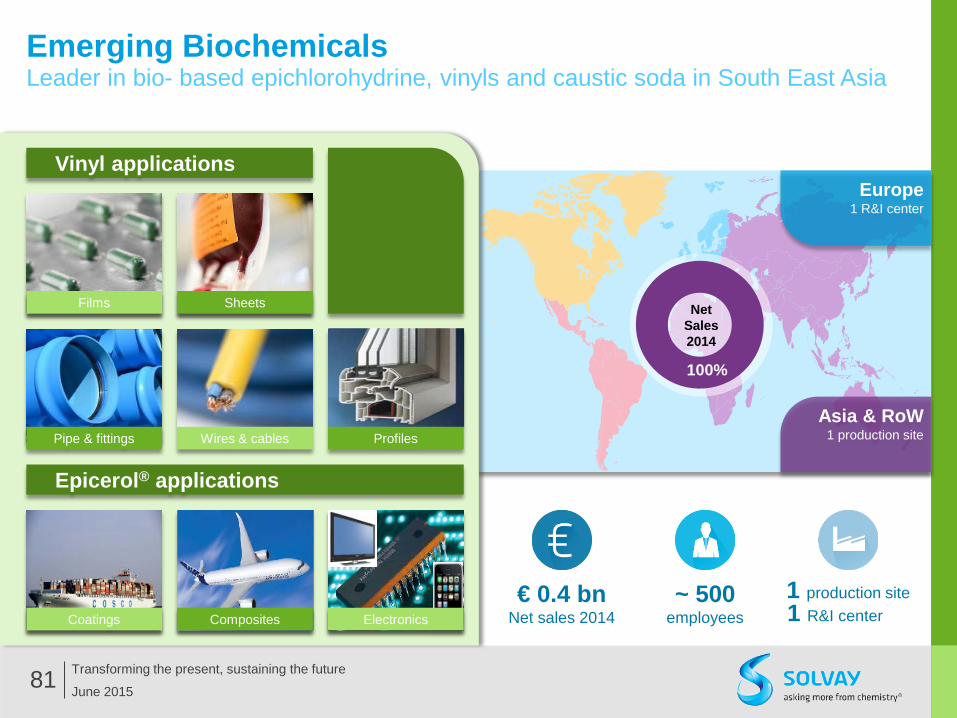
Emerging Biochemicals Leader in bio- based epichlorohydrine, vinyls and caustic soda in South East Asia
€ 0.4 bn Net sales 2014
~ 500 employees
1 production site 1 R&I center
100%
Profiles Pipe & fittings
Films
Coatings
Composites
Epicerol® applications
Vinyl applications
Sheets
Electronics
Wires & cables
Polyamide Chlorovinyls
93%
7%
Polyamide
Chlorovinyls
49%
31%
14% 6% Europe
Asia & RoW
Latin America
North America
44%
31%
1% 0% 10%
3% 11%
Aeronautics & Automotive
Consumers goods & Healthcare
Agro-Food
Energy & Environment
Building & Construction
Electricals & Electronics
Industrial Applications
29/07/2015
Q2 2015 results 82
Functional Polymers
The key success factor of this Segment, which primarily groups the Polyamide activities, is continuous manufacturing optimization. Solvay is one of few players to operate across the entire polyamide 6.6 chain.
Transforming the present, sustaining the future 83
Polyamide Integrated polyamide player
€ 1.5 bn Net sales 2014
~ 3,600 employees
14 production sites 9 R&I centers
48%
33% 15%
4%
Latin America 4 production sites 3 R&I centers
3 business units
Engineering Plastics
Fibras
Polyamide & Intermediates
29/07/2015
Q2 2015 results 84
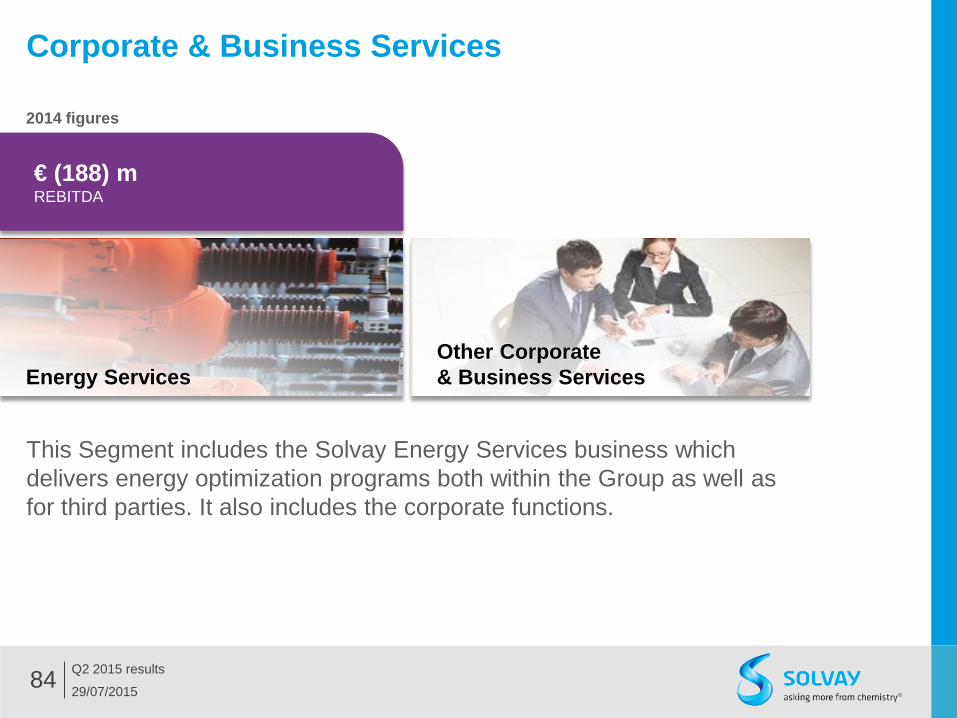
Corporate & Business Services
This Segment includes the Solvay Energy Services business which delivers energy optimization programs both within the Group as well as for third parties. It also includes the corporate functions.
€ (188) m REBITDA
2014 figures
Energy Services Other Corporate & Business Services
29/07/2015
Q2 2015 results 85
Executing a clear value creation strategy
Towards a higher growth, less cyclical & greater returns Chemical Group
Targeting Sustainable Value Growth
www.solvay.com Feedback expected by end March 2015 MARCH 9 2015