> SECOND QUARTER 2005 REPORT TO SHAREHOLDERS Toronto, May 31, 2005 – Scotiabank had another record performance with net income of $826 million in the second quarter of 2005. Earnings per share (diluted) were $0.81, up from $0.75 in the same period last year. Return on equity was strong at 22.3%. “Our second quarter earnings demonstrate the value of Scotiabank’s business line diversity,” said Rick Waugh, President and CEO. “Contributing to our record results were lower loan losses combined with the continued strength of our main business lines – Domestic Banking, Scotia Capital and International Banking. “Domestic Banking operations enjoyed strong contributions from many areas, particularly mortgages and other areas of retail lending, where we continued to achieve solid year-over-year gains in market share. Our International Banking operations also performed well, particularly Scotiabank Inverlat, which had strong success in both retail and commercial lending. Scotia Capital benefited from a third consecutive quarter of net loan loss recoveries, although trading revenues were down from the previous quarter’s record. “The Bank’s capital position continues to be very strong, providing us with the flexibility to consider a broad range of growth options and, when coupled with our strong earnings, allowed us to once again increase the quarterly dividend. “We are pleased with our solid performance through the first half of the year, having met or exceeded all of our key performance targets. While our operating environment continues to be challenging, we expect to meet all of our 2005 targets.” Live audio Web broadcast of the Bank’s analysts’ conference call. See page 23 for details. Scotiabank reports record earnings Second quarter highlights compared to the same period a year ago: – Net income of $826 million, up 5% from $784 million – Earnings per share (diluted) of $0.81, an increase of 8% from $0.75 – Return on equity of 22.3%, compared to 21.8% – Tier 1 capital ratio of 11.4%, up from 11.2% Quarterly dividend increased 2 cents to 34 cents per common share. Year-to-date performance versus our 2005 targets was as follows: 1. TARGET: Earn a return on equity (ROE) of 17 to 20%. For the six months, Scotiabank earned an ROE of 21.6%. 2. TARGET: Generate growth in earnings per share (diluted) of 5 to 10% per year. Our year- over-year growth was 11%. 3. TARGET: Maintain a productivity ratio of less than 58%. Scotiabank’s performance was 55.6%. 4. TARGET: Maintain strong capital ratios. At 11.4%, Scotiabank’s Tier 1 capital ratio remains among the highest of the Canadian banks and strong by international standards. Scotiabank Second Quarter Report 2005 1 Q2/05
Transcript
> S E C O N D Q U A R T E R 2 0 0 5 R E P O R T T O S H A R E H O L D E R S
Toronto, May 31, 2005 –
Scotiabank had another record
performance with net income of
$826 million in the second quarter
of 2005. Earnings per share
(diluted) were $0.81, up from
$0.75 in the same period last year.
Return on equity was strong at
22.3%.
“Our second quarter earnings
demonstrate the value of
Scotiabank’s business line
diversity,” said Rick Waugh,
President and CEO. “Contributing
to our record results were lower
loan losses combined with the
continued strength of our main
business lines – Domestic Banking,
Scotia Capital and International
Banking.
“Domestic Banking operations
enjoyed strong contributions from
many areas, particularly
mortgages and other areas of retail
lending, where we continued to
achieve solid year-over-year gains
in market share. Our International
Banking operations also
performed well, particularly
Scotiabank Inverlat, which had
strong success in both retail and
commercial lending. Scotia Capital
benefited from a third consecutive
quarter of net loan loss recoveries,
although trading revenues were
down from the previous quarter’s
record.
“The Bank’s capital position
continues to be very strong,
providing us with the flexibility to
consider a broad range of growth
options and, when coupled with
our strong earnings, allowed us to
once again increase the quarterly
dividend.
“We are pleased with our solid
performance through the first half
of the year, having met or
exceeded all of our key
performance targets. While our
operating environment continues
to be challenging, we expect to
meet all of our 2005 targets.”
Live audio Web broadcast of the Bank’s analysts’ conference call. See page 23 for details.
Scotiabank reports record earnings Second quarter highlights compared to the same period a year ago:
– Net income of $826 million, up 5% from $784 million
– Earnings per share (diluted) of $0.81, an increase of 8% from $0.75
– Return on equity of 22.3%, compared to 21.8%
– Tier 1 capital ratio of 11.4%, up from 11.2%
Quarterly dividend increased 2 cents to 34 cents per common share.
Year-to-dateperformance versusour 2005 targetswas as follows:
1. TARGET: Earn a return on equity
(ROE) of 17 to 20%. For the six
months, Scotiabank earned an
ROE of 21.6%.
2. TARGET: Generate growth in
earnings per share (diluted) of
5 to 10% per year. Our year-
over-year growth was 11%.
3. TARGET: Maintain a productivity
ratio of less than 58%.
Scotiabank’s performance
was 55.6%.
4. TARGET: Maintain strong capital
ratios. At 11.4%, Scotiabank’s
Tier 1 capital ratio remains
among the highest of the
Canadian banks and strong by
international standards.
Scot iabank Second Quarter Report 2005 1
Q2/05
ENG_Q2_2005 5/26/05 9:25 PM Page 1
> F INANCIAL HIGHLIGHTS
2 Scot iabank Second Quarter Report 2005
As at and for the three months ended For the six months endedApril 30 January 31 April 30 April 30 April 30
(Unaudited) 2005 2005 2004 2005 2004Operating results ($ millions)Net interest income(1) (TEB(2)) 1,552 1,503 1,521 3,055 3,017Total revenue(1) (TEB(2)) 2,688 2,614 2,770 5,302 5,306Provision for credit losses 35 74 130 109 300Non-interest expenses 1,490 1,457 1,523 2,947 2,929Provision for income taxes(1) (TEB(2)) 320 278 311 598 560Net income(1) 826 788 784 1,614 1,472Net income available to common shareholders 822 784 780 1,606 1,464
Operating performanceBasic earnings per share($) 0.82 0.78 0.77 1.60 1.45Diluted earnings per share($) 0.81 0.77 0.75 1.58 1.42Return on equity (%) 22.3 21.0 21.8 21.6 20.6Productivity ratio(1) (%) (TEB(2)) 55.4 55.7 55.0 55.6 55.2Net interest margin on total average assets(1) (%) (TEB(2)) 2.07 2.00 2.16 2.04 2.13
Balance sheet information ($ millions)Cash and securities 93,439 89,118 81,273Loans and acceptances 192,776 188,617 179,887Total assets 309,090 300,547 283,634Deposits 214,782 206,866 197,641Preferred shares(1) 600 300 300Common shareholders’ equity 15,344 14,918 14,857Assets under administration 162,962 158,030 162,274Assets under management 23,354 22,591 20,929
Capital measuresTier 1 capital ratio (%) 11.4 11.2 11.2Total capital ratio (%) 13.4 13.5 13.6Tangible common equity to risk-weighted assets(3) (%) 9.5 9.5 9.4Risk-weighted assets ($ millions) 160,057 155,498 155,679
Credit qualityNet impaired loans(4) ($ millions) 666 762 1,371General allowance for credit losses ($ millions) 1,375 1,375 1,475Net impaired loans as a % of loans and acceptances(4) 0.35 0.40 0.76Specific provision for credit losses as a % of
average loans and acceptances (annualized) 0.07 0.16 0.30 0.12 0.34
Shares outstanding(millions)Average (basic) 996 1,006 1,011 1,001 1,011Average (diluted) 1,011 1,021 1,028 1,016 1,028End of period 994 998 1,009
Dividends per share($) 0.32 0.32 0.25 0.64 0.50Dividend yield (%) 3.2 3.3 2.8 3.3 2.9Dividend payout ratio(5) (%) 38.7 41.1 32.4 39.9 34.5Market capitalization ($ millions) 39,734 39,425 35,452Book value per common share($) 15.44 14.95 14.73Market value to book value multiple 2.6 2.6 2.4Price to earnings multiple (trailing 4 quarters) 13.2 13.3 13.0
Other informationEmployees 44,094 43,930 44,294Branches and offices 1,871 1,871 1,869
Certain comparative amounts in this quarterly report have been reclassified to conform with current period presentation.
(1) Amounts have been retroactively restated as required by a new accounting pronouncement on liabilities and equity (refer to Note 1 on page 19).(2) The adjustment that changes GAAP measures to taxable equivalent basis (TEB) measures is discussed in footnotes (2) and (3) on page 12.(3) Represents common shareholders’ equity and non-controlling interest in subsidiaries, less goodwill and other intangible assets, as a percentage of
risk-weighted assets. (4) Net impaired loans are impaired loans less the specific allowance for credit losses.(5) Represents common dividends for the period as a percentage of the net income available to common shareholders for the period.
ENG_Q2_2005 5/26/05 9:25 PM Page 2
> MESSAGE TO STAKEHOLDERS
Scot iabank Second Quarter Report 2005 3
Strategies for successAlthough we expect to continue to face many challenges in the balance of the year, we remainconfident that we will achieve our goals for 2005, as well as our longer-term objective: to be the bestCanadian-based international financial services company. We have three strong business lines, a verysolid capital position, and a great team of people dedicated to helping our customers become financiallybetter off.
Build our customer baseAcross the Scotiabank Group, we will build our customer base by cultivating deeper, more profitablerelationships with our current customers and by acquiring new customers. A key priority will be tomaintain the leadership position in customer satisfaction that we enjoy in many of our major markets.
Domestically, we will focus on current customers with high growth potential, and refer them to otherpartners within the Scotiabank Group, when appropriate. We will also use our branch network, indirectchannels and an aggressive new marketing program to acquire new customers. Internationally, we willcontinue to offer a broad range of products and services, such as mortgages and auto loans in Mexico andinsurance and wealth management in the Caribbean. And in Scotia Capital, we will deepen our relation-ships with core clients through increased cross-sell of products and services.
Lever core strengthsWe will gain efficiencies across the Scotiabank Group by levering our core strengths and expertise. Wewill take best practices developed in Canada, adjust them for local markets and demographics, and rollthem out internationally – as we are doing with the Sales & Service program in the Caribbean, and SharedServices in Latin America. By doing so, we can focus our resources more effectively and allocate signifi-cantly more time in our branches to sales and customer service activities.
We are also working to leverage Scotia Capital’s capabilities in Canada and the U.S. with ScotiabankInverlat’s in Mexico, with the goal of offering our clients a truly integrated North American wholesalebanking platform.
Optimize use of capitalFinally, we will make optimal use of our very strong capital base, deploying it in a way to support organicgrowth and to make acquisitions.
We are always looking for ways to bolster our multinational operations through disciplined acquisitions,particularly in Mexico, the Caribbean, Central America and Asia. We will also assess a range of opportu-nities in Domestic Banking and Scotia Capital.
While pursuing these strategies, we will continue to maintain our focus on people – our employees andthe communities we serve, as well as our shareholders and customers. We are committed to being aleader in corporate social responsibility, which encompasses the way we interact with our stakeholders tomeet our social, economic, environmental and ethical responsibilities.
We believe we have the right strategies in place to maintain our long record of success, and the rightpeople to execute them. We look forward to continued strong results that will benefit all of our majorstakeholders in 2005.
Rick WaughPresident and Chief Executive Officer
ENG_Q2_2005 5/26/05 9:25 PM Page 3
> ACHIEVEMENTS
4 Scot iabank Second Quarter Report 2005
Domestic Banking• In keeping with our commitment to help our customers
become financially better off, in March we introducedthe Scotia Flex Value™ Mortgage, an innovative five-year variable rate mortgage, offering customers aninterest rate below prime, a low payment amount, andadded security against rising interest rates with specialearly renewal options. Also, the Long and ShortMortgage was reintroduced. This pre-set mortgagebundle under our Scotia Total Equity Plan® combinesthe Scotia Flex Value ™ Mortgage with a competitivelypriced 5-year fixed-rate mortgage, allowing ourcustomers to take advantage of lower short-term rates,while mitigating against rate increases over the long term.
• We continue to look for cost-effective ways to buildrelationships with new and existing customers throughinnovative programs such as permission-based e-mailmarketing. In the past 12 months, the number ofpermission-based e-mails has grown ten-fold, and isgrowing at a rate of more than 30,000 per month. We are using this technology to assist our customers inaddressing their financial needs. For example, in a pilotprogram, more than 50% of mortgage leads generatedthrough e-mail resulted in a new mortgage sale withinsix months. This program is being rolled out nationally.
• Net sales of Scotia Partners Portfolios funds were $296 million during the quarter, up 33% over last year.Assets in these diversified, primarily non-proprietary,funds of funds reached a significant milestone of $1 billion, a very strong performance for funds that werelaunched less than three years ago.
International Banking• We continue to see increased customer acceptance of
alternate delivery networks in the Caribbean and CentralAmerica region. Year over year, ABM transactionvolumes increased 18%. As well, additional ABMs wereinstalled during the quarter, bringing the number ofABMs in the region to 550. In addition, internet bankingusage in the region continues to expand, with a 6% growth in new users in the second quarter.
• TRADEXPRESS elite, the new trade finance onlineservice that provides a full range of letter of creditfunctionality for both importers and exporters, is nowavailable in more than 20 countries. Scotiabankbranches and their customers are now receiving reportselectronically, and the service has streamlined and elimi-nated much of the manual work. We are currently in atest phase with clients in Mexico and Chile, with anexpected launch in the third quarter.
Scotia Capital• Scotia Capital has been named Best Investment Bank in
Canada for the second year in a row by Global Financemagazine.
• In the largest leveraged buyout transaction in Canadianhistory, Scotia Capital acted as the exclusive financialadvisor to Kohlberg Kravis Roberts & Co. on their $3.2 billion purchase of Masonite InternationalCorporation, the largest door manufacturer in the world.We also underwrote, as joint lead arranger, US$2.3billion in credit facilities used to finance the acquisition.Subsequently, significant investor demand allowed us to syndicate more than 90% of our commitment.
• An initiative has been launched with Scotiabank Inverlatto leverage the Bank’s wholesale banking capabilities inCanada and the U.S., thereby creating a unique NAFTA-wide platform.
Employee highlights• For the second year in a row, Scotiabank ranked among
Training magazine’s top 100 training organizations inthe world. This survey recognizes organizations “thatexcel at human capital development” and signalsScotiabank’s ongoing commitment to the development of its employees.
• The Employee Assistance Society of North Americarecognized Scotiabank for its strong EmployeeAssistance Program (EAP), awarding the Bank its firstannual Corporate Award of Excellence. The awardacknowledged strong services, cutting-edge delivery,and “the successful integration of EAP as part of theiroverall business strategy.”
• For the second year in a row, The Great Place to WorkInstitute distinguished Scotiabank Inverlat as one of the50 best companies to work for in Mexico. No otherfinancial institution has received this recognition for twoconsecutive years. Among companies that have morethan 500 employees, Scotiabank Inverlat was the highest ranked.
Community involvement• Scotiabank recently made commitments to universities
in Atlantic Canada totaling $1.25 million. At theUniversity of New Brunswick, the funds will supportStudy Abroad programs for students on both theFredericton and Saint John campuses. At St. Mary’s inHalifax, Scotiabank will sponsor a state-of-the-artconference theatre at the University’s school of business.
ENG_Q2_2005 5/26/05 9:25 PM Page 4
> MANAGEMENT’S D ISCUSSION & ANALYSIS
Scot iabank Second Quarter Report 2005 5
The Bank achieved record results this quarter, with netincome up 5% over both the same quarter last year andthe first quarter. Similar to last year, the second quarterincluded a gain on the sale of a portion of the Bank’sinvestment holding in Shinsei Bank of Japan. On a year-to-date basis, net income was 10% higher than the sameperiod last year, as lower loan loss provisions more thanoffset reduced securities gains. Foreign currency trans-lation has had less of an impact on the comparison ofquarter-over-quarter results this year. However, thestrengthening of the Canadian dollar against mostcurrencies in the latter part of 2004 resulted in a $47 million reduction in net income this quarter over the comparable period last year.
Total revenueThe $2,688 million total revenue earned this quarter (on ataxable equivalent basis) was down $82 million or 3% fromthe same quarter last year, due entirely to the impact offoreign currency translation. Total revenue however, wasup $74 million or 3% over the last quarter due to highersecurities gains and net interest income this quarter.
Year-to-date revenue of $5,302 million was relativelyunchanged from the same period last year, but excludingthe effect of foreign currency translation, increased 3%.
Net interest income (taxable equivalent basis)This quarter’s net interest income of $1,552 million was2% higher than the same quarter last year, or up 5% afterexcluding the impact of foreign currency translation. Netinterest income was also 3% higher than the prior quarter,despite the second quarter having three fewer days.
Canadian currency net interest income grew $44 millioncompared to the same quarter last year, due primarily tohigher securities income earned in Scotia Capital and theBank’s treasury operations. Net interest income inDomestic Banking fell, notwithstanding the continuedgrowth in residential mortgages and personal lendingvolumes, and year-over-year market share gains. Morethan offsetting the favourable volume impact was acompressed margin due to the continued low level ofinterest rates and changing customer preferences towardsvariable-rate mortgages.
Compared to the first quarter, Canadian currency netinterest income was up $22 million, as higher securitiesincome and increased volumes were partially offset by theimpact of three fewer days this quarter. The margin wasrelatively unchanged from last quarter.
Foreign currency net interest income in the secondquarter fell 2% from the same quarter last year. However,excluding the negative impact from foreign currencytranslation, net interest income was up 5%. Compared to
last quarter, foreign currency net interest income rose 4%,due mainly to strong retail asset growth in ScotiabankInverlat in Mexico, as well as higher securities income.
On a year-to-date basis, total net interest income of$3,055 million was relatively flat compared to the sameperiod last year, but increased 4%, excluding the negativeimpact of foreign currency translation. This underlyinggrowth was primarily in foreign currency net interestincome.
The total interest margin was 2.07% this quartercompared to 2.16% in the second quarter of last year and2.00% last quarter. The interest margin for the six-monthperiod was 2.04%, down from 2.13% for the comparativeperiod last year, with the entire reduction arising from theCanadian margin.
Other incomeIn the second quarter, other income totaled $1,136 million,compared to $1,249 million in the same quarter last year.The decrease was due primarily to lower gains oninvestment securities and the negative impact of foreigncurrency translation of $38 million. While both quartersbenefited from the inclusion of a similar gain on the sale ofa portion of the Bank’s investment holding in Shinsei Bankin Japan, the balance of the net gains on investmentsecurities were down $106 million. This decline wasaccompanied by lower levels of investment bankingrevenues and credit fees. As well, there were lower securi-tization revenues due to run-off of credit card andScotiaLine securitization programs and lower profits fromthe sale of mortgages into the Canada Mortgage Bondprogram. On the positive side, there were higher tradingrevenues and retail brokerage fees from increasedcustomer activity in the current period.
Other income rose $25 million or 2% from last quarter,due to stronger retail brokerage fees and a gain on the saleof a restructured loan asset. There were also higher netgains on investment securities, although excluding thegain on the sale of Shinsei, securities gains fell by $46 million from last quarter, largely because of write-downs of some merchant banking investments. As well,there were lower revenues from trading and investmentbanking activities compared to the record amounts earnedlast quarter.
For the six-month period ended April 30, 2005, otherincome was $2,247 million, a 2% decrease from thecomparative period last year. Strong year-over-year growthin trading revenues, retail brokerage and deposit serviceswere more than offset by reductions in net gains oninvestment securities, credit fees and securitizationrevenues.
May 31, 2005
Group Financial Performance and Financial Condition
ENG_Q2_2005 5/27/05 1:29 PM Page 5
> MANAGEMENT’S D ISCUSSION & ANALYSIS
6 Scot iabank Second Quarter Report 2005
Provision for credit lossesThe credit environment continued to be good this quarter,which resulted in the lowest level of quarterly specificprovisions in a number of years. Provisions for creditlosses were $35 million in the second quarter, animprovement of $95 million from the same quarter lastyear, and $39 million below last quarter. For the six-monthperiod, total provisions for credit losses totaled $109million, which was $191 million or 64% lower than thecomparative period last year.
Non-interest expenses and productivityNon-interest expenses continued to be well contained.The Bank’s productivity ratio, reflecting the efficiency ofoperations, was 55.4%, relatively unchanged from 55.0%for the second quarter last year and 55.7% last quarter.The year-to-date productivity ratio was 55.6% comparedto 55.2% last year.
Total non-interest expenses were $1,490 million thisquarter, $33 million or 2% lower than the same quarter lastyear, including $23 million from the effect of foreigncurrency translation. The remaining decline was due tolower stock-based compensation caused by smallerchanges in the Bank’s share price, as well as reducedemployee benefit expenses.
Compared to last quarter, non-interest expenses rose$33 million or 2%. This was the result of small increasesacross a number of expense categories, includingemployee benefit expenses, technology, advertising andcapital taxes. This growth was moderated by the impact ofthree fewer days in the quarter and lower performance-driven compensation in Scotia Capital.
On a year-to-date basis, total non-interest expenses of$2,947 million were up $18 million from the comparativeperiod last year. Excluding the effect of foreign currencytranslation, there was an increase of $70 million or 2%.Performance-driven compensation was higher, in line withstronger trading and retail brokerage revenues this year,although this was offset by lower stock-based compen-sation and employee benefit expenses.
TaxesThe effective tax rate for this quarter was 21.2%, comparedto 23.4% for the comparative quarter last year and 20.1%last quarter. The year-over-year decline was due primarilyto higher earnings of subsidiaries in lower tax jurisdictions,as well as the lower tax rate on certain securities gains.These were partially offset by a decline in the value offuture tax assets in Inverlat as a result of announced reductions in Mexican income tax rates. The effective taxrate for the six months ended April 30, 2005, was 20.6%versus 22.0% in the comparable period last year.
Risk managementThe Bank’s risk management policies and practices areunchanged from those outlined on pages 54 to 63 of the2004 Annual Report.
Credit riskThe total provision for credit losses was $35 million thisquarter, down from $74 million in the previous quarter,and a substantial improvement from $130 million in thesame period a year ago. Most of this improvementoccurred in the Scotia Capital portfolio.
Credit quality in the domestic retail and commercialportfolios remained strong, as total provisions for creditlosses in the second quarter of $66 million were the lowestlevel in recent quarters.
Provisions for credit losses in international operationswere comparable to last year. However, they were up fromthe first quarter due mainly to the unusually low levels inthat period.
Scotia Capital had a net recovery of $57 million thisquarter, the third consecutive quarter of net recoveries.This quarter’s recoveries reflect a significant improvementfrom the $32 million credit loss experienced in the sameperiod last year, and the $9 million recovery last quarter.The period-over-period improvements were largely in theU.S. portfolio, and resulted from lower levels of new provi-sions together with higher provision reversals and recov-eries, partially from some loan sales in the quarter.
Total net impaired loans, after deducting the specificallowance for credit losses, were $666 million, substantiallyimproved from $1,371 million last year and $762 million lastquarter. After deducting the general allowance for creditlosses, net impaired loans were negative $709 million.
Although the current credit environment remainsfavourable, the Bank continues to actively monitor certainindustries that are exhibiting signs of stress. Presently, thisincludes the North American automotive industry, whichfaces a number of challenges. While the Bank does nothave a significant concern with its exposure to this sector,it is closely following industry trends that may affect credit quality.
While the level of recoveries to date will likely not besustained, specific provisions for credit losses for 2005 areexpected to be below last year. As well, if the recenttrends in credit quality continue, there will likely be areduction in the general allowance for credit losses in thesecond half of 2005.
Market riskValue at Risk (VaR) is a key measure of market risk in theBank’s trading activities. The average one-day VaRdecreased from $8.4 million in the first quarter and $8.2 million last year to $6.8 million. The quarter-over-
ENG_Q2_2005 5/26/05 9:25 PM Page 6
> MANAGEMENT’S D ISCUSSION & ANALYSIS
Scot iabank Second Quarter Report 2005 7
quarter decrease was in foreign exchange exposure. ThisVaR level is at the low end of the range experienced overrecent quarters.
Average for the three months ended
Risk factor April 30 January 31 April 30($ millions) 2005 2005 2004
Interest rate $ 5.4 $ 4.8 $ 7.0
Equities 4.2 4.1 4.5
Foreign exchange 1.1 5.4 1.2
Commodities 0.4 0.6 1.0
Diversification (4.3) (6.5) (5.5)
All-Bank VaR 6.8 8.4 8.2
There were three days of trading losses in the secondquarter compared to one day in the previous quarter. Thelosses were well within the range predicted by VaR.
Liquidity riskThe Bank maintains large holdings of liquid assets tosupport its operations. These assets can be sold orpledged to meet the Bank’s obligations. As at April 30,2005, liquid assets were $81 billion or 26% of total assets,up $5 billion over last quarter. Liquid assets werecomprised of 75% securities and 25% cash and depositswith banks. These levels are generally unchanged from theprior quarter.
In the course of the Bank’s day-to-day activities,securities and other assets are pledged to secure anobligation, participate in clearing or settlement systems, oroperate in a foreign jurisdiction. Securities may also besold under repurchase agreements. As at April 30, 2005,total assets pledged or sold under repurchase agreementswere $42 billion (January 31, 2005 – $41 billion). Themajority of these assets relate to repurchase agreements,as well as pledges for securities borrowing and lendingactivities.
Related party transactionsDuring this quarter, the Bank did not change the proce-dures and policies in place over related party transactions.Commercial arrangements entered into by the Bank withits associated and other related corporations, its directorsand officers and companies controlled by its directors, areconducted at market terms and conditions and follownormal credit and other review processes within the Bank.
Balance sheetThe Bank’s total assets were $309 billion as at April 30,2005, $30 billion or 11% higher than October 31, 2004.The growth in assets was $18 billion after excluding theimpact of foreign currency translation of $5 billion, andthe consolidation of multi-seller commercial paperconduits of $7 billion in 2005 as a result of changes in
Canadian accounting standards. This underlying growthwas spread across most categories of assets.
Domestic retail lending operations continued toperform very well, buoyed by the ongoing demand in thehousing and home renovation markets. The ScotiaLineproducts as well as residential mortgages continued toshow strong growth and were the main contributors to a$4 billion increase in retail loans, before securitizations.Additionally, International Banking’s retail operations inMexico and the Caribbean made solid gains, with assets up$1 billion over October 31, 2004. Business lendingincreased $3 billion due to the contributions of Inverlatand small increases in many other areas of the Bank’soperations. Securities purchased under resale agreementswere also $3 billion higher.
Securities increased $8 billion from October 31, 2004,excluding the impact of foreign currency translation andthe consolidation of multi-seller commercial paperconduits. Trading securities were up $6 billion, primarily inScotia Capital where these securities are used to hedgemarket risk related to trading activities with customers. As well, investment securities grew by $2 billion.
As at April 30, 2005, the surplus of the market valueover book value of the Bank’s investment securities was$988 million, down $186 million from last quarter, duemainly to the pre-tax gain of $118 million realized on thepartial disposition of the Bank’s investment holding inShinsei, as well as market price reductions in certainemerging market securities.
At April 30, 2005, total liabilities were $293 billion, anincrease of $29 billion or 11% from October 31, 2004.Deposit liabilities grew by $20 billion, or $16 billion afterexcluding the effect of foreign currency translation. Therewas solid expansion in personal term deposits of $2 billion.As well, there were higher business and governmentdeposits of $11 billion in order to fund asset growth. There was also a significant increase in other liabilities of$7 billion, which was directly related to the consolidationof variable interest entities.
Capital managementThe Bank’s capital position remains very strong. The Tier 1capital ratio was 11.4% this quarter, compared to 11.2 % ayear ago and last quarter. The increase was due in part tothe $300 million non-cumulative preferred shares issued this quarter.
The tangible common equity (TCE) ratio, which repre-sents common equity less intangibles as a percentage ofrisk-weighted assets, continued to be the strongest of themajor Canadian banks. This ratio was 9.5% at April 30,2005, versus 9.4% in the second quarter last year and9.5% last quarter.
ENG_Q2_2005 5/26/05 9:25 PM Page 7
> MANAGEMENT’S D ISCUSSION & ANALYSIS
8 Scot iabank Second Quarter Report 2005
Financial instrumentsThe Bank’s balance sheet is comprised substantially offinancial instruments as these are a significant part of theBank’s business. There are various measures that reflectthe level of risk associated with the Bank’s portfolio offinancial instruments. Further discussion on some of theserisk measures is included in the Risk Management section above.
The basis of calculating fair values was unchanged fromOctober 31, 2004. There were no significant changes in fairvalue of financial instruments that arose from factors otherthan normal economic, industry and market conditions.
Total derivative notional amounts were $1,023 billion,compared to $991 billion as at January 31, 2005. As well,the percentage of those derivatives held for trading andthose held for non-trading or asset liability managementwas generally unchanged.
Off-balance sheet arrangementsThe Bank enters into contractual arrangements, in thenormal course of business, that are not required to beconsolidated in its balance sheet. These arrangements areprimarily in three categories: variable interest entities(VIEs), guarantees and loan commitments, and securitiza-tions. There are no material contractual obligations thatare outside of the ordinary course of business.
There were no significant new arrangements with VIEsthat were entered into during the quarter. Guarantees andloan commitments increased by $2 billion from lastquarter, due mainly to the inclusion of liquidity facilities ofa Bank-administered multi-seller conduit that was decon-solidated this quarter. Fees from guarantees and loancommitment arrangements, recorded in other income,were $57 million for the three-month period ended April30, 2005, compared to $65 million for the same period ayear ago.
The Bank securitized a further $644 million inresidential mortgages in the current quarter as a cost-effective method of funding the significant growth inmortgages. As at April 30, 2005, $7,948 million ofmortgages were securitized.
Common dividendThe Board of Directors, at its meeting on May 31, 2005,approved an increase in the quarterly dividend of 2 centsper common share to 34 cents per share, payable on July 27, 2005 to shareholders of record as of July 5, 2005.This continues the Bank’s excellent track record ofgrowing its annual dividend.
OutlookGlobal economic growth has moderated in the openingmonths of 2005 and will likely continue to do so over thebalance of the year. While activity within the NAFTA zonewill mirror this general trend, the overall pace of growthwill remain much stronger than in Europe and Japan.Historically low borrowing costs, solid business investmentand buoyant consumer spending point to sustained growthin Canada in 2005 and beyond.
Foreign exchange rates, including the Canadian dollar,have been fluctuating significantly and may well continueto do so in the months ahead, adding to challenges posedby the more moderate pace of international economicgrowth.
The Bank’s performance in the first six months wasahead of targets, supported by declining credit losses, highsecurities gains, strong capital market results and goodgrowth in retail assets. However, there continues to be acompression in certain margins and weak business loandemand. While earnings are expected to moderate overthe balance of the year, we fully expect to achieve theperformance targets for 2005.
Accounting Policies and Estimates
The interim consolidated financial statements have been prepared in accordance with Canadian Generally AcceptedAccounting Principles (GAAP). See Note 1 to the 2004 annual consolidated financial statements for more informationabout the accounting principles used to prepare the financial statements.
There have not been any changes to the Bank’s accounting policies affecting this quarter, other than those described inNote 1 of the interim consolidated financial statements. Certain comparative amounts have been restated as a result ofthese changes.
Details of significant future accounting standard changes and the impact of these on the Bank are presented in Note 2of the interim consolidated financial statements.
The key assumptions and bases for estimates that management has made under GAAP and their impact on the amountsreported in the interim consolidated financial statements and notes remain substantially unchanged from those describedin our 2004 Annual Report.
ENG_Q2_2005 5/26/05 9:25 PM Page 8
> MANAGEMENT’S D ISCUSSION & ANALYSIS
Scot iabank Second Quarter Report 2005 9
Domestic Banking, which includes Wealth Management,generated net income available to common shareholders of$279 million in the second quarter, and accounted for 34%of the Bank’s total earnings. Domestic Banking resultsdecreased slightly by $7 million or 2% from the samequarter last year, and declined by $50 million or 15%quarter over quarter. Return on equity remained strong at 28.9%.
Net interest income fell $40 million or 4% from the samequarter last year. Strong growth was recorded across mostproducts, particularly in residential mortgages, revolvingcredit, savings and chequing deposits, and currentaccounts, accompanied by market share gains in retaillending. More than offsetting this growth however, was acompressed margin due to the continued low level ofinterest rates and changing customer preferences towardsvariable-rate mortgages. Quarter over quarter, net interestincome fell by 4%, reflecting three fewer days in the second quarter.
Other income was $445 million in the second quarter, anincrease of $21 million or 5% versus the same period lastyear. All business segments produced improved results.Contributing to this were higher full-service brokerageactivities, as well as volume-based increases in transactionservice fees and card revenues. On a quarter-over-quarterbasis, other income was essentially unchanged.
Credit quality continued to be very good, with provisionfor credit losses of $66 million this quarter, the lowest inseveral quarters. The $15 million decrease from last yearreflected lower provisions in the commercial portfolio.
Non-interest expenses rose 2% from the same quarterlast year. This reflected normal salary increases, higherexpenses for project spending, and increased capital taxes.Partially offsetting these were lower mortgage acquisitioncosts and stock-based compensation.
Quarter over quarter, expenses increased 4%, attrib-utable mainly to growth in stock-based compensation, andseasonally higher employee benefits costs.
Business Line Review
Domestic BankingFor the three months ended For the six months ended
(Unaudited) ($ millions) April 30 January 31 April 30 April 30 April 30(Taxable equivalent basis)(1) 2005 2005 2004 2005 2004
Business line incomeNet interest income $ 852 $ 890 $ 892 $ 1,742 $ 1,756
Provision for credit losses 66 76 81 142 173
Other income 445 447 424 892 841
Non-interest expenses 817 784 803 1,601 1,567
Provision for income taxes 134 147 145 281 280
Net income $ 280 $ 330 $ 287 $ 610 $ 577
Preferred dividends paid 1 1 1 2 2
Net income available to common shareholders(2) $ 279 $ 329 $ 286 $ 608 $ 575
Other measuresReturn on equity(3) 28.9% 34.1% 32.7% 31.5% 32.6%
(1) Refer to footnote (2) on page 12.(2) Refer to footnote (4) on page 12.(3) Refer to footnote (1) in the Total table on page 13.
Scotia Capital contributed net income available to commonshareholders of $239 million in the second quarter, anincrease of $36 million or 18% from last year, and slightlylower than the first quarter. Return on equity, at 31.1%, wassignificantly ahead of the 20.0% reported last year andmatched the strong performance in the first quarter.
The strong results reflect an increase in credit loss recov-eries. Trading and underwriting revenues were also solidthis quarter, although lower than the record resultsachieved in the first quarter.
Net interest income decreased 8% compared to the sameperiod last year, due primarily to lower corporate lendingasset levels and interest margins, somewhat offset by higherinterest income from trading operations. Compared to lastyear, average lending volumes decreased 10%, mainly in theU.S. and Europe, due in part to the strengthening of theCanadian dollar. Compared to the previous quarter, netinterest income rose modestly due mostly to higher interestincome from trading activities.
Higher borrowings this quarter by a select number ofclients resulted in modest growth in the corporate loanportfolios for the first time in recent quarters.
Other income was up slightly compared to the prior year.Higher equity trading revenues and merger and acquisitionfees were offset by reduced lending fees and foreign
exchange revenues, due in part to the stronger Canadiandollar. Other income was 2% lower than the previousquarter as trading revenues did not match the record levelsearned in the first quarter. This was largely offset by higherrevenues in the U.S., primarily reflecting successful loanunderwriting efforts and a gain from the sale of a restruc-tured loan asset.
The provision for credit losses was a net recovery of $57 million this quarter, compared to a provision of $32 million last year and a net recovery of $9 million lastquarter. Most of the recoveries were realized in the U.S.
Total expenses decreased 4% from the same quarter lastyear, primarily due to lower salary expenses and profes-sional fees, partly offset by higher performance-drivencompensation. Total expenses also fell 2% from theprevious quarter as performance-driven compensation fellin line with trading revenues, partly offset by higherseverance costs and professional fees.
Provision for income taxes was $120 million in thesecond quarter, up from $74 million last year and $53 million in the first quarter. This arose from a combi-nation of higher pre-tax income this quarter, and lowertaxes in the prior comparative quarters arising from certainstructured transactions.
ENG_Q2_2005 5/27/05 1:29 PM Page 10
> MANAGEMENT’S D ISCUSSION & ANALYSIS
Scot iabank Second Quarter Report 2005 11
International BankingFor the three months ended For the six months ended
(Unaudited) ($ millions) April 30 January 31 April 30 April 30 April 30(Taxable equivalent basis)(1) 2005 2005 2004 2005 2004
Business line incomeNet interest income $ 489 $ 462 $ 505 $ 951 $ 942
Provision for credit losses 26 7 18 33 25
Other income 174 180 197 354 371
Non-interest expenses 391 388 426 779 816
Provision for income taxes 42 23 41 65 77
Non-controlling interest in net income of subsidiaries 17 17 22 34 45
Net income $ 187 $ 207 $ 195 $ 394 $ 350
Preferred dividends paid 1 1 1 2 2
Net income available to common shareholders(2) $ 186 $ 206 $ 194 $ 392 $ 348
Other measuresReturn on equity(3) 21.0% 24.2% 24.2% 22.5% 21.8%
(1) Refer to footnote (2) on page 12.(2) Refer to footnote (4) on page 12.(3) Refer to footnote (1) in the Total table on page 13.
International Banking’s net income available to commonshareholders in the second quarter was $186 million,producing a return on equity of 21.0%. Compared to thesame period last year, net income available to commonshareholders declined by $8 million due to the negativeimpact of foreign currency translation, as the Canadiandollar appreciated against most currencies in whichInternational Banking operates. Excluding this impact,underlying results rose $7 million or 4%. Net incomeavailable to common shareholders declined $20 million or10% from last quarter, due largely to higher credit lossesfollowing the unusually low levels in the first quarter. Aswell, there were lower tax savings in Inverlat caused bythe revaluation of future tax assets as a result of reduc-tions in income tax rates.
Net interest income was $489 million this quarter, ayear-over-year decline of $16 million or 3%. This decreasewas due to foreign currency translation and lower mark-to-market gains on the fair value of non-trading derivativesthat do not qualify as accounting hedges. Excluding these,interest income rose 6% as a result of higher asset levels.In addition, second quarter interest income included thecontribution of Banco de Comercio in El Salvador, whichwas equity accounted in the second quarter. Commencingnext quarter, Banco de Comercio’s results and financialposition will be consolidated. Net interest income was up $27 million from the first quarter, with Inverlat being thelargest contributor to the increase.
Loan growth in International Banking, was flatcompared to last year. Excluding foreign currency trans-lation, loan volumes grew a solid 8% from the same periodlast year. Retail loan growth was strong at 16%, withincreases in mortgages of 32% in Mexico and more than20% in the Caribbean and Chile. In addition, the Caribbeanand Mexico both experienced strong growth in retaildeposits, excluding the effect of foreign currency translation.
Other income was $174 million this quarter, down $23 million from last year, including a $9 million negativeimpact from foreign currency translation. The underlyingdecrease reflected lower fee income from loan collectionservices associated with the Baninter acquisition in theDominican Republic compared to last year.
Credit quality in International Banking remained strong.Specific provisions for credit losses were $26 million thisquarter, up $8 million over the same period last year. Aswell, they rose $19 million from the unusually low levels inthe first quarter of 2005.
Non-interest expenses were $391 million in the secondquarter, down $35 million or 8% from last year. Excludingthe impact of foreign currency translation, expenses fell4% due to lower expenses in the Caribbean, Asia andChile. Compared to last quarter, expenses increasedmarginally.
ENG_Q2_2005 5/27/05 1:29 PM Page 11
> MANAGEMENT’S D ISCUSSION & ANALYSIS
12 Scot iabank Second Quarter Report 2005
Net income available to common shareholders was $118 million this quarter, compared to $97 million last year,and $2 million in the previous quarter. The increase fromlast year was due mainly to higher net interest income inGroup Treasury, partially offset by lower gains on the sale ofinvestment securities. The quarter-over-quarter increasereflected the $118 million gain this quarter on the sale of aportion of the Bank’s investment holding in Shinsei Bank.
Net interest income rose by $78 million from last year,mainly from the impact of mark-to-market adjustments forcertain derivatives that do not qualify as hedges, as well ashigher dividends in Group Treasury. Partially offsettingthese was a $29 million increase in the elimination of tax-exempt income. Net interest income improved by $28million over last quarter, mainly from higher dividendincome in Group Treasury and an increase in net interestincome from a reduction in revolving retail loan securiti-zation volumes.
Other income fell by $112 million from the same quarterlast year due mainly to lower gains on the sale ofinvestment securities. While both quarters benefited from
the inclusion of a similar gain on the sale of a portion of theBank’s investment holding in Shinsei Bank, the balance ofthe net gains on investment securities were much lower thisquarter. As well, securitization revenues fell $19 million.Compared to last quarter, other income increased by $41 million due to the $118 million gain on Shinsei Bank.However, other net investment gains were lower quarterover quarter.
Net interest income includes the elimination of tax-exempt income gross up. The gross up is included in theoperating segments, which are reported on a taxable equiv-alent basis. The elimination was $94 million in the firstquarter, compared to $65 million last year, and $76 millionin the prior quarter.
Non-interest expenses this quarter were relatively evenwith both last year and the prior quarter.
The decrease in the provision for income taxes year overyear and quarter over quarter was due mainly to the elimi-nation of the tax-exempt income gross up referred toabove, as well as a lower tax rate for certain securities gainsin the second quarter.
Other(1)
For the three months ended For the six months ended
(Unaudited) ($ millions) April 30 January 31 April 30 April 30 April 30(Taxable equivalent basis)(2) 2005 2005 2004 2005 2004
Business line incomeNet interest income(3) $ (113) $ (141) $ (191) $ (254) $ (302)Provision for credit losses – – (1) – (1)Other income 188 147 300 335 417Non-interest expenses 26 24 26 50 37Provision for income taxes(3) (70) (21) (14) (91) (71)
Net income $ 119 $ 3 $ 98 $ 122 $ 150Preferred dividends paid 1 1 1 2 2
Net income available to common shareholders(4) $ 118 $ 2 $ 97 $ 120 $ 148
(1) Includes all other smaller operating segments and corporate adjustments, such as the elimination of the tax-exempt income gross-up reported innet interest income and provision for income taxes, differences in the actual amount of costs incurred and charged to the operating segments, andthe impact of securitizations.
(2) The Bank, like some other banks, analyzes revenues, net interest margin on total average assets and the productivity ratio on a taxable equivalentbasis (TEB). This methodology grosses up tax-exempt income earned on certain securities to an equivalent before-tax basis. In the presentation ofbusiness line results, the corresponding offset is made in the provision for income taxes.
Management believes that this basis for measurement provides a uniform comparability of net interest income arising from both taxable andnon-taxable sources and facilitates a consistent basis of measurement. This use of TEB results in measures that are different from comparableGAAP measures and may not be the same as measures presented by other companies.
(3) Includes the elimination of the tax-exempt income gross-up reported in net interest income and provision for income taxes for the three monthsended April 30, 2005 ($94), January 31, 2005 ($76), and April 30, 2004 ($65), and for the six months ended April 30, 2005 ($170), and April 30,2004 ($133), to arrive at the amounts reported in the Consolidated Statement of Income.
(4) Commencing in 2005, the measure of segment profitability has been changed from net income to net income available to common shareholders.Prior periods have been restated.
ENG_Q2_2005 5/27/05 1:29 PM Page 12
> MANAGEMENT’S D ISCUSSION & ANALYSIS
Scot iabank Second Quarter Report 2005 13
For the three months ended For the six months ended
April 30 January 31 April 30 April 30 April 30(Unaudited) ($ millions) 2005 2005 2004 2005 2004
Business line incomeNet interest income $ 1,458 $ 1,427 $ 1,456 $ 2,885 $ 2,884Provision for credit losses 35 74 130 109 300Other income 1,136 1,111 1,249 2,247 2,289Non-interest expenses 1,490 1,457 1,523 2,947 2,929Provision for income taxes 226 202 246 428 427Non-controlling interest in net income of subsidiaries 17 17 22 34 45
Net income $ 826 $ 788 $ 784 $ 1,614 $ 1,472Preferred dividends paid 4 4 4 8 8
Net income available to common shareholders $ 822 $ 784 $ 780 $ 1,606 $ 1,464
(1) For management and internal reporting purposes, the Bank allocates equity to its business lines using a methodology that considers credit,market and operational risk inherent in each business line. Return on equity is calculated based on the economic equity allocated to the businessline. Economic equity is not a defined term under GAAP and, accordingly, the resulting return on equity for each business line may not be compa-rable to those used by other financial institutions.
Geographic HighlightsFor the three months ended For the six months ended
April 30 January 31 April 30 April 30 April 30(Unaudited) 2005 2005 2004 2005 2004
Net income available to common shareholders ($ millions)
(1) Amounts have been retroactively adjusted to reflect the new accounting pronouncement on liabilities and equity (refer to Note 1 on page 19).(2) The adjustment that changes GAAP measures to taxable equivalent basis (TEB) measures is discussed in footnotes (2) and (3) on page 12.
Total
ENG_Q2_2005 5/27/05 1:29 PM Page 13
> MANAGEMENT’S D ISCUSSION & ANALYSIS
14 Scot iabank Second Quarter Report 2005
Forward-looking statements This document includes forward-looking statements which are made pursuant to the “safe harbour”
provisions of the United States Private Securities Litigation Reform Act of 1995. These statements include comments with respect to
our objectives, strategies, expected financial results (including those in the area of risk management), and our outlook for our
businesses and for the Canadian, U.S. and global economies. Forward-looking statements are typically identified by words or phrases
such as “believe,” “expect,” “anticipate,” “intent,” “estimate,” “may increase,” “may fluctuate,” and similar expressions of future or
conditional verbs such as “will,” “should,” “would” and “could.”
By their very nature, forward-looking statements involve numerous assumptions, inherent risks and uncertainties, both general and
specific, and the risk that predictions and other forward-looking statements will not prove to be accurate. The Bank cautions readers
not to place undue reliance on these statements, as a number of important factors could cause actual results to differ materially from
the estimates and intentions expressed in such forward-looking statements. These factors include, but are not limited to, the
economic and financial conditions in Canada and globally; fluctuations in interest rates and currency values; liquidity; the effect of
changes in monetary policy; legislative and regulatory developments in Canada and elsewhere; the accuracy and completeness of
information the Bank receives on customers and counterparties; the timely development and introduction of new products and
services; the Bank’s ability to complete and integrate acquisitions; the Bank’s ability to attract and retain key executives; reliance on
third parties to provide components of the Bank’s business infrastructure; unexpected changes in consumer spending and saving
habits; technological developments; consolidation in the Canadian financial services sector; changes in tax laws; competition;
judicial and regulatory proceedings; acts of God, such as earthquakes; the possible impact of international conflicts and other devel-
opments, including terrorist acts and war on terrorism; and the Bank’s anticipation of and success in managing the risks implied by
the foregoing. A substantial amount of the Bank’s business involves making loans or otherwise committing resources to specific
companies, industries or countries. Unforeseen events affecting such borrowers, industries or countries could have a material
adverse effect on the Bank’s financial results, businesses, financial condition or liquidity. These and other factors may cause the
Bank’s actual performance to differ materially from that contemplated by forward-looking statements.
The Bank cautions that the foregoing list of important factors is not exhaustive. When relying on forward-looking statements to make
decisions with respect to the Bank and its securities, investors and others should carefully consider the foregoing factors, other uncer-
tainties and potential events. The Bank does not undertake to update any forward-looking statements, whether written or oral, that may
be made from time to time by or on behalf of the Bank.
Additional information relating to the Bank, including the Bank’s Annual Information Form, can be located on the SEDAR website atwww.sedar.com, and on the EDGAR section of the SEC’s website at www.sec.gov.
Share DataAs at
April 30(thousands of shares) 2005Class A preferred shares issued by Scotia Mortgage Investment Corporation 250(1)
Series 2000-1 trust securities issued by BNS Capital Trust 500(1)
Series 2002-1 trust securities issued by Scotiabank Capital Trust 750(2)
Series 2003-1 trust securities issued by Scotiabank Capital Trust 750(2)
Preferred shares Series 12 12,000(3)
Preferred shares Series 13 12,000(4)
Common shares outstanding 993,606(5)
Outstanding options granted under the Stock Option Plans to purchase common shares 40,750(5)(6)
(1) Reported in subordinated debentures and capital instrument liabilities in the Consolidated Balance Sheet.(2) Refer to Note 1 on page 19 for the accounting treatment and presentation of these instruments.(3) These shares are entitled to non-cumulative preferential cash dividends payable quarterly in an amount of $ 0.328125 per share.(4) These shares are entitled to non-cumulative preferential cash dividends payable quarterly. The initial dividend, payable July 27, 2005, will be
$0.4405 per share. Subsequent quarterly dividends will be $0.30 per share. (5) As at May 19, 2005, the number of outstanding common shares and options were 993,735 and 40,619, respectively. The number of other securities
disclosed in this table were unchanged.(6) Included are 15,634 stock options with tandem stock appreciation right (SAR) features.
Further details, including convertibility features, are available in Notes 13 and 14 of the October 31, 2004, consolidated financialstatements presented in the 2004 Annual Report, and Note 4 on page 21 of this report.
ENG_Q2_2005 5/26/05 9:25 PM Page 14
> INTERIM CONSOLIDATED F INANCIAL STATEMENTS
Scot iabank Second Quarter Report 2005 15
Consolidated Statement of IncomeFor the three months ended For the six months ended
April 30 January 31 April 30 April 30 April 30(Unaudited) ($ millions) 2005 2005 2004(1) 2005 2004(1)
Net gain on investment securities 134 62 247 196 317
Securitization revenues 20 19 40 39 68
Other 128 88 130 216 231
1,136 1,111 1,249 2,247 2,289
Net interest and other income 2,559 2,464 2,575 5,023 4,873
Non-interest expensesSalaries and employee benefits 883 870 907 1,753 1,748
Premises and technology 285 273 282 558 563
Communications 63 60 60 123 119
Advertising and business development 50 43 53 93 100
Professional 45 42 47 87 76
Business and capital taxes 42 37 36 79 73
Other 122 132 138 254 250
1,490 1,457 1,523 2,947 2,929
Income before the undernoted 1,069 1,007 1,052 2,076 1,944
Provision for income taxes 226 202 246 428 427
Non-controlling interest in net income of subsidiaries 17 17 22 34 45
Net income $ 826 $ 788 $ 784 $ 1,614 $ 1,472
Preferred dividends paid 4 4 4 8 8
Net income available to common shareholders $ 822 $ 784 $ 780 $ 1,606 $ 1,464
Average number of common shares outstanding (millions):
Basic 996 1,006 1,011 1,001 1,011
Diluted 1,011 1,021 1,028 1,016 1,028
Earnings per common share(2) (in dollars):
Basic $ 0.82 $ 0.78 $ 0.77 $ 1.60 $ 1.45
Diluted $ 0.81 $ 0.77 $ 0.75 $ 1.58 $ 1.42
Dividends per common share (in dollars) $ 0.32 $ 0.32 $ 0.25 $ 0.64 $ 0.50
(1) Certain comparative amounts have been retroactively restated for new CICA accounting requirements relating to the distinction between equityand liability instruments (refer to Note 1 on page 19).
(2) The calculation of earnings per share is based on full dollar and share amounts.
The accompanying notes are an integral part of these interim consolidated financial statements.
ENG_Q2_2005 5/26/05 9:25 PM Page 15
> INTERIM CONSOLIDATED F INANCIAL STATEMENTS
16 Scot iabank Second Quarter Report 2005
Consolidated Balance SheetAs at
April 30 January 31 October 31 April 30(Unaudited) ($ millions) 2005 2005 2004(1) 2004(1)
AssetsCash resourcesCash and non-interest-bearing deposits with banks $ 2,137 $ 1,961 $ 1,921 $ 1,417
Interest-bearing deposits with banks 15,954 15,817 12,932 16,668
$ 309,090 $ 300,547 $ 279,212 $ 283,634(1) Certain comparative amounts have been retroactively restated for new CICA accounting requirements relating to the distinction between equity
and liability instruments (refer to Note 1 on page 19).The accompanying notes are an integral part of these interim consolidated financial statements.
ENG_Q2_2005 5/26/05 9:25 PM Page 16
> INTERIM CONSOLIDATED F INANCIAL STATEMENTS
Scot iabank Second Quarter Report 2005 17
Consolidated Statement of Changes in Shareholders’ EquityFor the six months ended
April 30 April 30(Unaudited) ($ millions) 2005 2004(1)
Preferred shares
Balance at beginning of period $ 300 $ 300
Issued 300 –
Balance at end of period 600 300
Common shares and contributed surplus
Common shares:
Balance at beginning of period 3,228 3,140
Issued 73 65
Purchased for cancellation (60) (19)
Balance at end of period 3,241 3,186
Contributed surplus: Fair value of stock options 1 1
Total 3,242 3,187
Retained earnings
Balance at beginning of period 13,239 11,747
Net income 1,614 1,472
Dividends: Preferred (8) (8)
Common (640) (506)
Purchase of shares (681) (193)
Other (7) –
Balance at end of period 13,517 12,512
Cumulative foreign currency translation
Balance at beginning of period (1,783) (1,074)
Net unrealized foreign exchange translation gains(2) 368 232
Balance at end of period (1,415) (842)
Total shareholders’ equity at end of period $ 15,944 $ 15,157
(1) Certain comparative amounts have been retroactively restated for new CICA accounting requirements relating to the distinction between equityand liability instruments (refer to Note 1 on page 19).
(2) Comprises unrealized foreign exchange translation gains on net investments in self-sustaining foreign operations of $624 (April 30, 2004 – $562)and losses from related foreign exchange hedging activities of $256 (April 30, 2004 – $ 330).
The accompanying notes are an integral part of these interim consolidated financial statements.
ENG_Q2_2005 5/26/05 9:25 PM Page 17
> INTERIM CONSOLIDATED F INANCIAL STATEMENTS
18 Scot iabank Second Quarter Report 2005
Condensed Consolidated Statement of Cash FlowsFor the three months ended For the six months ended
Sources and (uses) of cash flows April 30 April 30 April 30 April 30(Unaudited) ($ millions) 2005 2004(1) 2005 2004(1)
Cash flows from operating activities
Net income $ 826 $ 784 $ 1,614 $ 1,472
Adjustments to net income to determine cash flows 52 (63) 62 60
Net accrued interest receivable and payable 3 (145) 21 (186)
Trading securities (3,156) 2,496 (6,314) 1,031
Trading derivatives’ market valuation, net (899) (672) (1,239) (511)
Other, net (361) (980) 667 (1,074)
(3,535) 1,420 (5,189) 792
Cash flows from financing activities
Deposits 6,719 3,816 14,839 1,535
Obligations related to securities sold under repurchase agreements (15) (1,826) 4,902 (6,399)
Obligations related to securities sold short 1,078 (453) 927 239
Subordinated debenture and capital instrument liabilities
redemptions/repayments – – – (260)
Capital stock issued 326 39 366 65
Capital stock redeemed/purchased for cancellation or trading, net (236) (126) (741) (212)
Cash dividends paid (322) (257) (648) (514)
Other, net 122 448 327 152
7,672 1,641 19,972 (5,394)
Cash flows from investing activities
Interest-bearing deposits with banks 34 (1,021) (2,426) 1,169
Land, buildings and equipment, net of disposals (4) (51) (62) (75)
Other, net(2) (24) (59) (24) (59)
(3,977) (2,865) (14,618) 4,991
Effect of exchange rate changes on cash and cash equivalents 16 18 51 35
Net change in cash and cash equivalents(3) 176 214 216 424
Cash and cash equivalents at beginning of period 1,961 1,107 1,921 897
Cash and cash equivalents at end of period $ 2,137 $ 1,321 $ 2,137 $ 1,321
Represented by:
Cash and non-interest-bearing deposits with banks $ 2,137 $ 1,417
Cheques and other items in transit, net liability(3) – (96)
Cash and cash equivalents at end of period $ 2,137 $ 1,321
Cash disbursements made for:
Interest $ 1,927 $ 1,748 $ 3,719 $ 3,526
Income taxes $ 226 $ 270 $ 465 $ 432
(1) Certain comparative amounts have been retroactively restated for new CICA accounting requirements relating to the distinction between equityand liability instruments (refer to Note 1 on page 19).
(2) For the three and six months ended April 30, 2005, includes investment in subsidiaries of $24 (April 30, 2004 – $59).(3) In the fourth quarter of 2004, the Bank prospectively changed the balance sheet presentation of certain types of cheques and other items in transit.
These items are recorded gross in different asset and liability categories, whereas previously these items were recorded net in cheques and otheritems in transit in other liabilities in the Consolidated Balance Sheet. This change in balance sheet presentation also resulted in certain types ofcheques and other items in transit no longer being classified as part of cash and cash equivalents. These changes resulted from a new CICAstandard for financial reporting, which eliminated industry practice as a source of generally accepted accounting principles.
The accompanying notes are an integral part of these interim consolidated financial statements.
ENG_Q2_2005 5/26/05 9:25 PM Page 18
> INTERIM CONSOLIDATED F INANCIAL STATEMENTS
Scot iabank Second Quarter Report 2005 19
1. New accounting policies:
Liabilities and equityEffective November 1, 2004, the Bank, as required,retroactively adopted, with restatement of priorperiods, a new pronouncement issued by theCanadian Institute of Chartered Accountants (CICA)amending the accounting for certain financial instru-ments that have the characteristics of both a liabilityand equity. This pronouncement requires thoseinstruments that can be settled at the issuer’s option,by issuing a variable number of the issuer’s ownequity instruments, to be presented as liabilitiesrather than as equity.
This affected the $2 billion of Scotiabank TrustSecurities issued through BNS Capital Trust andScotiabank Capital Trust, and $250 million of preferredshares issued by Scotia Mortgage InvestmentCorporation. These instruments were reclassified fromnon-controlling interest in subsidiaries and share-holders’ equity, respectively, to subordinated deben-tures and capital instrument liabilities. Thecomparative restated amounts are outlined in the tablebelow. Each quarter, this change results in disburse-
ments of approximately $38 million associated withthese instruments being recorded as interest expense,whereas prior to fiscal 2005, such disbursements wouldhave been recorded as non-controlling interest in netincome of subsidiaries of $34 million and preferreddividends of $2 million (net of provision for incometaxes of $2 million).
Furthermore, effective November 1, 2004, in accordance with a new Canadian accountingpronouncement related to variable interest entities(VIEs), $1.5 billion of Scotiabank Trust Securitieswere reclassified to deposit liabilities in theConsolidated Balance Sheet (see paragraph onScotiabank Trust Securities on page 20).
In all cases, there was no change to net incomeavailable to common shareholders or earnings pershare. As well, the Bank’s regulatory capital ratioswere not affected, as the Bank’s innovative Tier 1capital instruments remain eligible as Tier 1 capitalfor regulatory purposes.
Notes to the Interim Consolidated Financial Statements (Unaudited)
These interim consolidated financial statements have been prepared in accordance with Canadian generally acceptedaccounting principles (GAAP). They should be read in conjunction with the consolidated financial statements for the yearended October 31, 2004. The accounting policies used in the preparation of these interim consolidated financial statementsare consistent with those used in the Bank’s year-end audited consolidated financial statements, except as discussed inNote 1. Certain comparative amounts have been reclassified to conform with the current period’s presentation.
The following table summarizes the restatements that were required by the new liabilities and equity pronouncement tothe Consolidated Balance Sheet:
As at
October 31, 2004 April 30, 2004As previously As previously
Consolidation of variable interest entities Effective November 1, 2004, the Bank adopted a newaccounting guideline issued by the CICA which requiresconsolidation of VIEs by the primary beneficiary.
An entity is a VIE when, by design, one or both of thefollowing conditions exist: (a) total equity investmentat risk is insufficient to permit the entity to financeits activities without additional subordinated supportfrom others; (b) as a group, the holders of the equityinvestment at risk lack certain essential character-istics of a controlling financial interest. The VIEguideline also exempts certain entities from its scope.The primary beneficiary is the enterprise thatabsorbs or receives the majority of the VIE’sexpected losses, expected residual returns, or both.
The following is a summary by VIE category of thefinancial statement impact of this new guideline.Accounting standard setters continue to deliberateissues associated with the guideline. As these issuesare addressed and revisions to the accountingguidance are made, the effects of this new guideline,as described below, may change in future quarters.
Securitization vehiclesThe Bank administers three multi-seller commercialpaper conduit programs, which involve the purchaseof assets by conduit vehicles from outside partiesfunded by the issuance of asset-backed commercialpaper. The Bank has no rights to these assets, butmanages for a fee the commercial paper sellingprogram. As well, in some instances, the Bank iscounterparty to derivative contracts with theseconduits and provides them with a large portion oftheir backstop liquidity and partial creditenhancement facilities. At the time of adoption of thenew accounting standard, the Bank assessed that itwas the primary beneficiary of these conduits andconsolidated these conduits in its financial state-ments. On adoption, investment securities, personaland credit card loans, and other liabilities in the Consolidated Balance Sheet increased by $5 billion, $3 billion and $8 billion, respectively. Thisaccounting change does not affect net income orearnings per share.
Scotiabank Trust SecuritiesThe Bank has issued $1.5 billion in innovative Tier 1capital under the Scotiabank Capital Trust structure.This structure is a VIE, but the Bank is not its primarybeneficiary. As such, the Bank has deconsolidated this
structure and recorded $1.5 billion in business andgovernments deposit liabilities in the ConsolidatedBalance Sheet. These financial instruments were previ-ously reported as non-controlling interest insubsidiaries. With the adoption of the accountingpolicy changes for liabilities and equity noted previ-ously, these instruments were restated to subordinateddebentures and capital instrument liabilities in priorperiods. On a quarterly basis, this change results inapproximately $24 million in disbursements associatedwith this structure being recorded in interest expense,whereas prior to fiscal 2005, such disbursements wererecorded as non-controlling interest in net income ofsubsidiaries. With the adoption of the changes to liabil-ities and equity noted above, these disbursementswere restated to interest expense. Overall, there wasno change in net income or earnings per share.
OtherThe Bank is involved with other entities such asinvestment structures and collateralized debtobligation vehicles, which total $10 billion. Althoughthe Bank has consolidated those entities for which itis the primary beneficiary, the resulting increase intotal assets and liabilities was insignificant.
2. Future accounting changes:
Financial instrumentsThe CICA has issued three new standards: FinancialInstruments – Recognition and Measurement, Hedgesand Comprehensive Income. These will be effective forthe Bank on November 1, 2006, and require the following:
Financial Instruments – Recognition andMeasurementAll financial assets and liabilities will be carried at fairvalue in the Consolidated Balance Sheet, except thefollowing, which will be carried at amortized cost:loans and receivables, securities intended to be helduntil maturity and non-trading financial liabilities.Realized and unrealized gains and losses on financialassets and liabilities that are held for trading will berecorded in the Consolidated Statement of Income.Unrealized gains and losses on financial assets that areheld as available for sale will be recorded in othercomprehensive income until realized, when they willbe recorded in the Consolidated Statement of Income.All derivatives, including embedded derivatives thatmust be separately accounted for, will be recorded atfair value in the Consolidated Balance Sheet.
ENG_Q2_2005 5/26/05 9:25 PM Page 20
> INTERIM CONSOLIDATED F INANCIAL STATEMENTS
Scot iabank Second Quarter Report 2005 21
5. Sales of loans through securitizationsThe Bank securitizes residential mortgages through the creation of mortgage-backed securities. The net gain on the sale of the mortgages resulting from these securitizations is recognized in securitization revenues in theConsolidated Statement of Income. No credit losses are expected, as the mortgages are insured. The following tablesummarizes the Bank’s sales.
For the three months ended For the six months ended
April 30 January 31 April 30 April 30 April 30($ millions) 2005 2005 2004 2005 2004
(1) Excludes insured mortgages which were securitized and retained by the Bank of $179 for the three months ended April 30, 2005 (January31, 2005 – $525) and $704 for the six months ended April 30, 2005 (April 30, 2004 – nil). These assets are classified as investment securitiesand have an outstanding balance of $649 as at April 30, 2005.
HedgesIn a fair value hedge, the component of the under-lying asset or liability being hedged, as well as thehedging derivative, will be carried at fair value, withchanges in fair value recorded in the ConsolidatedStatement of Income. In a cash flow hedge, thechange in fair value of the derivative will be recordedin other comprehensive income until the asset orliability being hedged affects the ConsolidatedStatement of Income, at which time the relatedchange in fair value of the derivative will also berecorded in the Consolidated Statement of Income.Any hedge ineffectiveness will be recorded in theConsolidated Statement of Income.
Comprehensive IncomeUnrealized gains and losses on financial assets thatwill be held as available for sale, unrealized foreigncurrency translation amounts arising from self-sustaining foreign operations, and changes in the fairvalue of cash flow hedging instruments, will berecorded in a Statement of Other ComprehensiveIncome until recognized in the ConsolidatedStatement of Income. Other comprehensive incomewill form part of shareholders’ equity.
The impact of implementing these new standards isnot yet determinable as it is dependent on the Bank’soutstanding positions, hedging strategies and marketvolatility at the time of transition.
3. Segmented results of operationsScotiabank is a diversified financial services institutionthat provides a wide range of financial products andservices to retail, commercial and corporatecustomers around the world. The Bank is organizedinto three main operating segments: DomesticBanking, Scotia Capital and International Banking.Results for these operating segments are presented inthe Business line income tables on pages 9 to 12.
4. Significant capital transactionsIn the first quarter of 2005, the Bank initiated a newnormal course issuer bid to purchase up to 50 millionof the Bank’s common shares. This represents approxi-mately 5 per cent of the Bank’s outstanding commonshares. The bid will terminate on the earlier of January5, 2006, or the date the Bank completes its purchases.During the quarter, the Bank purchased 5.9 millioncommon shares at an average cost of $39.88. For thesix months ended April 30, 2005, 18.6 million commonshares were purchased at an average price of $39.82.
On March 15, 2005, the Bank issued $300 million non-cumulative preferred shares Series 13. The shares were priced at $25.00 per share to yield 4.80% annually.
ENG_Q2_2005 5/27/05 1:29 PM Page 21
> INTERIM CONSOLIDATED F INANCIAL STATEMENTS
22 Scot iabank Second Quarter Report 2005
6. Allowance for credit lossesThe following table summarizes the change in the allowance for credit losses.
For the three months ended For the six months ended
April 30 January 31 April 30 April 30 April 30($ millions) 2005 2005 2004 2005 2004
Balance at beginning of period $ 2,650 $ 2,704 $ 3,270 $ 2,704 $ 3,580
Presented with securities – – – – (363)(1)
Write-offs (153) (149) (140) (302) (317)
Recoveries 48 36 33 84 73
Provision for credit losses 35 74 130 109 300
Other, including foreign exchange adjustment 19 (15) 24 4 44
Balance at the end of period(2)(3) $ 2,599 $ 2,650 $ 3,317 $ 2,599 $ 3,317
(1) Effective November 1, 2003, the country risk allowance related to investment securities is no longer disclosed as part of the allowance for credit losses, but continues to be deducted from investment securities.
(2) As at April 30, 2005, $8 (January 31, 2005 – $9; April 30, 2004 – $14) has been recorded in other liabilities. (3) As at April 30, 2005, the general allowance for credit losses was $1,375 (January 31, 2005 – $1,375; April 30, 2004 – $1,475).
7. Subordinated debentures and capital instrument liabilitiesThe following table provides the detail for the subordinated debentures and capital instrument liabilities.
As at
April 30 January 31 April 302005 2005 2004(1)
Subordinated debentures $ 2,633 $ 2,625 $ 2,686Class A preferred shares issued by Scotia Mortgage Investment Corporation 250 250 250Scotiabank Trust Securities – Series 2000-1 issued by BNS Capital Trust 500 500 500Scotiabank Trust Securities – Series 2002-1 issued by Scotiabank Capital Trust(2) – – 750Scotiabank Trust Securities – Series 2003-1 issued by Scotiabank Capital Trust(2) – – 750
$ 3,383 $ 3,375 $ 4,936
(1) Amounts have been retroactively restated as required by a new accounting pronouncement on liabilities and equity (refer to Note 1 on page 19). In addition, the features of these capital instruments are described in Note 13 of the consolidated financial statements for the year endedOctober 31, 2004.
(2) Effective November 1, 2004, these securities were reclassified to deposits on a prospective basis as a result of the new accounting pronouncement on VIEs (refer to Note 1 on page 19).
8. Employee future benefitsEmployee future benefits include pensions and other post-retirement benefits, post-employment benefits andcompensated absences. The following table summarizes the expenses for the Bank’s principal plans(1).
For the three months ended For the six months ended
April 30 January 31 April 30 April 30 April 30($ millions) 2005 2005 2004 2005 2004
(1) Other plans operated by certain subsidiaries of the Bank are not considered material and are not included in this note.
9. Subsequent eventOn May 2, 2005, the Bank completed the acquisition of 98% of the common shares of Banco de Comercio in ElSalvador. The purchase price for the acquisition was US$178 million. The Bank will commence consolidating theassets and liabilities and the results of operations of Banco de Comercio in its third quarter.
ENG_Q2_2005 5/27/05 1:29 PM Page 22
> SHAREHOLDER & INVESTOR INFORMATION
Scot iabank Second Quarter Report 2005 23
Direct deposit serviceShareholders may have dividends deposited directly intoaccounts held at financial institutions which are membersof the Canadian Payments Association. To arrange directdeposit service, please write to the Transfer Agent.
Dividend and Share Purchase PlanScotiabank’s dividend reinvestment and share purchaseplan allows common and preferred shareholders to purchaseadditional common shares by reinvesting their cashdividend without incurring brokerage or administrative fees.
As well, eligible shareholders may invest up to $20,000 each fiscal year to purchase additional commonshares of the Bank. Debenture holders may apply intereston fully registered Bank subordinated debentures topurchase additional common shares. All administrativecosts of the plan are paid by the Bank.
For more information on participation in the plan,please contact the Transfer Agent.
Dividend dates for 2005Record and payment dates for common and preferredshares, subject to approval by the Board of Directors.
Record Date Payment Date
January 4 January 27April 5 April 27July 5 July 27October 4 October 27
Duplicated communicationIf your shareholdings are registered under more than onename or address, multiple mailings will result. To eliminatethis duplication, please write to the Transfer Agent tocombine the accounts.
WebsiteFor information relating to Scotiabank and its services,visit us at our website: www.scotiabank.com.
Conference call and Web broadcastThe quarterly results conference call will take place on May 31, 2005, at 2:30 p.m. EDT and is expected to lastapproximately one hour. Interested parties are invited toaccess the call live, in listen-only mode, by telephone, toll-free, at 1-800-814-4859 (please call five to 15 minutes inadvance). In addition, an audio webcast, with accompa-nying slide presentation, may be accessed via the InvestorRelations page of www.scotiabank.com. Followingdiscussion of the results by Scotiabank executives, therewill be a question and answer session. Listeners are alsoinvited to submit questions by e-mail [email protected].
A telephone replay of the conference call will beavailable from May 31, 2005, to June 14, 2005, by calling (416) 640-1917 and entering the identification code21124095#. The archived audio webcast will be availableon the Bank’s website for three months.
ENG_Q2_2005 5/26/05 9:25 PM Page 23
Contact informationInvestors:
Financial analysts, portfolio managers and other investorsrequiring financial information, please contact InvestorRelations, Finance Department:
ScotiabankScotia Plaza, 44 King Street West Toronto, Ontario, Canada M5H 1H1Telephone: (416) 866-5982 Fax: (416) 866-7867E-mail: [email protected]
Media:
For other information and for media enquiries, pleasecontact the Public, Corporate and Government AffairsDepartment at the above address.
For enquiries related to changes in share registration oraddress, dividend information, lost share certificates,estate transfers, or to advise of duplicate mailings, pleasecontact the Bank’s Transfer Agent:
Computershare Trust Company of Canada100 University Avenue, 9th FloorToronto, Ontario, Canada M5J 2Y1Telephone: 1-877-982-8767Fax: 1-888-453-0330E-mail: [email protected]
For other shareholder enquiries, please contact theFinance Department:
ScotiabankScotia Plaza, 44 King Street WestToronto, Ontario, Canada M5H 1H1Telephone: (416) 866-4790Fax: (416) 866-4048E-mail: [email protected]
Rapport trimestriel disponible en version française
Le Rapport annuel et les états financiers périodiques de laBanque sont publiés en français et en anglais et distribuésaux actionnaires dans la version de leur choix. Si vouspréférez que la documentation vous concernant vous soitadressée en français, veuillez en informer le Service desrelations publiques de la Banque Scotia, Scotia Plaza, 44, rue King Ouest, Toronto (Ontario), Canada M5H 1H1,en joignant, si possible, l’étiquette d’adresse, afin que nouspuissions prendre note du changement.
The Bank of Nova Scotia is incorporated in Canada withlimited liability.
™ Trademark of The Bank of Nova Scotia.
The paper manufacturer follows the Sustainable Forestry Initiative®
(SFI®) program for the harvesting of its forests. SFI® is an exactingstandard of environmental principles, objectives and performancemeasures that integrates the perpetual growing and harvesting of treeswith the protection of wildlife, plants, soil and water quality and a widerange of other conservation goals. www.aboutsfi.org
SFI logo is a trademark of the American Forest and Paper Association.Sustainable Forestry Initiative® and SFI® are registered trademarks of theAmerican Forest and Paper Association.


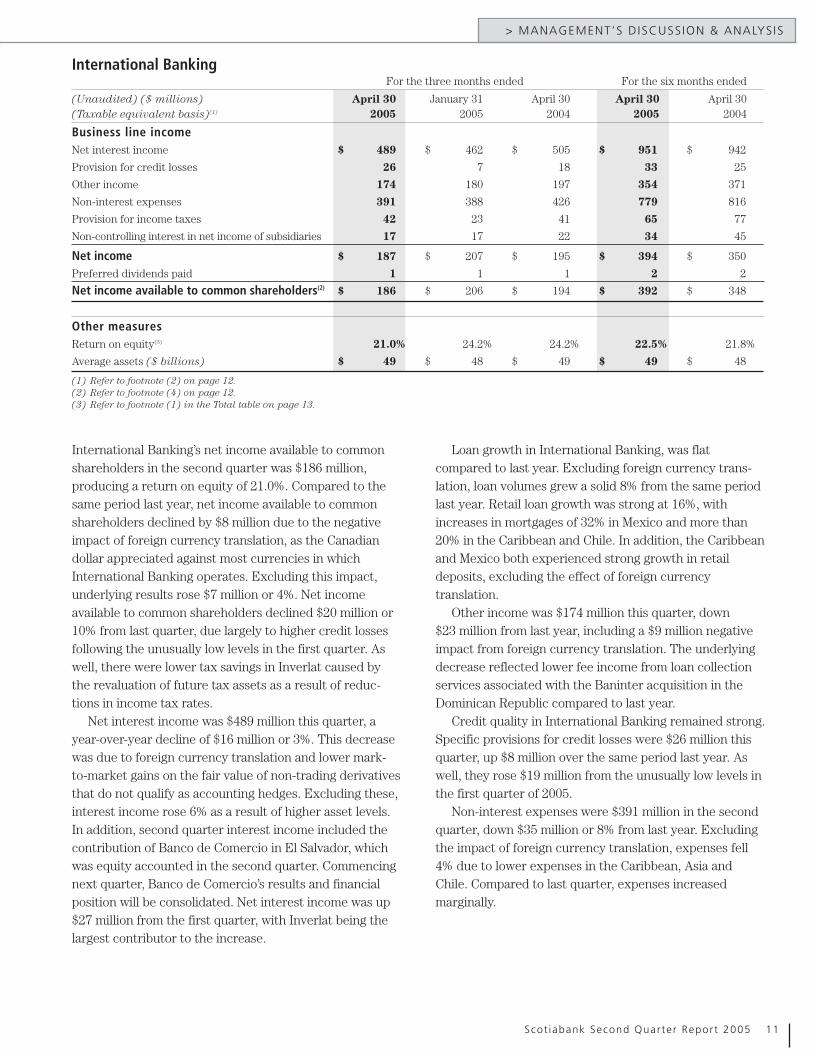


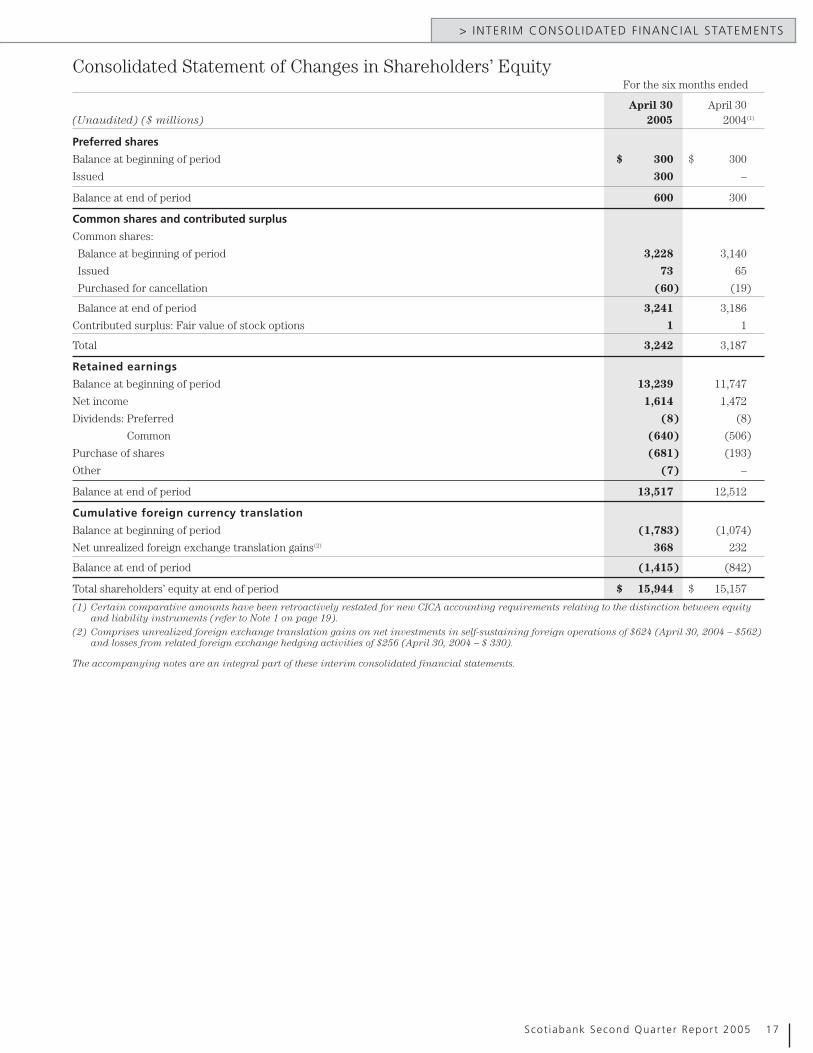
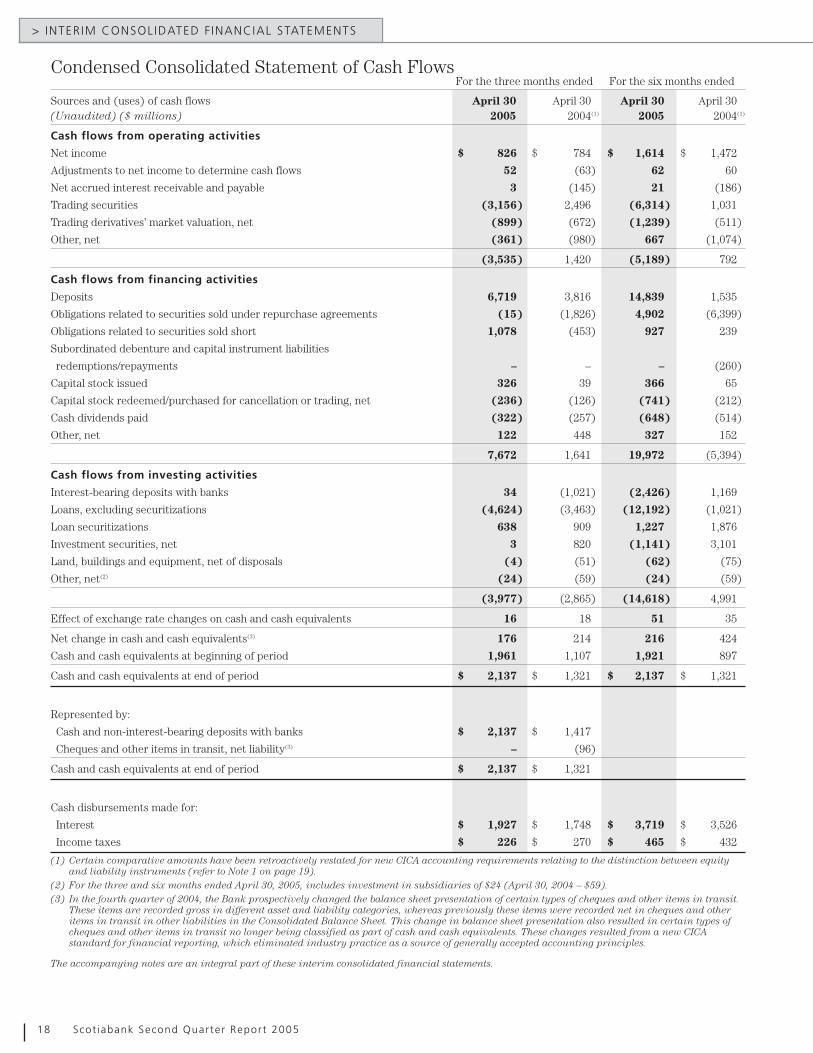


![Etiological Evaluation in 766 Patients with …...were more frequent with a rate of 63.52% [12]. Bhagwan Singh Yadav et al., found the mean age of 35.15 ± 12.6 years and an equal](https://static.documents.pub/doc/80x56/5e5ad9e2c40260543119db19/etiological-evaluation-in-766-patients-with-were-more-frequent-with-a-rate-of.jpg)
