32
www.teamhgs.com Q2FY12 Earnings Presentation 11th Nov 2011

www.teamhgs.com
Q2FY12 Earnings Presentation
11th Nov 2011
2
Disclaimer
Certain statements in this presentation concerning our future growth prospects are forward-
looking statements, which involve a number of risks, and uncertainties that could cause actual
results to differ materially from those in such forward-looking statements. The risks and
uncertainties relating to these statements include, but are not limited to, risks and
uncertainties regarding fluctuations in earnings, our ability to manage growth, intense
competition in the BPO industry including those factors which may affect our cost advantage,
wage increases, our ability to attract and retain highly skilled professionals, time and cost
overruns on fixed-price, fixed-timeframe contracts, client concentration, restrictions on
immigration, our ability to manage our international operations, reduced demand for
technology in our key focus areas, disruptions in telecommunication networks, our ability to
successfully complete and integrate potential acquisitions, liability for damages on our
service contracts, the success of the companies in which Hinduja Global has made strategic
investments, withdrawal of governmental fiscal incentives, political instability, legal
restrictions on raising capital or acquiring companies outside India, and unauthorized use of
our intellectual property and general economic conditions affecting our industry. Hinduja
Global may, from time to time, make additional written and oral forward-looking statements,
including our reports to shareholders. The company does not undertake to update any
forward-looking statement that may be made from time to time by or on behalf of the
company.
www.teamhgs.com

Contents
3
• Q2 FY12: Strong YoY performance
- Revenues grew by 28.5% sequentially and 34.5% on corresponding basis
- Healthy organic growth supplemented by Inorganic thrust
• Acquisition Impact
– OLS Inc – marquee clients, enhanced scale and diversification
– HCCA – opens up new, high potential vertical
• Revenue Analysis
– Healthy growth across overall operations
– Diversification through more verticals, geographies & currencies
• Corporate Overview
www.teamhgs.com
Slide
4
8
16
30

Key Highlights – Q2FY12
4
Consistent Growth in Topline
Sequential growth of 28.5% and y-on-y growth of 34.5%
Growth driven through mix of organic and inorganic growth
Acquired Canada-based On-Line Support, Inc.
All cash deal for leading contact center provider with FY11 revenues of >US$ 63 million
Added marquee client names, new specialisations, unique delivery model
Acquired HCCA Business Services Pvt Ltd
Acquired Mumbai headquartered Human Resource Outsourcing (HRO) firm with 500+ employees
Augments non-voice business, opens up high potential HRO Vertical
Progress in Integration of Careline
Pan European expansion with Unilever progressing well, center in Hamburg goes live
Won high profile public service contract in challenging market, setting up new center in London
Further Enhancement in Global Delivery Capabilities
Philippines near 100% utilisation, to set up fourth centre in Philippines in Manila
Tier 3 Cities in India are a success, Siliguri and Guntur report single digit attrition rates
www.teamhgs.com
Financial Performance Snapshot
5
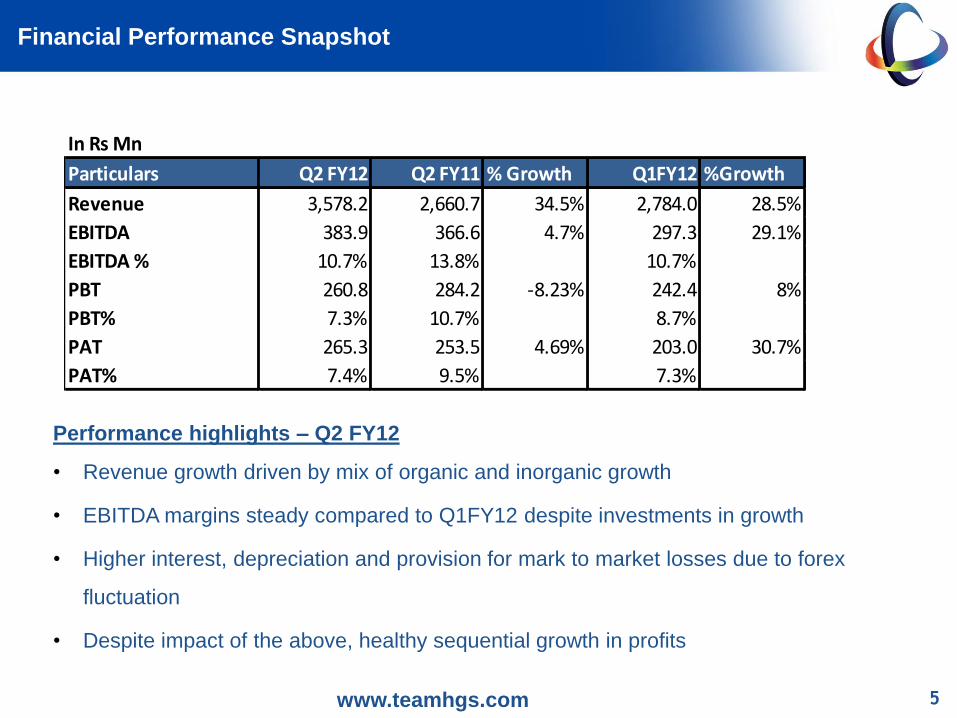
Performance highlights – Q2 FY12
• Revenue growth driven by mix of organic and inorganic growth
• EBITDA margins steady compared to Q1FY12 despite investments in growth
• Higher interest, depreciation and provision for mark to market losses due to forex
fluctuation
• Despite impact of the above, healthy sequential growth in profits
www.teamhgs.com
In Rs Mn
Particulars Q2 FY12 Q2 FY11 % Growth Q1FY12 %Growth
Revenue 3,578.2 2,660.7 34.5% 2,784.0 28.5%
EBITDA 383.9 366.6 4.7% 297.3 29.1%
EBITDA % 10.7% 13.8% 10.7%
PBT 260.8 284.2 -8.23% 242.4 8%
PBT% 7.3% 10.7% 8.7%
PAT 265.3 253.5 4.69% 203.0 30.7%
PAT% 7.4% 9.5% 7.3%

Financial Performance Q2FY12 vs Q1FY12
6
• Organic revenue growth
strong – all geographies
report healthy growth
• EBITDA registers
healthy growth, margins
stable
• Acquisitions accretive to
profits, margins improve
by 10 basis points
www.teamhgs.com
278358
Q1FY12 Q2FY12
Revenues
3038
Q1FY12 Q2FY12
EBITDA
2027
Q1FY12 Q2FY12
PAT
In Rs. Cr

Financial Performance Q2FY12 vs Q2FY11
7
Comments
• Y-on-Y growth healthy
across verticals and
geographies
• Acquisition impact only
for part of quarter
• Provision for mark to
market loss of Rs 3.86 Cr
impacted Q2FY12 profits
www.teamhgs.com
266
358
Q2FY11 Q2FY12
Revenues
3738
Q2FY11 Q2FY12
EBITDA
2527
Q2FY11 Q2FY12
PAT
In Rs. Cr

8
ACQUISITIONS
www.teamhgs.com

Inorganic Growth Story
9
C-Cubed ,
Philippines
2004
SOCA ,
Philippines
2004
Source1, US
2004
Affina, US
2006
Careline, UK
2010
OLS, Canada
2011
HCCA, India
2011
www.teamhgs.com

Introducing OLS to HGS
10
OLS and HGS
OLS (Online Support) is a Canadian corporation headquartered in Dartmouth
Initially focused on providing technical support to communications industry, and later expanded to cover
all aspects of customer care
Marquee client names and new specialisations
Near-shore option for US
Consolidation of telecom capabilities
In FY 2011, it had a turnover of US$ 63 million and ~ 1,900 employees
Growth strategy is to generate employment in the rural communities and to focus on fortune clients (in
Technology and BFSI)
Service offerings – Technical support , sales inbound/outbound, customer care, customer retention in
English and French language
89% of the business is from Canada, 11% from USA
Apart from English, OLS has access to bilingual (English & French speaking) workforce
French language capability – much in demand in US
www.teamhgs.com
HCCA
11
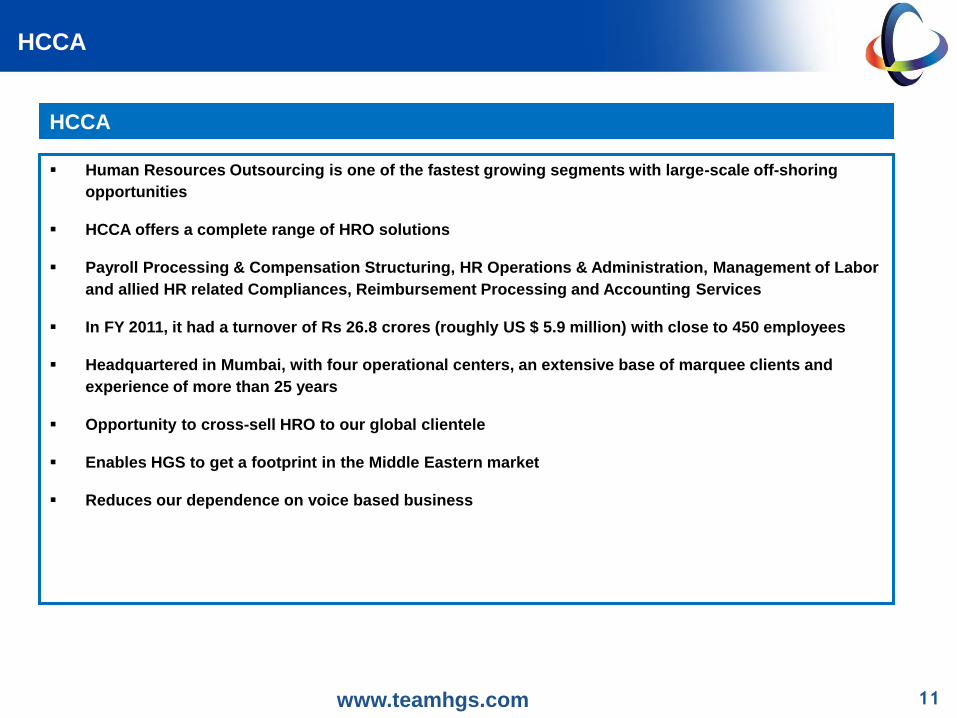
HCCA
Human Resources Outsourcing is one of the fastest growing segments with large-scale off-shoring
opportunities
HCCA offers a complete range of HRO solutions
Payroll Processing & Compensation Structuring, HR Operations & Administration, Management of Labor
and allied HR related Compliances, Reimbursement Processing and Accounting Services
In FY 2011, it had a turnover of Rs 26.8 crores (roughly US $ 5.9 million) with close to 450 employees
Headquartered in Mumbai, with four operational centers, an extensive base of marquee clients and
experience of more than 25 years
Opportunity to cross-sell HRO to our global clientele
Enables HGS to get a footprint in the Middle Eastern market
Reduces our dependence on voice based business
www.teamhgs.com

Employees
12
HGS ex-OLS
and HCCA OLS HCCA HGS Total
21,150
2,138
553
23,841
EMPLOYEES
www.teamhgs.com
Centers
13
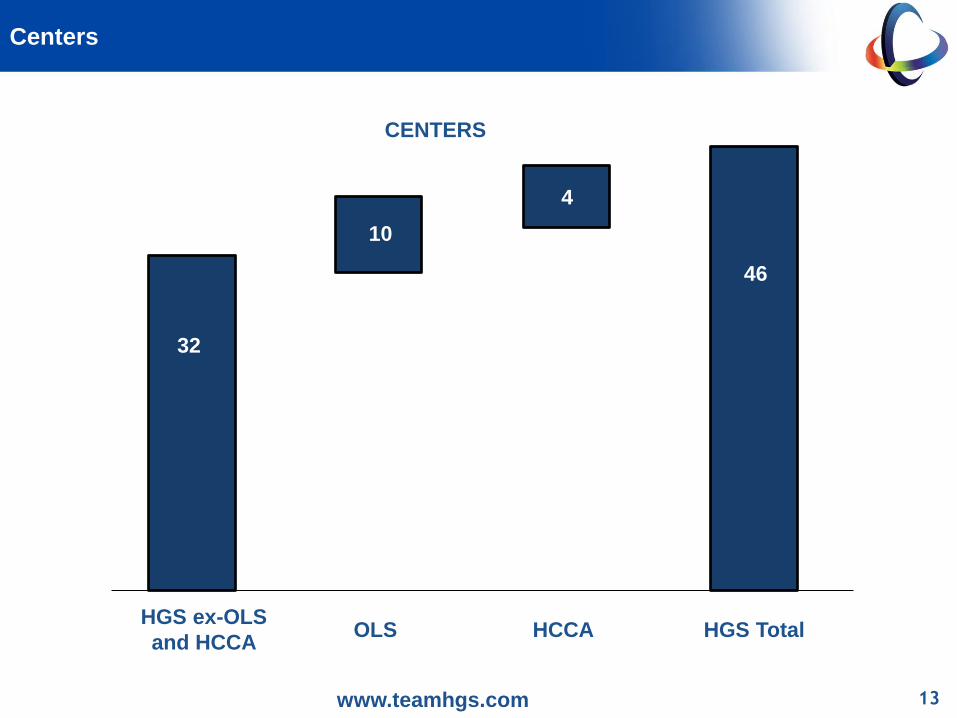
HGS ex-OLS
and HCCA OLS HCCA HGS Total
32
10
4
46
CENTERS
www.teamhgs.com

Clients
14
HGS ex-OLS
and HCCA OLS HCCA HGS Total
114
5
350
469
CLIENTS
www.teamhgs.com

Detailed Financials
www.teamhgs.com 15

Profit & Loss Account
16 www.teamhgs.com
P&L Account Q2FY12 Vs. Q2FY11 Q2FY12 Q2FY11 % Growth
Sales / Income from operations 357.8 266.1 34.5%
Expenditure
b) Employees Cost (246.3) (172.4) 42.8%
c) Depreciation, Amortisation and Impairment (14.1) (10.7) 32.1%
d) Other Expenditure (73.2) (57.0) 28.3%
e) Total (333.5) (240.1) 38.9%
Profit from Operations 24.3 26.0 -6.5%
(Before other Income, Interest & Exceptional items)
Other Income 7.4 5.5 33.5%
Profit before Interest & Exceptional Items 31.7 31.5 0.5%
Interest and Other Finance charges (5.6) (3.1) 80.3%
Profit from Ordinary Activities before tax 26.1 28.4 -8.2%
Tax Expense 0.5 (3.1)
Net Profit from Ordinary Activities after Tax 26.5 25.3 4.7%
PAT % 7.4% 9.5%
EBITDA 38.4 36.7 4.7%
EBITDA% 10.7% 13.8%
In Rs Crore

Revenue Analysis
17
Growth by Geography
Revenue Contribution by Geography
www.teamhgs.com 29%
16%0%28%
12%
15%
Sep'11
India Manila Mauritius North America U. K. Canada
33%
20%
34%
13%0%
June'11
Particulars Sep'11 June'11 Q-on-Q Sep'10 Y-on-Y
Growth (%) Growth (%)
India 1,042.2 926.0 12.5% 829.0 25.7%
Manila 585.5 543.1 7.8% 495.2 18.2%
North America 985.2 948.1 3.9% 979.4 0.6%
U. K. 418.2 366.0 14.3% 354.0 18.1%
Canada 547.1 - NA - NA
Total Revenues 3,578.2 2,784.0 28.5% 2,660.7 34.5%

Revenue Analysis
18
Revenue Contribution by Vertical
www.teamhgs.com
Growth by Vertical
Revenue Analysis
19
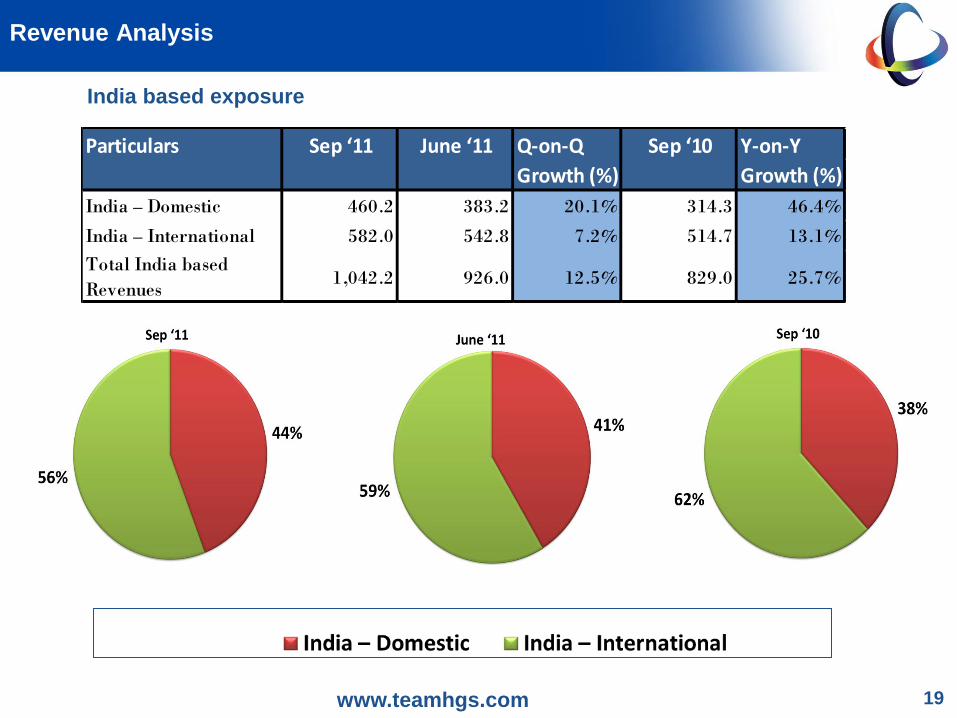
India based exposure
www.teamhgs.com
Particulars Sep ‘11 June ‘11 Q-on-Q Sep ‘10 Y-on-Y
Growth (%) Growth (%)
India – Domestic 460.2 383.2 20.1% 314.3 46.4%
India – International 582.0 542.8 7.2% 514.7 13.1%
Total India based
Revenues 1,042.2 926.0 12.5% 829.0 25.7%

Revenue Analysis
20
Revenue by Currency Exposure
www.teamhgs.com

Client Metrics
21 www.teamhgs.com
Particulars Sep ‘11 June ‘11 Sep ‘10
Over $ 20 million 5 3 3
Over $ 15 million 5 4 4
Over $ 10 million 9 7 6
Over $ 5 million 15 13 11
Over $ 1 million 47 44 42
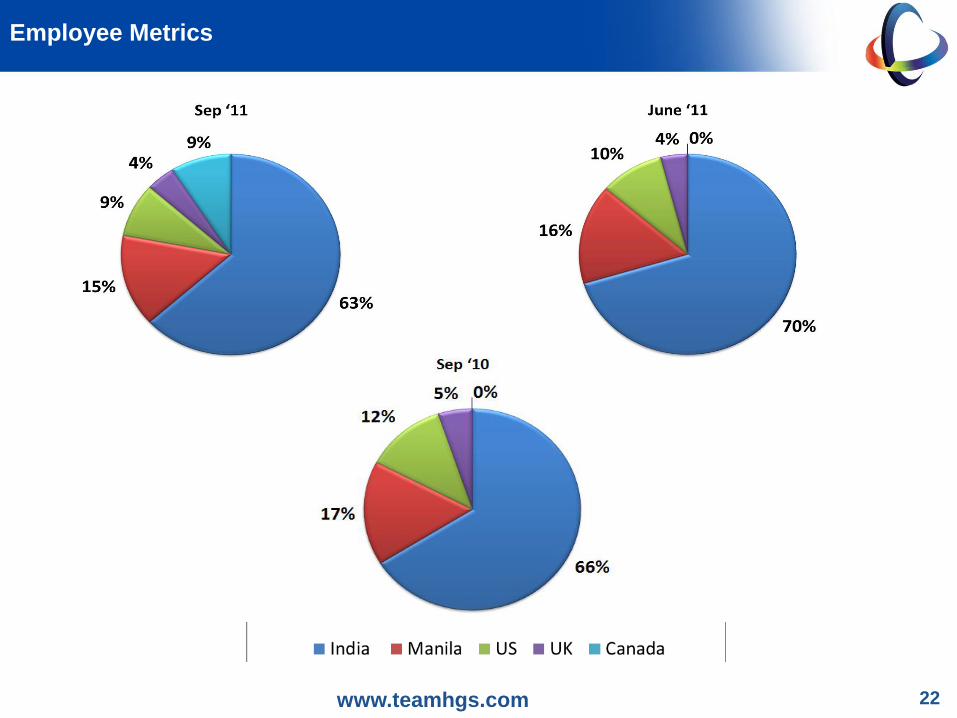
Employee Metrics
22 www.teamhgs.com

Balance Sheet
23 www.teamhgs.com
Balance Sheet as at… 30-Jun-11 30-Sep-11
SOURCES OF FUNDS
Shareholders' Funds
Share Capital 21 21
Reserves and Surplus 1,002 1,077
1,022 1,097
Secured Loans 172 524
Unsecured Loans 50 196
Deferred Tax Liability (Net) 16 18
TOTAL 1,261 1,835
APPLICATION OF FUNDS
Fixed Assets 375 800
Investments 1 1
Current Assets, Loans and Advances
Cash and Bank Balances 715 731
Other Current Assets 353 507
1,068 1,239
Less: Current Liabilities and Provisions 184 205
Net Current Assets 884 1,033
TOTAL 1,261 1,835
In Rs Crore
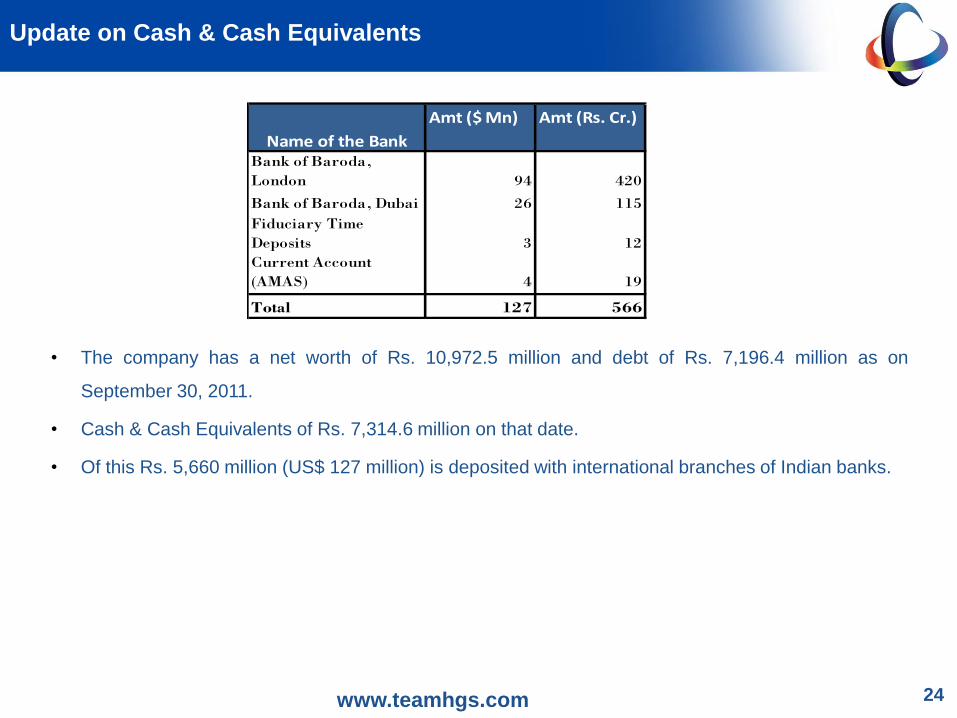
Update on Cash & Cash Equivalents
24
• The company has a net worth of Rs. 10,972.5 million and debt of Rs. 7,196.4 million as on
September 30, 2011.
• Cash & Cash Equivalents of Rs. 7,314.6 million on that date.
• Of this Rs. 5,660 million (US$ 127 million) is deposited with international branches of Indian banks.
www.teamhgs.com
Amt ($ Mn) Amt (Rs. Cr.)
Bank of Baroda,
London 94 420
Bank of Baroda, Dubai 26 115
Fiduciary Time
Deposits 3 12
Current Account
(AMAS) 4 19
Total 127 566
Name of the Bank

Business Update
25
India
Traction in Telecom with increased volumes from top client and addition of new logos
Ramp up in emerging vertical representing new specialisations and verticals which are being incubated – growth in
excess of 100%
Tier 3 Cities Delivery Model successful – Winning vendor delivery awards, low attrition rates recorded
www.teamhgs.com
Europe
Reeling under austerity measures of the government and debt crisis in ‘PIIGS’
Despite the depressed market conditions, significant £8million (over 2.5 years) contract win from a
high profile public sector client
Unilever pan-European contract progressing well (Hamburg is live now)
New Cisco upgrade investment to support European expansion
New facility coming up in London to support public sector business

Business Update
Philippines
Strong growth in all major accounts
Seat Utilization close to 100% - Iloilo fully functional
Fourth Center started in September, 2011 with 250 seats for large Consumer Electronics Clients
Encouraging Discussions with Financial Services Client on Global Procurement & Australian business
Incubated new service between Careline, UK and HGS Philippines focusing on the publishing domain
26 www.teamhgs.com

27 www.teamhgs.com
Corporate Overview

Global delivery
Canada 10 Cities
OLS Inc
United States
Lyndhurst
Peoria
Waterloo
El Paso
United Kingdom
London
Selkirk
Alness
Mauritius
India
Bangalore
Chennai
Hyderabad
Mumbai HCCA Services
Durgapur
Mysore
Nagercoil
Guntur
Philippines
Manila
Iloilo
www.teamhgs.com 28

29 www.teamhgs.com
Robust Delivery
Cost - effective
Technology Expertise
People Effectiveness
Vendor Viability
Scalable Infrastructure
Six Sigma
Partnership Approach Management expertise and
proven customer engagement models
Multi level BCP ISO 27001 Certified Vendor management
expertise
Exp. Senior Team Comprehensive
Training
Stringent Talent
Acquisition
Hinduja Group Backing Listed &
Committed Funds for Growth
Experience in managing
infrastructure in 6 countries
DR site
strategies
Planning & Rapid
implementation
BPMC Approach Flexible Engagement
Models
Business Transformation Model
30 www.teamhgs.com
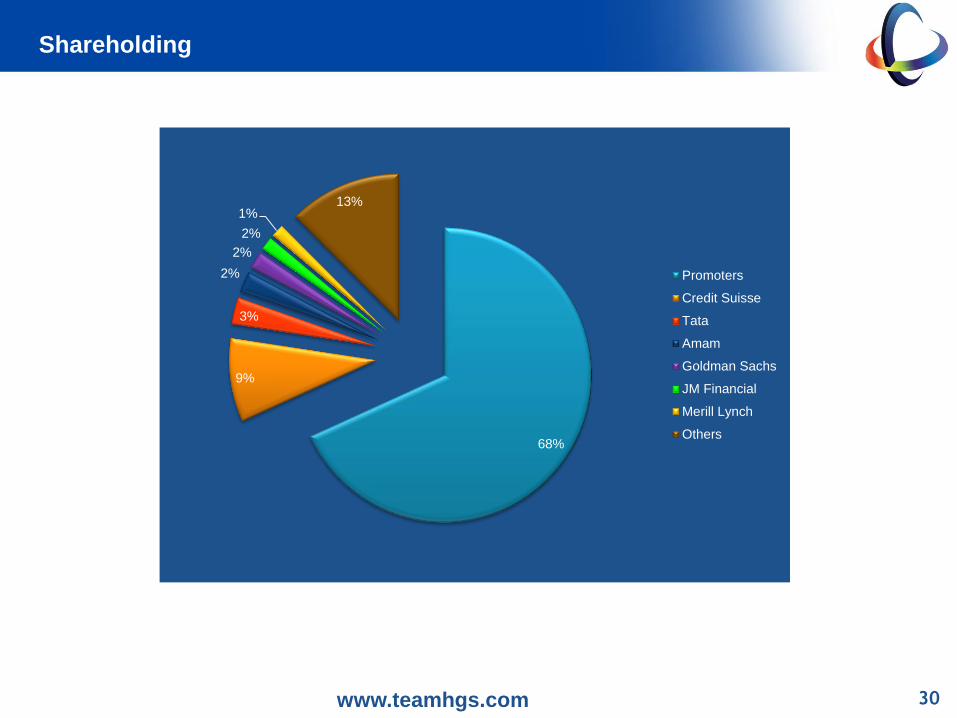
Shareholding
68%
9%
3%
2%
2%
2%
1% 13%
Promoters
Credit Suisse
Tata
Amam
Goldman Sachs
JM Financial
Merill Lynch
Others

31 www.teamhgs.com
Key Management & Board of Directors
• Board of Directors
• Ramkrishan P. Hinduja – Chairman Rajendra P. Chitale
• Dheeraj G. Hinduja Anil Harish
• Vinoo S. Hinduja Rangan Mohan
Key Management Personnel
• Dr. Partha Sarkar, Global CEO

32


