31
1 Q3 2013 Investor Kit JANUARY-SEPTEMBER 2013
| Date post: | 29-Oct-2018 |
| Category: |
Documents |
| Upload: | hoangtuyen |
| View: | 214 times |
| Download: | 0 times |
1
Q3 2013
Investor KitJANUARY-SEPTEMBER 2013
2
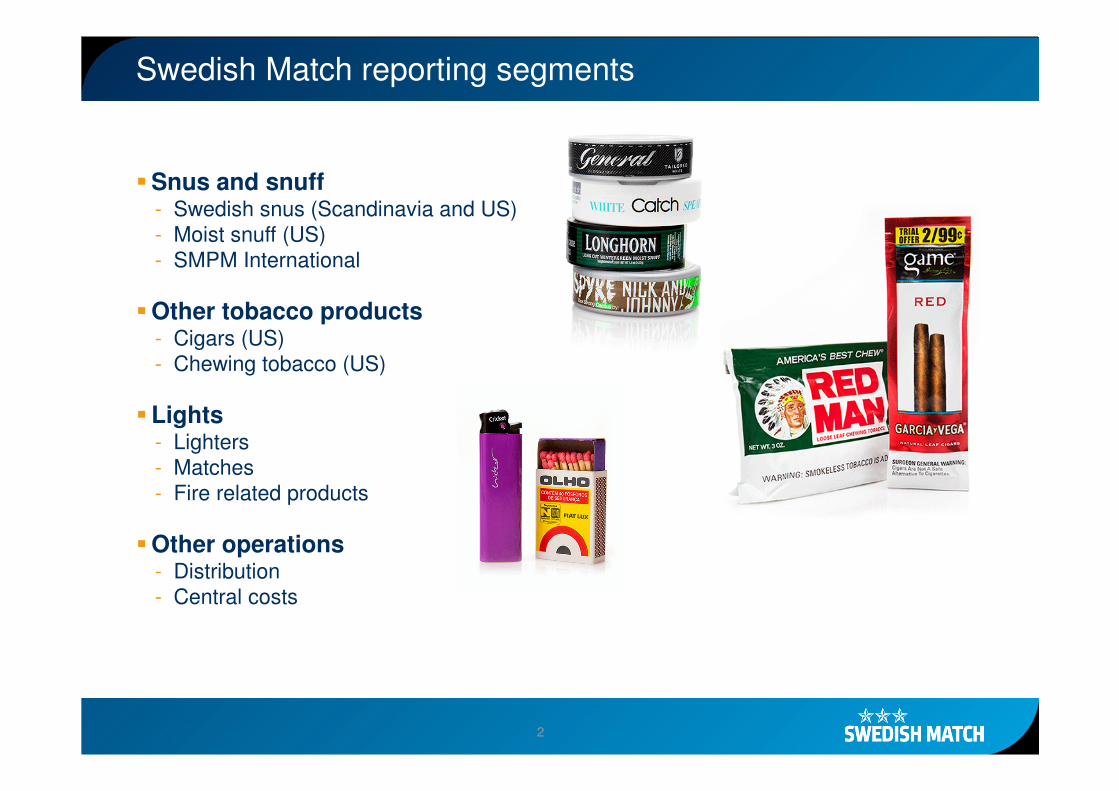
�Snus and snuff- Swedish snus (Scandinavia and US)- Moist snuff (US)- SMPM International
�Other tobacco products- Cigars (US)- Chewing tobacco (US)
�Lights- Lighters- Matches- Fire related products
�Other operations- Distribution- Central costs
Swedish Match reporting segments

33
Sales and operating profit
38%
19%10%
33%
Snus and snuffOther tobacco productsLightsOther operations
65%
29%
7%
Sales, SEK Operating profit*, SEK
Sales and operating profit by product area
40%
21%
11%
28%
Snus and snuffOther tobacco productsLightsOther operations
63%
31%
6%
Sales, SEK Operating profit*, SEK
Full year 2012
* Excluding Other operations, share of net profit in STG and larger one-time items. Totals may not add up due to rounding.
Q3 2013
44
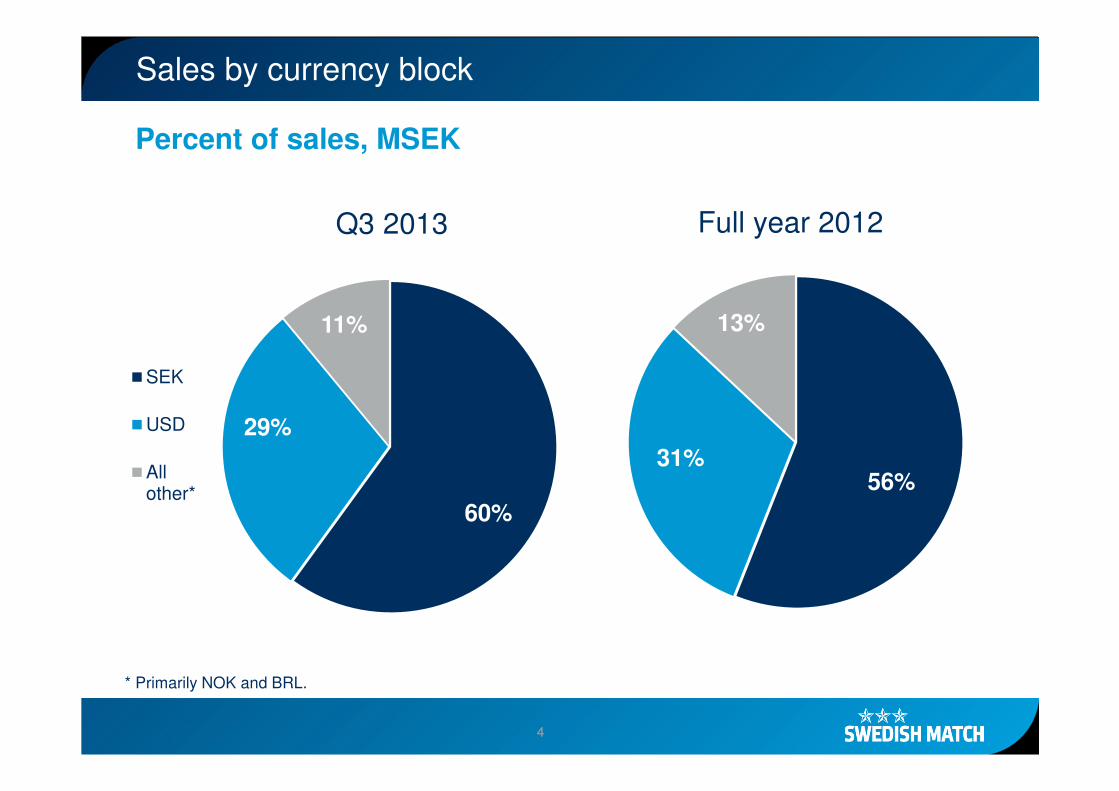
Sales by currency block
60%
29%
11%
SEK
USD
Allother* 56%
31%
13%
Percent of sales, MSEK
Full year 2012Q3 2013
* Primarily NOK and BRL.
5
� Sales amounted to 3,230 MSEK (3,208)- In local currencies, sales increased by 2%
� Operating profit from product areas amounted to 836 MSEK (942)- Includes restructuring charge of 28 MSEK- In local currencies, operating profit from product areas declined by 10%- In local currencies, and excluding restructuring charge, operating profit from product
areas declined by 7%- Operating profit for Snus and snuff down by 4% excluding restructuring charge- Operating profit for Other tobacco products down on weak cigar performance- Operating profit, including share of net profit in STG,
declined to 924 MSEK (1,022)
� Profit before income tax amounted to 782 MSEK (881)
� Profit for the period amounted to 628 MSEK (693)- Underlying tax rate was 22%
� EPS (basic) was 3.15 SEK (3.41)
Group results – third quarter 2013

6
�Sales up 2% in local currencies, up 1% in SEK
�Scandinavian snus sales declined 4%- Higher sales in Norway, lower sales in Sweden and Travel Retail- Shipment volumes for Scandinavia down less than 1% year on year
� US snus/moist snuff sales down 1% in USD- Moist snuff volumes down less than 1% year on year- Strong volume growth for snus in the US year on year
�US cigar sales down by 11% in USD*- Volumes down by close to 20%, which was well below expectations- Volumes and sales adversely impacted by intensified price competition
�US chewing tobacco sales flat in USD*- Swedish Match volumes down by 3%- Lower contract manufacturing volumes
�Lights sales up 13% in local currencies- Higher sales for both lighters and matches in local currencies
Conclusions, third quarter – sales
* Total Other tobacco products sales declined by 7% in local currencies.
7
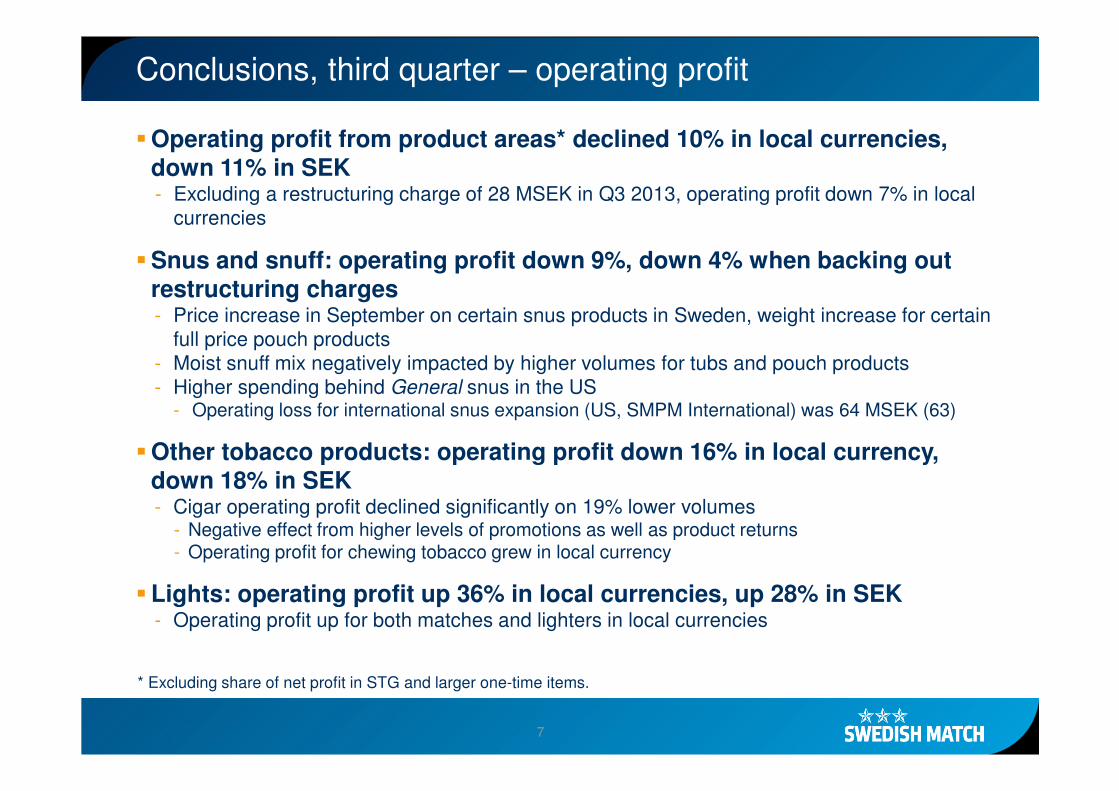
�Operating profit from product areas* declined 10% in local currencies, down 11% in SEK- Excluding a restructuring charge of 28 MSEK in Q3 2013, operating profit down 7% in local
currencies
�Snus and snuff: operating profit down 9%, down 4% when backing out
restructuring charges- Price increase in September on certain snus products in Sweden, weight increase for certain
full price pouch products- Moist snuff mix negatively impacted by higher volumes for tubs and pouch products- Higher spending behind General snus in the US
- Operating loss for international snus expansion (US, SMPM International) was 64 MSEK (63)
�Other tobacco products: operating profit down 16% in local currency,
down 18% in SEK- Cigar operating profit declined significantly on 19% lower volumes
- Negative effect from higher levels of promotions as well as product returns - Operating profit for chewing tobacco grew in local currency
�Lights: operating profit up 36% in local currencies, up 28% in SEK- Operating profit up for both matches and lighters in local currencies
Conclusions, third quarter – operating profit
* Excluding share of net profit in STG and larger one-time items.
8
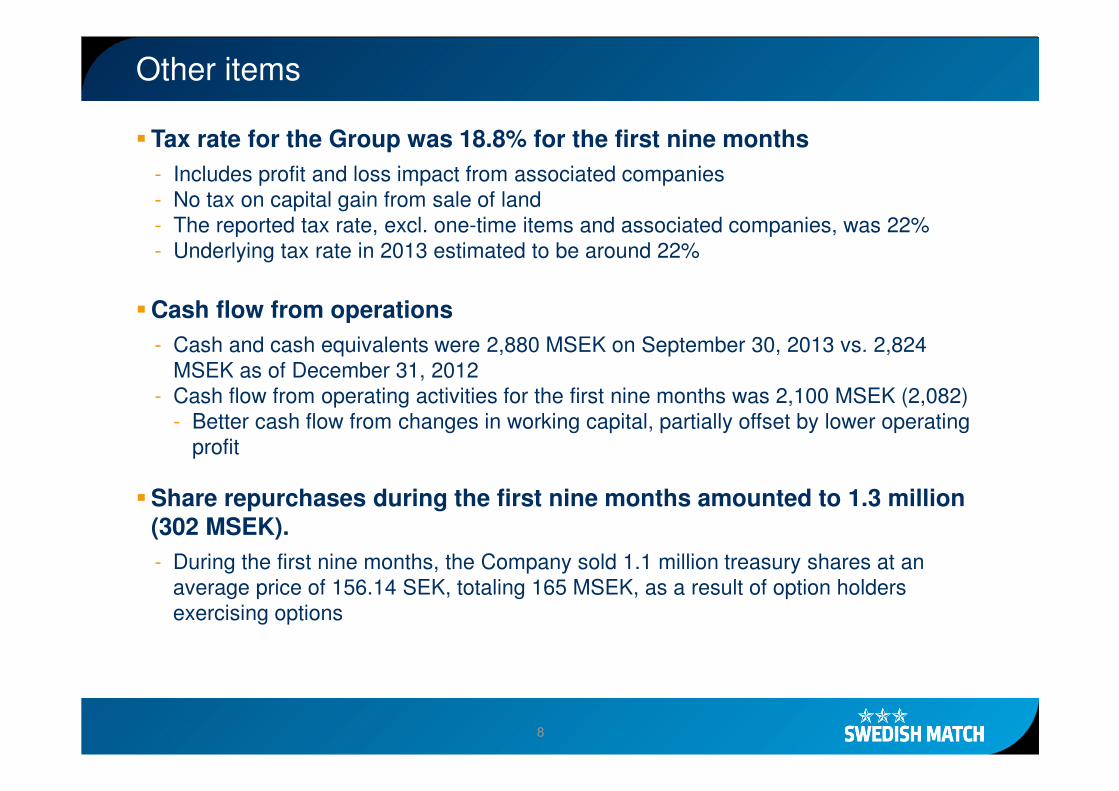
�Tax rate for the Group was 18.8% for the first nine months
- Includes profit and loss impact from associated companies- No tax on capital gain from sale of land- The reported tax rate, excl. one-time items and associated companies, was 22%- Underlying tax rate in 2013 estimated to be around 22%
�Cash flow from operations
- Cash and cash equivalents were 2,880 MSEK on September 30, 2013 vs. 2,824 MSEK as of December 31, 2012
- Cash flow from operating activities for the first nine months was 2,100 MSEK (2,082)- Better cash flow from changes in working capital, partially offset by lower operating
profit
�Share repurchases during the first nine months amounted to 1.3 million
(302 MSEK).
- During the first nine months, the Company sold 1.1 million treasury shares at an average price of 156.14 SEK, totaling 165 MSEK, as a result of option holders exercising options
Other items

9
�Financial policy- Dividend policy: 40 - 60% of earnings per share- 2012 dividend 7.30 SEK per share (6.50)- Net debt not to exceed 3 times EBITA*
�Financing and cash flow- Cash flow from operating activities for the first nine months amounted to
2,100 MSEK (2,082) - Higher dividends from associates- Net finance cost for the first nine months was 416 MSEK (415)- Net debt/EBITA* was 2.5 for the 12 months ending September 30, 2013
Financial policy and financing needs
* Excluding share of net profit in STG. Operating profit adjusted for amortization and write-downs of intangible assets.

1010
Maturity profile of interest bearing liabilities*
As of September 30, 2013
0
500
1 000
1 500
2 000
2 500
3 000
3 500
2014 2015 2016 2017 2018 2019 2022 2023 2028
Fixed
Float
947
1,998
3,288
Year
1,2511,090
651
MSEK
685
* Includes Swedish (SEK) and Global (EUR) MTN programs.
264 332

11
Snus and snuff
�Leading position in Scandinavia
�The third largest producer of moist snuff in the US
�Production in Sweden and the US
�Joint venture with Philip Morris International
for markets outside Scandinavia and the US

12
�Scandinavia snus sales down 4% in Q3- Price increases of most products in Sweden in September 2013, weight increase
for certain full price pouch products in Sweden- Impacted by currency translation from weaker NOK- Scandinavian shipment volumes down less than 1%- Volumes up in Norway, up in Sweden and down in Travel Retail- Profits down due to 28 MSEK restructuring charge and lower sales- Solid total market growth in volume terms
�US snus and moist snuff sales down 4% in USD in Q3- Higher sales for US snus; moist snuff sales lower primarily on mix- Higher spend behind US snus as part of distribution build- Growth initiatives for moist snuff pouches and tubs showed
good traction in the quarter
�Continued investment behind snus internationally- Expansion of General snus in the US- Test market activities through SMPM International in Canada, Russia, Israel,
and Malaysia
Snus and snuff
MSEKQ3-2013 Q3-2012 chg 9m-2013 9m-2012 chg
Oct 2012-Sep 2013
Full year 2012
Sales 1,217 1,263 -4 3,620 3,769 -4 4,901 5,049Operating profit 553 607 -9 1,632 1,756 -12 2,225 2,349Operating margin, % 45.4 48.0 45.1 46.6 45.4 46.5
Operating profit impacted by restructuring and investments

13
�Swedish Match total value market share 4 weeks to October 6, 2013 was 78.0%; 24 week share was 78.7%- 81.2% for 4 weeks to October 7, 2012; 82.1% for 24 weeks to October 7, 2012
�Swedish Match total volume market share 4 weeks to October 6, 2013 was 71.0%; 24 week share was 72.3%- 75.6% for 4 weeks to October 7, 2012; 76.9% for 24 weeks to October 7, 2012
�Value segment** was 40.8% of Swedish market 4 weeks to October 6, 2013;
24 week share was 39.7%- 36.3% for 4 weeks to October 7, 2012; 34.9% for 24 weeks to October 7, 2012
�Swedish Match share of value segment** 4 weeks to October 6, 2013
was 36.1%- 40.1% for 4 weeks to October 7, 2012
� Swedish Match share of premium segment** 4 weeks to October 6, 2013
was 95.0%; 24 week share was 95.2%- 95.9% for 4 weeks to October 7, 2012; 95.8% for 24 weeks to October 7, 2012
Nielsen snus consumption data, Sweden*
* Source: Nielsen (excluding tobacconists). Volume basis, unless stated otherwise.** Segmentation by segment: premium and value (mid and low price), made by Swedish Match, not Nielsen.

1414
Manufacturer share by price segment, Sweden
6 October 2013 (12 weeks ending), Swedish Match share of:
Full price segment was: 95.0%
Mid price segment was: 54.5%
Low price segment was: 29.6%
Source: Swedish Match estimates, using Nielsen data (excluding tobacconists). 24 weeks ending 6 October 2013.
72,3%
10,1%
11,5%
5,7%
0,4%
Total volume shares
Swedish Match
Competitor 1
Competitor 2
Competitor 3
Other
95,2%
1,1%3,3% 0,3%
Share of full price
54,5%
45,2%
0,3%Share of mid price
29,5%
14,0%34,9%
20,9%0,7%
Share of low price
15
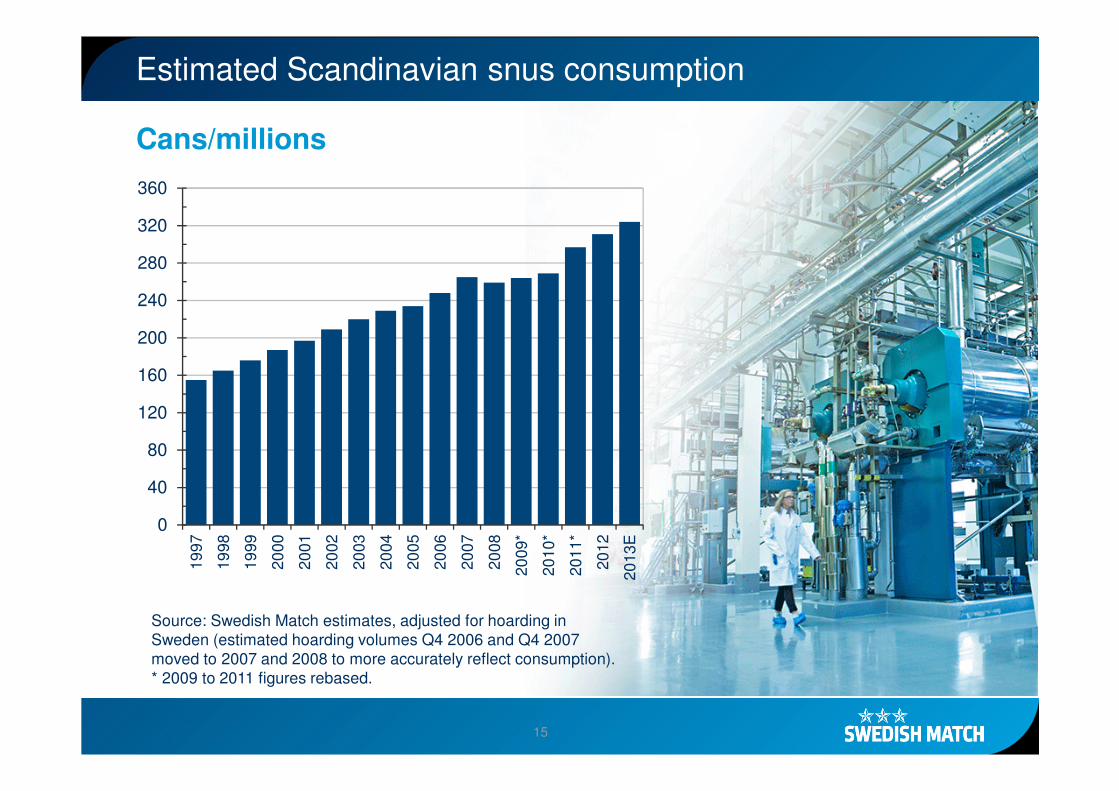
Estimated Scandinavian snus consumption
Source: Swedish Match estimates, adjusted for hoarding in Sweden (estimated hoarding volumes Q4 2006 and Q4 2007 moved to 2007 and 2008 to more accurately reflect consumption).* 2009 to 2011 figures rebased.
0
40
80
120
160
200
240
280
320
36019
97
1998
1999
2000
2001
2002
2003
2004
2005
2006
2007
2008
2009
*
2010
*
2011
*
2012
2013
E
Cans/millions

16
� US snuff market up 5.7% for the YTD to September 28- Category growth continues to be driven by the value segment
� Swedish Match market share in the US- YTD to September 28 was 7.0% vs. 7.6% YTD 2012- Swedish Match estimates its market share
based on industry shipments to be close to 10% of the market (SM estimates, not Nielsen)
Nielsen moist snuff consumption data, US*
* Source: Nielsen. Volume basis, unless stated otherwise.
1717
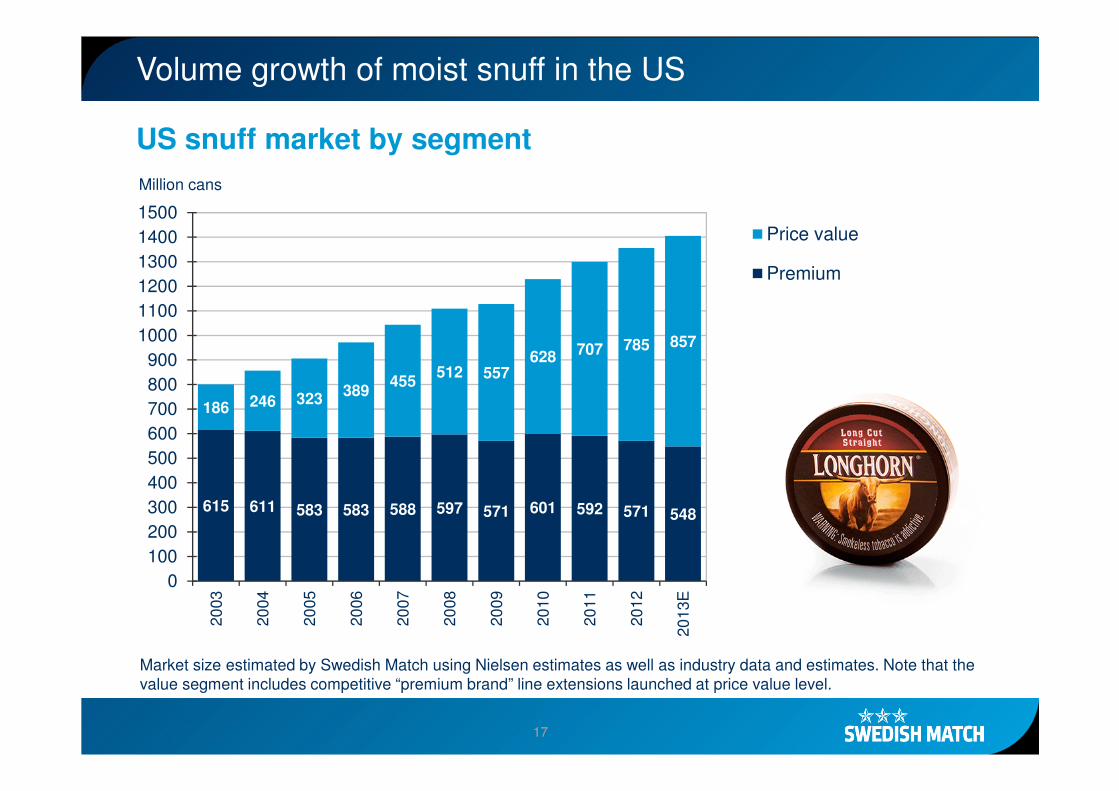
Volume growth of moist snuff in the US
615 611 583 583 588 597 571 601 592 571 548
186 246 323389
455512 557
628 707 785 857
0100200300400500600700800900
100011001200130014001500
2003
2004
2005
2006
2007
2008
2009
2010
2011
2012
2013
E
Price value
Premium
Million cans
Market size estimated by Swedish Match using Nielsen estimates as well as industry data and estimates. Note that the value segment includes competitive “premium brand” line extensions launched at price value level.
US snuff market by segment

18
Snus in the US
� General snus currently in more than20,000 stores in the US
- Good sell-through/rotation in stores- Distribution expansion continues- More than 3 million cans shipped year to date
- 2 million cans shipped for all of 2012
SMPM International (the 50/50 joint venture)
� Test launch of General in Canada started in December 2010, continued distribution build, now in 3,000 stores.
� Test launch under the Parliament brand in St. Petersburg, Russia, started in December 2011. Now also in Moscow and other cities, and in more than 500 stores.
� Test launch of Marlboro in Tel Aviv, Israel in July 2012, now in more than 400 stores.
� Good sales of General snus in Malaysia, although store base is small
Snus expansion

19
US cigars
�Swedish Match is a major player in the US (mass market) cigar market
�Production takes place in Santiago,
Dominican Republic and Dothan, Alabama
Chewing tobacco
�Nearly all chewing tobacco sales are in the US.
Swedish Match is the largest producer and
production takes place in Owensboro, Kentucky
�The market typically declines by 6-8%
per year in volume
Other tobacco products

20
� Sales down more than 10% for cigars, up slightly for chewing tobacco in USD- Cigar sales negatively affected by promotional pricing/mix, lower volumes, and returns- Chewing tobacco sales up on price/mix, despite volume decline
� Operating profit down for cigars, up for chewing tobacco in USD- Operating profit for cigars declined vs. prior year on lower volumes and high levels
of promotional activity- Full year 2013 operating profit growth for cigars and OTP expected to be below 2012
� Shipment volumes down for cigars- Net shipments down close to 20% versus Q3 2012, mix
skewed to promotional items- Programs in place to respond to increasingly competitive
environment- Jackpot launch in September/November
� Solid chewing tobacco performance- Sales and profits up- Lower shipments on contract manufacturing- Price increase of 5% in September
Other tobacco products
Sales and profits down, despite strong chewing performance
MSEKQ3-2013 Q3-2012 chg 9m-2013 9m-2012 chg
Oct 2012-Sep 2013
Full year 2012
Sales 622 689 -10 1,974 2,060 -4 2,575 2,661Operating profit 246 300 -18 801 913 -12 1,049 1,161Operating margin, % 39.6 43.5 40.6 44.3 40.7 43.6
21
US cigars
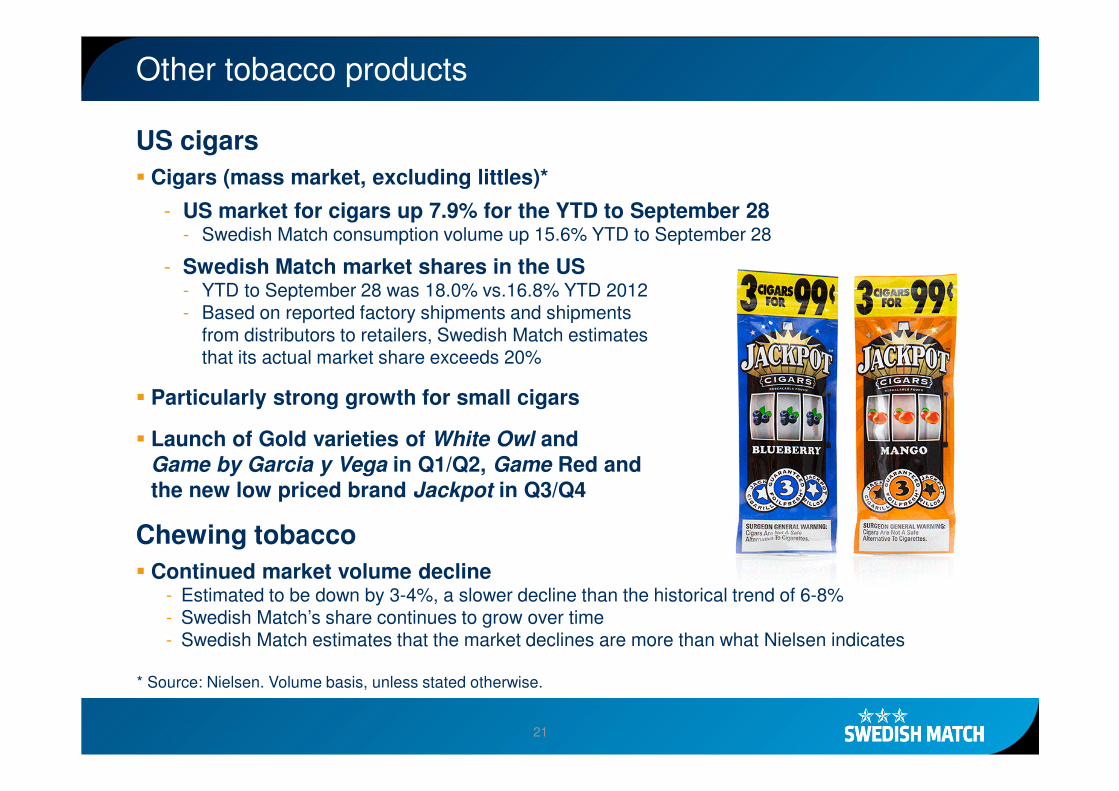
� Cigars (mass market, excluding littles)*
- US market for cigars up 7.9% for the YTD to September 28- Swedish Match consumption volume up 15.6% YTD to September 28
- Swedish Match market shares in the US- YTD to September 28 was 18.0% vs.16.8% YTD 2012- Based on reported factory shipments and shipments
from distributors to retailers, Swedish Match estimates that its actual market share exceeds 20%
� Particularly strong growth for small cigars
� Launch of Gold varieties of White Owl and
Game by Garcia y Vega in Q1/Q2, Game Red and
the new low priced brand Jackpot in Q3/Q4
Chewing tobacco
� Continued market volume decline- Estimated to be down by 3-4%, a slower decline than the historical trend of 6-8% - Swedish Match’s share continues to grow over time- Swedish Match estimates that the market declines are more than what Nielsen indicates
Other tobacco products
* Source: Nielsen. Volume basis, unless stated otherwise.

2222
Lights
� Swedish Match is market leader in many markets. The brands are mostly local and hold a strong position in their respective markets
� Main markets EU, Brazil, Asia and East Europe
� Production in Brazil, the Netherlands, the Philippines andSweden
� Q3 sales and operating profit up for both matches and lighters in local currencies
� Q3 sales and operating profit, negatively impacted by currency movements (strong SEK, weak BRL)
� Strong lighter volume growth in Asia
� Improved match performance in Brazil
Q3 sales and operating profit up in local currencies
MSEKQ3-2013 Q3-2012 chg 9m-2013 9m-2012 chg
Oct 2012-Sep 2013
Full year 2012
Sales 332 311 7 986 998 -1 1,327 1,339Operating profit 56 44 28 167 161 4 228 222Operating margin, % 16.8 14.0 17.0 16.1 17.2 16.6
23
� STG Sales up 9% in the third quarter- Sales higher for all product segments in local currencies- Cigars in Europe had low volumes in Q3 prior year on ERP related issues- Q4 2012 cigar sales were higher than normal due to recovered volumes, Q4 2013 has a planned
stock reduction for a major European distributor, so Q4 comparisons will be distorted
� Swedish Match share of STG net profit after interest and tax for the third quarter amounted to 88 MSEK (80)- Excluding accounting adjustments, share of net profit was 88 MSEK (82)
� Total STG net finance cost for the third quarter amounted to 24 MDKK (22)
� Net profit for the January–September period for STG amounted to 397 MDKK (439)
� Reported EBITDA for the third quarter amounted to 335 MDKK (319)
- Handmade cigar sales up in local currencies, but EBITDA declined
- Machine made cigar sales and profits up on higher volumes- Prior year sales and profits unusually low on ERP related issues- Difficult market situations is certain European countries
- Pipe tobacco sales up but EBITDA declined
- Fine cut sales and EBITDA up
Scandinavian Tobacco Group (STG)

2424
P & L summary
MSEKQ3- 2013 Q3-2012 chg 9m-2013 9m-2012 chg
Oct 2012-Sep 2013
Full year2012 chg
Sales 3,230 3,208 1 9,432 9,338 1 12,580 12,486 1
Cost of goods sold -1,749 -1,617 -4,950 -4,551 -6,536 -6,138Gross profit 1,481 1,591 -7 4,482 4,787 -6 6,044 6,349 -5
Selling and administrative expenses -638 -640 -1,924 -1,986 -2,591 -2,653Share of profit/loss in associated companiesand joint ventures 81 72 203 245 294 337Adjustment to capital gain from transfer of businesses to STG - - - 30 - 30Capital gain from sale of land - - 161 - 161 -
Operating profit 924 1,022 -10 2,923 3,076 -5 3,909 4,062 -4Finance income 9 11 25 28 35 38Finance costs -151 -152 -441 -443 -587 -589Net finance cost -142 -141 -416 -415 -553 -551
Profit before income tax 782 881 -11 2,507 2,661 -6 3,356 3,511 -4Income tax expense -154 -188 -471 -542 -534 -604Profit for the period 628 693 -9 2,035 2,120 -4 2,822 2,907 -3
EPS, basic, SEK, incl. larger one-time items 3.15 3.41 10.20 10.40 14.14 14.33
EPS, basic, SEK, excl. larger one-time items 3.15 3.41 9.39 10.25 13.33 14.18
EPS, diluted, SEK, incl. larger one-time items 3.14 3.40 10.18 10.34 14.10 14.25
EPS, diluted, SEK, excl. larger one-time items 3.14 3.40 9.38 10.19 13.30 14.10

2525
Balance sheet in summary
MSEK September 30, 2013 December 31, 2012
Intangible assets 965 962Property, plant and equipment 2,029 2,010Investments in associated companies and joint ventures 4,321 4,354Other non-current financial receivables* 1,122 1,140Current operating assets 2,719 3,080Other current investments and current financial assets 15 -Cash and cash equivalents 2,880 2,824Total assets 14,050 14,371
Equity attributable to equity holders of the Parent -1,472 -2,053Non-controlling interests 1 2Total equity -1,470 -2,051
Non-current provisions 993 1,009Non-current loans 9,488 9,238Other non-current financial liabilities* 1,471 1,870Current provisions 107 102Current loans 682 1,119Other current liabilities* 2,779 3,084Total equity and liabilities 14,050 14,371
* For full detail, please refer to notes in the January-September 2013 report.

2626
Cash flow in summary
MSEK
Jan-Sep 2013
Jan-Sep2012
Cash flow from operating activities before changes in working capital 2,238 2,435Cash flow from changes in working capital -138 -353Net cash from operating activities 2,100 2,082Purchase of property, plant and equipment -232 -171Proceeds from sale of property, plant and equipment 1 3Purchase of intangible assets -30 -28Investments in associated companies and joint ventures* -43 -20Proceeds from sale of subsidiaries, net of cash disposed of* 168 9Changes in financial receivables etc. 0 -Net cash used in investing activities -135 -208Changes in loans -278 520Dividend paid to equity holders of the Parent -1,459 -1,334Repurchase of own shares -302 -1,671Stock options exercised 165 414Other -13 11Net cash used in financing activities -1,887 -2,059Net decrease in cash and cash equivalents 78 -185Cash and cash equivalents at the beginning of the period 2,824 2,533Effect of exchange rate fluctuations on cash and cash equivalents -23 -78Cash and cash equivalents at the end of the period 2,880 2,271
* For full detail, please refer to notes in the January-September 2013 report.

2727
Key data*
* All key data, unless otherwise stated, have been calculated excluding larger one-time items.** For full detail, please refer to notes in the January-September 2013 report.
MSEK
Jan-Sep 2013
Jan-Sep2012
Operating margin, % 29.3 32.6Operating capital, MSEK 7,337 7,177Return on operating capital, % (12 months rolling from October 2012) 51.6EBITDA, MSEK** 2,959 3,273EBITA, MSEK** 2,781 3,089
Net debt, MSEK 8,598 9,671Net debt/EBITA** (12 months rolling from October 2012) 2.3Investments in property, plant and equipment, MSEK** 232 171EBITA interest cover 6.8 7.6
Excluding share of net profit in STGEBITA, MSEK** 2,559 2,826Net debt/EBITA** (12 months rolling from October 2012) 2.5
Share dataEPS, basic, SEK, incl. larger one-time items 10.20 10.40EPS, basic, SEK, excl. larger one-time items 9.39 10.25EPS, diluted, SEK, incl. larger one-time items 10.18 10.34EPS, diluted, SEK, excl. larger one-time items 9.38 10.19
Average number of shares outstanding, basic (Mio) 199.6 203.8Shares outstanding, end of period (Mio) 199.1 200.6
2828
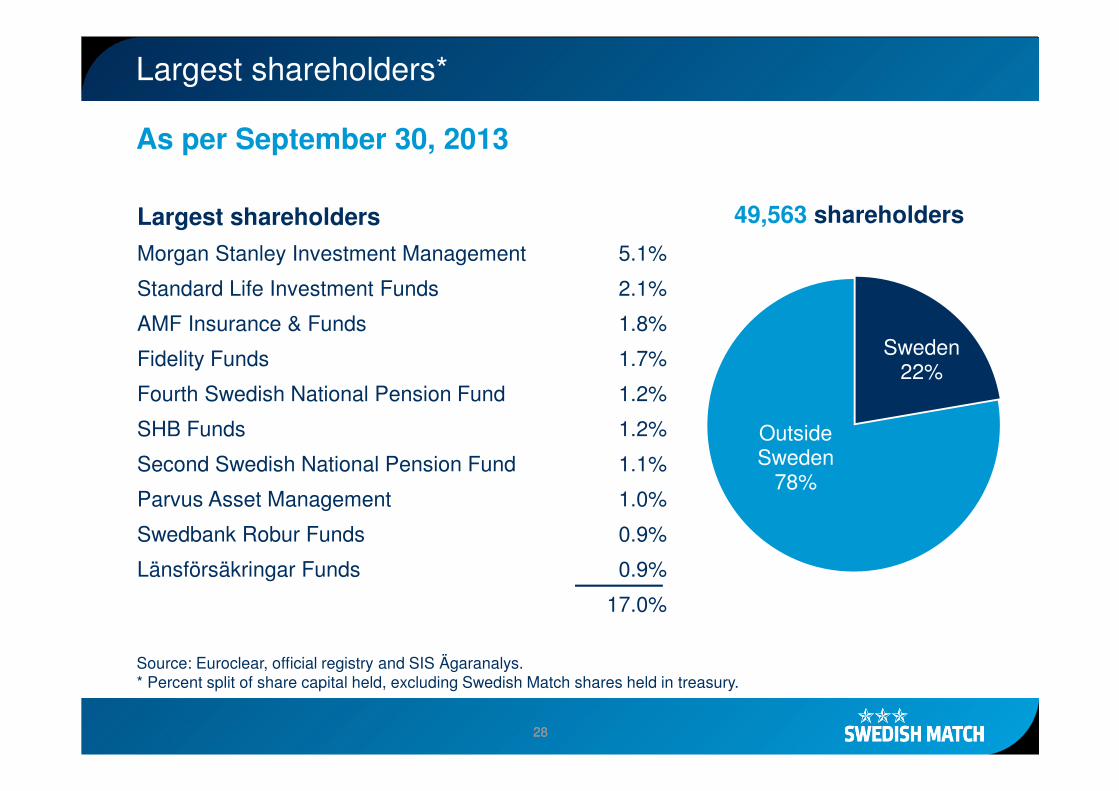
Largest shareholders*
Sweden22%
Outside Sweden
78%
Largest shareholders
Morgan Stanley Investment Management 5.1%
Standard Life Investment Funds 2.1%
AMF Insurance & Funds 1.8%
Fidelity Funds 1.7%
Fourth Swedish National Pension Fund 1.2%
SHB Funds 1.2%
Second Swedish National Pension Fund 1.1%
Parvus Asset Management 1.0%
Swedbank Robur Funds 0.9%
Länsförsäkringar Funds 0.9%
17.0%
49,563 shareholders
As per September 30, 2013
Source: Euroclear, official registry and SIS Ägaranalys.* Percent split of share capital held, excluding Swedish Match shares held in treasury.

2929
Comparable operating profit
9%
20%
-7%
10%
* *
294
312
279240
2223,365
2,181
1,049
2011
+11%
2,349
3,666
-65
1,161
201220092008 2010
-105
3,158
2,080
942
-142
2,900
1,916
804
-132
2,375
1,667
569
-155
Snus and Snuff
Other tobacco products
Other operations
LightsExcluding businesses transferred to STG (MSEK)CAGR 08-12

3030
7%
12,486
5,049
1,339
2,661
9,559
3,711
1,811
1,375
2,663
+7%
11,666
4,726
2,388
1,346
3,206
11,222
4,522
2,440
1,429
2,831
10,678
4,250
2,337
1,403
2,689
3,437
20122009 2010 20112008
Comparable sales
8%
11%
-1%
7%
**
Lights
Other operations
Snus and Snuff
Other tobacco products
Excluding businesses transferred to STG (MSEK)CAGR 08-12

3131
Snus vs. cigarettes in Sweden
0
25
50
75
100
125
150
175
200
225
250
0
70
140
210
280
350
420
490
560
630
700
Cigarettes SnusSnus
(million cans)Cigarettes (million packs)
Volume of snus and cigarettes in Sweden 1916-2012
Adjusted for estimated snus hoarding 1996, 1997, 2006, 2007, 2008, 2011 and 2012.Source: Swedish Match Distribution AB and Swedish Match estimates.


