30
Q3 2019 RESULTS & OUTLOOK Steve Oakland, CEO & President Bill Kelley, Interim CFO NOVEMBER 7, 2019

Q3 2019 RESULTS & OUTLOOKS t e v e O a k l a n d , C E O & P r e s i d e n t
B i l l K e l l e y, I n t e r i m C F O
N O V E M B E R 7 , 2 0 1 9

2
FORWARD LOOKING STATEMENTS
From time to time, we and our representatives may provide information, whether orally or in writing, which are deemed to be “forward-looking” within the meaning of the Private Securities Litigation Reform Act of 1995 (the “Litigation Reform Act”). These forward-looking statements and other information are based on our beliefs as well as assumptions made by us using information currently available.
The words “anticipate,” “believe,” “estimate,” “project,” “expect,” “intend,” “plan,” “should,” and similar expressions, as they relate to us, are intended to identify forward-looking statements. Such statements reflect our current views with respect to future events and are subject to certain risks, uncertainties, and assumptions. Should one or more of these risks or uncertainties materialize, or should underlying assumptions prove incorrect, actual results may vary materially from those described herein as anticipated, believed, estimated, expected, or intended. We do not intend to update these forward-looking statements following the date of this report.
In accordance with the provisions of the Litigation Reform Act, we are making investors aware that such forward-looking statements, because they relate to future events, are by their very nature subject to many important factors that could cause actual results to differ materially from those contemplated by the forward-looking statements contained in this presentation and other public statements we make. Such factors include, but are not limited to: our level of indebtedness and related obligations; disruptions in the financial markets; interest rates; changes in foreign currency exchange rates; customer consolidation; raw material and commodity costs; competition; our ability to continue to make acquisitions in accordance with our business strategy; changes and developments affecting our industry, including consumer preferences; the outcome of litigation and regulatory proceedings to which we may be a party; product recalls; changes in laws and regulations applicable to us; disruptions in or failures of our information technology systems; and labor strikes or work stoppages; and other risks that are set forth in the Risk Factors section, the Legal Proceedings section, the Management’s Discussion and Analysis of Financial Condition and Results of Operations section, and other sections of our Quarterly Reports on Form 10-Q and our Annual Report on Form 10-K for the year ended December 31, 2018, and from time to time in our filings with the Securities and Exchange Commission.

3
FIRST NINE MONTH EPS UP 32% DESPITE 7% LOWER REVENUE
$0.97
$1.28
2018 2019
Q1 – Q3 YTD EPSfrom continuing operations
$3,394
$3,149
2018 2019
Q1 – Q3 YTD REVENUEfrom continuing operations
+32%(7)%

4
Q1 Q2 Q3 Q4 E
Year-Over-Year Volume GrowthFrom Continuing Operations
WE DELIVERED THIRD QUARTER DILUTED EPS WITHIN OUR GUIDANCE RANGE AND YEAR OVER YEAR VOLUMES IMPROVED SEQUENTIALLY
• Delivered Q3 adjusted EPS of $0.55 and revenue of $1.06b, both within our guidance range.
• Service levels consistently above target. Commercial Excellence organization in early innings, but demonstrating solid promise.
• Volume declines meaningfully improved on a sequential basis. July and August volumes tracked close to expectations, however we saw a material reduction in orders in September.
• Adjusted EBIT margin improvement fell short of our internal expectations, offset by SG&A efficiencies and tax planning benefits.
1 Percentage change in pounds shipped for continuing operations, excluding SKU rationalization and divestitures
Q2 17 Q3 17 Q4 17 Q1 18 Q2 18 Q3 18 Q4 18 Q1 19 Q2 19 Q3 19
Service Remains at Highest Levels in >2 Years
Fill Rates % Target 98.1%

5
Q3 2019 RESULTS SCORECARD
Q3 Guidance communicated in August
Adjusted 1 Results Result
Net Sales $ 1.04 - $1.14 b $1.06 b ✓
Net Interest Expense and Other $ 25 - $27 m $28 m ✗
Tax Rate 23 - 24 % 11.1% ✓
Diluted EPS $ 0.52 - $0.62 $0.55 ✓
1 A reconciliation of Adjusted Net Interest Expense and Adjusted Diluted EPS to the most comparable GAAP measure is provided in the Appendix.

6
($ in millions) Change B/ (W)
Q3 2019 Q3 2018 $ %
Net Sales $ 1,057.3 $ 1,117.9 $ (60.6) (5.4) %
Division Direct Operating Income (DOI) 129.4 146.5 (17.1) (11.7) %
Division DOI Margin 12.2 % 13.1 % NA (0.9) pts
Items Affecting Comparability 1 (118.1) (27.0) (91.1) (337.4)
Corporate Unallocated (66.9) (80.5) 13.6 16.9
Total Corporate Unallocated Expense (185.0) (107.5) (77.5) (72.1) %
Net (Loss) / Income from Continuing Operations $ (61.0) $ 12.2 $ (73.2) (600.0) %
Adjusted EBIT from Continuing Operations 1 61.9 64.6 (2.7) (4.2)
Adjusted EBIT Margin from Continuing Operations 5.9 % 5.8 % NA 0.1 pts
Adjusted EBITDAS from Continuing Operations 1 118.0 121.2 (3.2) (2.6)
Adjusted EBITDAS Margin from Continuing Operations 11.2 % 10.8 % NA 0.4 pts
GAAP Diluted EPS from Continuing Operations $ (1.08) $ 0.22 $ (1.30) (590.9) %
Adjusted Diluted EPS from Continuing Operations $ 0.55 $ 0.57 $ (0.02) (3.5) %
Q3 2019 FINANCIAL PERFORMANCE FROM CONTINUING OPERATIONS
1 Refer to the Appendix for a description of items affecting comparability and a reconciliation of adjusted EBIT from continuing operations, adjusted EBITDAS from continuing operations, adjusted net income from continuing operations and adjusted diluted EPS from continuing operations to the most comparable GAAP measure

7
Q3 ORGANIC VOLUME GROWTH (4.7)% VS PRIOR YEAR, COMPARED TO (9.6)% IN THE FIRST HALF
Baked
Goods
Vol / Mix (excl. SKU Rationalization) (5.7) % 1.7 % (6.9) % (4.7) %
Pricing 1.5 (2.3) 0.5 0.3
Organic Net Sales Growth (4.2) (0.6) (6.4) (4.4)
Organic Growth in Pounds (4.7)
Currency (0.1) - (0.1) (0.1)
SKU Rationalization (2.4) (0.2) (0.1) (0.9)
Total (6.7) % (0.8) % (6.6) % (5.4) %
THSBeverages
Meal
Solutions
Percentage Change in Q3 Net Sales vs Prior Year
8
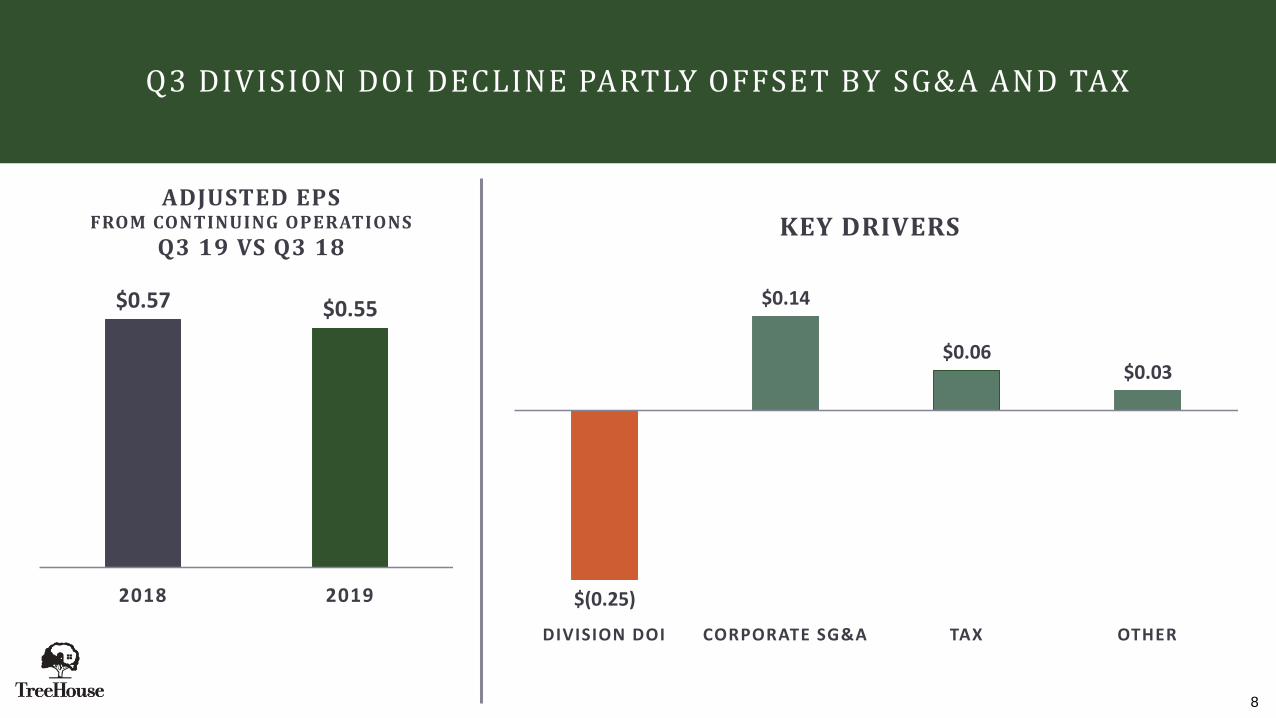
$(0.25)
$0.14
$0.06 $0.03
DIVISION DOI CORPORATE SG&A TAX OTHER
KEY DRIVERS
$0.57 $0.55
2018 2019
ADJUSTED EPS FROM CONTINUING OPERATIONS
Q3 19 VS Q3 18
Q3 DIVISION DOI DECLINE PARTLY OFFSET BY SG&A AND TAX

9
DIVISION DOI DOWN $17M DRIVEN BY VOLUME/MIX AND OPERATIONAL HEADWINDS, PARTIALLY OFFSET BY PRICING AND SG&A
(in
$ m
illio
ns)
1 Pricing to recover inflation, net of commodities, freight & warehousing
Q3 18 VOL/MIX (incl absorption)
PNOC 1 OPERATIONS SG&A Q3 19

10
Q3 19 DIVISION DOI VS PRIOR YEAR
Vol / Mix(incl absorption) PNOC 1 Operations SG&A
Total (in $ mil)
Baked Goods - + = = $(1.4)
Beverages + = --- = (5.8)
Meal Solutions ---- +++ ---- + (9.9)
1 Pricing to recover inflation, net of commodities, freight & warehousing

11
Q3 IS OUR SEASONAL PEAK FOR INVENTORY;FOCUS ON DEBT REDUCTION CONTINUES
Net Debt 1
($ in mil)Working Capital
($ in mil)
1 Net debt reflects total outstanding debt excluding deferred financing costs less cash and cash equivalents. See calculation of net debt in the Appendix.
$2,961
$2,142
Q1 2016 Q3 2019
Q4 18 Q3 19
B/(W)
vs Q4 18
Accounts Receivable (351)$ (305)$ 46$
Inventory 2 (616) (703) (87)
Accounts Payable 578 530 (48)
Working Capital (389)$ (478)$ (89)$
$819
2 Inventory balances reflect the change in LIFO treatment, and excludes discontinued operations for all periods presented.

12
UPDATING FY 2019 GUIDANCE FROM CONTINUING OPERATIONS
Revised FY19 Guidance from
Continuing Operations
Net Sales $4.26 - $4.36 b
Net Interest Expense $ 103 - $ 105 m
Tax Rate ~ 20%
Adjusted Diluted EPS $ 2.30 - $2.50
Capital Expenditures ~ $165 m
Free Cash Flow 1 $ 160 - $190 m
1 Free cash flow includes both continuing and discontinued operations

13
Q4 2019 GUIDANCE FROM CONTINUING OPERATIONS
Pivot to slight volume growth driven by Beverages
SG&A savings
Favorable tax rate
Manufacturing variances
Continued lap of volume loss primarily in Baked Goods
Q4 19 E
Net Sales $ 1.11 - $1.21 b
Net Interest Expense $ 24 - $26 m
Tax Rate 20 – 22 %
Diluted EPS from continuing operations
$ 1.03 - $ 1.23
ADJUSTED EPSQ4 18 VS Q4 19E
Q4 18 Q4 19E
$ 1.03 - $ 1.23
Q4 19 DRIVERS
$ 1.00

14
Q3 YTD UP 32%; ANTICIPATED GROWTH OF 13% IN Q4FULL YEAR EXPECTED TO BE UP 22 % AT THE MIDPOINT
$0.97
$1.28
2018 2019
Q1 – Q3 YTD Adjusted EPSUp 32%
$1.00
$1.13
2018 2019 MIDPT
Q4 Adjusted EPSExpected YoY growth = 13%
$1.97
$2.40
2018 2019 MIDPT
Full Year Adjusted EPSExpected YoY growth = 22%

15
WE CONTINUE TO DRIVE THE ORGANIZATION TOWARD SEQUENTIAL VOLUME GROWTH IMPROVEMENT IN Q419
Q1 Q2 Q3 Q4 E FY 19 E @ midpoint
YEAR-OVER-YEAR VOLUME GROWTH FROM CONTINUING OPERATIONS1
1 Percentage change in pounds shipped for continuing operations, excluding SKU rationalization and divestitures

16
2019 FREE CASH FLOW OUTLOOK IS LARGELY UNCHANGED
Working capital
initiatives
Capex~$165m
Free cash flow$160 - $190m
Snacks & RTE cereal proceeds~$200m
Cash restructuring
~$150m
Cash generated from operations
Cash available to repay debt
• Our priority for cash is debt repayment
• We continue to expect to finish the year with our bank covenant-defined leverage ratio between ~3.6 – 3.8x
• Net debt expected to be down by ~$400m
1 Free cash flow includes both continuing and discontinued operations

17
REAFFIRMING STRATEGIC GROWTH GOALS BEYOND 2019
R E V E N U EG R O W T H
A D J U S T E D E P S G R O W T H
C A S H G E N E R AT I N G C A PA B I L I T Y
1-2% organic
>10% ~$300 million

18
KEY TAKEAWAYS
Significant progress around our
strategic pillars:
Operational Excellence
Commercial Excellence
Portfolio Optimization
People & Talent
Delivered Q3 19 EPS of $0.55 and
revenue of $1.06b,
within the range of guidance
Service levels consistently
above target
Volumes improved sequentially;
Anticipate further improvement in Q4
Revised FY19 EPS guidance from
continuing operations to $2.30 - $2.50
and revenue guidance of $4.26 - $4.36b
FY19 Adjusted EPS
from continuing operations
expected to be up 22%; includes Q4
growth of 13% at the midpoint

APPENDIX

20
COMPARISON OF ADJUSTED INFORMATION TO GAAP INFORMATION
The Company has included in this release measures of financial performance that are not defined by GAAP (“Non-GAAP”). A Non-GAAP financial measure is a numerical measure of financial performance that excludes or includes amounts so as to be different than the most directly comparable measure calculated and presented in accordance with GAAP in the Company’s Condensed Consolidated Balance Sheets, Condensed Consolidated Statements of Operations, Condensed Consolidated Statements of Comprehensive Income, and the Condensed Consolidated Statements of Cash Flows. The Company believes these measures provide useful information to the users of the financial statements as we also have included these measures in other communications and publications.
For each of these Non-GAAP financial measures, the Company provides a reconciliation between the most directly comparable GAAP measure and the Non-GAAP measure and, an explanation of why management believes the Non-GAAP measure provides useful information to financial statement users, and any additional purposes for which management uses the Non-GAAP measure. This Non-GAAP financial information is provided as additional information for the financial statement users and is not in accordance with, or an alternative to, GAAP. These Non-GAAP measures may be different from similar measures used by other companies. Given the inherent uncertainty regarding adjusted items in any future period, a reconciliation of forward-looking financial measures to the most directly comparable GAAP measure is not feasible.
Organic Net SalesOrganic Net Sales is defined as net sales excluding the impacts of SKU rationalization, divestitures, and foreign currency. This information is provided in order to allow investors to make meaningful comparisons of the Company's sales between periods and to view the Company's business from the same perspective as Company management.
Adjusted SG&A ExpenseAdjusted SG&A Expense is defined as selling and distribution, and general and administrative expense adjusted for items that, in management's judgment, significantly affect the assessment of selling, general and administrative expense between periods and to view the Company's business from the same perspective as Company management.
Adjusted Earnings Per Diluted Share from Continuing Operations, Adjusting for Certain Items Affecting Comparability Adjusted earnings per diluted share from continuing operations (“Adjusted Diluted EPS”) reflects adjustments to GAAP (loss) income per diluted share from continuing operations to identify items that, in management’s judgment, significantly affect the assessment of earnings results between periods. This information is provided in order to allow investors to make meaningful comparisons of the Company’s earnings performance between periods and to view the Company’s business from the same perspective as Company management. This measure is also used as a component of the Board of Director’s measurement of the Company’s performance for incentive compensation purposes. As the Company cannot predict the timing and amount of charges that include, but are not limited to, items such as acquisition, integration, divestiture, and related costs, mark-to-market adjustments on derivative contracts, and foreign currency exchange impact on the re-measurement of intercompany notes, management does not consider these costs when evaluating the Company’s performance, when making decisions regarding the allocation of resources, in determining incentive compensation, or in determining earnings estimates. The reconciliation of the GAAP measure of diluted (loss) income per share from continuing operations as presented in the Condensed Consolidated Statements of Operations, excluding certain items affecting comparability, to adjusted diluted EPS from continuing operations is presented below.

21
COMPARISON OF ADJUSTED INFORMATION TO GAAP INFORMATION
Adjusted Net Income from Continuing Operations, Adjusted EBIT from Continuing Operations, and Adjusted EBITDAS from Continuing Operations, Adjusted net income margin from Continuing Operations, Adjusted EBIT margin from Continuing Operations and Adjusted EBITDAS margin from Continuing Operations, Adjusting for Certain Items Affecting Comparability Adjusted net income from continuing operations represents GAAP net (loss) income from continuing operations as reported in the Condensed Consolidated Statements of Operations adjusted for items that, in management’s judgment, significantly affect the assessment of earnings results between periods as outlined in the adjusted diluted EPS section from continuing operations above. This information is provided in order to allow investors to make meaningful comparisons of the Company’s earnings performance between periods and to view the Company’s business from the same perspective as Company management. This measure is also used as a component of the Board of Director’s measurement of the Company’s performance for incentive compensation purposes and is the basis of calculating the adjusted diluted EPS from continuing operations metric outlined above. Adjusted EBIT from continuing operations represents adjusted net income from continuing operations before interest expense, interest income, and income tax expense. Adjusted EBITDAS from continuing operations represents adjusted EBIT from continuing operations before depreciation expense, amortization expense, and non-cash stock-based compensation expense. Adjusted EBIT from continuing operations and adjusted EBITDAS from continuing operations are performance measures commonly used by management to assess operating performance, and the Company believes they are commonly reported and widely used by investors and other interested parties as a measure of a company’s operating performance between periods. Adjusted net income margin from continuing operations, adjusted EBIT margin from continuing operations and adjusted EBITDAS margin from continuing operations are calculated as the respective metric defined above as a percentage of net sales as reported in the Condensed Consolidated Statements of Operations adjusted for items that, in management’s judgment, significantly affect the assessment of earnings results between periods as outlined in the adjusted diluted EPS from continuing operations section above. A full reconciliation between the relevant GAAP measure of reported net (loss) income from continuing operations for the three and nine month periods ended September 30, 2019 and 2018 calculated according to GAAP, adjusted net income from continuing operations, adjusted EBIT from continuing operations, and adjusted EBITDAS from continuing operations is presented in the below tables.
Free Cash Flow and Net Debt In addition to measuring the Company’s cash flow generation and usage based upon the operating, investing, and financing classifications included in the Condensed Consolidated Statements of Cash Flows, we also measure free cash flow from continuing operations which represents net cash provided by operating activities from continuing operations less capital expenditures. The Company believes free cash flow is an important measure of operating performance because it provides management and investors a measure of cash generated from operations that is available for mandatory payment obligations and investment opportunities such as funding acquisitions, repaying debt, repurchasing outstanding senior debt, and repurchasing common stock. The Company uses a metric of Net Debt to measure our levered position at any specific point in time. Net Debt is defined as total outstanding debt excluding deferred financing fees, less cash and cash equivalents. The calculation of Net Debt is presented in the tables below.
22
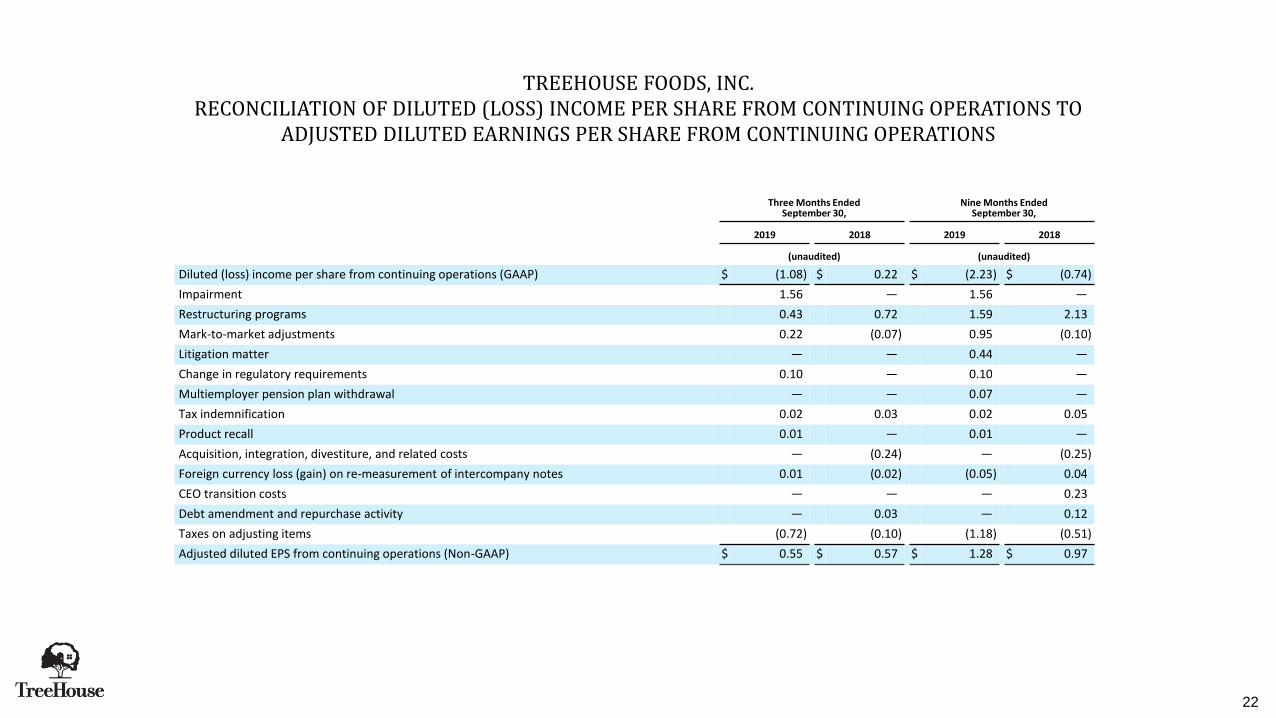
Three Months EndedSeptember 30,
Nine Months EndedSeptember 30,
2019 2018 2019 2018
(unaudited) (unaudited)
Diluted (loss) income per share from continuing operations (GAAP) $ (1.08) $ 0.22 $ (2.23) $ (0.74)
Impairment 1.56 — 1.56 —
Restructuring programs 0.43 0.72 1.59 2.13
Mark-to-market adjustments 0.22 (0.07) 0.95 (0.10)
Litigation matter — — 0.44 —
Change in regulatory requirements 0.10 — 0.10 —
Multiemployer pension plan withdrawal — — 0.07 —
Tax indemnification 0.02 0.03 0.02 0.05
Product recall 0.01 — 0.01 —
Acquisition, integration, divestiture, and related costs — (0.24) — (0.25)
Foreign currency loss (gain) on re-measurement of intercompany notes 0.01 (0.02) (0.05) 0.04
CEO transition costs — — — 0.23
Debt amendment and repurchase activity — 0.03 — 0.12
Taxes on adjusting items (0.72) (0.10) (1.18) (0.51)
Adjusted diluted EPS from continuing operations (Non-GAAP) $ 0.55 $ 0.57 $ 1.28 $ 0.97
TREEHOUSE FOODS, INC. RECONCILIATION OF DILUTED (LOSS) INCOME PER SHARE FROM CONTINUING OPERATIONS TO
ADJUSTED DILUTED EARNINGS PER SHARE FROM CONTINUING OPERATIONS

23
TREEHOUSE FOODS, INC.RECONCILIATION OF NET (LOSS) INCOME FROM CONTINUING OPERATIONS TO ADJUSTED NET INCOME, ADJUSTED EBIT
AND ADJUSTED EBITDAS FROM CONTINUING OPERATIONSThree Months Ended
September 30,Nine Months Ended
September 30,
2019 2018 2019 2018
(unaudited, in millions)
Net (loss) income from continuing operations (GAAP) $ (61.0) $ 12.2 $ (125.6) $ (41.8)
Impairment (1) 88.0 — 88.0 —
Restructuring programs (2) 24.3 40.7 89.9 120.1
Mark-to-market adjustments (3) 12.4 (3.8) 53.6 (5.8)
Litigation matter (4) — — 25.0 —
Change in regulatory requirements (5) 5.5 — 5.5 —
Multiemployer pension plan withdrawal (6) — — 4.1 —
Tax indemnification (7) 1.4 1.7 1.8 2.9
Product recall (8) 0.3 — 0.3 —
Acquisition, integration, divestiture, and related costs (9) — (13.7) 0.2 (14.1)
Foreign currency loss (gain) on re-measurement of intercompany notes (10) 0.4 (1.4) (2.6) 1.9
CEO transition costs (11) — — — 13.0
Debt amendment and repurchase activity (12) — 1.8 — 6.8
Less: Taxes on adjusting items (40.3) (5.3) (67.6) (27.9)
Adjusted net income from continuing operations (Non-GAAP) 31.0 32.2 72.6 55.1
Interest expense 27.3 25.4 78.5 80.1
Interest income (0.3) (1.3) (4.6) (3.8)
Income tax (benefit) expense (36.4) 3.0 (50.1) (12.9)
Add: Taxes on adjusting items 40.3 5.3 67.6 27.9
Adjusted EBIT from continuing operations (Non-GAAP) 61.9 64.6 164.0 146.4
Depreciation and amortization (13) 50.7 52.1 154.0 156.5
Stock-based compensation expense (14) 5.4 4.5 17.0 16.8
Adjusted EBITDAS from continuing operations (Non-GAAP) $ 118.0 $ 121.2 $ 335.0 $ 319.7
Adjusted net income margin from continuing operations 2.9% 2.9% 2.3% 1.6%
Adjusted EBIT margin from continuing operations 5.9% 5.8% 5.2% 4.3%
Adjusted EBITDAS margin from continuing operations 11.2% 10.8% 10.6% 9.4%

24
TREEHOUSE FOODS, INC. FOOTNOTES FOR RECONCILIATION OF NET (LOSS) INCOME FROM CONTINUING OPERATIONS TO ADJUSTED NET
INCOME, ADJUSTED EBIT AND ADJUSTED EBITDAS FROM CONTINUING OPERATIONS
Location in CondensedThree Months Ended
September 30,Nine Months Ended
September 30,
Consolidated Statements of Operations 2019 2018 2019 2018
(unaudited, in millions)
(1) Impairment Asset impairment $ 88.0 $ — $ 88.0 $ —
(2) Restructuring programs Other operating expense, net 23.7 35.3 84.4 108.2
Cost of sales 0.6 4.4 3.8 8.6
General and administrative — 1.0 1.7 3.3
(3) Mark-to-market adjustments Other expense (income), net 12.4 (3.8) 53.6 (5.8)
(4) Litigation matter General and administrative — — 25.0 —
(5) Change in regulatory requirements Cost of sales 4.0 — 4.0 —
Selling and distribution 1.2 — 1.2 —
General and administrative 0.3 — 0.3 —
(6) Multiemployer pension plan withdrawal Cost of sales — — 4.1 —
(7) Tax indemnification Other expense (income), net 1.4 1.7 1.8 2.9
(8) Product recall General and administrative 0.3 — 0.3 —
(9) Acquisition, integration, divestiture, and related costs General and administrative — 0.2 0.2 (0.5)
Other operating expense, net — (13.9) — (13.6)
(10) Foreign currency loss (gain) on re-measurement of intercompany notes
Loss (gain) on foreign currency exchange 0.4 (1.4) (2.6) 1.9
(11) CEO transition costs General and administrative — — — 13.0
(12) Debt amendment and repurchase activity General and administrative — — — 0.2
Other expense (income), net — 1.1 — 4.2
Interest expense — 0.7 — 2.4
(13) Depreciation included as an adjusting item Cost of sales 0.1 4.6 1.7 8.1
General and administrative — 1.0 1.6 3.3
(14) Stock-based compensation expense included as an adjusting item
General and administrative 0.1 0.1 0.5 10.2

25
TREEHOUSE FOODS, INC. ITEMS IMPACTING COMPARABILITY INCLUDED IN CORPORATE UNALLOCATED EXPENSE
Location in CondensedThree Months Ended
September 30,Nine Months Ended
September 30,
Consolidated Statements of Operations 2019 2018 2019 2018
(unaudited, in millions)
Impairment Asset impairment $ 88.0 $ — $ 88.0 $ —
Restructuring programs Other operating expense, net 23.7 35.3 84.4 108.2
Cost of sales 0.6 4.4 3.8 8.6
General and administrative — 1.0 1.7 3.3
Litigation matter General and administrative — — 25.0 —
Change in regulatory requirements Cost of sales 4.0 — 4.0 —
Selling and distribution 1.2 — 1.2 —
General and administrative 0.3 — 0.3 —
Multiemployer pension plan withdrawal Cost of sales — — 4.1 —
Product recall General and administrative 0.3 — 0.3 —
Acquisition, integration, divestiture, and related costs General and administrative — 0.2 0.2 (0.5)
Other operating expense, net — (13.9) — (13.6)
CEO transition costs General and administrative — — — 13.0
Debt amendment and repurchase activity General and administrative — — — 0.2
Total $ 118.1 $ 27.0 $ 213.0 $ 119.2

26
TREEHOUSE FOODS, INC. RECONCILIATION OF SEGMENT AND UNALLOCATED CORPORATE COSTS TO OPERATING LOSS / INCOME
Three Months EndedSeptember 30,
Nine Months EndedSeptember 30,
2019 2018 2019 2018
(unaudited, in millions) (unaudited, in millions)
Net sales to external customers:
Baked Goods $ 351.8 $ 377.1 $ 1,058.7 $ 1,126.2
Beverages 234.4 236.3 684.4 721.8
Meal Solutions 471.1 504.5 1,406.3 1,546.3
Total $ 1,057.3 $ 1,117.9 $ 3,149.4 $ 3,394.3
Direct operating income:
Baked Goods $ 30.7 $ 32.1 $ 107.5 $ 89.9
Beverages 38.3 44.1 122.8 129.3
Meal Solutions 60.4 70.3 163.2 185.9
Total 129.4 146.5 393.5 405.1
Unallocated expenses:
Unallocated selling, general, and administrative expenses (52.5) (58.8) (199.1) (210.1)
Unallocated cost of sales (3.3) (7.5) (13.8) (9.8)
Unallocated corporate expense and other (129.2) (41.2) (228.6) (154.8)
Total (185.0) (107.5) (441.5) (374.7)
Operating (loss) income $ (55.6) $ 39.0 $ (48.0) $ 30.4

27
TREEHOUSE FOODS, INC. ORGANIC NET SALES RECONCILIATION
Three Months Ended September 30, Nine Months Ended September 30,
Dollars Percent
Percentage Change in
Pounds Dollars Percent
Percentage Change in
Pounds
(In millions) (In millions)
2018 Net sales $ 1,117.9 $ 3,394.3
Volume/mix excluding SKU rationalization (52.2) (4.7)% (4.7)% (209.0) (6.2)% (8.0)%
Pricing 2.8 0.3 — 25.6 0.8 —
2019 Organic Net Sales $ 1,068.5 (4.4)% (4.7)% $ 3,210.9 (5.4)% (8.0)%
SKU rationalization (10.3) (0.9) (1.0) (52.2) (1.6) (1.6)
Divestiture — — — (4.5) (0.1) (0.1)
Foreign currency (0.9) (0.1) — (4.8) (0.1) —
2019 Net sales $ 1,057.3 (5.4)% (5.7)% $ 3,149.4 (7.2)%0
(9.7)%

28
Three Months Ended September 30, Nine Months Ended September 30,
2019 2018 2019 2018
(Unaudited, in millions) (Unaudited, in millions)
Selling and distribution $ 61.2 $ 73.4 $ 191.2 $ 246.8
General and administrative 51.5 60.4 199.9 208.7
Total Selling, general and administrative expense 112.7 133.8 391.1 455.5
Restructuring programs (2) — 1.0 1.7 3.3
Litigation matter (4) — — 25.0 —
Change in regulatory requirements (5) 1.5 — 1.5 —
Product recall (8) 0.3 — 0.3 —
Acquisition, integration, divestiture, and related costs (9) — 0.2 0.2 (0.5)
CEO transition costs (11) — — — 13.0
Debt amendment and repurchase activity (12) — — — 0.2
Adjusted Selling, general and administrative expense $ 110.9 $ 132.6 $ 362.4 $ 439.5
Percentage of Net Sales 10.5% 11.9% 11.5% 12.9%
TREEHOUSE FOODS, INC.RECONCILIATION OF SG&A EXPENSE TO ADJUSTED SG&A EXPENSE

29
TREEHOUSE FOODS, INC. ADJUSTED NET INTEREST EXPENSE AND OTHER RECONCILIATION
Location in CondensedThree Months Ended
September 30,Nine Months Ended
September 30,
Consolidated Statements of Operations 2019 2018 2019 2018
(unaudited, in millions)
Interest expense $ 27.3 $ 26.1 $ 78.5 $ 82.5
Loss (gain) on foreign currency exchange 0.4 0.6 (1.3) 5.0
Other expense (income), net 14.1 (2.9) 50.5 (2.4)
Total other expense 41.8 23.8 127.7 85.1
Adjusting items:
Mark-to-market adjustments Other expense (income), net 12.4 (3.8) 53.6 (5.8)
Tax indemnification Other expense (income), net 1.4 1.7 1.8 2.9
Foreign currency loss (gain) on re-measurement of intercompany notes Loss (gain) on foreign currency exchange 0.4 (1.4) (2.6) 1.9
Debt amendment and repurchase activity Other expense (income), net — 1.1 — 4.2
Interest expense — 0.7 — 2.4
Adjusted net interest expense and other $ 27.6 $ 25.5 $ 74.9 $ 79.5
30
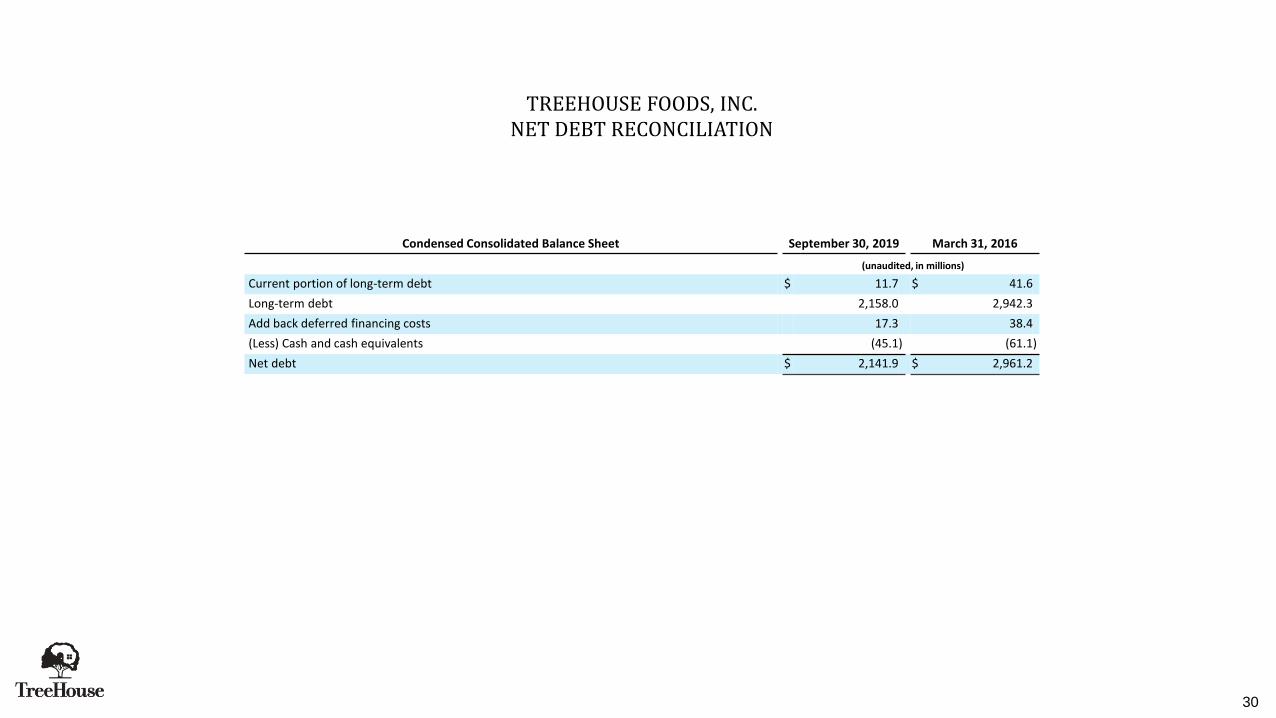
TREEHOUSE FOODS, INC. NET DEBT RECONCILIATION
Condensed Consolidated Balance Sheet September 30, 2019 March 31, 2016
(unaudited, in millions)
Current portion of long-term debt $ 11.7 $ 41.6
Long-term debt 2,158.0 2,942.3
Add back deferred financing costs 17.3 38.4
(Less) Cash and cash equivalents (45.1) (61.1)
Net debt $ 2,141.9 $ 2,961.2


