37
November 4, 2021 Q3 2021 UPDATE NYSE: EVA
N o v e m b e r 4 , 2 0 2 1
Q3 2021 UPDATENYSE: EVA

Q 3 2 0 2 1 U P D A T E
On October 15, 2021, Enviva announced the acquisition of its former sponsor, Enviva Holdings, LP (“Holdings”), and the elimination of incentive
distributions rights (the “Simplification Transaction”). Enviva also announced plans to convert from a master limited partnership to a corporation
under the name of Enviva Inc. by the end of the year (the “Conversion”).
This communication does not constitute a solicitation of any vote or approval.
In connection with the Conversion, Enviva filed a proxy statement with the U.S. Securities and Exchange Commission (the “SEC”). Enviva also
plans to file other documents with the SEC regarding the Conversion. After the proxy statement has been cleared by the SEC, a definitive proxy
statement will be mailed to the unitholders of Enviva. UNITHOLDERS OF ENVIVA ARE URGED TO READ THE PROXY STATEMENT (INCLUDING
ALL AMENDMENTS AND SUPPLEMENTS THERETO) AND OTHER DOCUMENTS RELATING TO THE CONVERSION THAT WILL BE FILED
WITH THE SEC CAREFULLY AND IN THEIR ENTIRETY WHEN THEY BECOME AVAILABLE BECAUSE THEY WILL CONTAIN IMPORTANT
INFORMATION ABOUT THE CONVERSION. Unitholders will be able to obtain free copies of the proxy statement and other documents containing
important information once such documents are filed with the SEC, through the website maintained by the SEC at http://www.sec.gov.
Participants in the Solicitation
Enviva and its general partner’s directors and executive officers may be deemed to be participants in the solicitation of proxies from the unitholders
of Enviva in connection with the proposed transaction. Information about such directors and executive officers is set forth in Enviva’s Annual Report
on Form 10-K filed with the SEC on February 25, 2021. Other information regarding the participants in the proxy solicitation and a description of
their direct and indirect interests, by security holdings or otherwise, will be contained in the proxy statement and other relevant materials to be filed
with the SEC when they become available.
IMPORTANT INFORMATION FOR UNITHOLDERS
2
Q 3 2 0 2 1 U P D A T E
FORWARD-LOOKING STATEMENTS
Cautionary Note Concerning Forward-Looking StatementsThe information included herein and in any oral statements made in connection herewith include “forward-looking statements” within the meaning of Section 27A of the Securities Act of 1933, as amended,
and Section 21E of the Securities Exchange Act of 1934, as amended. All statements, other than statements of present or historical fact included herein, regarding the Conversion, Enviva’s ability to
consummate the Conversion, the benefits of the Conversion and Enviva’s future financial performance following the Conversion, as well as Enviva’s strategy, future operations, financial position, estimated
revenues, and losses, projected costs, prospects, plans, and objectives of management are forward-looking statements. When used herein, including any oral statements made in connection herewith, the
words “could,” “should,” “will,” “may,” “believe,” “anticipate,” “intend,” “estimate,” “expect,” “project,” the negative of such terms, and other similar expressions are intended to identify forward-looking
statements, although not all forward-looking statements contain such identifying words. These forward-looking statements are based on management’s current expectations and assumptions about future
events and are based on currently available information as to the outcome and timing of future events. Except as otherwise required by applicable law, Enviva disclaims any duty to revise or update any
forward-looking statements, all of which are expressly qualified by the statements in this section, to reflect events or circumstances after the date hereof. Enviva cautions you that these forward-looking
statements are subject to risks and uncertainties, most of which are difficult to predict and many of which are beyond the control of Enviva. These risks include, but are not limited to: (i) the volume and
quality of products that we are able to produce or source and sell, which could be adversely affected by, among other things, operating or technical difficulties at our wood pellet production plants or deep-
water marine terminals; (ii) the prices at which we are able to sell our products; (iii) our ability to successfully negotiate, complete, and integrate acquisitions, including the associated contracts, or to realize
the anticipated benefits of such acquisitions; (iv) failure of our customers, vendors, and shipping partners to pay or perform their contractual obligations to us; (v) our inability to successfully execute our
project development, expansion, and construction activities on time and within budget; (vi) the creditworthiness of our contract counterparties; (vii) the amount of low-cost wood fiber that we are able to
procure and process, which could be adversely affected by, among other things, disruptions in supply or operating or financial difficulties suffered by our suppliers; (viii) changes in the price and availability
of natural gas, coal, or other sources of energy; (ix) changes in prevailing economic conditions; (x) unanticipated ground, grade or water conditions; (xi) inclement or hazardous environmental conditions,
including extreme precipitation, temperatures, and flooding; (xii) fires, explosions, or other accidents; (xiii) changes in domestic and foreign laws and regulations (or the interpretation thereof) related to
renewable or low-carbon energy, the forestry products industry, the international shipping industry, or power, heat, or combined heat and power generators; (xiv) changes in the regulatory treatment of
biomass in core and emerging markets; (xv) our inability to acquire or maintain necessary permits or rights for our production, transportation, or terminaling operations; (xvi) changes in the price and
availability of transportation; (xvii) changes in foreign currency exchange or interest rates, and the failure of our hedging arrangements to effectively reduce our exposure to the risks related thereto; (xviii)
risks related to our indebtedness; (xix) our failure to maintain effective quality control systems at our wood pellet production plants and deep-water marine terminals, which could lead to the rejection of our
products by our customers; (xx) changes in the quality specifications for our products that are required by our customers; (xxi) labor disputes, unionization or similar collective actions; (xxii) our inability to
hire, train or retain qualified personnel to manage and operate our business and newly acquired assets; (xxiii) the Conversion may not occur, and even if it were to be completed, we may fail to realize the
anticipated benefits; (xxiv) the possibility of cyber and malware attacks; (xxv) our inability to borrow funds and access capital markets; and (xxvi) viral contagions or pandemic diseases, such as COVID-19.
Should one or more of the risks or uncertainties described herein and in any oral statements made in connection therewith occur, or should underlying assumptions prove incorrect, actual results and plans
could different materially from those expressed in any forward-looking statements. Additional information concerning these and other factors that may impact Enviva’s expectations and projections can be
found in Enviva’s periodic filings with the SEC. Enviva’s SEC filings are available publicly on the SEC’s website at www.sec.gov.
Industry and market dataThis presentation has been prepared by Enviva and includes market data and other statistical information from third-party sources, including independent industry publications, government publications or
other published independent sources. Although Enviva believes these third-party sources are reliable as of their respective dates, Enviva has not independently verified the accuracy or completeness of
this information. Some data is also based on Enviva’s good faith estimates, which are derived from its review of internal sources as well as the third-party sources described above.
3

Q 3 2 0 2 1 U P D A T E
A B O U T E N V I VA . . . . . . . . . . . . . . . . . . . . . . . . . . . . . . . . . . . . . . . . . . . . . . . . . . . . . . .
Q 3 2 0 2 1 H I G H L I G H T S … . . . . . . . . . . . . . . . . . . . . . . . . . . . . . . . . . . . . . . . . . . . .
A P P E N D I X . . . . . . . . . . . . . . . . . . . . . . . . . . . . . . . . . . . . . . . . . . . . . . . . . . . . . . . . . . . . . .
N O N - G A A P F I N A N C I A L M E A S U R E S . . . . . . . . . . . . . . . . . . . . . . . . . . . .
S U P P L E M E N TA L I N F O R M AT I O N . . . . . . . . . . . . . . . . . . . . . . . . . . . . . . . . .
4
INDEX
5
7
1 3
1 9
2 8

Q 3 2 0 2 1 U P D A T E
ENVIVA
HIGH GROWTH AND DURABLE LONG -TERM CASH FLOWS
See Supplemental Information for footnotes5
Prioritizing conservative leverage and transitioning to self-funding while
preserving financial flexibility to optimize growth and return of capital
Building Fully Contracted
Plants at Expected ~5x EBITDA MultipleVisibility into doubling contracted production capacity
under existing sales and asset development pipelines4
Robust
Long-Term DemandGrowing, multi-billion-dollar new customer contract pipeline
driven by energy transition and industrial decarbonization underway
Attractive
Dividend YieldStable dividends growing from $3.30 in 2021 to $3.62 in 20225
World’s largest industrial-grade wood pellet producer
Committed to net zero by 20302
~6.2 Million MTPY of
Fully Contracted Production Capacity
1
Total weighted-average remaining term of 14.5 years
$21+ Billion
Take-Or-Pay Contracted Backlog
3
Conservative
Financial Framework

STRATEGICALLY LOCATED ASSETS 1
CHESAPEAKE CLUSTER (MTPY)
Southampton VA (SOU)4 760k
Ahoskie, NC (AHO) 410k
Northampton, NC (NOR)4 750k
Port of Chesapeake, VA (CHE)3 * 2.5M
Cottondale, FL (COT) 750k
Port of Panama City, FL (PAN)3* 780k
WILMINGTON CLUSTER (MTPY)
Hamlet, NC (HAM) 600k
Sampson, NC (SAM) 600k
Greenwood, SC (GRE)5 500k
Port of Wilmington, NC (WIL)3 * 3.0M
6
Amory, MS (AMO) 115k
Port of Mobile, AL (MOB)3 * 115k
PASCAGOULA CLUSTER (MTPY)
Lucedale, MS (LUC)6 750k
Port of Pascagoula, MS (PAS)*6 3.0M
*throughput capacity
See Supplemental Information for footnotes
SAVANNAH CLUSTER (MTPY)
Waycross, GA (WAY) 800k
Port of Savannah, GA (SAV)3 * 1.5M
PLANT SITES UNDER CONTROL / ASSESSMENT7TERMINALS UNDER CONSTRUCTION
PLANTS UNDER DEVELOPMENT / CONSTRUCTIONTERMINALS OWNED OR LEASED
PLANTS OWNED AND OPERATED
10WOOD PELLET PRODUCTION
PLANTS
~11MMTPY TOTAL
TERMINALING CAPACITY
Operations located in the U.S. southeast, where robust natural resource growth drives
sustainable, stable low-cost supply
6DEEP-WATER
MARINE TERMINALS
~6.2MMTPY TOTAL
PRODUCTION CAPACITY2
Q 3 2 0 2 1 U P D A T E 7
Q3 2021 HIGHLIGHTS
Q 3 2 0 2 1 U P D A T E
Q3 2021 HIGHLIGHTS 1
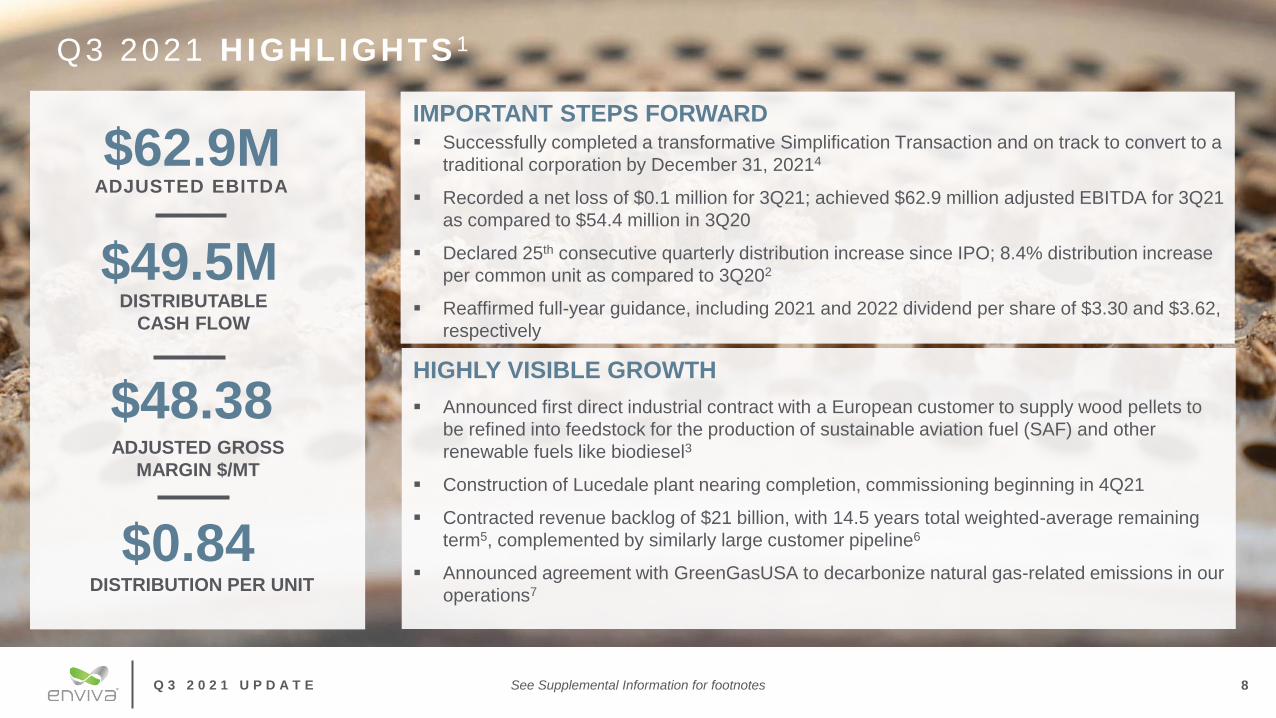
IMPORTANT STEPS FORWARD▪ Successfully completed a transformative Simplification Transaction and on track to convert to a
traditional corporation by December 31, 20214
▪ Recorded a net loss of $0.1 million for 3Q21; achieved $62.9 million adjusted EBITDA for 3Q21
as compared to $54.4 million in 3Q20
▪ Declared 25th consecutive quarterly distribution increase since IPO; 8.4% distribution increase
per common unit as compared to 3Q202
▪ Reaffirmed full-year guidance, including 2021 and 2022 dividend per share of $3.30 and $3.62,
respectively
$62.9MADJUSTED EBITDA
$49.5MDISTRIBUTABLE
CASH FLOW
$48.38ADJUSTED GROSS
MARGIN $/MT
$0.84DISTRIBUTION PER UNIT
See Supplemental Information for footnotes 8
▪ Announced first direct industrial contract with a European customer to supply wood pellets to
be refined into feedstock for the production of sustainable aviation fuel (SAF) and other
renewable fuels like biodiesel3
▪ Construction of Lucedale plant nearing completion, commissioning beginning in 4Q21
▪ Contracted revenue backlog of $21 billion, with 14.5 years total weighted-average remaining
term5, complemented by similarly large customer pipeline6
▪ Announced agreement with GreenGasUSA to decarbonize natural gas-related emissions in our
operations7
HIGHLY VISIBLE GROWTH
Q 3 2 0 2 1 U P D A T E 9
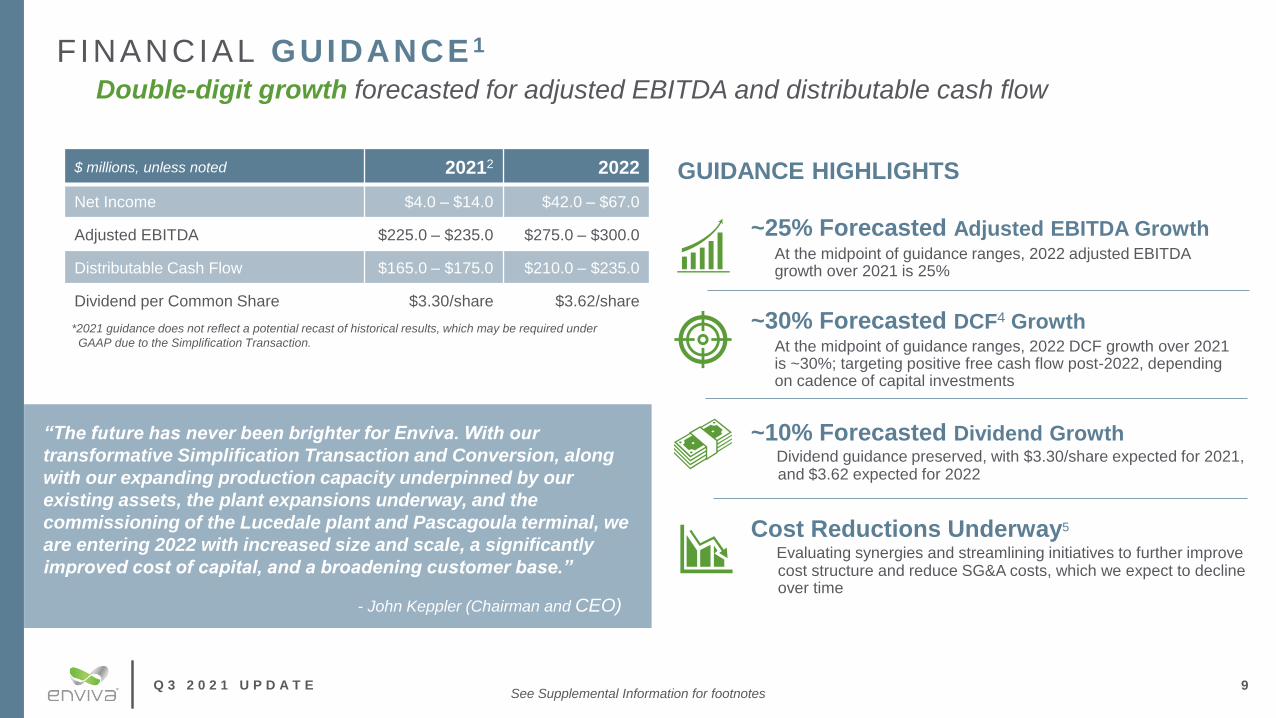
FINANCIAL GUIDANCE 1
Double-digit growth forecasted for adjusted EBITDA and distributable cash flow
$ millions, unless noted 20212 2022
Net Income $4.0 – $14.0 $42.0 – $67.0
Adjusted EBITDA $225.0 – $235.0 $275.0 – $300.0
Distributable Cash Flow $165.0 – $175.0 $210.0 – $235.0
Dividend per Common Share $3.30/share $3.62/share
“The future has never been brighter for Enviva. With our
transformative Simplification Transaction and Conversion, along
with our expanding production capacity underpinned by our
existing assets, the plant expansions underway, and the
commissioning of the Lucedale plant and Pascagoula terminal, we
are entering 2022 with increased size and scale, a significantly
improved cost of capital, and a broadening customer base.”
- John Keppler (Chairman and CEO)
GUIDANCE HIGHLIGHTS
See Supplemental Information for footnotes
~25% Forecasted Adjusted EBITDA Growth At the midpoint of guidance ranges, 2022 adjusted EBITDA growth over 2021 is 25%
~30% Forecasted DCF4 Growth At the midpoint of guidance ranges, 2022 DCF growth over 2021 is ~30%; targeting positive free cash flow post-2022, depending on cadence of capital investments
~10% Forecasted Dividend Growth Dividend guidance preserved, with $3.30/share expected for 2021, and $3.62 expected for 2022
Cost Reductions Underway5
Evaluating synergies and streamlining initiatives to further improvecost structure and reduce SG&A costs, which we expect to decline over time
*2021 guidance does not reflect a potential recast of historical results, which may be required under
GAAP due to the Simplification Transaction.
Q 3 2 0 2 1 U P D A T E 10
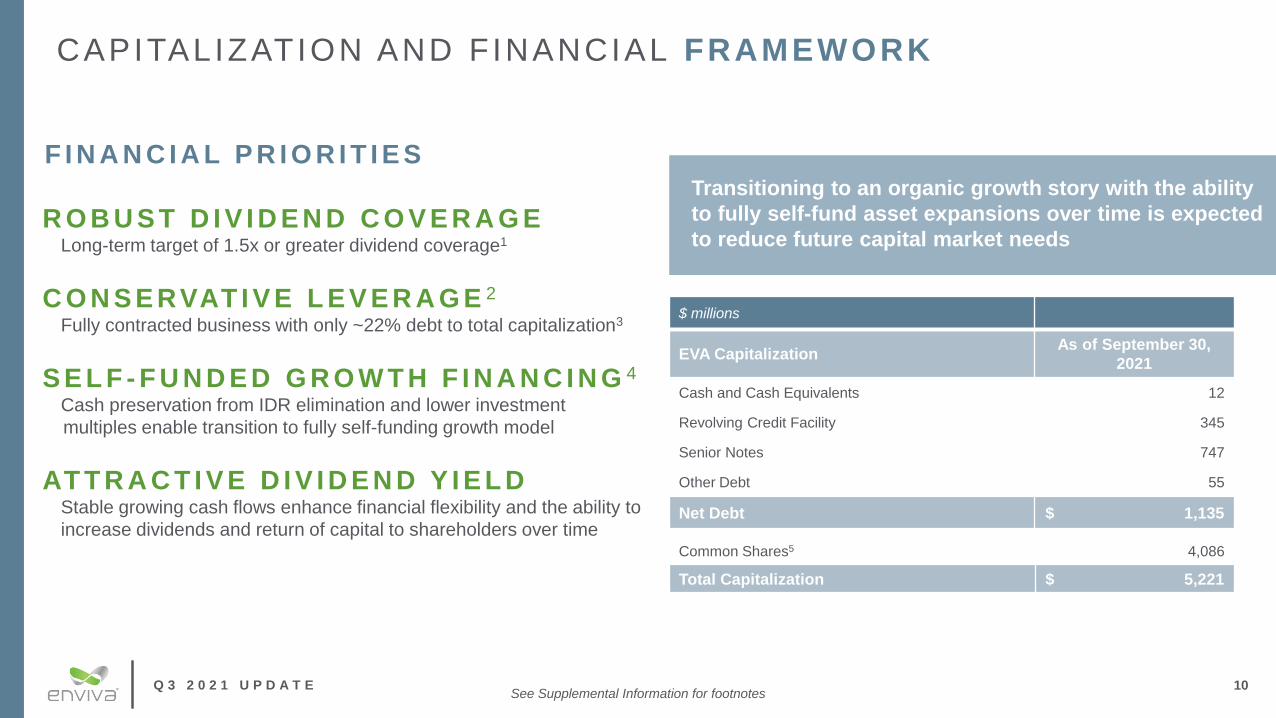
CAPITALIZATION AND FINANCIAL FRAMEWORK
F I N A N C I A L P R I O R I T I E S
Transitioning to an organic growth story with the ability
to fully self-fund asset expansions over time is expected
to reduce future capital market needsR O B U S T D I V I D E N D C O V E R A G E
Long-term target of 1.5x or greater dividend coverage1
C O N S E RVAT I V E L E V E R A G E 2
Fully contracted business with only ~22% debt to total capitalization3
S E L F - F U N D E D G R O W T H F I N A N C I N G 4
Cash preservation from IDR elimination and lower investment
multiples enable transition to fully self-funding growth model
AT T R A C T I V E D I V I D E N D Y I E L DStable growing cash flows enhance financial flexibility and the ability to
increase dividends and return of capital to shareholders over time
$ millions
EVA CapitalizationAs of September 30,
2021
Cash and Cash Equivalents 12
Revolving Credit Facility 345
Senior Notes 747
Other Debt 55
Net Debt $ 1,135
Common Shares5 4,086
Total Capitalization $ 5,221
See Supplemental Information for footnotes

Q 3 2 0 2 1 U P D A T E
NET ZERO PROMISE
SCOPE 1
EMISSIONS1
WE WILL REDUCE, ELIMINATE, OR OFFSET ALL OF OUR DIRECT EMISSIONS
▪ Recently announced contract with GreenGasUSA which is expected to reduce Scope 1 emissions by 75% on an annual basis by replacing natural gas with renewable natural gas
6%
35%
58%
COMMITTED TO NET ZERO IN
OUR OPERATIONS BY 2030
Our 2020
Emissions
SCOPE 2
EMISSIONS1
WE WILL SOURCE 50% RENEWABLE ENERGY BY 2025, AND 100% BY 2030
▪ Enviva joined the Renewable Energy Buyers Alliance, a business consortium committed to large-scale purchases of clean renewable energy, and we are evaluating solar installations at multiple plants
SCOPE 3
EMISSIONS1
WE WILL SEEK TO DRIVE INNOVATIVE GHG REDUCTIONS IN OUR SUPPLY CHAIN
▪ Enviva signed an agreement with Mitsui O.S.K Lines to develop and deploy an environmentally friendly bulk carrier to reduce the GHG emission in the transport of our sustainable wood pellets2
See Supplemental Information for footnotes11
Q 3 2 0 2 1 U P D A T E
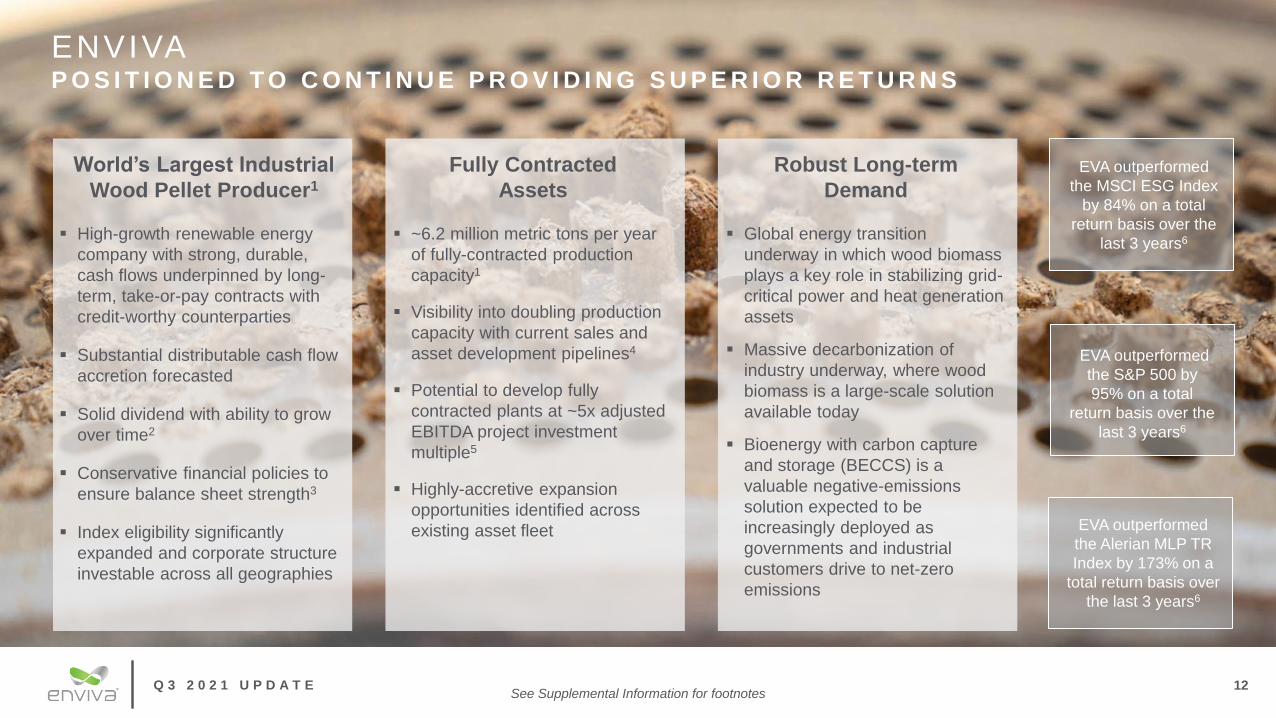
ENVIVA P O S I T I O N E D T O C O N T I N U E P R O V I D I N G S U P E R I O R R E T U R N S
12
EVA outperformed
the S&P 500 by
95% on a total
return basis over the
last 3 years6
EVA outperformed
the MSCI ESG Index
by 84% on a total
return basis over the
last 3 years6
EVA outperformed
the Alerian MLP TR
Index by 173% on a
total return basis over
the last 3 years6
World’s Largest Industrial
Wood Pellet Producer1
▪ High-growth renewable energy
company with strong, durable,
cash flows underpinned by long-
term, take-or-pay contracts with
credit-worthy counterparties
▪ Substantial distributable cash flow
accretion forecasted
▪ Solid dividend with ability to grow
over time2
▪ Conservative financial policies to
ensure balance sheet strength3
▪ Index eligibility significantly
expanded and corporate structure
investable across all geographies
See Supplemental Information for footnotes
Fully Contracted
Assets
▪ ~6.2 million metric tons per year
of fully-contracted production
capacity1
▪ Visibility into doubling production
capacity with current sales and
asset development pipelines4
▪ Potential to develop fully
contracted plants at ~5x adjusted
EBITDA project investment
multiple5
▪ Highly-accretive expansion
opportunities identified across
existing asset fleet
Robust Long-term
Demand
▪ Global energy transition
underway in which wood biomass
plays a key role in stabilizing grid-
critical power and heat generation
assets
▪ Massive decarbonization of
industry underway, where wood
biomass is a large-scale solution
available today
▪ Bioenergy with carbon capture
and storage (BECCS) is a
valuable negative-emissions
solution expected to be
increasingly deployed as
governments and industrial
customers drive to net-zero
emissions
APPENDIX
Q 3 2 0 2 1 U P D A T E
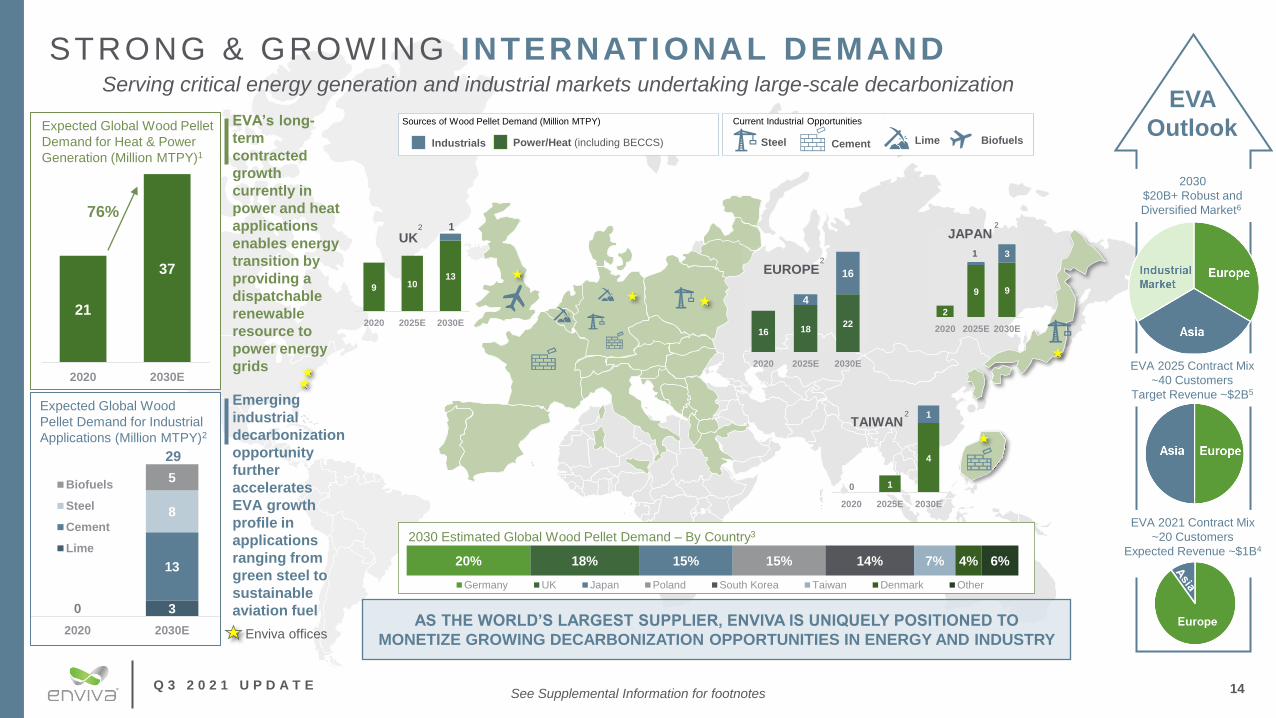
STRONG & GROWING INTERNATIONAL DEMANDServing critical energy generation and industrial markets undertaking large-scale decarbonization
21
37
2020 2030E
76%
Expected Global Wood Pellet
Demand for Heat & Power
Generation (Million MTPY)1
EVA’s long-
term
contracted
growth
currently in
power and heat
applications
enables energy
transition by
providing a
dispatchable
renewable
resource to
power energy
grids
14
EVA
Outlook
EVA 2021 Contract Mix
~20 Customers
Expected Revenue ~$1B4
EVA 2025 Contract Mix
~40 Customers
Target Revenue ~$2B5
2030
$20B+ Robust and
Diversified Market6
Power/Heat (including BECCS)Industrials
Sources of Wood Pellet Demand (Million MTPY)
CementSteel Lime Biofuels
Current Industrial Opportunities
20% 18% 15% 15% 14% 7% 4% 6%
Germany UK Japan Poland South Korea Taiwan Denmark Other
2030 Estimated Global Wood Pellet Demand – By Country3
Emerging
industrial
decarbonization
opportunity
further
accelerates
EVA growth
profile in
applications
ranging from
green steel to
sustainable
aviation fuel
9 1013
2020 2025E 2030E
UK1
See Supplemental Information for footnotes
Enviva offices
3
13
0
8
5
2020 2030E
Biofuels
Steel
Cement
Lime
Expected Global Wood
Pellet Demand for Industrial
Applications (Million MTPY)2
29
2
16 1822
4
16
2020 2025E 2030E
EUROPE2
2
9 9
1 3
2020 2025E 2030E
JAPAN2
1
4
1
2020 2025E 2030E
TAIWAN
0
2
AS THE WORLD’S LARGEST SUPPLIER, ENVIVA IS UNIQUELY POSITIONED TO
MONETIZE GROWING DECARBONIZATION OPPORTUNITIES IN ENERGY AND INDUSTRY

Q 3 2 0 2 1 U P D A T E
By 2025, Enviva’s current contract mix is balanced ~50%
Japanese customers and ~50% European customers4
Enviva commenced deliveries to Japan in late 2020, with
~10 shipments expected to be delivered in 2021, ~55
shipments in 2022, and continued increases thereafter as
customers ramp energy generation from biomass
CURRENT CONTRACT OVERVIEW
15
$21+ billion of fully contracted backlog provides significant cash flow visibility and durability
ENVIVA’S 2025 FORECASTED OFF -TAKE
CONTRACT M IX
◼ Geographically diverse set of high-credit counterparties underpins $21+ billion contract backlog, with a weighted-average remaining term of 14.5 years1
◼ Revenue backlog is complemented by a similarly large and growing customer pipeline consisting of long-term off-take opportunities in our traditional markets
and emerging industrial segments across the globe (including steel, cement, lime, chemicals, SAF and biodiesel)2
◼ Recently announced new contracts include:
First take-or-pay off-take contract to supply an industrial customer with up to ~1.2 million MTPY of wood pellets, to be used as a feedstock in the
production of SAF and renewable fuels, with initial annual deliveries of 60,000 MTPY expected to commence in 20233
4th contract signed with U.K. power generator, Drax, for 200,000 MTPY for 5 years, with deliveries scheduled from 2022 to 2026
20-year, 190,000 MTPY contract with a major Japanese trading house starting in 2024
See Supplemental Information for footnotes
1
4-
3 , 0 0 0
6 , 0 0 0
9 , 0 0 0
2015 2016 2017 2018 2019 2020 2021E 2025E
TOTAL M ETRIC TONS SOLD
P O TE N TI AL I N D U S TR I AL D E L I V E R I E S
I N D U S TR I AL
J AP AN
E U R O P E
Q 3 2 0 2 1 U P D A T E
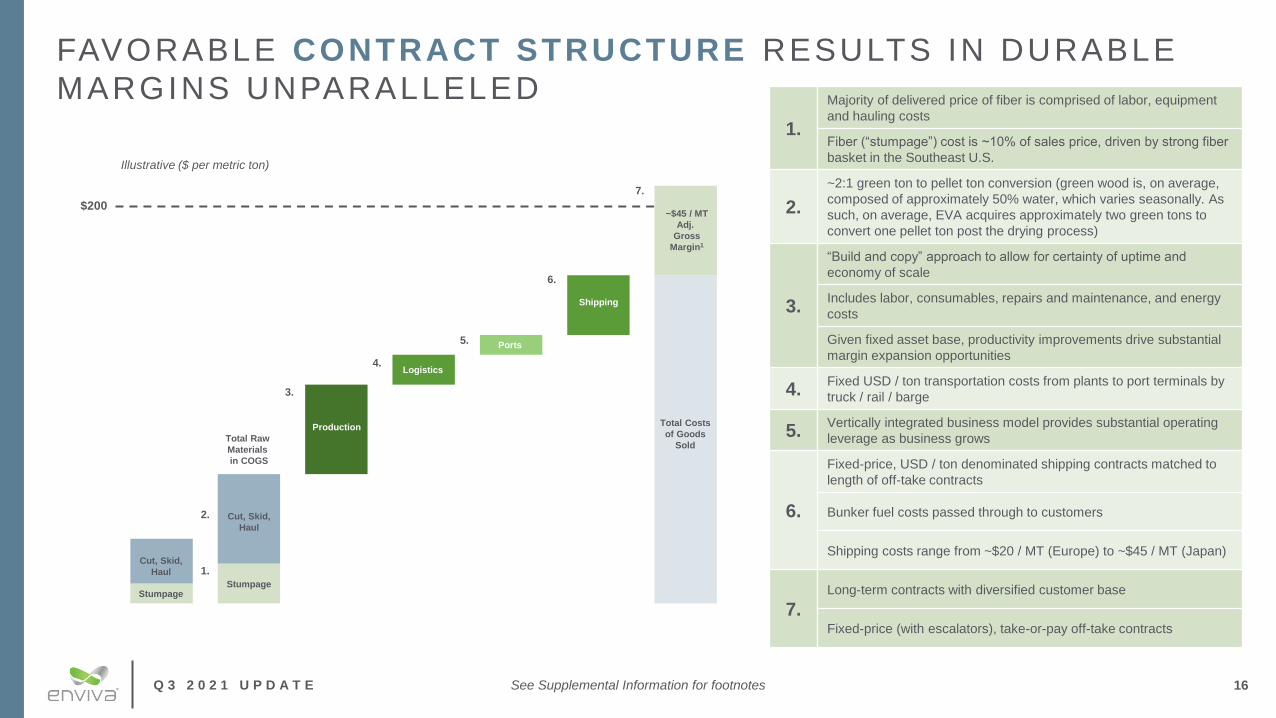
FAVORABLE CONTRACT STRUCTURE RESULTS IN DURABLE
MARGINS UNPARALLELED
See Supplemental Information for footnotes 16
$250-$270
1.
Majority of delivered price of fiber is comprised of labor, equipment
and hauling costs
Fiber (“stumpage”) cost is ~10% of sales price, driven by strong fiber
basket in the Southeast U.S.
2.
~2:1 green ton to pellet ton conversion (green wood is, on average,
composed of approximately 50% water, which varies seasonally. As
such, on average, EVA acquires approximately two green tons to
convert one pellet ton post the drying process)
3.
“Build and copy” approach to allow for certainty of uptime and
economy of scale
Includes labor, consumables, repairs and maintenance, and energy
costs
Given fixed asset base, productivity improvements drive substantial
margin expansion opportunities
4.Fixed USD / ton transportation costs from plants to port terminals by
truck / rail / barge
5.Vertically integrated business model provides substantial operating
leverage as business grows
6.
Fixed-price, USD / ton denominated shipping contracts matched to
length of off-take contracts
Bunker fuel costs passed through to customers
Shipping costs range from ~$20 / MT (Europe) to ~$45 / MT (Japan)
7.Long-term contracts with diversified customer base
Fixed-price (with escalators), take-or-pay off-take contracts
$250-$270
Illustrative ($ per metric ton)
$200
Cut, Skid,
Haul
~$45 / MT
Adj.
Gross
Margin1
Production
Total Raw
Materials
in COGS
Total Costs
of Goods
Sold
Stumpage
Cut, Skid,
Haul
Stumpage
Logistics
Ports
Shipping
1.
3.
4.
5.
6.
7.
2.

Q 3 2 0 2 1 U P D A T E 17
ASSET DEVELOPMENT PIPELINE
P R O J E C T U P D AT EM U LT I - P L A N T E X PA N S I O N S 1
Highly-accretive set of initiatives at 3 plants driving ~$20 million in
incremental annual expected adjusted EBITDA with ~$50 million capital
expenditures; 2.5x adjusted EBITDA project investment multiple2
E P E S P L A N T 3
Fully contracted, designed and permitted to produce more than 1 million
MTPY once construction is completed, making it the largest industrial wood
pellet production plant in the world
L U C E D A L E E X PA N S I O N 4
Fully permitted expansion option for 300,000 MTPY; capital expenditures of
~$60 million driving ~$15 million of expected incremental annual adjusted
EBTIDA; 4.0x adjusted EBITDA project investment multiple2
B O N D P L A N T 5
Designed to produce between 750,000 and more than 1 million MTPY;
proximity to Port of Pascagoula allows efficient delivery to terminal
N E W P L A N T S & E X PA N S I O N S U N D E R
E VA L U AT I O NSites in the Pascagoula cluster, Chesapeake cluster, Wilmington cluster,
and Savannah cluster being evaluated for the next 4 greenfield projects.
Highly-accretive potential expansion projects identified across asset fleet
Bond Plant
2021 2022 2023Capacity
Additions
(MTPY)
Forecasted
In-service
Date
Mid-Atlantic
Expansions400,000
Complete in
2021
Greenwood
Expansion100,000 4Q21
Multi-Plant
Expansions100,000 4Q22
Epes Plant 1,000,000+ 2H23
Lucedale
Expansion300,000 1H24
Bond Plant750,000 –
1,000,0002H24
~40%Production capacity increase
underway over next 3 years,
with visibility into doubling
size of today’s capacity6
See Supplemental Information for footnotes
Q 3 2 0 2 1 U P D A T E
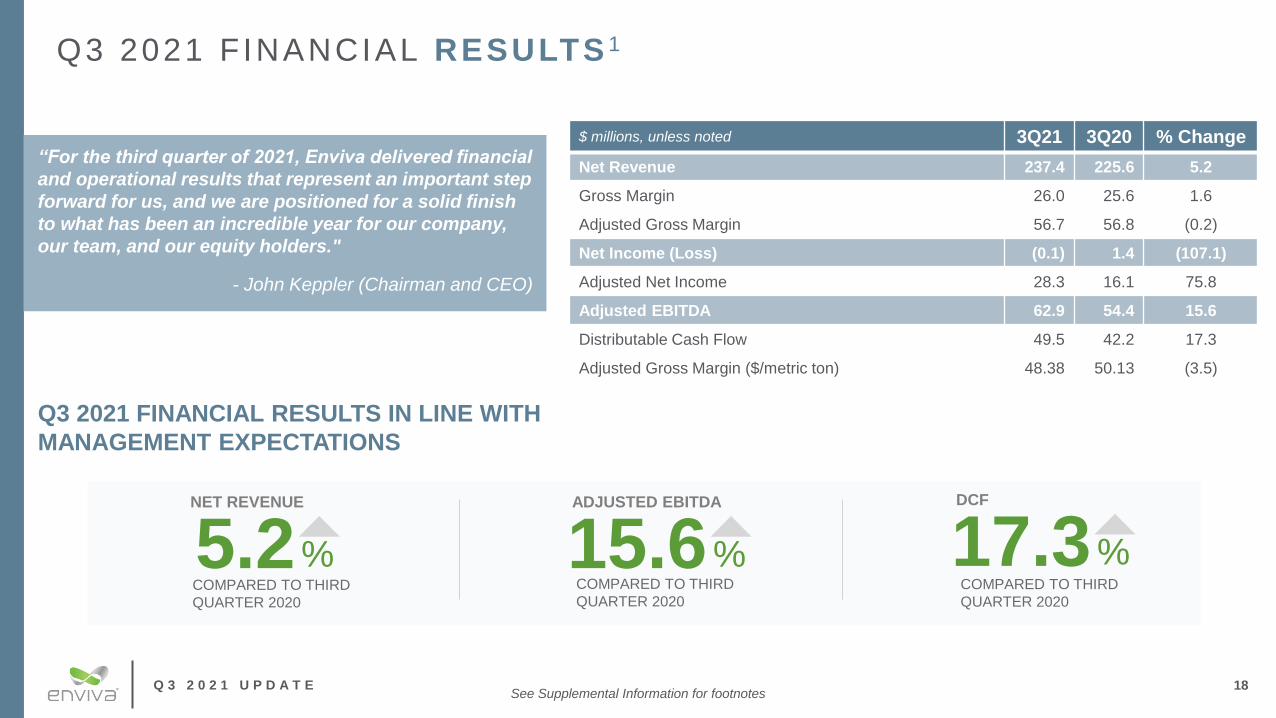
Q3 2021 F INANCIAL RESULTS 1
$ millions, unless noted 3Q21 3Q20 % Change
Net Revenue 237.4 225.6 5.2
Gross Margin 26.0 25.6 1.6
Adjusted Gross Margin 56.7 56.8 (0.2)
Net Income (Loss) (0.1) 1.4 (107.1)
Adjusted Net Income 28.3 16.1 75.8
Adjusted EBITDA 62.9 54.4 15.6
Distributable Cash Flow 49.5 42.2 17.3
Adjusted Gross Margin ($/metric ton) 48.38 50.13 (3.5)
18
Q3 2021 FINANCIAL RESULTS IN LINE WITH
MANAGEMENT EXPECTATIONS
“For the third quarter of 2021, Enviva delivered financial
and operational results that represent an important step
forward for us, and we are positioned for a solid finish
to what has been an incredible year for our company,
our team, and our equity holders."
- John Keppler (Chairman and CEO)
15.6%
ADJUSTED EBITDA
COMPARED TO THIRD
QUARTER 2020
5.2%
NET REVENUE
COMPARED TO THIRD
QUARTER 2020
17.3%
DCF
COMPARED TO THIRD
QUARTER 2020
See Supplemental Information for footnotes

NON-GAAP FINANCIAL
MEASURES

Q 3 2 0 2 1 U P D A T E
NON-GAAP FINANCIAL MEASURES
This presentation contains certain financial measures that are not presented in accordance with accounting principles generally accepted in the United States
(“GAAP”). Although they should not be considered alternatives to the GAAP presentation of the financial results of the Partnership, management views such non-
GAAP measures as important to reflect the Partnership’s actual performance during the periods presented.
Non-GAAP Financial Measures
In addition to presenting our financial results in accordance with accounting principles generally accepted in the United States (“GAAP”), we use adjusted net
income, adjusted gross margin, adjusted gross margin per metric ton, adjusted EBITDA, and distributable cash flow to measure our financial performance. In
addition, we have included herein 2021 estimated financial results (the “2021 Guidance”), which include the expected post-closing results of the assets and
operations acquired as part of the Simplification Transaction, but do not reflect any recast of our historical financials as a result of the Simplification Transaction.
If GAAP requires a recast of our historical financials as a result of the Simplification Transaction, the 2021 Guidance constitutes a Non-GAAP measure. Our
management uses our 2021 Guidance as a supplemental measure to represent the financial results of the assets and operations of the publicly traded entity.
Adjusted Net Income
We define adjusted net income as net income excluding interest expense associated with incremental borrowings related to a fire that occurred in February 2018 at
the Chesapeake terminal (the “Chesapeake Incident”) and Hurricanes Florence and Michael (the “Hurricane Events”), early retirement of debt obligation, and
acquisition and integration and other costs, adjusting for the effect of certain sales and marketing, scheduling, sustainability, consultation, shipping, and risk
management services (collectively, “Commercial Services”), and including, for periods prior to the Simplification Transaction, certain non-cash waivers of fees for
management services provided to us by our sponsor (collectively, “MSA Fee Waivers”), and for periods after the Simplification Transaction, certain payments under
the Support Agreement entered into in connection therewith (“Support Payments”). We believe that adjusted net income enhances investors’ ability to compare the
past financial performance of our underlying operations with our current performance separate from certain items of gain or loss that we characterize as
unrepresentative of our ongoing operations.
20
Q 3 2 0 2 1 U P D A T E
NON-GAAP FINANCIAL MEASURES (cont.)
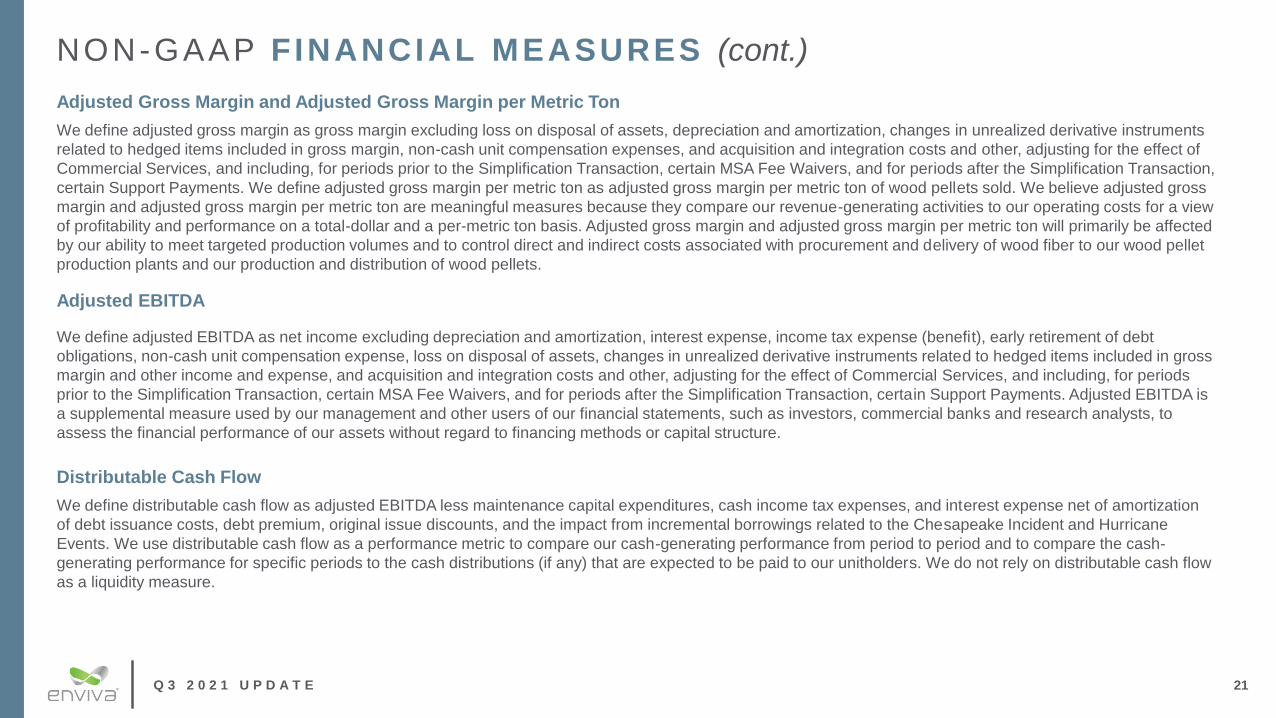
Adjusted Gross Margin and Adjusted Gross Margin per Metric Ton
We define adjusted gross margin as gross margin excluding loss on disposal of assets, depreciation and amortization, changes in unrealized derivative instruments
related to hedged items included in gross margin, non-cash unit compensation expenses, and acquisition and integration costs and other, adjusting for the effect of
Commercial Services, and including, for periods prior to the Simplification Transaction, certain MSA Fee Waivers, and for periods after the Simplification Transaction,
certain Support Payments. We define adjusted gross margin per metric ton as adjusted gross margin per metric ton of wood pellets sold. We believe adjusted gross
margin and adjusted gross margin per metric ton are meaningful measures because they compare our revenue-generating activities to our operating costs for a view
of profitability and performance on a total-dollar and a per-metric ton basis. Adjusted gross margin and adjusted gross margin per metric ton will primarily be affected
by our ability to meet targeted production volumes and to control direct and indirect costs associated with procurement and delivery of wood fiber to our wood pellet
production plants and our production and distribution of wood pellets.
Adjusted EBITDA
We define adjusted EBITDA as net income excluding depreciation and amortization, interest expense, income tax expense (benefit), early retirement of debt
obligations, non-cash unit compensation expense, loss on disposal of assets, changes in unrealized derivative instruments related to hedged items included in gross
margin and other income and expense, and acquisition and integration costs and other, adjusting for the effect of Commercial Services, and including, for periods
prior to the Simplification Transaction, certain MSA Fee Waivers, and for periods after the Simplification Transaction, certain Support Payments. Adjusted EBITDA is
a supplemental measure used by our management and other users of our financial statements, such as investors, commercial banks and research analysts, to
assess the financial performance of our assets without regard to financing methods or capital structure.
Distributable Cash Flow
We define distributable cash flow as adjusted EBITDA less maintenance capital expenditures, cash income tax expenses, and interest expense net of amortization
of debt issuance costs, debt premium, original issue discounts, and the impact from incremental borrowings related to the Chesapeake Incident and Hurricane
Events. We use distributable cash flow as a performance metric to compare our cash-generating performance from period to period and to compare the cash-
generating performance for specific periods to the cash distributions (if any) that are expected to be paid to our unitholders. We do not rely on distributable cash flow
as a liquidity measure.
21
Q 3 2 0 2 1 U P D A T E
NON-GAAP FINANCIAL MEASURES (cont.)
22
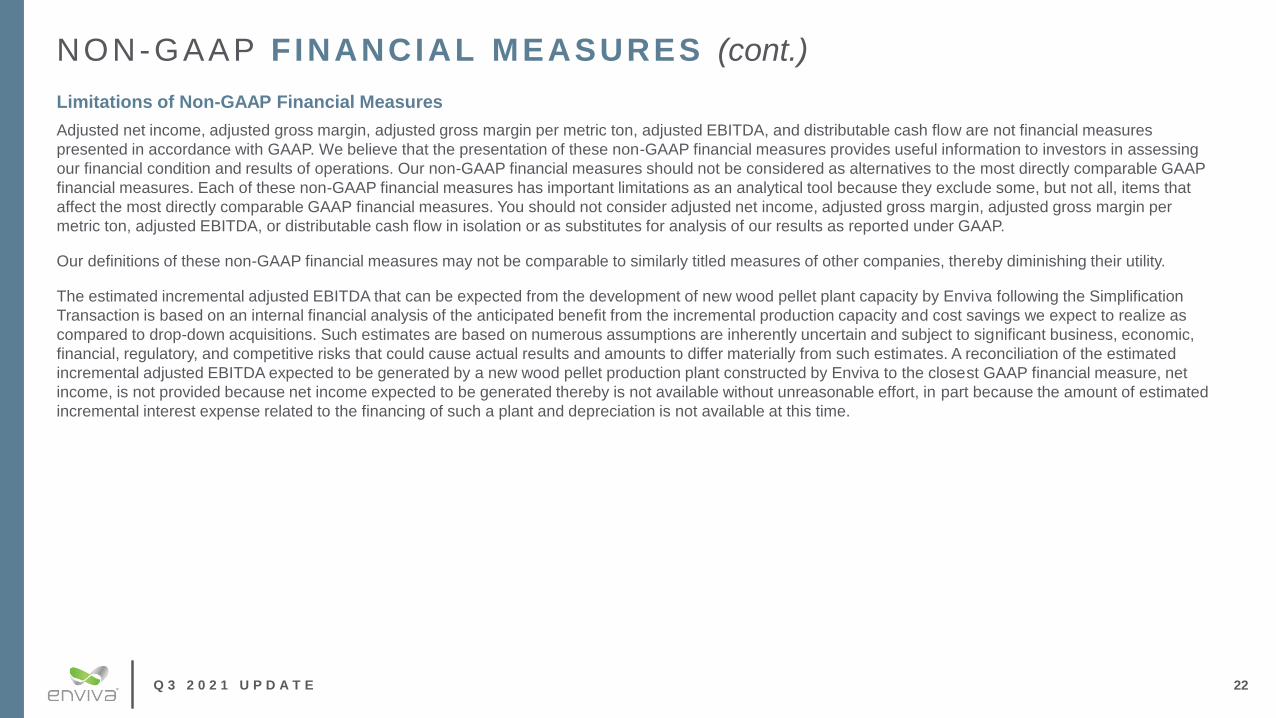
Limitations of Non-GAAP Financial Measures
Adjusted net income, adjusted gross margin, adjusted gross margin per metric ton, adjusted EBITDA, and distributable cash flow are not financial measures
presented in accordance with GAAP. We believe that the presentation of these non-GAAP financial measures provides useful information to investors in assessing
our financial condition and results of operations. Our non-GAAP financial measures should not be considered as alternatives to the most directly comparable GAAP
financial measures. Each of these non-GAAP financial measures has important limitations as an analytical tool because they exclude some, but not all, items that
affect the most directly comparable GAAP financial measures. You should not consider adjusted net income, adjusted gross margin, adjusted gross margin per
metric ton, adjusted EBITDA, or distributable cash flow in isolation or as substitutes for analysis of our results as reported under GAAP.
Our definitions of these non-GAAP financial measures may not be comparable to similarly titled measures of other companies, thereby diminishing their utility.
The estimated incremental adjusted EBITDA that can be expected from the development of new wood pellet plant capacity by Enviva following the Simplification
Transaction is based on an internal financial analysis of the anticipated benefit from the incremental production capacity and cost savings we expect to realize as
compared to drop-down acquisitions. Such estimates are based on numerous assumptions are inherently uncertain and subject to significant business, economic,
financial, regulatory, and competitive risks that could cause actual results and amounts to differ materially from such estimates. A reconciliation of the estimated
incremental adjusted EBITDA expected to be generated by a new wood pellet production plant constructed by Enviva to the closest GAAP financial measure, net
income, is not provided because net income expected to be generated thereby is not available without unreasonable effort, in part because the amount of estimated
incremental interest expense related to the financing of such a plant and depreciation is not available at this time.

Q 3 2 0 2 1 U P D A T E
NON-GAAP F INANCIAL MEASURES RECONCILIATION
Three Months Ended September 30, Nine Months Ended September 30,
2021 2020 2021 2020
(in thousands)
Reconciliation of Net (Loss) Income to Adjusted Net Income:
Net (loss) income $ (71) $ 1,411 $ 1,109 $ 17,515
Acquisition and integration costs and other 7,294 4,908 8,297 5,865
MSA Fee Waivers 21,125 9,206 36,150 13,963
Interest expense from incremental borrowings related to Chesapeake Incident and Hurricane Events – 554 – 1,672
Commercial services – – – (4,139)
Adjusted net income $ 28,348 $ 16,079 $ 45,556 $ 34,876
23
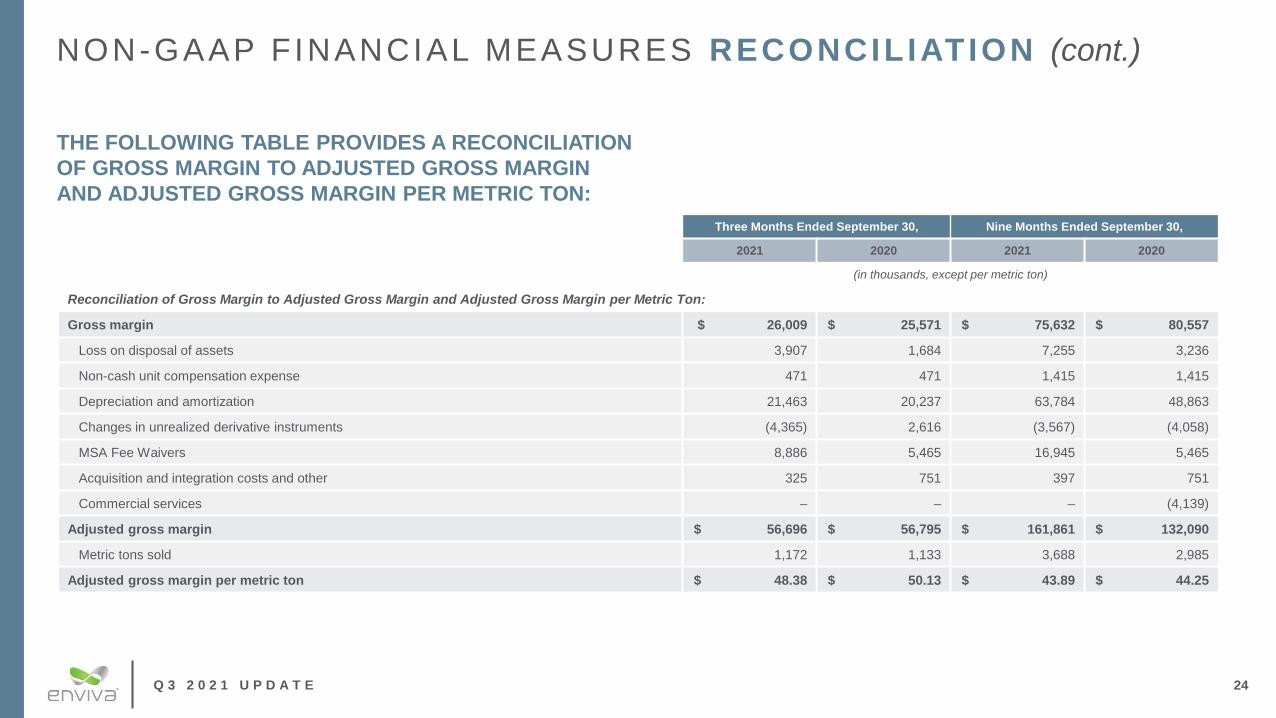
THE FOLLOWING TABLE PROVIDES A RECONCILIATION
OF NET (LOSS) INCOME TO ADJUSTED NET INCOME:
Q 3 2 0 2 1 U P D A T E
NON-GAAP F INANCIAL MEASURES RECONCILIATION (cont.)
Three Months Ended September 30, Nine Months Ended September 30,
2021 2020 2021 2020
(in thousands, except per metric ton)
Reconciliation of Gross Margin to Adjusted Gross Margin and Adjusted Gross Margin per Metric Ton:
Gross margin $ 26,009 $ 25,571 $ 75,632 $ 80,557
Loss on disposal of assets 3,907 1,684 7,255 3,236
Non-cash unit compensation expense 471 471 1,415 1,415
Depreciation and amortization 21,463 20,237 63,784 48,863
Changes in unrealized derivative instruments (4,365) 2,616 (3,567) (4,058)
MSA Fee Waivers 8,886 5,465 16,945 5,465
Acquisition and integration costs and other 325 751 397 751
Commercial services – – – (4,139)
Adjusted gross margin $ 56,696 $ 56,795 $ 161,861 $ 132,090
Metric tons sold 1,172 1,133 3,688 2,985
Adjusted gross margin per metric ton $ 48.38 $ 50.13 $ 43.89 $ 44.25
24
THE FOLLOWING TABLE PROVIDES A RECONCILIATION
OF GROSS MARGIN TO ADJUSTED GROSS MARGIN
AND ADJUSTED GROSS MARGIN PER METRIC TON:
Q 3 2 0 2 1 U P D A T E
NON-GAAP F INANCIAL MEASURES RECONCILIATION (cont.)
Three Months Ended September 30, Nine Months Ended September 30,
2021 2020 2021 2020
(in thousands)
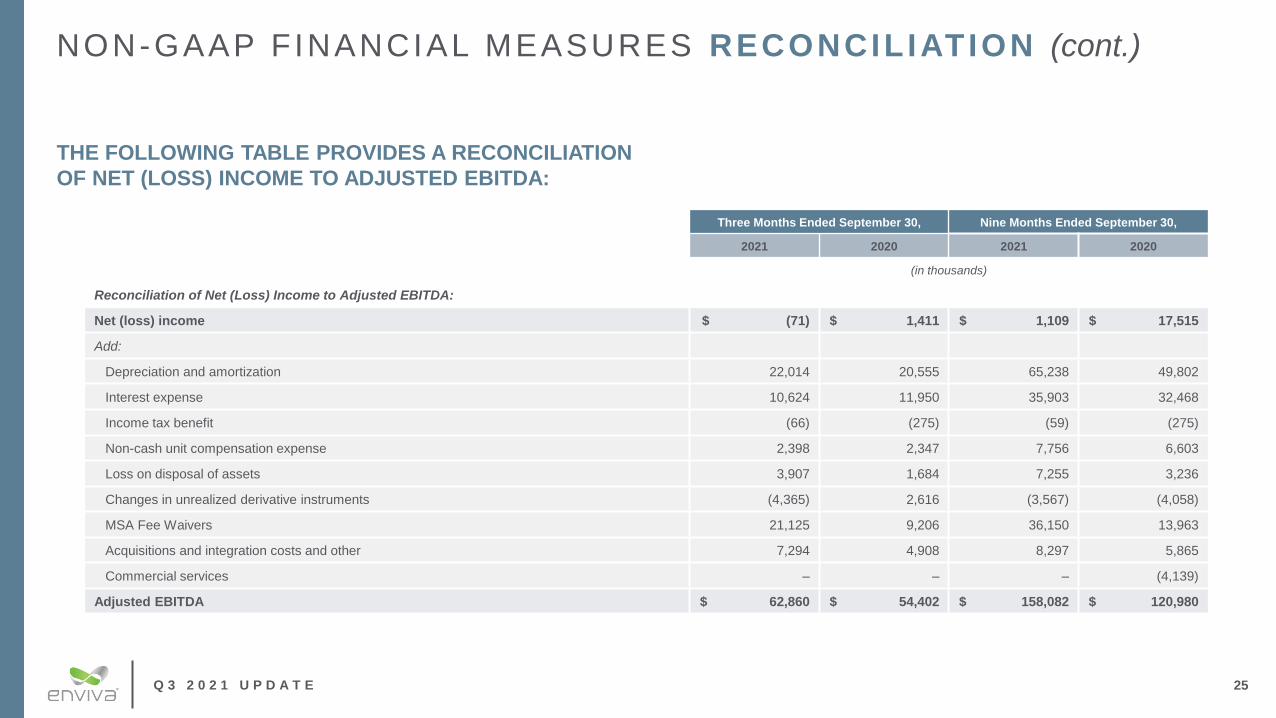
Reconciliation of Net (Loss) Income to Adjusted EBITDA:
Net (loss) income $ (71) $ 1,411 $ 1,109 $ 17,515
Add:
Depreciation and amortization 22,014 20,555 65,238 49,802
Interest expense 10,624 11,950 35,903 32,468
Income tax benefit (66) (275) (59) (275)
Non-cash unit compensation expense 2,398 2,347 7,756 6,603
Loss on disposal of assets 3,907 1,684 7,255 3,236
Changes in unrealized derivative instruments (4,365) 2,616 (3,567) (4,058)
MSA Fee Waivers 21,125 9,206 36,150 13,963
Acquisitions and integration costs and other 7,294 4,908 8,297 5,865
Commercial services – – – (4,139)
Adjusted EBITDA $ 62,860 $ 54,402 $ 158,082 $ 120,980
THE FOLLOWING TABLE PROVIDES A RECONCILIATION
OF NET (LOSS) INCOME TO ADJUSTED EBITDA:
25
Q 3 2 0 2 1 U P D A T E
NON-GAAP F INANCIAL MEASURES RECONCILIATION (cont.)
Three Months Ended September 30, Nine Months Ended September 30,
2021 2020 2021 2020
(in thousands)
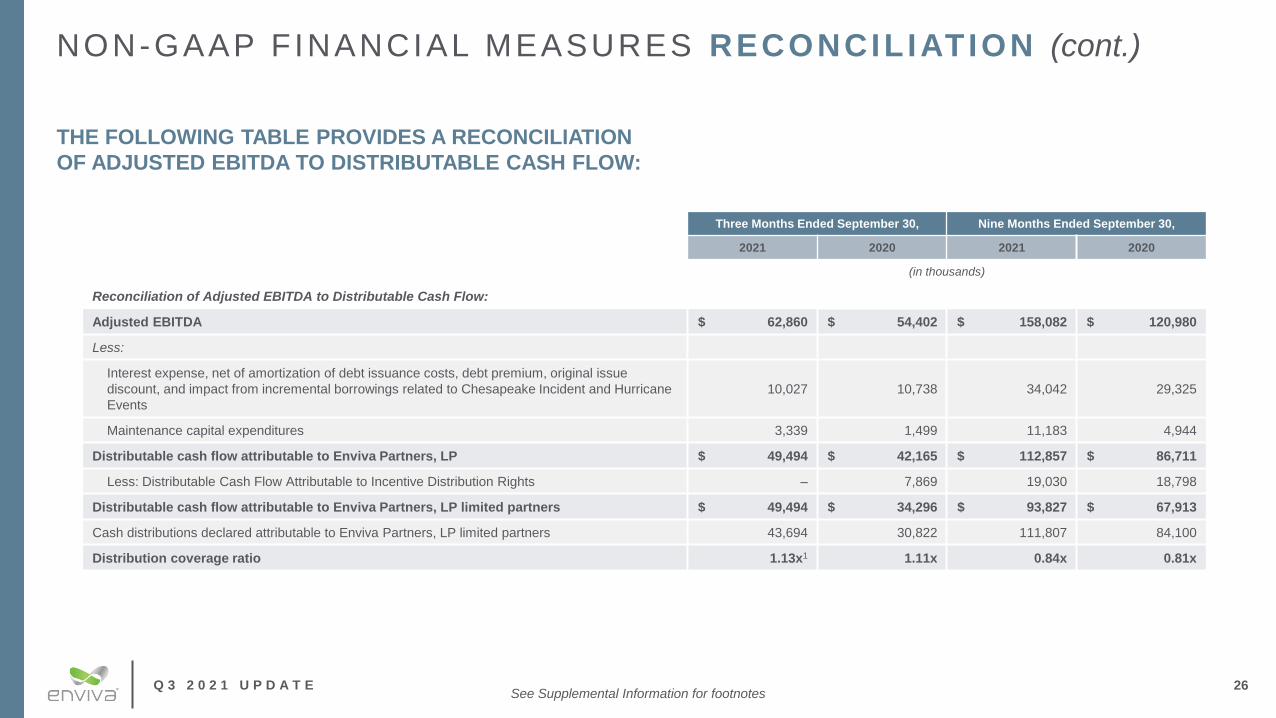
Reconciliation of Adjusted EBITDA to Distributable Cash Flow:
Adjusted EBITDA $ 62,860 $ 54,402 $ 158,082 $ 120,980
Less:
Interest expense, net of amortization of debt issuance costs, debt premium, original issue
discount, and impact from incremental borrowings related to Chesapeake Incident and Hurricane
Events
10,027 10,738 34,042 29,325
Maintenance capital expenditures 3,339 1,499 11,183 4,944
Distributable cash flow attributable to Enviva Partners, LP $ 49,494 $ 42,165 $ 112,857 $ 86,711
Less: Distributable Cash Flow Attributable to Incentive Distribution Rights – 7,869 19,030 18,798
Distributable cash flow attributable to Enviva Partners, LP limited partners $ 49,494 $ 34,296 $ 93,827 $ 67,913
Cash distributions declared attributable to Enviva Partners, LP limited partners 43,694 30,822 111,807 84,100
Distribution coverage ratio 1.13x1 1.11x 0.84x 0.81x
THE FOLLOWING TABLE PROVIDES A RECONCILIATION
OF ADJUSTED EBITDA TO DISTRIBUTABLE CASH FLOW:
26See Supplemental Information for footnotes

Q 3 2 0 2 1 U P D A T E
2021 & 2022 GUIDANCE 1
Twelve Months Ending
December 31, 20212
Twelve Months Ending
December 31, 2022
Estimated net income $ 4.0 – 14.0 $ 42.0 – 67.0
Add:
Depreciation and amortization 91.0 112.0
Interest expense 48.0 56.0
Income tax expense 1.0 25.0
Non-cash share-based compensation expense 11.0 12.0
Loss on disposal of assets 8.0 4.0
Changes in unrealized derivative instruments (4.0) –
MSA Fee Waivers / Support Payments 49.0 24.0
Acquisition and integration costs 16.0 –
Other non-cash expenses 1.0 –
Estimated adjusted EBITDA $ 225.0 – 235.0 $ 275.0 – 300.0
Less:
Interest expense net of amortization of debt issuance costs, debt premium, and original issue discount 46.0 55.0
Cash income tax expense – –
Maintenance capital expenditures 14.0 10.0
Estimated distributable cash flow $ 165.0 – 175.0 $ 210.0 – 235.0
The following table provides a reconciliation of the estimated range of adjusted EBITDA
and DCF to the estimated range of net income for Enviva for the twelve months ending
December 31, 2021, and December 31, 2022 (in millions):
27See Supplemental Information for footnotes

Q 3 2 0 2 1 U P D A T E 28
SUPPLEMENTAL INFORMATION
Q 3 2 0 2 1 U P D A T E
SUPPLEMENTAL INFORMATION
29
Slide 5 (Enviva)
1. Enviva’s total expected production capacity as of October 1, 2021, including the Lucedale plant after it is fully constructed and able to achieve its nameplate throughput capacity. Also
included is the nameplate capacity of approximately 600,000 metric tons per year (“MTPY”) for the wood pellet production plant in Greenwood, South Carolina (the “Greenwood plant”) after
completion of the ongoing expansion project. The total expected production capacity does not include expansion projects underway at the Sampson, Hamlet, and Cottondale plants (the
“Multi-Plant Expansions”).
2. On February 17, 2021, Enviva announced our goal of achieving net-zero greenhouse gas (“GHG”) emissions in our operations by 2030.
3. As of October 1, 2021, and including the initial 60,000 MTPY tranche related to the recently announced industrial contract as well as the recently announced contracts with Drax Group PLC
and a large Japanese trading house, Enviva’s total weighted-average remaining term of off-take contracts is approximately 14.5 years, with a total contracted revenue backlog of over $21
billion.
4. Given the quality and size of our current customer contract pipeline, we believe that we will be able to support the addition of at least six new fully contracted wood pellet production plants
and several highly accretive expansion projects, which over approximately the next five years would roughly double the size of our current production capacity. With the benefit of the
capabilities, resources, and activities now housed within Enviva, we expect to construct our new fully contracted wood pellet production plants at an approximately 5x adjusted EBITDA
project investment multiple as compared to a historic drop-down acquisition multiple of roughly 7.5x. For an explanation of why we are unable to reconcile the estimated adjusted EBITDA
from a plant developed by Enviva internally to the most directly comparable GAAP financial measures, see Appendix.
5. Enviva reaffirmed its previously announced distribution guidance and expects to distribute $3.30 per unit for full-year 2021 and $3.62 per share for 2022.

Q 3 2 0 2 1 U P D A T E 30
SUPPLEMENTAL INFORMATION (cont.)
Slide 6 (Strategic Assets)
1. Production volumes disclosed represent nameplate production capacity at each plant.
2. Enviva’s total expected production capacity as of October 1, 2021, including the Lucedale plant after it is fully constructed and able to achieve its nameplate throughput
capacity. Also included is the nameplate capacity of approximately 600,000 MTPY for the Greenwood plant, after completion of the ongoing expansion project. The total
expected production capacity does not include the Multi-Plant Expansions (as defined below).
3. We export wood pellets from our wholly owned deep-water marine terminals at the Port of Chesapeake, Virginia (the “Chesapeake terminal”) and the Port of Wilmington, North
Carolina (the “Wilmington terminal”) and from third-party deep-water marine terminals in Mobile, Alabama (the “Mobile terminal”), Panama City, Florida (the “Panama City
terminal”) and Savannah, Georgia (the “Savannah terminal”).
4. Includes increased production capacity pursuant to the ongoing expansion projects (the “Mid-Atlantic Expansions”) at the wood pellet production plants in Northampton, North
Carolina and Southampton, Virginia. The Partnership continues to expect each plant to reach its expanded nameplate production capacity of 750,000 and 760,000 MTPY,
respectively, by the end of 2021.
5. Enviva expects to complete its project to expand the Greenwood plant’s production capacity to 600,000 MTPY by year-end 2021.
6. After the Lucedale plant and Pascagoula terminal are fully constructed and ramped up and achieve their nameplate production or throughput capacities, as applicable. The
acquisition of the Lucedale plant included an embedded, fully permitted option to expand the Lucedale plant by about 300,000 MTPY for around $60 million in estimated capital
expenditures. The expansion at Lucedale, when fully ramped, is expected to generate incremental annual adjusted EBITDA of ~$15 million.
7. As part of the Simplification Transaction, Enviva acquired projects at 15 plant sites, all in various stages of evaluation and development.
Q 3 2 0 2 1 U P D A T E 31
SUPPLEMENTAL INFORMATION (cont.)
Slide 8 (Q3 2021 Highlights)
1. Additional details can be found in our press releases issued on November 3, 2021.
2. For the third quarter of 2021, Enviva declared a distribution of $0.840 per common unit, an 8.4% increase over the third quarter of 2020, and its 25th consecutive quarterly
distribution increase since its IPO. Enviva expects to distribute $3.30 and $3.62 per share for full-year 2021 and 2022, respectively.
3. On November 3, 2021, Today, Enviva announced the signing of a new 10-year take-or-pay off-take contract to supply our first direct industrial customer with 60,000 MTPY of
wood pellets to be used as a feedstock in the refining process for SAF and other renewable fuels like biodiesel. Deliveries under the initial tranche of the contract are scheduled
to commence in 2023, with volumes potentially increasing to approximately 1.2 million MTPY by 2027, through a series of additional 10-year take-or-pay tranches, as the
customer builds incremental production capacity. Enviva will be the sole supplier of this customer’s incremental wood pellet needs. The initial tranche's conditions precedent,
are expected to be met during 2022.
4. On October 15, 2021, Enviva announced the acquisition of Enviva Holdings, LP (“Holdings”) and the elimination of incentive distributions rights (the “Simplification
Transaction”). Enviva also announced plans to convert from a master limited partnership to a corporation under the name of Enviva Inc. by the end of the year (the
“Conversion”); a unitholder meeting is now scheduled to be held on December 17, 2021.
5. As of October 1, 2021, and including the initial 60,000 MTPY tranche related to the recently announced industrial contract, Enviva’s total weighted-average remaining term of
off-take contracts is approximately 14.5 years, with a total contracted revenue backlog of over $21 billion.
6. The contracted revenue backlog of over $21 billion is complemented by a similarly large and growing customer pipeline consisting of long-term off-take opportunities in our
traditional markets for biomass-fired power and heat generation in geographies ranging from the United Kingdom to the European Union (including emerging opportunities in
Germany and Poland), and from Asia (including incremental demand in Japan, emerging potential in Taiwan, and maturing opportunities in South Korea) to developing
industrial segments across the globe (including steel, cement, lime, chemicals, SAF, and biodiesel). Over the next 12 months, we expect to progress negotiations and convert
numerous contract pipeline opportunities, as well as previously signed exclusive memoranda of understanding, into binding contracts.
7. Enviva is making significant progress toward its goal to achieve net zero greenhouse gas emissions in its operations by 2030, in part by using 100% renewable energy at our
facilities. Enviva recently announced a supply contract with GreenGasUSA, an integrated renewable natural gas (“RNG”) solutions provider, which includes a 10-year RNG off-
take agreement to decarbonize natural gas-related emissions in our operations. The methane captured and emissions eliminated as a result of this contract are expected to
offset approximately 75% of Enviva’s current direct emissions from its manufacturing operations, or Scope 1 emissions, on an annual basis for the duration of the 10-year
agreement, which includes renewal options for an additional 10 years. Additional details can be found in our press releases issued on November 3, 2021.
Q 3 2 0 2 1 U P D A T E 32
SUPPLEMENTAL INFORMATION (cont.)
Slide 9 (Financial Guidance)
1. On October 15, 2021, Enviva updated full-year 2021 and 2022 guidance as a result of the Simplification Transaction and Conversion. Updated guidance for full-year 2021
includes the expected post-closing results of the assets and operations acquired as part of the Simplification Transaction, including approximately $15 million to $20 million of
incremental selling, general, and administrative expenses (“SG&A”). For full-year 2022, Enviva expects SG&A related to activities acquired with the Simplification Transaction
to range from $37 million to $43 million. Additional details can be found in our press releases issued on November 3, 2021.
2. Our guidance for full-year 2021 is based on our actual performance on a stand-alone basis from January 1, 2021 through October 14, 2021 (the closing date of the
Simplification Transaction), and our expected performance on a consolidated basis, inclusive of the assets and operations acquired as part of the Simplification Transaction,
from the closing date through the balance of the year ending December 31, 2021. This full-year 2021 guidance does not, however, reflect a potential recast of our historical
results, which may be required under GAAP due to the Simplification Transaction. If recast, our results would reflect the acquisition of our former sponsor for the three-year
period beginning January 1, 2019, even though the acquisition closed on October 14, 2021. We expect the addition of our former sponsor’s development-related expenses and
the elimination of intercompany transactions, including the MSA Fee Waivers and other forms of sponsor support, would cause our 2021 GAAP results on a recast basis to be
significantly different from and lower than the 2021 guidance described below. We believe our 2021 guidance provides investors with the best and most relevant information to
evaluate the company’s financial and operating performance because it reflects Enviva’s actual and historically reported performance on a stand-alone basis through the
closing date of the Simplification Transaction and expected performance on a consolidated basis from the closing date until year-end. We are currently unable to reconcile the
2021 guidance set forth below to the closest GAAP financial measures because we have neither prepared such a recast nor concluded it will be required; however, for
purposes of comparability and transparency, we plan to measure our 2021 results on a non-recast basis against our 2021 guidance.
3. Enviva’s target leverage ratio is calculated pursuant to our credit facility.
4. Distributable Cash Flow.
5. We expect SG&A resulting from the Simplification Transaction to decline over time as we benefit from synergies and execute streamlining initiatives, with the expectation that
we will reduce these expenses by approximately $5 million on an annual run-rate basis commencing in 2023.
Q 3 2 0 2 1 U P D A T E
SUPPLEMENTAL INFORMATION (cont.)
33
Slide 10 (Capitalization and Financial Framework)
1. Dividend coverage ratio for the third quarter of 2021 is calculated on a cash basis, which means the unit count includes 7 million of the 16 million units issued on October 14,
2021. The 7 million units are not part of the dividend reinvestment commitment and therefore receive cash distributions on a quarterly basis.
2. Enviva remains committed to conservatively managing its balance sheet, targeting a leverage ratio between 3.5 and 4.0 times, as calculated pursuant to our credit facility.
3. Debt to total capitalization calculation based on net debt divided by total capitalization figures provided on Slide 11.
4. We expect to retain an incremental ~$1 billion of cash flow over the next 5 years compared to the prior sponsor-led structure, driven by the elimination of IDRs and lower plant
investment multiples. Spanning the next 5 years, we anticipate that this improved return on invested capital will generate over $500 million of the approximately $1 billion of
forecasted retained cash flow, with the other half coming from the elimination of IDRs, which represented an increasingly significant annual cash obligation.
5. Based on EVA’s closing price on October 29, 2021; $66.96. Based on 61,017,303 units outstanding as of October 29, 2021.
Slide 11 (Net Zero Promise)
1. Scope 1 emissions are direct emissions from assets owned and controlled by Enviva. Scope 2 emissions are indirect emissions from heat, steam or electricity purchased by
Enviva. Scope 3 emissions are indirect emissions in Enviva’s upstream or downstream value chain.
2. Additional details can be found in Enviva’s press release issued on March 30, 2021.
Slide 12 (Enviva II)
1. Enviva’s total expected production capacity as of October 1, 2021, including the Lucedale plant after it is fully constructed and able to achieve its nameplate throughput
capacity. Also included is the nameplate capacity of approximately 600,000 MTPY for the Greenwood plant, after completion of the ongoing expansion project. The total
expected production capacity does not include the Multi-Plant Expansions.
2. Enviva expects to distribute $3.30 and $3.62 per share for full-year 2021 and 2022, respectively.
3. Enviva remains committed to conservatively managing its balance sheet, targeting a leverage ratio between 3.5 and 4.0 times.
4. Given the quality and size of our current customer contract pipeline, we believe that we will be able to support the addition of at least six new fully contracted wood pellet
production plants and several highly accretive expansion projects, which over approximately the next five years would roughly double the size of our current production
capacity.
5. With the benefit of the capabilities, resources, and activities now housed within Enviva, we expect to construct our new fully contracted wood pellet production plants at an
approximately 5x adjusted EBITDA project investment multiple as compared to a historic drop-down acquisition multiple of roughly 7.5x. For an explanation of why we are
unable to reconcile the estimated adjusted EBITDA from the Lucedale plant expansion option to the most directly comparable GAAP financial measures, see Appendix.
6. As of October 29, 2021, based on Bloomberg’s total return data, which assumes reinvestment of distributions/dividends.

Q 3 2 0 2 1 U P D A T E
SUPPLEMENTAL INFORMATION (cont.)
Slide 14 (International Demand)
1. Hawkins Wright: The Outlook for Wood Pellets – Demand, Supply, Costs and Prices; 3rd Quarter 2021.
2. Conclusions from a market sizing and adoption study we recently commissioned from a leading international consultancy suggest that these segments are expected increase
from virtually zero today, to as much as 29 million MTPY of industrial-grade wood pellets by 2030.
3. Company Estimates. Fastmarkets RISI: Global Pellet Demand Outlook: Special Market Analysis Study 2021.
4. Based on forecasts for FY 2021.
5. Contract mix, customers and target revenue based on EVA’s current firm contracted backlog and company estimates.
6. Based on the market sizing and adoption study we recently commissioned, and company estimates.
Slide 15 (Current Contract Overview)
1. As of October 1, 2021, and including the initial 60,000 MTPY tranche related to the recently announced industrial contract, Enviva’s total weighted-average remaining term of
off-take contracts is approximately 14.5 years, with a total contracted revenue backlog of over $21 billion.
2. The contracted revenue backlog of over $21 billion is complemented by a similarly large and growing customer pipeline consisting of long-term off-take opportunities in our
traditional markets for biomass-fired power and heat generation in geographies ranging from the United Kingdom to the European Union (including emerging opportunities in
Germany and Poland), and from Asia (including incremental demand in Japan, emerging potential in Taiwan, and maturing opportunities in South Korea) to developing
industrial segments across the globe (including steel, cement, lime, chemicals, SAF, and biodiesel). Over the next 12 months, we expect to progress negotiations and convert
numerous contract pipeline opportunities, as well as previously signed exclusive memoranda of understanding, into binding contracts.
3. On November 3, 2021, Today, Enviva announced the signing of a new 10-year take-or-pay off-take contract to supply our first direct industrial customer with 60,000 MTPY of
wood pellets to be used as a feedstock in the refining process for SAF and other renewable fuels like biodiesel. Deliveries under the initial tranche of the contract are scheduled
to commence in 2023, with volumes potentially increasing to approximately 1.2 million MTPY by 2027, through a series of additional 10-year take-or-pay tranches, as the
customer builds incremental production capacity. Enviva will be the sole supplier of this customer’s incremental wood pellet needs. The initial tranche's conditions precedent,
are expected to be met during 2022.
34

Q 3 2 0 2 1 U P D A T E
SUPPLEMENTAL INFORMATION (cont.)
Slide 17 (Asset Development Pipeline)
1. We have made significant investments in the Multi-Plant Expansions, commencing at Enviva’s Sampson and Hamlet plants, with Cottondale to follow. For an explanation of
why we are unable to reconcile the estimated adjusted EBITDA from the Multi-Plant Expansions and the Lucedale plant expansion option to the most directly comparable
GAAP financial measures, see Appendix.
2. For an explanation of why we are unable to reconcile the estimated adjusted EBITDA for the Multi-Plant Expansions and the Lucedale plant expansion option to the most
directly comparable GAAP financial measures, see Appendix.
3. As part of the Simplification Transaction, Enviva acquired projects at 15 plant sites, all in various stages of evaluation and development. One of these acquired sites is the fully
contracted Epes plant, which is currently under development. We expect to commence construction in early 2022, with an in-service date scheduled for mid-2023. Epes is
designed and permitted to produce more than one million MTPY of wood pellets, which would make it the largest wood pellet production plant in the world.
4. Construction of the Lucedale plant is nearing completion, and we expect commissioning to commence in late fourth-quarter 2021. For an explanation of why we are unable to
reconcile the estimated adjusted EBITDA from the Multi-Plant Expansions and the Lucedale plant expansion option to the most directly comparable GAAP financial measures,
see Appendix.
5. We expect construction of a prospective production plant in Bond, Mississippi (“Bond”) to commence once Epes is operational, but timing of construction could be expedited
depending on the schedule and delivery requirements of additional off-take contract opportunities under negotiation and general market conditions. The Bond plant is being
developed to produce between 750,000 and more than 1 million MTPY of wood pellets.
6. Given the quality and size of our current customer contract pipeline, we believe that we will be able to support the addition of at least six new fully contracted wood pellet
production plants and several highly accretive expansion projects, which over approximately the next five years would roughly double the size of our current production
capacity. With the benefit of the capabilities, resources, and activities now housed within Enviva, we expect to construct our new fully contracted wood pellet production plants
at an approximately 5x adjusted EBITDA project investment multiple as compared to a historic drop-down acquisition multiple of roughly 7.5x
35
Slide 16 (Contract Structure)
1. Adjusted Gross Margin per Metric Ton defined in Appendix.
Slide 18 (Q3 2021 Financial Results)
1. Additional details can be found in our press releases issued on November 3, 2021, and in our Non-GAAP disclosures starting on slide 19 of this presentation.
Q 3 2 0 2 1 U P D A T E
SUPPLEMENTAL INFORMATION (cont.)
36
Slide 27 (2021 & 2022 Guidance )
1. The table and narrative include Enviva’s guidance for 2021 and 2022. Our guidance for full-year 2021 is based on our actual performance on a stand-alone basis from January
1, 2021 through October 14, 2021 (the closing date of the Simplification Transaction), and our expected performance on a consolidated basis, inclusive of the assets and
operations acquired as part of the Simplification Transaction, from the closing date through the balance of the year ending December 31, 2021. This full-year 2021 guidance
does not, however, reflect a potential recast of our historical results, which may be required under GAAP due to the Simplification Transaction. If recast, our results would
reflect the acquisition of our former sponsor for the three-year period beginning January 1, 2019, even though the acquisition closed on October 14, 2021. We expect the
addition of our former sponsor’s development-related expenses and the elimination of intercompany transactions, including the MSA Fee Waivers and other forms of sponsor
support, would cause our 2021 GAAP results on a recast basis to be significantly different from and lower than the 2021 guidance described below. We believe our 2021
guidance provides investors with the best and most relevant information to evaluate the company’s financial and operating performance because it reflects Enviva’s actual and
historically reported performance on a stand-alone basis through the closing date of the Simplification Transaction and expected performance on a consolidated basis from the
closing date until year-end. We are currently unable to reconcile the 2021 guidance set forth below to the closest GAAP financial measures because we have neither prepared
such a recast nor concluded it will be required; however, for purposes of comparability and transparency, we plan to measure our 2021 results on a non-recast basis against
our 2021 guidance.
2. On October 15, 2021, Enviva updated full-year 2021 and 2022 guidance as a result of the Simplification Transaction and Conversion. Updated guidance for full-year 2021
includes the expected post-closing results of the assets and operations acquired as part of the Simplification Transaction, including approximately $15 million to $20 million of
incremental SG&A expenses. For full-year 2022, Enviva expects SG&A expenses related to activities acquired through the Simplification Transaction to range from $37 million
to $43 million.
Slide 26 (Adjusted EBITDA to Distributable Cash Flow)
1. Dividend coverage ratio for the third quarter of 2021 is calculated on a cash basis, which means the unit count includes 7 million of the 16 million units issued on October 14,
2021. The 7 million units are not part of the dividend reinvestment commitment and therefore receive cash distributions on a quarterly basis.