35
Q3 : FY 2019-20

Q3 : FY 2019-20

Business Mix
(Deposits + Advances) Dec 18 Mar 19 Sep 19 Dec 19
Variation (%)
over
Dec 18 Sep 19
Global Business 887,931 903,723 895,030 900,824 1.45 0.65
Domestic 725,264 749,920 758,172 786,192 8.40 3.70
Foreign 162,667 153,803 136,858 114,632 -29.53 (16.24)
Global Deposits 515,128 520,862 518,037 522,138 1.36 0.79
Domestic 413,449 421,783 436,530 453,458 9.68 3.88
Foreign 101,679 99,079 81,507 68,680 -32.45 (15.74)
Global Advances
(Gross ) 372,803 382,860 376,993 378,686 1.58 0.45
Domestic 311,815 328,137 321,642 332,734 6.71 3.45
Foreign 60,988 54,723 55,351 45,952 -24.65 (16.98)
Performance At A Glance - Business (Q-o-Q)
2

Dec 18
(4738)
Dec-19
106
Performance Highlights
Operating Profit
Net Profit
9.24% 11.17% 12.47%
14.20%
Dec 18 Dec 19
Tier 1 CRAR
CRAR
3
Dec -18
42.65
42.69
Dec 18 Dec 19
CASA( Domestic)
Dec 18 Dec 19
2273
4135

76.76 77.15
Dec 18 Dec 19
Provision Coverage
Dec 18 Dec 19
0.99% 1.16%
3.02% 3.45% 2.55%
3.07%
Foreign Domestic Global
Net Interest Margin
16.31% 16.30%
5.87% 5.97%
Dec 18 Dec 19
GNPA
NNPA
NPA Ratio
Dec 18 Dec 19
Risk Weighted Assets (Rs in crore)
3,02,849 2,97,023
4
Performance Highlights(Cont’d)

CASA : 42.65% CASA : 42.69%
CA 5.82%
SA 36.83%
Bulk Deposits
7.21%
TD Others 50.14%
CA 6.26% SA
36.43%
Bulk Deposits 7.53 %
TD Others 49.78%
Type of deposits Dec 18 Mar 19 Sep 19 Dec 19 Y-O-Y Growth
Current
Account 23,881 23,354 23,033 28,110 17.70
Saving
Account 151,129 158,411 160,365 163,625 8.26
CASA 175,010 181,765 183,397 191,735 9.55
Domestic Deposits - CASA
5
Dec 18 Dec 19

Industry Dec 18 Mar 19 Sep 19 Dec 19 Y-O-Y
Growth % % to Domestic credit
Dec 19
Agriculture (Excluding RIDF)
49,698 50,338 50,841 51,546 3.72 15.49
MSME 53,220 54,595 53,862 54,261 1.96 16.31
Retail 53,524 56,492 57,665 58,848 9.95 17.69
RAM 156,442 161,425 162,368 164,655 5.25 49.49
Corporate & Others
128,759
138,797
129,456
135,572
5.29
40.74
Govt & Govt Guaranted Advance
26,614 27,915 29,818 32,507 22.14 9.77
Total 311,815 328,137 321,642 332,734 6.71 100.00
Key Sectors – Domestic
6

Particulars
Dec 18
Mar 19 Sep 19 Dec 19 Y-O-Y
Growth %
% to Retail
Credit
Dec 19
Home 31,364 32,417 33,572 34,647 10.47 58.88
Mortgage 6,884 6,947 6,725 6,662 (3.22) 11.32
Auto 5,003 5,089 5,106 5,433 8.59 9.23
Education 3,333 3,257 3,235 3,196 (4.11) 5.43
Personal 1,656 1,681 1,674 1,703 2.84 2.89
Others* 5,284 7,101 7,353 7,207* 36.39 12.25
Total 53,524 56,492 57,665 58,848 9.95 100
Retail Credit
7 *Loan/OD against TDR :1892, Staff Loan : 4636, Other Loan: 679.

Domestic Credit – Industry-wise
8
Particulars Dec. 18 Mar 19 June 19 Sept. 19 Dec. 19 Y-O-Y
Growth %
% to Domestic Advances
Infrastructure 51,815 51,045 51,012 50901 51764 (0.10) 15.56
Basic Metal & Metal products
13,210 13,882 13,673 13573 14072 6.53 4.23
Textiles 8,596 8,341 8,087 8193 8300 (3.44) 2.49
Gems & Jewellery 5,342 4,906 4,845 4715 4438 (16.92) 1.33
Chemicals & Chemical products
5,887 6,686 5,418 5538 5382 (8.58) 1.62
Vehicles, vehicle parts & Transport equipment
3,546 3,066 3,106 3089 3064 (13.59) 0.92
Rubber, Plastic & their products
2,110 2,022 1,855 2013 1964 (6.92) 0.59
Construction 3,684 4,969 4,988 3496 3737 1.44 1.12
Real Estate(Incl CRE+HFC)
51,135 61,161 61,795 63,292 70,872 38.60 21.30
NBFC(Excl HFC) 19,277 26,539 24,636 24,588 24,917 29.26 7.49
Other Industries 28,087 28,196 26,650 27809 26891 (4.26) 8.08
Total 1,92,689 2,10,813 2,06,065 207207 215401 11.79 64.74

Industry Dec 18 Mar 19 Sep 19 Dec 19 Y-O-Y
Growth %
% to
ANBC
Agriculture 52,533 57,302 51,501 51,930 (1.15) 17.29
Out of which,
S&MF 25,167 28,455 26,014 26,479 5.22 8.82
MSME 50,403 51,866 49,972 50,370 (0.07)
Out of which, Micro 23,767 26,148 25,569 26,219 10.32 8.73
Housing Loan 16,635 17,038 17,415 17,669 6.22
Educational Loan 3,202 3,140 2,940 2,925 (8.67)
Others 1,153 1,148 1,081 1,373 19.05
Total Priority
Sector Advances 123,926 130,494 122,910 124,267 0.27 41.38
9
Priority Sector Advances

Particulars Dec 18 Mar 19 Sep 19 Dec 19 Y-O-Y ( % )
Power 34,573 33,867 32,417 33,036 (4.45)
a) SEBs 13,988 12,158 13,026 13,023 (6.90)
b) Others 20,585 21,709 19,391 20,013 (2.78)
Roads and Ports 11,965 11,944 12,546 12,654 5.76
Telecom 489 488 486 489 0
Other Infrastructure 5,755 4,746 5,452 5,585 (2.95)
Total 51,815 51,045 50,901 51,764 (0.10)
Advances - Infrastructure Sectors
10

Advances - Infrastructure Sectors
11
49% 54%
7% 6%
8% 8%
14% 11%
21% 21%
Dec 18 Dec 19
A & Above BBB Below BBB Unrated Govt Exposures
A & above
BBB
Below
Unrated
(Govt Exposures)

VERTICAL No. of Borrowers FB+NFB O/S
No. of
Borrowers
FB+NFB O/S No. of Borrowers FB+NFB O/S
Dec-18 Mar-19 Dec-19
SMA-1 155 5,583 168 7,982 116 5,860
SMA-2 146 6,237 37 1,838 103 4,300
TOTAL 301 11,820 205 9,820 219 10,161
REPORTED TO RBI-CRILC (Central Repository of Information on Large Credits) EXPOSURE OF RS. 5 Crore and above
SMA - 1 & 2 ACCOUNTS
12

Sector breakup of Restructured Advances 31.12.2019
13
Dec-18 Dec-19
NO. OF
ACCOUNT
AMOUNT NO. OF
ACCOUNT AMOUNT
INFRA 16 1,831 15 1849 INFRA-POWER 10 1,543 11 1654 INFRA-TELECOM - - 0 0 INFRA-ROADS & PORTS 4 195 3 117 INFRA-OTHERS 2 93 1 77 AVIATION 1 3,685 1 1552 TEXTILES 6 24 17 54 ENGG 4 37 7 67 SUGAR 5 153 1 31 PHARMA 1 26 2 10 STEEL 4 125 6 108 CEMENT 4 194 12 192 SERVICES 4 65 15 104 HOTELS 9 106 13 101 OTHER METAL 2 6 5 12 AGRICULTURE 7 21 24 88 AUTOMOBILES 2 14 3 11 SERVICE-TRANSPORT RELATED 4 72 12 74 OTHERS 48482 1,887 140892 4008 Standard Restructured Advances (Domestic) 48551 8,246 141025 8260 Standard Restructured Advances (Overseas) 4 360 2 33 Standard Restructured Advances (Total) 48555 8606 141027 8293
Sector

NCLT ACCOUNTS as on 31.12.2019
14
Gross Exposure in INR crore
NCLT 1 List NCLT 2 List Accountfiled by BOI
at NCLT
Accountsfiled by
other banksat NCLT
Total
2083.81 2471.9 6349.97
26185.1
37090.78

Item Dec 18 Mar 19 Sep 19 Dec 19
Gross NPA 60,798 60,661 61,476 61,730
Net NPA 19,438 19,119 19,646 20,113
Gross NPA % 16.31 15.84 16.31 16.30
Net NPA % 5.87 5.61 5.87 5.97
Provision Coverage
Ratio % 76.76 76.95 77.12 77.15
Asset Quality – Sequential
15

Item Dec 18
Mar 19
Sep 19 Dec 19
Opening
Balance 61,561 60,798 62,068 61,476
Less :
Recovery 2,353 1,982 966 3,212
Upgradation 171 477 294 447
Write Off 2,554 780 2,498 2,803
Total reduction 5,078 3,239 3,758 6,462
Slippages 4,315 3,102 3,166 6,716
Closing Balance 60,798 60,661 61,476 61,730
Movement of NPA
16

Breakup of Gross NPA
17
Particulars Dec 18 Mar 19 Sep 19 Dec 19 % to
Domestic Credit Dec 18 Dec19
Large Corporate 31,981 32,097 32,537 32,793 19.78 18.72
MSME 9,226 9,023 9,041 8,993 18.70 17.67
AGRICULTURE 7,816 8,368 8,577 8,730 16.52 18.09
RETAIL 1,722 1,679 1,693 1,769 3.21 3.04
TOTAL (Domestic) 50,745 51,167 51,848 52,285 16.27 15.72
Total (Overseas) 10,053 9,494 9,627 9,445 16.48 20.56
Total (Global) 60,798 60,661 61,476 61730 16.31 16.30

Dec 18 Dec 19
Particulars AFS HTM HFT AFS HTM HFT
SLR Investments 25,051 82,530 525 32,819 83,688 41
Of Which:
Government Securities 25,051 82,530 525 32,819 83,688 41
Other Approved Securities 0 0 0 0 0 0
M Duration 2.47 -- 6.06 2.09 -- 5.36
Non SLR Investments 17,962 18,747 0 14,606 23,645 2
M Duration 2.47 -- 0 3.08 -- 0
Total 43,013 101,277 525 47,425 107,333 43
Investments (Domestic)
18
Particulars
Quarter ended
Variation (%) over
Dec 18 Sep 19
Dec 18
Mar 19
Sep 19 Dec 19
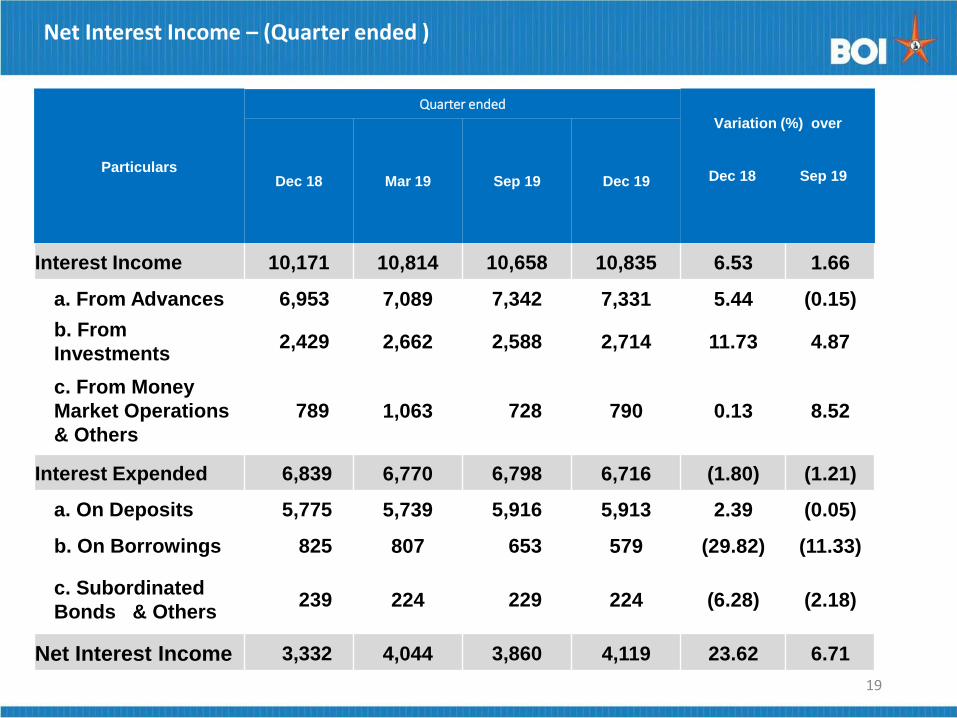
Interest Income 10,171 10,814 10,658 10,835 6.53 1.66
a. From Advances 6,953 7,089 7,342 7,331 5.44 (0.15)
b. From
Investments 2,429 2,662 2,588 2,714 11.73 4.87
c. From Money
Market Operations
& Others
789 1,063 728 790 0.13 8.52
Interest Expended 6,839 6,770 6,798 6,716 (1.80) (1.21)
a. On Deposits 5,775 5,739 5,916 5,913 2.39 (0.05)
b. On Borrowings 825 807 653 579 (29.82) (11.33)
c. Subordinated
Bonds & Others 239 224 229 224 (6.28) (2.18)
Net Interest Income 3,332 4,044 3,860 4,119 23.62 6.71
Net Interest Income – (Quarter ended )
19
Particulars
Quarter ended
Variation (%)
over
Dec 18 Sep 19
Dec 18
Mar 19
Sep 19 Dec 19
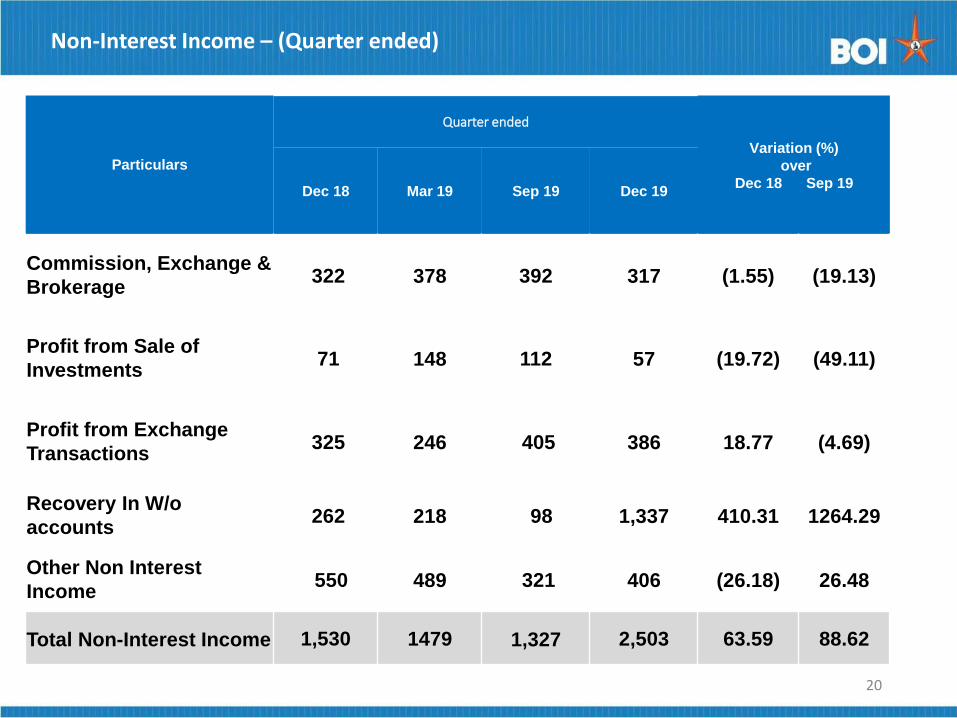
Commission, Exchange &
Brokerage 322 378 392 317 (1.55) (19.13)
Profit from Sale of
Investments 71 148 112 57 (19.72) (49.11)
Profit from Exchange
Transactions 325 246 405 386 18.77 (4.69)
Recovery In W/o
accounts 262 218 98 1,337 410.31 1264.29
Other Non Interest
Income 550 489 321 406 (26.18) 26.48
Total Non-Interest Income 1,530 1479 1,327 2,503 63.59 88.62
Non-Interest Income – (Quarter ended)
20

Particulars
Dec 18
Mar 19
Sep 19 Dec 19
Operating Profit 2,273 2,303 2,460 4,135
Provisions for
B&D 9,179 1,503 1,452 3,774
Standard Assets (114) 239 225 89
NPV / Others (19) (21) 327 88
Depreciation on
Investment (45) 176 49 64
Total Provisions before
Tax 9,001 1,897 2,053 4,015
Taxation (1990) 154 141 14
Net Profit (PAT) (4738) 252 266 106
Provisions - (Quarter ended )
21

4.49 4.5 4.56 4.62 4.58
8.31 8.63 8.27 8.78 8.91
Dec-18 Mar-19 Jun-19 Sep-19 Dec-19
Cost Of Deposits Yield On Advance
Cost of Deposits & Yield on Advance (Q-o-Q)
22
Cost of Deposits & Yield on Advance (Q-o-Q)
23
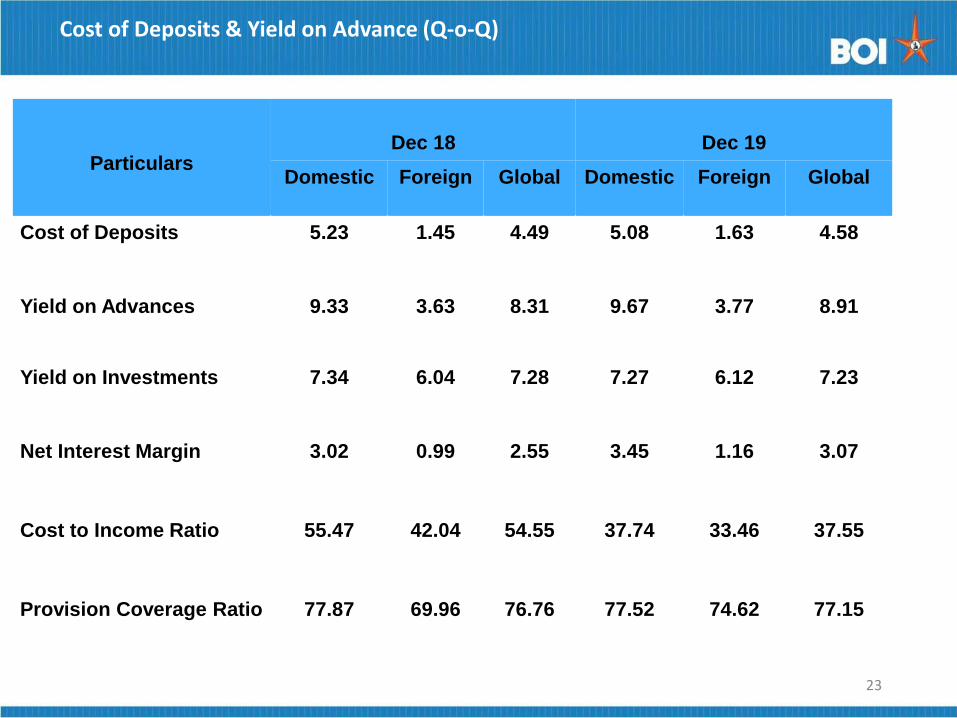
Particulars
Dec 18
Dec 19
Domestic Foreign Global Domestic Foreign Global
Cost of Deposits 5.23 1.45 4.49 5.08 1.63 4.58
Yield on Advances
9.33 3.63 8.31 9.67 3.77 8.91
Yield on Investments
7.34 6.04 7.28 7.27 6.12 7.23
Net Interest Margin
3.02 0.99 2.55 3.45 1.16 3.07
Cost to Income Ratio
55.47
42.04
54.55
37.74
33.46
37.55
Provision Coverage Ratio 77.87 69.96 76.76 77.52 74.62 77.15

Particulars
Dec 18
Mar 19
Sep19
Dec19
Capital Adequacy - Basel III
CET1 Capital 27,039 33,683 33,247 33732
Tier I Capital 27,444 33,870 33,434 33822
Tier II Capital 9,620 9,534 9,155 9167
Total Capital(CRAR) 37,065 43,404 42,589 42989
Total Assets 611,518 625,223 620,134 630,044
Risk Weighted Assets 297,023 305,953 302,333 302849
CET1 (%) including CCB 9.10 11.01 11.00 11.14
Tier I (%) 9.24 11.07 11.06 11.17
Tier II (%) 3.23 3.12 3.03 3.03
Capital Adequacy Basel III
(%)
including CCB
12.47 14.19 14.09 14.20
Capital Adequacy – Basel-III
24

Capital Optimization
25
Dec-18 Sep-19 Dec-19
24
81
55
25
13
85
Credit Risk RWA to Advances
62.10 62.02
24
96
57
61.06
Dec-18 Sep-19 Dec-19
399598
405333
408895 Total Advances

Rural 1831
Semi Urban 1454
Urban 811
Metro 993
Overseas 24
RuralSemi-UrbanUrbanMetroOverseas
Particulars Dec 18 Mar 19 Sep 19 Dec 19
Rural 2011 1832 1831 1831
Semi-urban 1371 1454 1454 1454
Urban 846 812 811 811
Metro 865 994 992 993
Domestic
Branches 5093 5092 5088 5089
Overseas
Branches 25 25 25 24
Total 5118 5117 5113 5113
Branch Network
26

Q3 FY19 Q2 FY20 Q3 FY20
893,854
18,64,901 22,846,54
Internet Banking Users - Corporate
Mobile banking data
Delivery Channel
27
132679
144476
147880
Q3 FY 19 Q2 FY 20 Q3 FY 20
6168
5825
5750
Q3 FY 19 Q2 FY 20 Q3 FY 20
ATM Network
5640
6142
6371
Q3 FY 19 Q2 FY 20 Q3 FY 20
Internet Banking Users - Retail
As on 31.12.2018 As on 31.12.2019
Particulars No. of Accts Amt.
(Rs. Cr.) No. of Accts
Amt.
(Rs. Cr.)
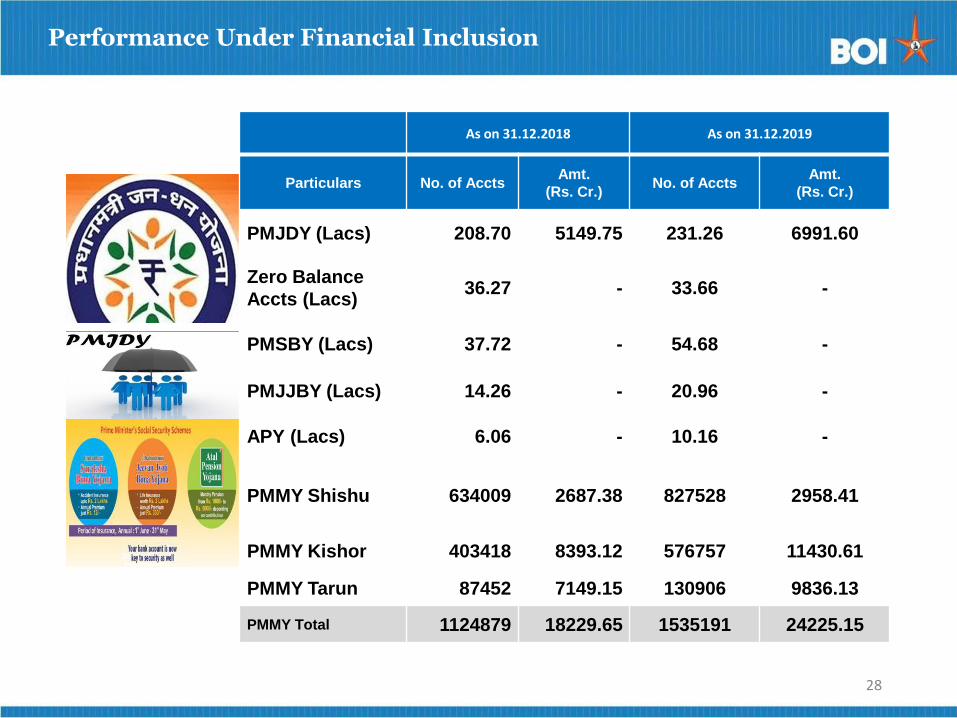
PMJDY (Lacs) 208.70 5149.75 231.26 6991.60
Zero Balance
Accts (Lacs) 36.27 - 33.66 -
PMSBY (Lacs) 37.72 - 54.68 -
PMJJBY (Lacs) 14.26 - 20.96 -
APY (Lacs) 6.06 - 10.16 -
PMMY Shishu 634009 2687.38 827528 2958.41
PMMY Kishor 403418 8393.12 576757 11430.61
PMMY Tarun 87452 7149.15 130906 9836.13
PMMY Total 1124879 18229.65 1535191 24225.15
Performance Under Financial Inclusion
28

Central Govt./ State Govt.
89.10 %
Mutual Funds/UTI
0.43 %
Financial Institution
s/ Banks
0.42%
Insurance Companie
s 4.78 %
FII & Other Foreign Holding 0.66%
Bodies Corporate
0.45 %
Individuals /
Others 4.16 %
Shareholding Pattern - 31.12.2019
BANK OF INDIA - EQUITY As on 31.12.2019
Category Shares % to
Capital
Promoter(Government of India) 2919690866 89.10
Foreign Financial Institution
Investor 21511610 0.66
Financial Institution/Bank 13873580 0.42
Insurance Company 156617565 4.78
Mutual Funds 14177462 0.43
Bodies Corporate 14683993 0.45
Indian public 132646741 4.05
Others 3721533 0.11
Total 3276923350 100.00
29

Item Dec
18
Sep
19
Dec
19
Y-o-Y
Growth
Revenue 10 6 10 (2.5)
Net Profit 5 3 4 (9.7)
Net worth 30 34 32 6.9
Domestic Subsidiaries
30
Item Dec
18
Sep
19 Dec 19
Y-o-Y
Growth
Revenue 2 1 1 (51.1)
Net Profit 1 0 0 (87.3)
Net worth 15 14 14 (1.4)
Boi Shareholding Ltd
Boi merchant Banker Ltd
(Amt in Crore)
(Amt in Crore)
Item Dec
18
Sep
19
Dec
19
Y-o-Y
Growth
Revenue 47 14 20 (58.1)
Net Profit (1) (1) (4) (235.8)
Net worth 59 57 55 (6.1)
AUM 3685 2312 2244 (39.1)
Item Dec
18
Sep
19
Dec
19
Y-o-Y
Growth
Revenue 17 6 9 (47.1)
Net Profit 8 (53) (2) (125)
Net worth 23 20 20 (13)
Boi AXA Investment Managers Pvt Ltd
Boi AXA Trustee Services Pvt LTD (Amt Lacs)

Item Dec
18
Sep
19
Dec
19
Y-o-Y
Growth
Deposit 370 335 340 (8.2)
Advances 219 230 223 1.7
Operating
Profit 6 7 9 48.8
Net Profit 4 5 5 31.8
NPA
Gross 15 14 19 25.8
NPA Net 10 9 12 14.8
NPA
Gross% 4.73 5.98 8.57 --
NPA Net% 4.31 4.12 5.33 --
International Subsidiaries
31
BOI (Tanzania) Ltd (Amt in Crore)
Item Dec
18
Sep
19
Dec
19
Y-o-Y
Growth
Deposit 1176 1151 1332 13.2
Advances 1174 982 1064 (9.4)
Operating
Profit 30 20 37 23.7
Net Profit 1 3 8 492.4
NPA Gross 60 44 45 (25.4)
NPA Net 39 27 23 (42.1)
NPA
Gross% 5.11 4.42 4.22 --
NPA Net % 3.39 2.69 2.18 --
P T Bank of India Indonesia TBK

Item Dec
18
Sep
19
Dec
19
Y-o-Y
Growth
Deposit 157 132 145 (7.6)
Advances 347 262 269 (22.4)
Operating
Profit 6 1 1 (83.3)
Net Profit 4 1 1 (68.7)
NPA
Gross 0 0 0 -
NPA Net 0 0 0 -
NPA
Gross% 0 0 0 -
NPA Net% 0 0 0 -
International Subsidiaries
32
BOI (New Zealand) Ltd (Amt in Crore)
Item Dec
18
Sep
19
Dec
19
Y-o-Y
Growth
Deposit 304 408 482 58.4
Advances 240 303 328 36.6
Operating
Profit 8 8 12 41.7
Net Profit 7 7 9 35.1
NPA Gross 0 0 0 -
NPA Net 0 0 0 -
NPA
Gross% 0 0 0 -
NPA Net % 0 0 0 -
BOI ( Uganda) Ltd

• Web-based - Retail Online Module: launched to improve productivity and customer service by reducing turnaround time.
• Cardless Cash withdrawal using UPI QR (QRCash) has been launched by which our Bank Customers can
withdraw cash from ATMs readily without the use of cards.
• Mobile and Internet Banking system upgraded with enhanced features for better customer experience
• As an FI initiative, seamless ICT Technology based basic banking services enabled in Rural & unbanked areas.
• Tech-driven Credit Monitoring System for tracking of ‘Early Warning Signals’ under implementation. • “Enterprise wide Fraud Risk Management” framework for real-time fraud monitoring is under process.
• Rationalisation of Domestic/overseas branches and ATMs being undertaken to reduce the Operational Cost. • Special drive for opening of Government Accounts & Pension accounts among branches across the
country.
• ‘Customer Outreach Initiative’ conducted in 18 districts and participated in more than 200 districts for augmenting credit off-take and expansion of financial inclusion and digital banking.
• Debit Card Control App & Credit Card Control App have been launched to enable customers to have a full control over the card activity.
INITIATIVES
33
AWARDS & RECOGNITION
34
Bank of India has won the second Most Trusted Brand Award in the Banks category awarded by the Reader’s Digest Trusted Brand, 2019. In the India Banking Summit & Awards 2019, Bank of India ranked as Best Public Sector Bank 2019 by Synnex Group. Best Performing Public Sector Bank in APY Formation Day Campaign (FY2019-20) by PFRDA ETBFSI Excellence Awards 2019- Most Innovative Large Size Bank of the Year for QR Cash. SKOCH Order of Merit AWARD 2019 in GOLD Category for BOI Mobile.

Thank YOU….
35


