19
| Date post: | 09-Apr-2018 |
| Category: |
Documents |
| Upload: | saeed-khan |
| View: | 217 times |
| Download: | 0 times |

8/7/2019 q3_2010
http://slidepdf.com/reader/full/q32010 1/18

8/7/2019 q3_2010
http://slidepdf.com/reader/full/q32010 2/18
Fauji Fertilizer Bin Qasim Limited 1
Lt Gen Hamid Rab Nawaz, HI(M), (Retired)
Chairman
Lt Gen Anis Ahmed Abbasi, HI(M), (Retired)Chief Executive & Managing Director
Lt Gen Malik Arif Hayat, HI(M), (Retired)
Mr Qaiser Javed
Brig Rahat Khan, SI(M), (Retired)Dr Nadeem Inayat
Brig Liaqat Ali, TI(M), (Retired)
Brig Jawaid Rashid Dar, SI(M), (Retired)
Brig Parvez Sarwar Khan, SI(M), (Retired)
Mr Naved A. Khan
Mr Nasier A. Sheikh
Mr Rashid Bajwa
PLANTSITEBin Qasim, Karachi, Pakistan
SECRETARYBrig Javed Nasir Khan, SI(M), (Retired)
CFOSyed Aamir Ahsan
REGISTERED OFFICE73 Harley Street, Rawalpindi, PakistanTel: (051) 9272196-97, 9270923Fax: (051) 9272198-9E-mail: [email protected]: http://www.ffbl.com
DIRECTORS
SHARES REGISTRARCorplink (Pvt) LimitedWings Arcade, 1-K, Commercial,Model Town, Lahore.Tel: (042) 35839182, 35887262Fax: (042) 35869037
LEGAL ADVISORSOrr Dignam & CoAdvocates,3-A, Street 32,Sector F-8/1, Islamabad.
AUDITORSKPMG Taseer Hadi & CoChartered Accountants6th Floor, State Life Building,Jinnah Avenue, Islamabad.
Company Information

8/7/2019 q3_2010
http://slidepdf.com/reader/full/q32010 3/18
Fauji Fertilizer Bin Qasim Limited2
Operational Highlights
The Board of Directors is pleased to present a brief overview of the operational and nancial performance of the Company for the nine months period ended 30 September 2010.
The overall performance of the plants remained satisfactory during the period. Production of DAP at 476thousand tonnes was higher by 27% against the corresponding period, whereas Ammonia production at 338thousand tonnes and Urea production at 400 thousand tonnes were less by 2% and 11% respectively, againstthe corresponding period owing to the gas curtailment of fertilizer plants by Government of Pakistan (GOP).Initially this curtailment was for a period of three months from May to July which, however, has further beenextended to 31 October 2010.
Marketing Highlights
Urea
The Urea sales of 4,166 thousand tonnes during January to September 2010 are 10% lower than 4,645thousand tonnes sales during the same period of 2009. Heavy rains in August followed by unprecedented
oods throughout the country resulted in very low sales in August & September which resulted in Ureainventory of 809 thousand tonnes at end September compared with 208 thousand tonnes last year.
During the period July to September 2010 Urea market remained oversupplied. Throughout this periodGOP also continued its policy of selling imported Urea through National Fertilizer Marketing Limited andUrea imports of 886 thousand tonnes were made in this period which were high in excess of the domesticrequirement.
The Urea opening inventory of 238 thousand tonnes at the start of 2010 was 70% higher than 140 thousandtonnes opening inventory of 2009. During January to September 2010 Urea production is at 3,841 thousandtonnes, which is 3% higher as compared to 3,739 thousand tonnes production during the same period of 2009. Higher Urea production is mainly due to startup of Fatima Fertilizer Plant. Excluding Fatima Fertilizer,production during this period was lower by 3% as compared to the same period of last year because of gascurtailment to the fertilizer plants.
DAP
Industry DAP market continuously declined during 2010 after a very healthy offtake during the year 2009. TheDAP sales of 665 thousand tonnes by the Industry during January to September 2010 registered a decline of 42% over 1,147 thousand tonnes sales during the corresponding period. DAP offtake of 246 thousand tonnesduring July to September is 46% lower as compared to 641 thousand tonnes sales during the same quarter of 2009. Domestic DAP prices went up by 43% from Rs. 1,760/- per bag ex-Karachi in July 2009 to Rs. 2,510/-per bag ex-Karachi at the end of September 2010 and this had a negative impact on DAP use by the farmers.
However, the domestic DAP sales picked up during the month of September due to the approaching DAPapplication time, rising trend in the international market and likely imposition of ‘Reformed GST’.
DAP inventory of 74 thousand tonnes at the beginning of the year 2010 was 78% lower than the 339 thousandtonnes opening inventory of 2009. DAP production during the nine months period was 476 thousand tonneswhich is 27% higher than 376 thousand tonnes production of the corresponding period. DAP imports were545 thousand tonnes during the period against 589 thousand tonnes imports of the same period last year. Asa result DAP inventory at the end of September 2010 stands at 422 thousand tonnes which is 167% higher as compared to 158 thousand tonnes closing inventory of September 2009.
For the Nine Months Period Ended 30 September 2010
Directors’ Review

8/7/2019 q3_2010
http://slidepdf.com/reader/full/q32010 4/18
Fauji Fertilizer Bin Qasim Limited 3
FFBL Sales Performance
FFBL Sona Urea (G) sales during January to September 2010 were 373 thousand tonnes showing anachievement of 88% against the target. These sales were 15% lower as compared to the sales of 441 thousandtonnes for the same period of 2009. Sona DAP sales during January to September 2010 were 320 thousandtonnes showing an achievement of 114% against the target. These sales were 40% lower as compared to 537thousand tonnes sales of the same period of 2009.
During January to September 2010 FFBL share in Urea and DAP market is estimated at 8.9% and 48.1%respectively.
Financial Highlights
Company’s nancial results have shown a marked improvement during the nine month period of 2010 ascompared to the corresponding period with gross pro t of Rs 6.7 billion at 30 September 2010. Further,owing to better liquidity position, the Company resorted to less utilization of working capital lines bringing 39%
decline in Company’s nance cost during the period by Rs 468 million i.e. Rs 720 million at 30 September 2010against Rs 1,188 million in the corresponding period. Similarly, due to better treasury management on availablefunds, other income surged substantially to Rs 821 million at 30 September 2010 against Rs 13 million in thecorresponding period. This mainly comprises income on bank deposits and mutual funds amounting to Rs 637million in conjunction with share of pro t of PMP amounting Rs 158 million for the period October 2009 – June2010.
Net pro t after tax, as a result of the above stood at Rs 2,931 million at 30 September 2010, higher by 62%against corresponding period pro t of Rs 1,805 million. Resultantly, Company achieved earnings per share(EPS) of Rs 3.14 for nine months period at 30 September 2010 against an EPS of Rs 1.93 in the correspondingperiod.
Pakistan Maroc Phosphore, SA (PMP)
The overall plant performance remained satisfactory during the period under review. Improved internationalselling price of phosphoric acid, stable phos rock price and sustained plant operations remained the mainfactors to keep PMP in pro ts during nine months period from October 2009 to June 2010. The managementexpects PMP to close year 2010 in positive, provided the above factors remain same for second half of year 2010.
Future Outlook
Lower than expected off-takes especially in the third quarter due to unprecedented oods throughout the countryhas resulted in the high inventory situation, in particular to Urea, at September end. Further, the continuousincrease in DAP prices internationally, may result in increase in price of DAP in the country, in coming days.The consequence of the above factors can also be seen as lower than expected off-takes in the fourth quarter as well. In addition, the government also needs to address the issue of ongoing gas curtailment for fertilizer companies by adhering to its commitment of restoring full gas supply to fertilizer plants at the earliest.
Since the Rabi season 2010-11 is about to start in the country, favorable weather and adequate nancialsupport by GOP to farmers both in form of providing subsidized inputs and adequate wheat support price shallbring favorable impact both for the country and the industry.
21 October 2010
For and on behalf of the Board
Lt Gen Hamid Rab Nawaz, HI(M), (Retd)Chairman
8/7/2019 q3_2010
http://slidepdf.com/reader/full/q32010 5/18
Fauji Fertilizer Bin Qasim Limited4
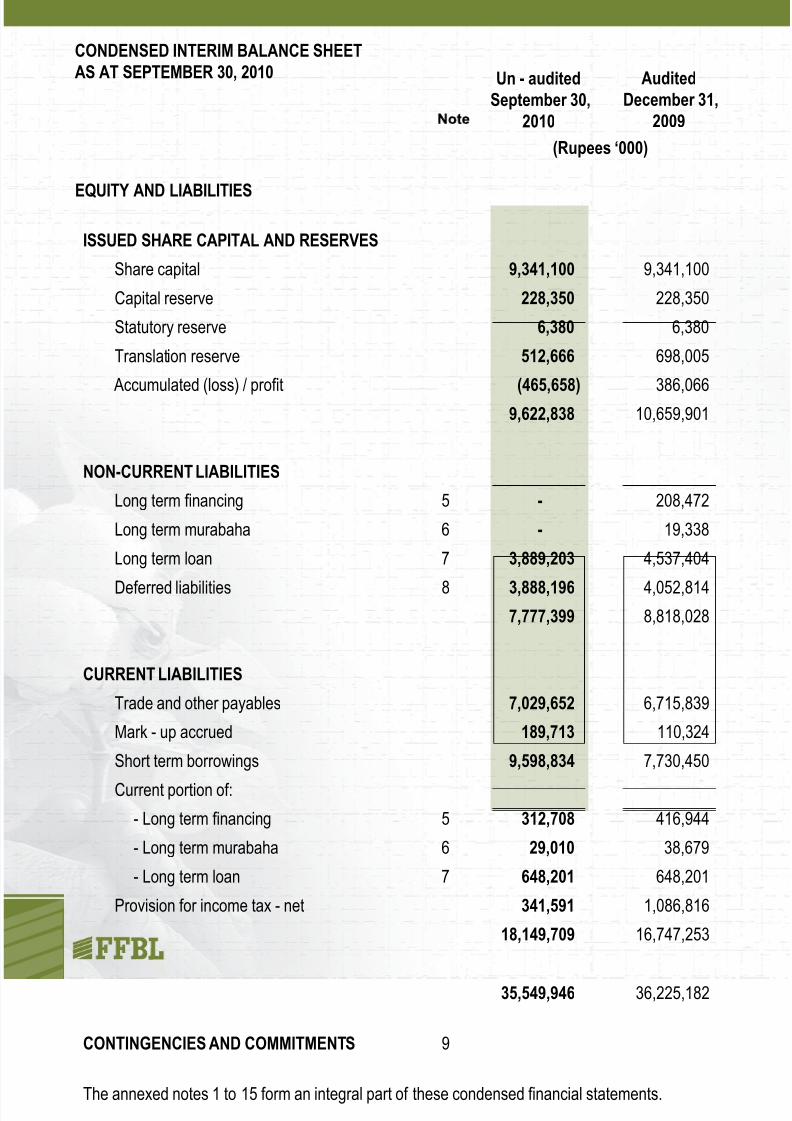
ISSUED SHARE CAPITAL AND RESERVES
Share capital 9,341,100 9,341,100
Capital reserve 228,350 228,350
Statutory reserve 6,380 6,380
Translation reserve 512,666 698,005
Accumulated (loss) / pro t (465,658) 386,0669,622,838 10,659,901
NON-CURRENT LIABILITIES
Long term nancing 5 - 208,472
Long term murabaha 6 - 19,338
Long term loan 7 3,889,203 4,537,404
Deferred liabilities 8 3,888,196 4,052,8147,777,399 8,818,028
CURRENT LIABILITIES
Trade and other payables 7,029,652 6,715,839
Mark - up accrued 189,713 110,324
Short term borrowings 9,598,834 7,730,450
Current portion of:- Long term nancing 5 312,708 416,944
- Long term murabaha 6 29,010 38,679
- Long term loan 7 648,201 648,201
Provision for income tax - net 341,591 1,086,816
18,149,709 16,747,253
35,549,946 36,225,182
CONTINGENCIES AND COMMITMENTS 9
The annexed notes 1 to 15 form an integral part of these condensed nancial statements.
Un - auditedSeptember 30,
2010(Rupees ‘000)
AuditedDecember 31,
2009
CONDENSED INTERIM BALANCE SHEETAS AT SEPTEMBER 30, 2010
EQUITY AND LIABILITIES

8/7/2019 q3_2010
http://slidepdf.com/reader/full/q32010 6/18
Fauji Fertilizer Bin Qasim Limited 5
NON-CURRENT ASSETS
Property, plant and equipment 10 14,916,597 15,576,899
Long term investments 11 2,100,783 2,127,972
Long term deposits 76,312 76,546
17,093,692 17,781,417
CURRENT ASSETS
Stores and spares 1,787,326 1,849,794
Stock in trade 7,045,688 1,227,013
Trade debts 4,614,098 476,728
Advances 133,469 111,353
Trade deposits and short term prepayments 35,838 4,807
Interest accrued 18,069 116,819Other receivables 12,753 230,797
Sales tax refundable 119,487 119,487
Short term investments 750,000 4,658,936
Cash and bank balances 3,939,526 9,648,031
18,456,254 18,443,765
35,549,946 36,225,182
CHAIRMAN CHIEF EXECUTIVE DIRECTOR
Un - auditedSeptember 30,
2010(Rupees ‘000)
AuditedDecember 31,
2009
8/7/2019 q3_2010
http://slidepdf.com/reader/full/q32010 7/18
Fauji Fertilizer Bin Qasim Limited6
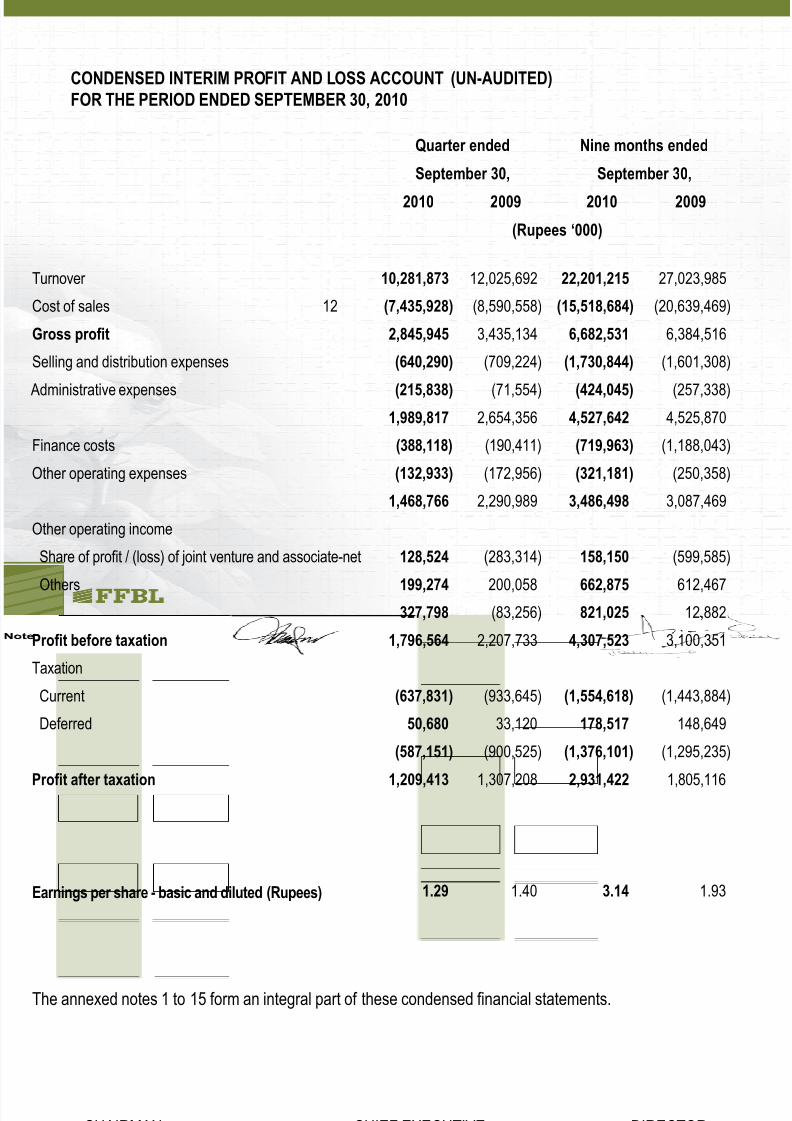
Quarter ended Nine months ended
September 30, September 30,
2010 2009 2010 2009
(Rupees ‘000)
Turnover 10,281,873 12,025,692 22,201,215 27,023,985
Cost of sales 12 (7,435,928) (8,590,558) (15,518,684) (20,639,469)
Gross pro t 2,845,945 3,435,134 6,682,531 6,384,516
Selling and distribution expenses (640,290) (709,224) (1,730,844) (1,601,308)
Administrative expenses (215,838) (71,554) (424,045) (257,338)1,989,817 2,654,356 4,527,642 4,525,870
Finance costs (388,118) (190,411) (719,963) (1,188,043)
Other operating expenses (132,933) (172,956) (321,181) (250,358)
1,468,766 2,290,989 3,486,498 3,087,469
Other operating income
Share of pro t / (loss) of joint venture and associate-net 128,524 (283,314) 158,150 (599,585)
Others 199,274 200,058 662,875 612,467327,798 (83,256) 821,025 12,882
Pro t before taxation 1,796,564 2,207,733 4,307,523 3,100,351
Taxation
Current (637,831) (933,645) (1,554,618) (1,443,884)
Deferred 50,680 33,120 178,517 148,649
(587,151) (900,525) (1,376,101) (1,295,235)
Pro t after taxation 1,209,413 1,307,208 2,931,422 1,805,116
1.29 1.40 3.14 1.93
CONDENSED INTERIM PROFIT AND LOSS ACCOUNT (UN-AUDITED)FOR THE PERIOD ENDED SEPTEMBER 30, 2010
CHAIRMAN CHIEF EXECUTIVE DIRECTOR
The annexed notes 1 to 15 form an integral part of these condensed nancial statements.
Earnings per share - basic and diluted (Rupees)

8/7/2019 q3_2010
http://slidepdf.com/reader/full/q32010 8/18
Fauji Fertilizer Bin Qasim Limited 7
Quarter ended Nine months ended
September 30, September 30,2010 2009 2010 2009
(Rupees ‘000)
Pro t after tax 1,209,413 1,307,208 2,931,422 1,805,116
Other comprehensive income
Exchange difference on translating a joint venture (198,909) 125,345 (185,339) 31,508
Total comprehensive income 1,010,504 1,432,553 2,746,083 1,836,624
The annexed notes 1 to 15 form an integral part of these condensed nancial statements.
CONDENSED INTERIM STATEMENT OF COMPREHENSIVE INCOME (UN-AUDITED)FOR THE PERIOD ENDED SEPTEMBER 30, 2010
CHAIRMAN CHIEF EXECUTIVE DIRECTOR

8/7/2019 q3_2010
http://slidepdf.com/reader/full/q32010 9/18
Fauji Fertilizer Bin Qasim Limited8
CHAIRMAN CHIEF EXECUTIVE DIRECTOR
CONDENSED INTERIM STATEMENT OF CASH FLOWS (UN-AUDITED)FOR THE PERIOD ENDED SEPTEMBER 30, 2010
2010 2009
Note (Rupees ‘000)
CASH FLOWS FROM OPERATING ACTIVITIES
Cash (used in) / generated from operations 13 (4,086,681) 21,183,646Income tax paid (2,299,843) (689,549)
Finance cost paid (583,357) (1,594,487)
Compensated absences paid (6,693) (7,799)
Payment to Workers’ (Pro t) Participation Fund (53,337) (18,891)
Payment to Workers’ Welfare Fund (129,543) -
Net cash (used in) / generated from operating activities (7,159,454) 18,872,920
CASH FLOWS FROM INVESTING ACTIVITIESFixed capital expenditure (294,296) (188,013)
Proceeds from sale of property, plant and equipment 6,992 2,218
Long term deposits 234 -
Short term investments 666,013 (2,699,202)
Pro t received on bank balances 328,721 418,106
Net cash generated from / (used in) investing activities 707,664 (2,466,891)
CASH FLOWS FROM FINANCING ACTIVITIESLong term nancing - repayment (312,708) (312,708)
Long term murabaha - repayment (29,008) (29,009)
Long term loan - repayment (648,201) -
Dividend paid (3,785,182) (2,439,906)
Net cash used in nancing activities (4,775,099) (2,781,623)
Net (decrease) / increase in cash and cash equivalents (11,226,889) 13,624,406
Cash and cash equivalents at the beginning of the period 6,317,581 (10,315,558)
Cash and cash equivalents at the end of the period (4,909,308) 3,308,848
CASH AND CASH EQUIVALENTSCash and cash equivalents included in the cash ow statementcomprises the following balance sheet amounts:- Cash and bank balances 3,939,526 5,419,994
- Short term highly liquid investments 750,000 250,000
- Short term borrowings (9,598,834) (2,361,146)
(4,909,308) 3,308,848
The annexed notes 1 to 15 form an integral part of these condensed nancial statements.

8/7/2019 q3_2010
http://slidepdf.com/reader/full/q32010 10/18
Fauji Fertilizer Bin Qasim Limited 9
CHAIRMAN CHIEF EXECUTIVE DIRECTOR
CONDENSED INTERIM STATEMENT OF CHANGES IN EQUITY (UN-AUDITED)FOR THE PERIOD ENDED SEPTEMBER 30, 2010
Capital reserves
Sharecapital
Capitalreserve
Statutoryreserve
Translationreserve
Accumulatedpro t / (loss) Total
( R u p e e s ‘ 0 0 0 )Balance as at January 01, 2009 9,341,100 228,350 - 572,399 344,522 10,486,371
Total comprehensive income
Pro t for the period after tax - - - - 1,805,116 1,805,116
Other comprehensive income - - - 31,508 - 31,508
Total other comprehensive income for the period - - - 31,508 - 31,508
Total comprehensive income for the period - - - 31,508 1,805,116 1,836,624
Transactions with owners, recorded directly in equityDistributions to owners
Final dividend 2008 (Rs. 2.25 per ordinary share) - - - - (2,101,748) (2,101,748)
First interim dividend 2009 (Rs. 0.50 per ordinary share) - - - - (467,055) (467,055)
Total transactions with owners - - - - (2,568,803) (2,568,803)
Balance as at September 30, 2009 9,341,100 228,350 - 603,907 (419,165) 9,754,192
Balance as at January 01, 2010 9,341,100 228,350 6,380 698,005 386,066 10,659,901
Total comprehensive income
Pro t for the period after tax - - - - 2,931,422 2,931,422
Other comprehensive income - - - (185,339) - (185,339)
Total other comprehensive income for the period - - - (185,339) - (185,339)
Total comprehensive income for the period - - - (185,339) 2,931,422 2,746,083
Transactions with owners, recorded directly in equity
Distributions to owners
Final dividend 2009 (Rs. 2.25 per ordinary share) - - - - (2,101,748) (2,101,748)
First interim dividend 2010 (Rs. 0.50 per ordinary share) - - - - (467,055) (467,055)
2nd interim dividend 2010 (Rs. 1.30 per ordinary share) - - - - (1,214,343) (1,214,343)
Total transactions with owners - - - - (3,783,146) (3,783,146)
Balance as at September 30, 2010 9,341,100 228,350 6,380 512,666 (465,658) 9,622,838
The annexed notes 1 to 15 form an integral part of these condensed nancial statements.

8/7/2019 q3_2010
http://slidepdf.com/reader/full/q32010 11/18
Fauji Fertilizer Bin Qasim Limited10
NOTES TO THE CONDENSED INTERIM FINANCIAL INFORMATION (UN-AUDITED)FOR THE PERIOD ENDED SEPTEMBER 30, 2010
1. Fauji Fertilizer Bin Qasim Limited (“the Company”) is a public limited company incorporated inPakistan under the Companies Ordinance,1984, and its shares are quoted on the Karachi, Lahore andIslamabad stock exchanges in Pakistan. The registered of ce of the Company is situated at Rawalpindi,
Pakistan. The Company is domiciled in Rawalpindi, Pakistan. The principal objective of the Companyis manufacturing, purchasing and marketing of fertilizers including investment in fertilizer raw materialmanufacturing operations. The Company commenced its commercial production effective January 1,2000. The Company is a subsidiary of Fauji Fertilizer Company Limited (the holding company) withshareholding of 50.88%.
2. These nancial statements are un-audited and are being submitted to the shareholders in accordance
with the requirements of Section 245 of the Companies Ordinance, 1984. These condensed interimnancial statements of the Company for the nine months’ period ended September 30, 2010 have
been prepared in accordance with the requirements of the International Accounting Standard - 34:“Interim Financial Reporting” and provisions and directives issued under the Companies Ordinance,1984. In case where the requirements differ, the provisions of or directives issued under the CompaniesOrdinance, 1984 have been followed. These condensed interim nancial statements do not includeall the information required for full annual nancial statements and should be read in conjunction withthe annual nancial statements of the Company for the year ended December 31, 2009. Comparativecondensed interim balance sheet is extracted from annual audited nancial statements for the year ended December 31, 2009 where as comparative condensed interim pro t and loss account, condensedinterim statement of comprehensive income, condensed interim statement of cash ow and condensedinterim statement of changes in equity are stated from unaudited condensed interim nancial statementsfor the nine months’ period ended September 30, 2009.
3. The accounting policies and the methods of computation adopted in preparation of this condensedinterim nancial information are the same as those applied in preparation of nancial statements for theyear ended December 31, 2009. The following standards, amendments and interpretations of approvedaccounting standards became effective durining the period, however these do not have signi cantimpact on the Company’s nancial statements:
-Revised IFRS 3 Business Combinations
-Amended IAS 27 Consolidated and Separate Financial Statements
-Amendments to IFRS 5 Non-current Assets Held for Sale and Discontinued Operations
-Amendments to IAS 39 Financial Instruments: Recognition and Measurement – Eligiblehedged Items
-IFRIC – 17 Distributions of Non-cash Assets to Owners
-Amendments to IFRS 2 Share-based payments and IFRS 3 Business Combinations
-Amendments to IAS 38 Intangible Assets
-Amendments to IFRIC 9 Reassessment of Embedded Derivatives-Amendments to IFRIC 16 Hedges of a Net Investment in a Foreign Operation
-Amendments to IFRS 5 Non-current Assets Held for Sale and Discontinued Operations
-Amendments to IFRS 8 Operating Segments
-Amendments to IAS 1 Presentation of Financial Statements
(effective 1 July 2009)
(effective 1 July 2009)
(effective 1 July 2009)
(effective 1 July 2009)
(effective 1 July 2009)
(effective 1 July 2009)
(effective 1 July 2009)
(effective 1 July 2009)(effective 1 July 2009)
(effective 1 January 2010)
(effective 1 January 2010)
(effective 1 January 2010)
8/7/2019 q3_2010
http://slidepdf.com/reader/full/q32010 12/18
Fauji Fertilizer Bin Qasim Limited 11
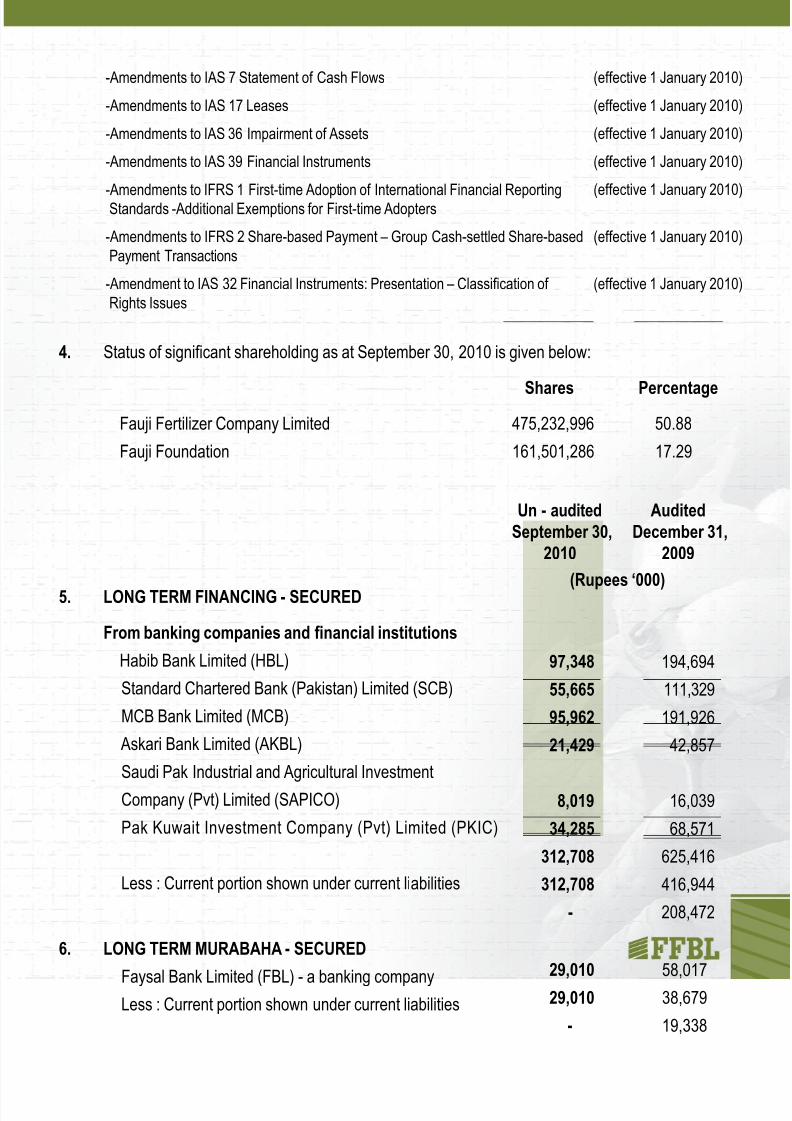
4. Status of signi cant shareholding as at September 30, 2010 is given below:
Shares PercentageFauji Fertilizer Company Limited 475,232,996 50.88
Fauji Foundation 161,501,286 17.29
5. LONG TERM FINANCING - SECURED
From banking companies and nancial institutions
Habib Bank Limited (HBL)
Standard Chartered Bank (Pakistan) Limited (SCB)
MCB Bank Limited (MCB)
Askari Bank Limited (AKBL)
Saudi Pak Industrial and Agricultural Investment
Company (Pvt) Limited (SAPICO)
Pak Kuwait Investment Company (Pvt) Limited (PKIC)
Less : Current portion shown under current liabilities
97,348
55,665
95,962
21,429
8,019
34,285
312,708
312,708
-
29,010
29,010
-
194,694
111,329
191,926
42,857
16,039
68,571
625,416
416,944
208,472
58,017
38,679
19,338
Un - auditedSeptember 30,
2010
(Rupees ‘000)
AuditedDecember 31,
2009
-Amendments to IAS 7 Statement of Cash Flows
-Amendments to IAS 17 Leases
-Amendments to IAS 36 Impairment of Assets
-Amendments to IAS 39 Financial Instruments
-Amendments to IFRS 1 First-time Adoption of International Financial ReportingStandards -Additional Exemptions for First-time Adopters
-Amendments to IFRS 2 Share-based Payment – Group Cash-settled Share-basedPayment Transactions
-Amendment to IAS 32 Financial Instruments: Presentation – Classi cation of Rights Issues
(effective 1 January 2010)
(effective 1 January 2010)
(effective 1 January 2010)
(effective 1 January 2010)
(effective 1 January 2010)
(effective 1 January 2010)
(effective 1 January 2010)
6. LONG TERM MURABAHA - SECURED
Faysal Bank Limited (FBL) - a banking companyLess : Current portion shown under current liabilities

8/7/2019 q3_2010
http://slidepdf.com/reader/full/q32010 13/18
Fauji Fertilizer Bin Qasim Limited12
119,650
25,096
107,208
37,537
494,116
1,529,290
8,577
18,579
9. CONTINGENCIES AND COMMITMENTS
Contingencies
i) Indemnity bonds and undertakings given to the customsauthorities for the machinery imported by the Company for installation at plant site
ii) Guarantees issued by banks on behalf of the Company
iii) Income tax demands raised on income on local currencybank deposits/unrealized exchange gain, which demandshave been challenged and are currently in appeal; theCompany expects favorable outcome in appeal
iv) Company’s share of contingent liabilities of Fauji CementCompany Limited as at June 30, 2010.
Commitments
i) Capital expenditure - contracted.
ii) Letters of credit for purchase of stores, spares and rawmaterials
iii) Company’s share of commitments of Fauji CementCompany Limited as at June 30, 2010.
iv) Company’s share of commitments of PMP as at June 30, 2010.
7. LONG TERM LOAN - UNSECURED
Government of Pakistan (GOP) loan
Deferred Government Assistance
Less: Current portion shown under current liabilities
8. DEFERRED LIABILITIES
Compensated leave absences
Deferred tax 8.1
8.1 The balance of deferred tax is in respect of the followingmajor temporary differences:
Accelerated depreciation
Provision against doubtful advances
Share of pro t of associate
Provision for inventory obsolescence
3,493,342
1,044,0624,537,404
648,201
3,889,203
157,707
3,730,489
3,888,196
3,812,777
(18,734)
3,266
(66,820)
3,730,489
3,870,599
1,315,0065,185,605
648,201
4,537,404
143,808
3,909,006
4,052,814
3,994,365
(18,734)
3,198
(69,823)
3,909,006
119,650
30,031
36,668
37,537
141,727
1,381,137
60,315
43,379
Un - auditedSeptember 30,
2010(Rupees ‘000)
AuditedDecember 31,
2009

8/7/2019 q3_2010
http://slidepdf.com/reader/full/q32010 14/18
Fauji Fertilizer Bin Qasim Limited 13
15,576,899
294,296
(10,198)
(6,008)
(943,223)
4,831
14,916,597
1,795,989
157,474
-
(185,339)
1,768,124
331,983
676
332,659
3,000(3,000)
2,100,783
10. PROPERTY, PLANT AND EQUIPMENT
Opening written down value
Additions
Disposals
Adjustments - net
Depreciation
Depreciation on disposed off items
Closing written down value
11. LONG TERM INVESTMENTS
Investment in joint venture - equity method
Pakistan Maroc Phosphore S.A, Morocco (PMP)
Balance brought forward
Share of pro t / (loss)
Dividend declared
(Loss) / gain on translation of net assets
Closing balance
Investment in associate - equity method
Fauji Cement Company Limited (FCCL)
Balance brought forward
Share of pro t
Closing balance 11.1
Investment - available for sale - unquoted
Arabian Sea Country Club LimitedLess: Impairment in value of investment
15,847,104
956,126
(18,742)
(4,200)
(1,216,759)
13,370
15,576,899
2,105,894
(336,015)
(99,496)
125,606
1,795,989
310,876
21,107
331,983
3,000(3,000)
2,127,972
Un - auditedSeptember 30,
2010(Rupees ‘000)
AuditedDecember 31,
2009
11.1 Fair value of the investment in FCCL as at September 30, 2010 was Rs. 87.94 million(December 31, 2009: Rs. 115.50 million).

8/7/2019 q3_2010
http://slidepdf.com/reader/full/q32010 15/18
Fauji Fertilizer Bin Qasim Limited14
Quarter endedSeptember 30,
Nine months endedSeptember 30,
2010 2009(Rupees ‘000)
2010 2009(Rupees ‘000)
COST OF SALES
Raw materials consumed 6,410,087 4,112,113 16,380,138 11,258,479
Packing materials consumed 129,872 120,434 410,800 317,497
Fuel and power 670,028 515,870 1,741,916 1,481,590
Chemicals and supplies consumed 39,671 41,500 110,913 128,270
Salaries, wages and bene ts 390,732 209,582 822,933 661,876
Rent, rates and taxes 4,981 6,100 19,542 18,170
Insurance 20,477 17,880 59,979 52,290
Travel and conveyance 2,013 13,111 38,755 39,542
Repairs and maintenance 98,445 135,682 733,934 588,373
Communication, establishment and others 18,857 10,186 39,115 28,082
Depreciation 304,606 300,920 930,377 899,609
Opening stock -work in process 8,270 15,048 5,140 3,602
Closing stock -work in process (6,521) (30,459) (6,521) (30,459)
Cost of goods manufactured 8,091,518 5,467,967 21,287,021 15,446,921
Opening stock -own manufactured fertilizers 5,283,673 3,513,503 170,926 5,583,460
Closing stock - own manufactured fertilizers (5,939,263) (390,912) (5,939,263) (390,912)
Cost of sales - own manufactured fertilizers 7,435,928 8,590,558 15,518,684 20,639,469
12.

8/7/2019 q3_2010
http://slidepdf.com/reader/full/q32010 16/18
Fauji Fertilizer Bin Qasim Limited 15
29,922
100,436
26,253
167,513
82,395
-
902,913
1,087,607
(384,569)
599,585
(196,856)
(1,817)
5,513,733
(412,398)
3,893,392
(7,736)
(11,209)(21,225)
12,486,367
(257,321)
43
15,669,913
21,183,646
Nine months ended September 30,
2010 2009(Rupees ‘000)
3,100,3514,307,523
13. CASH GENERATED FROM OPERATIONS
Pro t before taxation
Adjustment for:
Provision for gratuity
Exchange loss
Provision for compensated absences
Provision for Workers’ (Pro t) Participation Fund
Provision for Workers’ Welfare Fund
Property, plant and equipment adjustmentDepreciation
Finance cost
Pro t on bank balances
Share of (pro t) / loss of associate and joint venture
Gain on sale of investments
Gain on sale of property, plant and equipment
Operating pro t before working capital changes
Changes in working capital
Stores and spares
Stock in trade
Trade debts
AdvancesTrade deposits and short term prepayments
Other receivables
Trade and other payables
Sales tax
Cash (used in) / generated from operations
25,061
56,183
20,592
231,331
87,766
6,008943,223
663,780
(229,971)
(158,150)
(407,077)
(1,625)
5,544,644
62,469
(5,818,676)
(4,137,370)
(22,116)(31,030)
218,044
97,354
-
(9,631,325)
(4,086,681)

8/7/2019 q3_2010
http://slidepdf.com/reader/full/q32010 17/18
Fauji Fertilizer Bin Qasim Limited16
356,825
2,262
19,556
1,306,891
161,203
574
689
444,129
-
449,989
870
13,848
1,924,694
4,614,098
2,469
758
654,080
1,833
Nine months ended September 30,
14. RELATED PARTY TRANSACTIONS
Transaction with the holding company
Services and material acquired
Services and material provided
Commission charged to the Company
Dividend paid
Balance receivable -unsecured
Transaction with associated undertakings due to commondirectorship
Goods sold
Rent charged to the Company
Dividend paid
Balance receivable at the period end-unsecured
Transaction with joint venture company
Purchase of raw materials
Expenses incurred on behalf of joint venture company
Balance payable - secured
Balance receivable - secured
Other related parties
Contribution to Provident Fund
Contribution to Gratuity FundRemuneration including bene ts and perquisites of Chief Executive Of cer and executives.No of persons September 30, 2010 : 1 and 172.(September 30, 2009 : 1 and 156)
Payment to Workers’ (Pro t) Participation Fund
Payment to Workers’ Welfare Fund
Balance payable - unsecured
10,158,079
124,550
2,412,237
11,005
16,902
29,922
429,340
18,891
-
333,291
13,728,696
17,638
3,792,374
11,207
20,290
25,062
619,745
53,337
129,543
470,543
* Balance of accounts appearing as comparatives are as at December 31, 2009.
15. General
15.1 Figures have been rounded off to the nearest thousand rupees.
15.2 These nancial statements were authorized for issue by the Board of Directors of the Company intheir meeting held on October 21, 2010.
15.3 The Board of Directors in their meeting held on October 21, 2010 have proposed an interim dividendof Rs 1.25 per ordinary share.
CHAIRMAN CHIEF EXECUTIVE DIRECTOR

8/7/2019 q3_2010
http://slidepdf.com/reader/full/q32010 18/18


