30
Q4 2013 Earnings Call Webcast February 19, 2014

Q4 2013 Earnings Call Webcast
February 19, 2014
Safe Harbor StatementThese materials include forward-looking statements. These statements are based on the current expectations of Garmin Ltd. and are naturally subject to uncertainty and changes in circumstances. Forward-looking statementsto uncertainty and changes in circumstances. Forward looking statements include, without limitation, statements containing words such as "proposed" and “intends” or “intended” and "expects" or "expected." By their nature, forward-looking statements involve risk and uncertainty because they relate to events and depend on circumstances that willbecause they relate to events and depend on circumstances that will occur in the future. There are a number of factors that could cause actual results and developments to differ materially from those expressed or implied by such forward-looking statements. Other unknown or p y gunpredictable factors could cause actual results to differ materially from those in the forward-looking statements. These factors include those discussed or identified in the filing by Garmin Ltd. with the U.S. Securities and Exchange Commission in its Annual Report on Form 10 K Garminand Exchange Commission in its Annual Report on Form 10-K. Garmin Ltd. does not undertake any obligation to update publicly or revise forward-looking statements, whether as a result of new information, future events or otherwise, except to the extent legally required.
1
Business Update
Cliff PemblePresident and CEOPresident and CEO
2
4th Quarter Financial Review Strong revenue and margin performance leading
to pro forma EPS growth
• Outdoor, fitness, aviation and marine segments combined grew 14% and contributed 50% of total revenue
• Gross and operating margin of 52% and 23%, respectively
• Operating expenses decreased 1% though R&D investment continued to grow
• Operating income growth in all segmentsp g g g
• Free cash flow of $135 million3

2013 Financial Review Record annual revenues in our growth segments
of outdoor, fitness, aviation and marine
• Consolidated revenue of over $2.6 billion, down 3%
• Gross and operating margins stable at 53% and• Gross and operating margins stable at 53% and 22%, respectively
• Outdoor fitness aviation and marine segments• Outdoor, fitness, aviation and marine segments combined contributed 51% and 67% of total revenue and operating income, respectively
• Generated $574 million of free cash flow
4
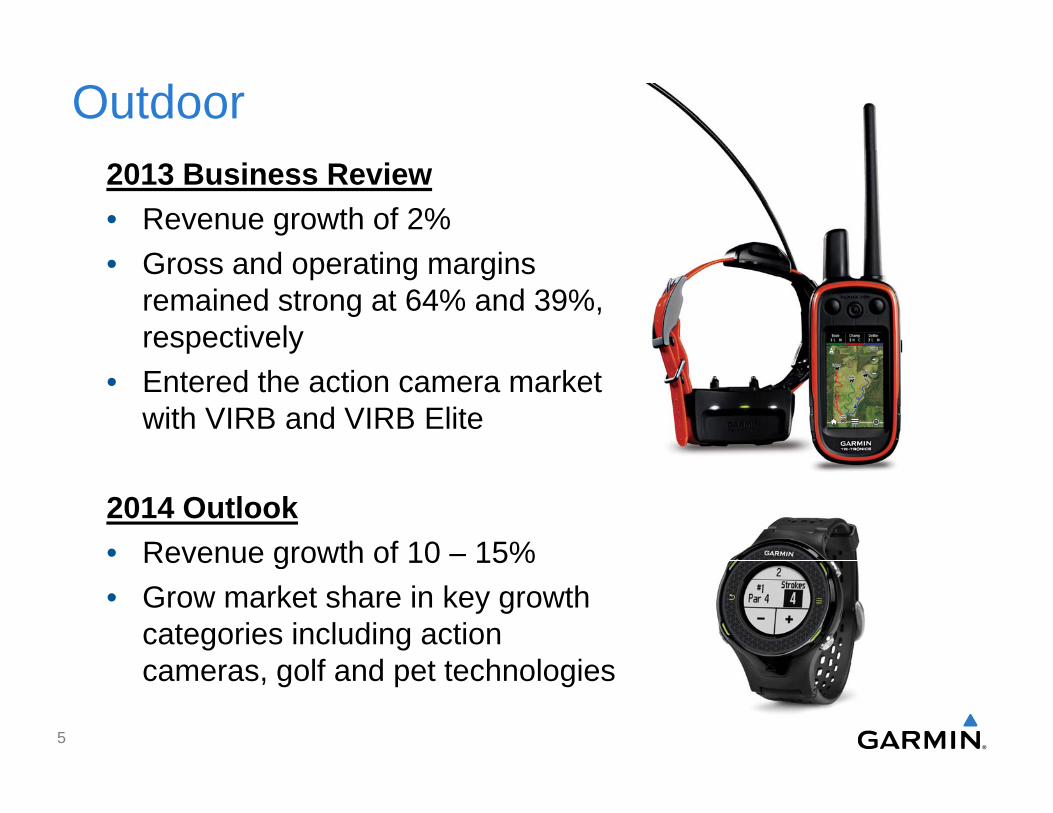
Outdoor2013 Business Review• Revenue growth of 2%
G d ti i• Gross and operating margins remained strong at 64% and 39%, respectively
• Entered the action camera market with VIRB and VIRB Elite
2014 Outlook• Revenue growth of 10 – 15%Revenue growth of 10 15%• Grow market share in key growth
categories including action lf d t t h l icameras, golf and pet technologies
5

OutdoorLong-term Strategic Initiatives• Continue to identify adjacent
k t d l th t thmarkets and leverage the strength of the Garmin brand to expand our addressable market
• Innovate in the action camera market to drive market share gains
• Deliver superior technologies• Deliver superior technologies through compelling form factors and content
• Embrace mobile platforms to expand the essential nature of our productsp oduc s
6
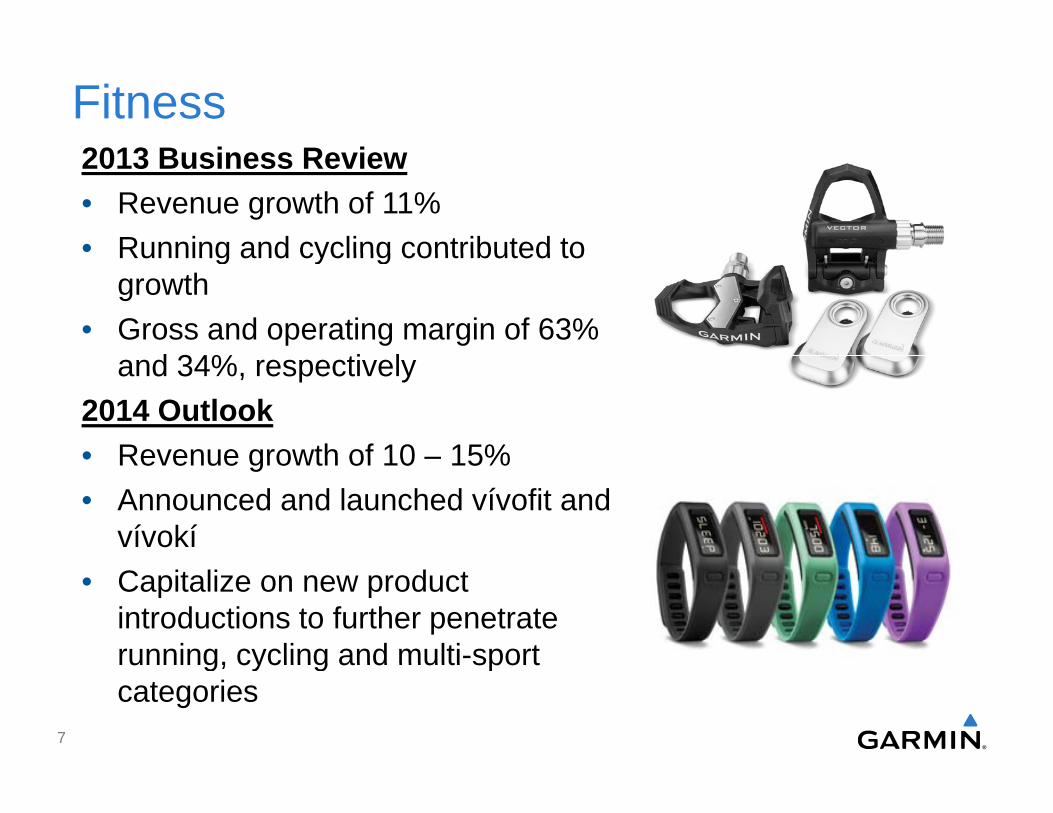
Fitness2013 B i R i2013 Business Review• Revenue growth of 11%• Running and cycling contributed toRunning and cycling contributed to
growth • Gross and operating margin of 63%
d 34% ti land 34%, respectively2014 Outlook• Revenue growth of 10 – 15%• Revenue growth of 10 – 15%• Announced and launched vívofit and
vívokí• Capitalize on new product
introductions to further penetrate running, cycling and multi-sportrunning, cycling and multi sport categories
7

FitnessLong-term Strategic Initiatives• Build innovative next-
ti i dgeneration running and cycling products to drive deeper penetration and strong replacement demand
• Leverage connectivity capabilities and the newlycapabilities and the newly designed Garmin Connect to build community and social networking amongst usersnetworking amongst users
• Gain share in the activity monitor market with industry leading utility and form factors
8

Aviation 2013 Business ReviewF ll th f 16%• Full year revenue growth of 16%
• Operating income growth of 20% with gross and operating margin g p g gimprovement
• First Part 25 certifications with Cessna and BombardierCessna and Bombardier
2014 OutlookR th f 10 15%• Revenue growth of 10 – 15%
• Supporting our numerous OEM partners in the completion of p paircraft certifications and system enhancements
• Capitalize on market share gains• Capitalize on market share gains and aftermarket opportunities
9
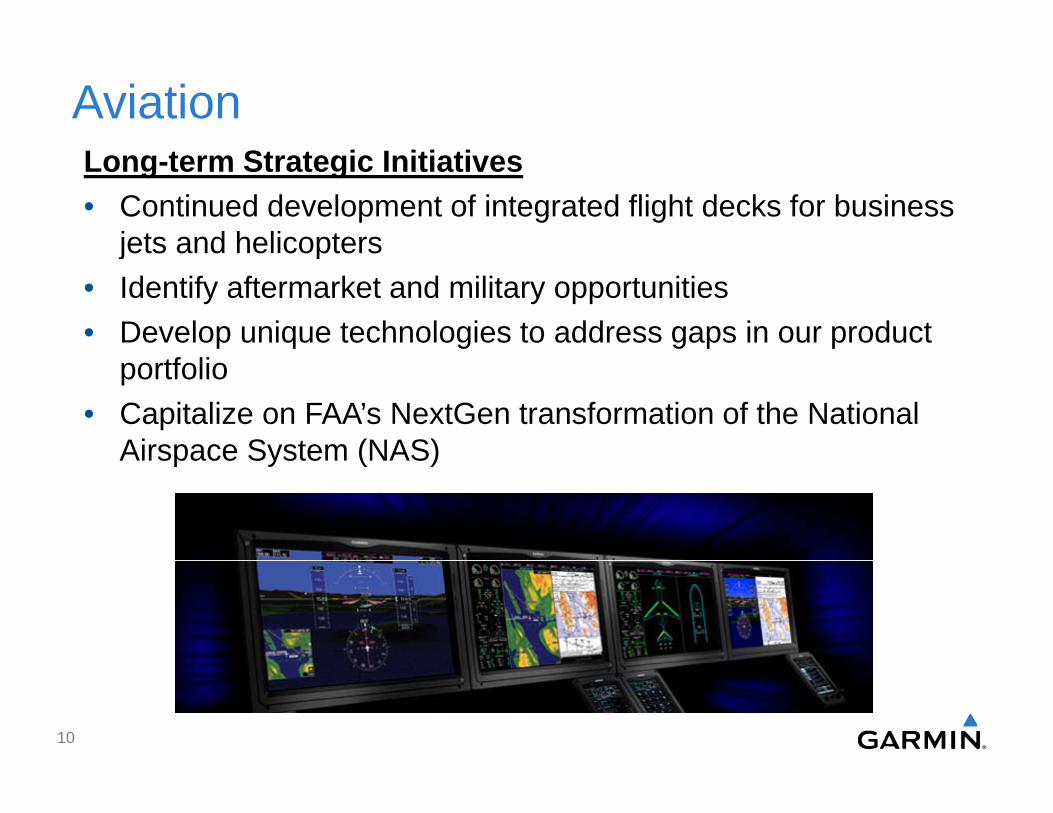
AviationL t St t i I iti tiLong-term Strategic Initiatives• Continued development of integrated flight decks for business
jets and helicoptersjets and helicopters• Identify aftermarket and military opportunities• Develop unique technologies to address gaps in our product
portfolio• Capitalize on FAA’s NextGen transformation of the National
Airspace System (NAS)Airspace System (NAS)
10

Marine2013 B i R i2013 Business Review• Revenue growth of 7% as
results improved in the second phalf with new product introductions
• Competitive pricing and product• Competitive pricing and product mix pressuring profitability
2014 Outlook2014 Outlook• Revenue growth of 10 – 15%• 2014 product portfolio delivered p p
early in the marine season creating market share and profitability improvementprofitability improvement opportunities
11
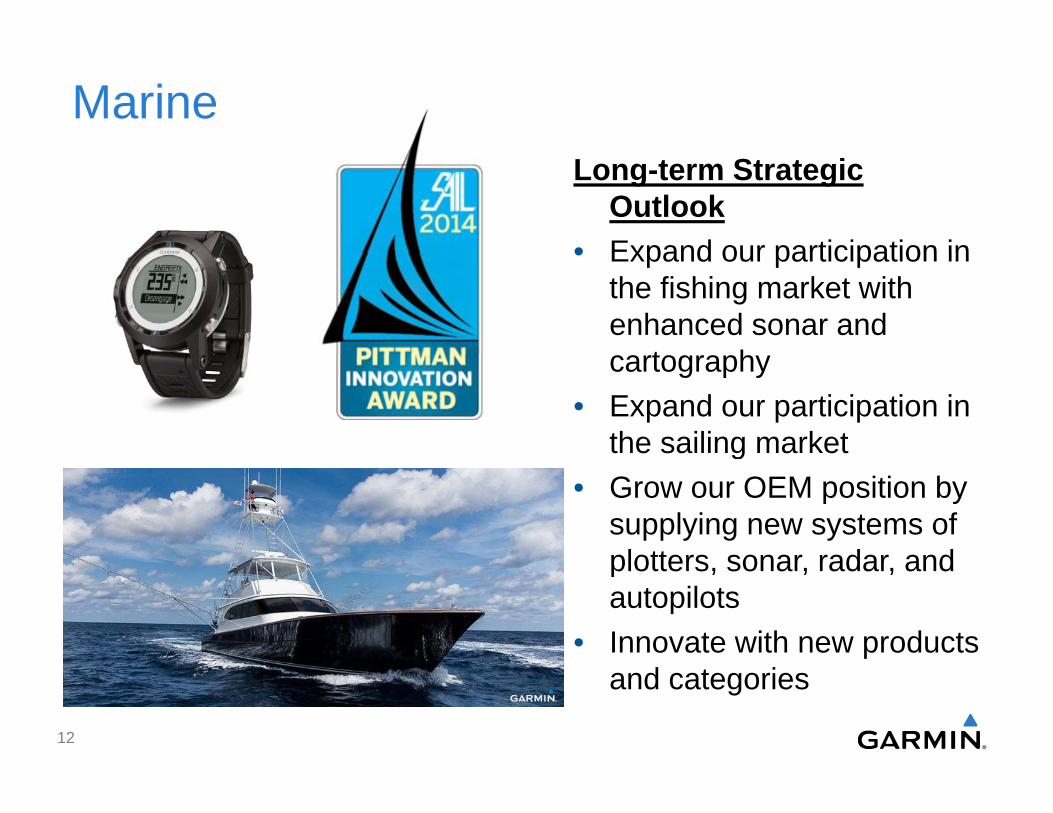
MarineLong-term Strategic
Outlook• Expand our participation in• Expand our participation in
the fishing market with enhanced sonar and cartographcartography
• Expand our participation in the sailing market g
• Grow our OEM position by supplying new systems of plotters sonar radar andplotters, sonar, radar, and autopilots
• Innovate with new products and categories
12
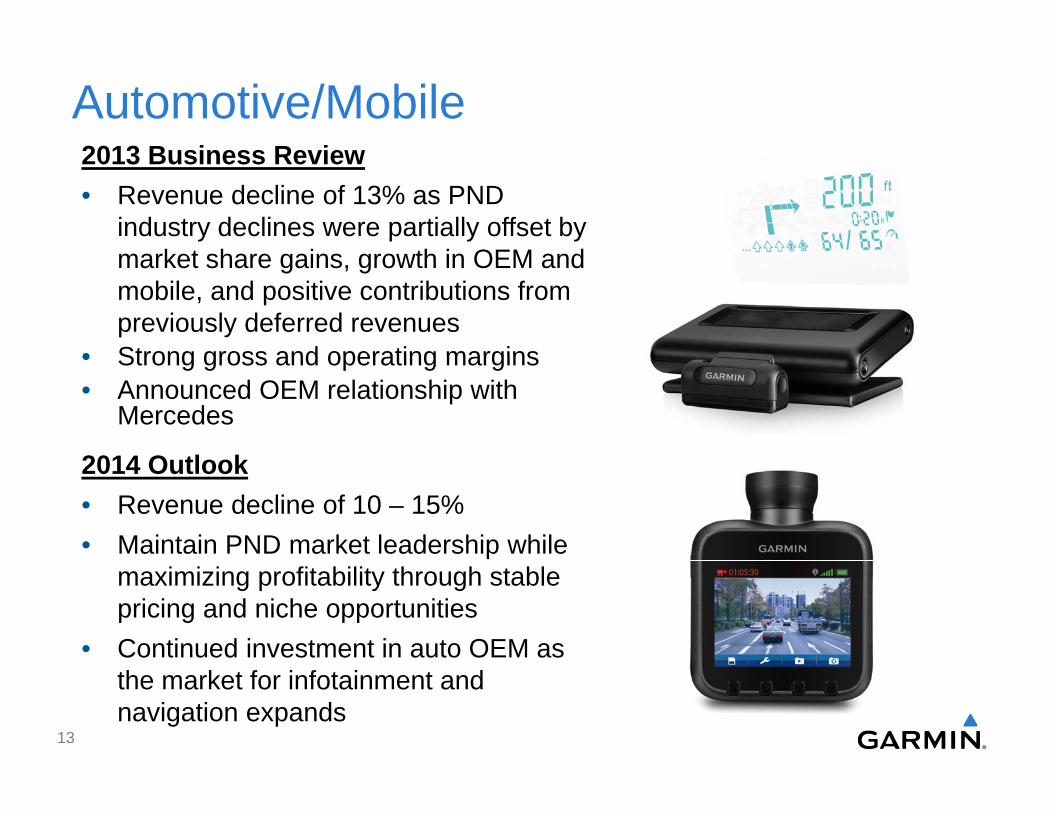
Automotive/Mobile2013 B siness Re ie2013 Business Review• Revenue decline of 13% as PND
industry declines were partially offset by k t h i th i OEM dmarket share gains, growth in OEM and
mobile, and positive contributions from previously deferred revenues
• Strong gross and operating margins• Strong gross and operating margins• Announced OEM relationship with
Mercedes
2014 O tl k2014 Outlook• Revenue decline of 10 – 15%• Maintain PND market leadership while
maximizing profitability through stable pricing and niche opportunities
• Continued investment in auto OEM as the market for infotainment and navigation expands
13
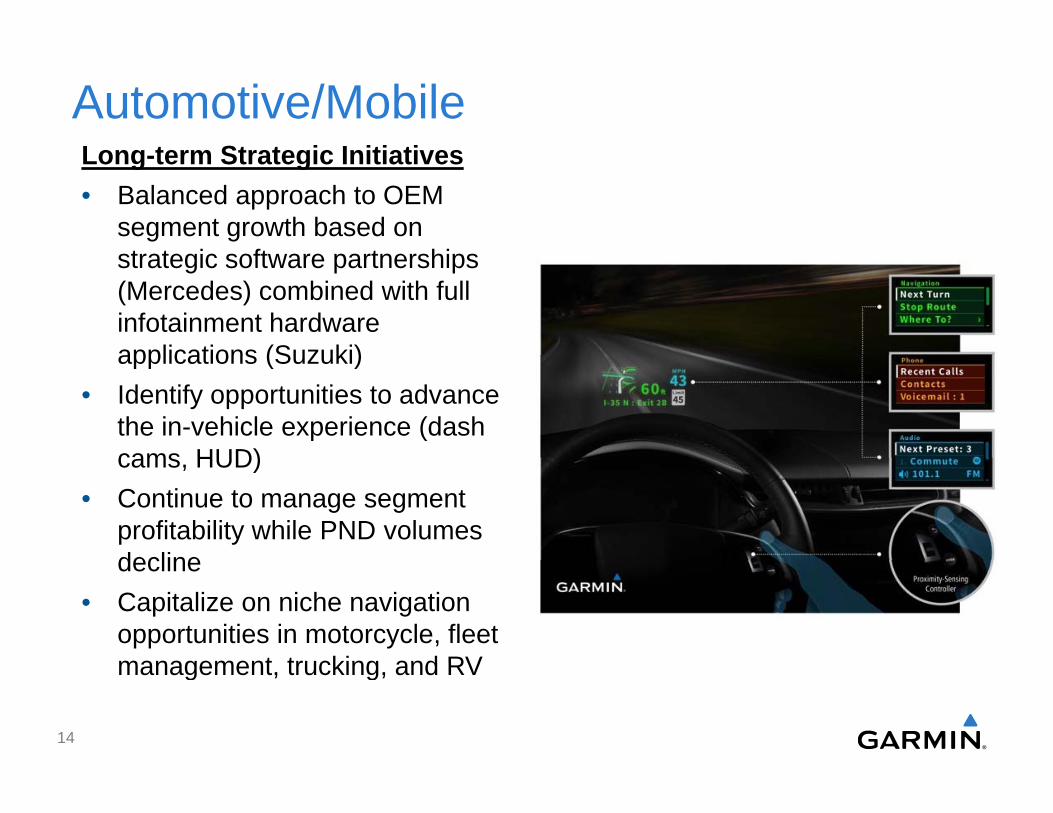
Automotive/MobileLong term Strategic Initiati esLong-term Strategic Initiatives• Balanced approach to OEM
segment growth based on t t i ft t histrategic software partnerships
(Mercedes) combined with full infotainment hardware applications (Suzuki)applications (Suzuki)
• Identify opportunities to advance the in-vehicle experience (dash cams HUD)cams, HUD)
• Continue to manage segment profitability while PND volumes declinedecline
• Capitalize on niche navigation opportunities in motorcycle, fleet management trucking and RVmanagement, trucking, and RV
14
2014 Guidance
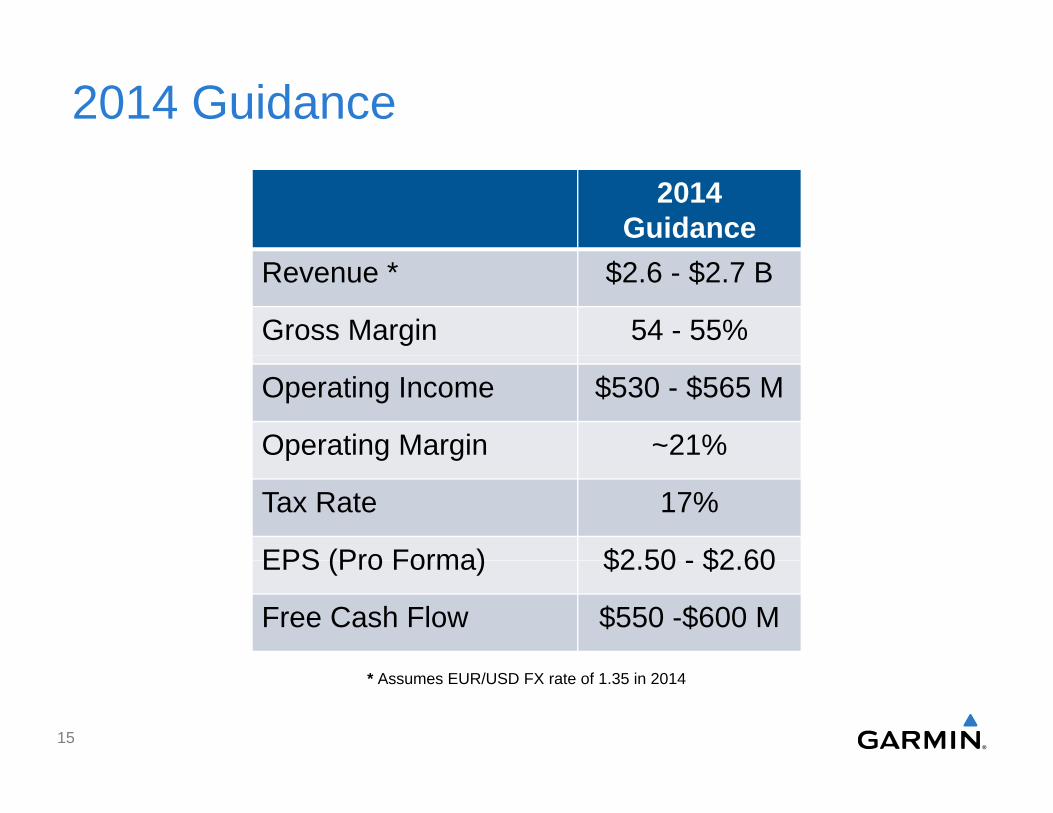
2014 Guidance
Revenue * $2.6 - $2.7 B
Gross Margin 54 - 55%
Operating Income $530 - $565 M
Operating Margin ~21%p g g
Tax Rate 17%
EPS (Pro Forma) $2 50 $2 60EPS (Pro Forma) $2.50 - $2.60
Free Cash Flow $550 -$600 M
* Assumes EUR/USD FX rate of 1.35 in 2014
15

Financial Update
Kevin RauckmanCFO and TreasurerCFO and Treasurer
16
Q4 Income Statement
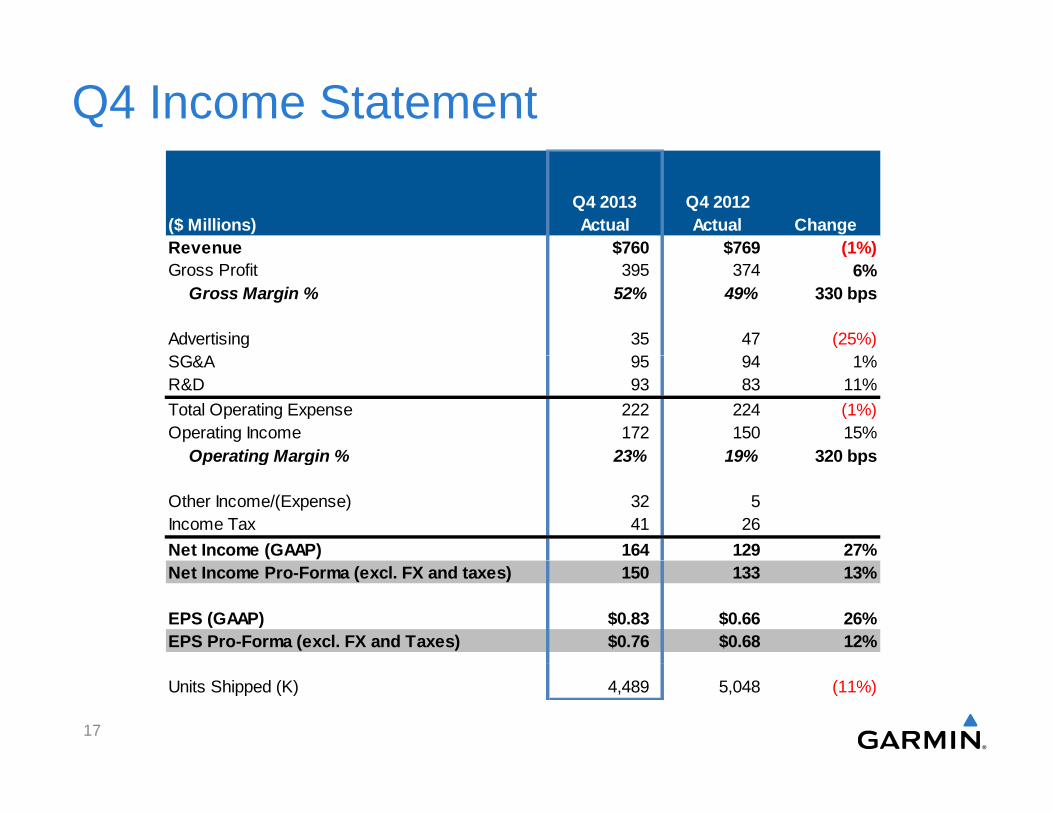
Q4 2013 Q4 2012($ Millions) Actual Actual ChangeRevenue $760 $769 (1%)Revenue $760 $769 (1%)Gross Profit 395 374 6%
Gross Margin % 52% 49% 330 bps
Advertising 35 47 (25%)SG&A 95 94 1%SG&A 95 94 1%R&D 93 83 11%Total Operating Expense 222 224 (1%)Operating Income 172 150 15%
Operating Margin % 23% 19% 320 bpsOperating Margin % 23% 19% 320 bps
Other Income/(Expense) 32 5Income Tax 41 26Net Income (GAAP) 164 129 27%Net Income Pro-Forma (excl. FX and taxes) 150 133 13%
EPS (GAAP) $0.83 $0.66 26%EPS Pro-Forma (excl. FX and Taxes) $0.76 $0.68 12%
17
Units Shipped (K) 4,489 5,048 (11%)
2013 Income Statement
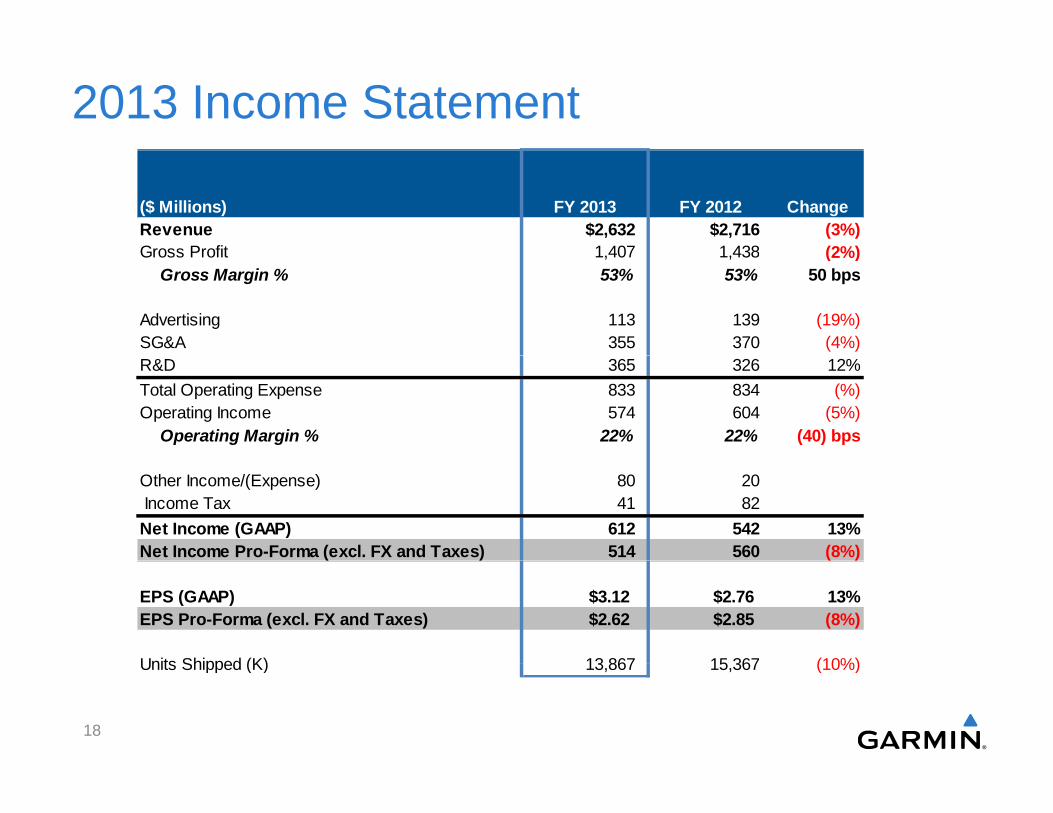
($ Millions) FY 2013 FY 2012 ChangeRevenue $2,632 $2,716 (3%)Gross Profit 1 407 1 438 (2%)Gross Profit 1,407 1,438 (2%)
Gross Margin % 53% 53% 50 bps
Advertising 113 139 (19%)SG&A 355 370 (4%)R&D 365 326 12%Total Operating Expense 833 834 (%)Operating Income 574 604 (5%)
Operating Margin % 22% 22% (40) bps
Other Income/(Expense) 80 20 Income Tax 41 82Net Income (GAAP) 612 542 13%Net Income Pro-Forma (excl. FX and Taxes) 514 560 (8%)( ) ( )
EPS (GAAP) $3.12 $2.76 13%EPS Pro-Forma (excl. FX and Taxes) $2.62 $2.85 (8%)
Units Shipped (K) 13 867 15 367 (10%)
18
Units Shipped (K) 13,867 15,367 (10%)
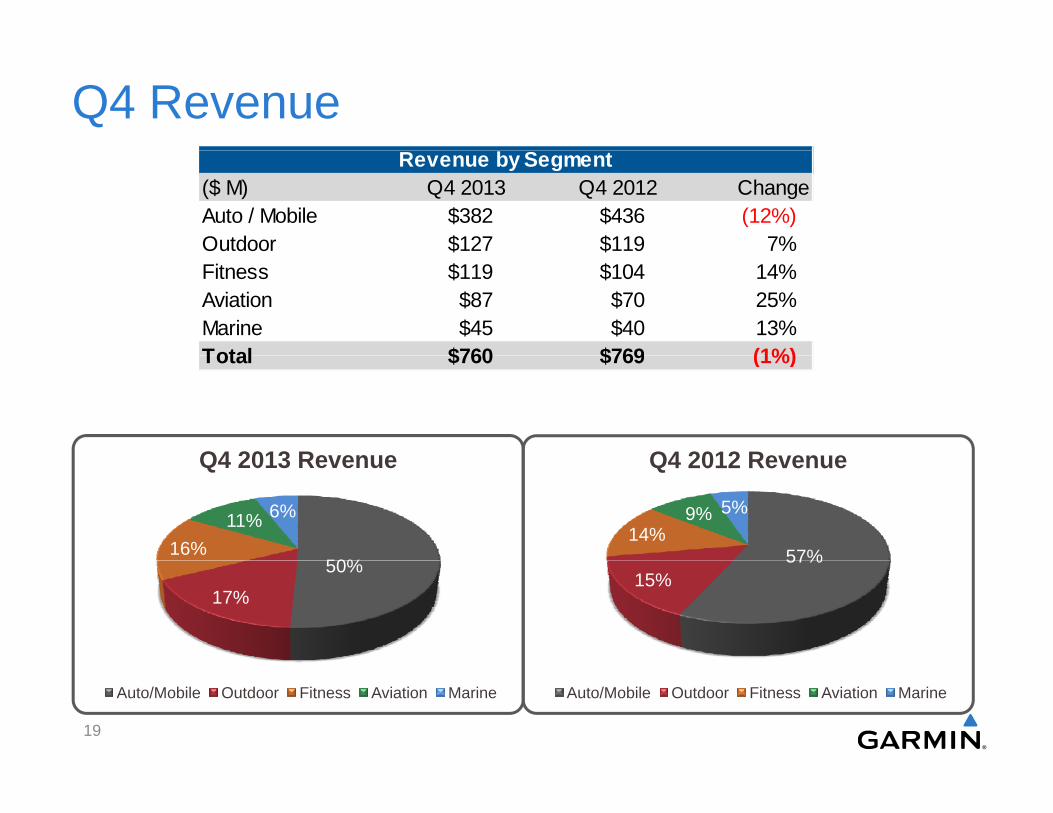
Q4 Revenue($ M) Q4 2013 Q4 2012 ChangeAuto / Mobile $382 $436 (12%)Outdoor $127 $119 7%
Revenue by Segment
$ $Fitness $119 $104 14%Aviation $87 $70 25%Marine $45 $40 13%Total $760 $769 (1%)
Q4 2013 Revenue Q4 2012 Revenue
Total $760 $769 (1%)
50%16%
11% 6%
Q4 2013 Revenue
57%14%
9% 5%
Q4 2012 Revenue
50%
17%
57%15%
19
Auto/Mobile Outdoor Fitness Aviation Marine Auto/Mobile Outdoor Fitness Aviation Marine

Q4 Operating Income
31%26%
13% 1%
Q4 2013 Operating Income
34%24%
12%-1%
Q4 2012 Operating Income
29%
26%
31%
24%
Auto/Mobile Outdoor Fitness Aviation Marine Auto/Mobile Outdoor Fitness Aviation Marine
Margin Reviewg• Gross margin of 52% in Q4 2013 - improvement from 49% in Q4 2012 -
due to segment mix and improving gross margins in all segments excluding outdoor
• New products contributing in fitness and marine; reduced deferred revenue impact contributing in auto/mobile
• Operating margin improved from 19% to 23% driven primarily by the
20
p g g p p y ygross margin improvement
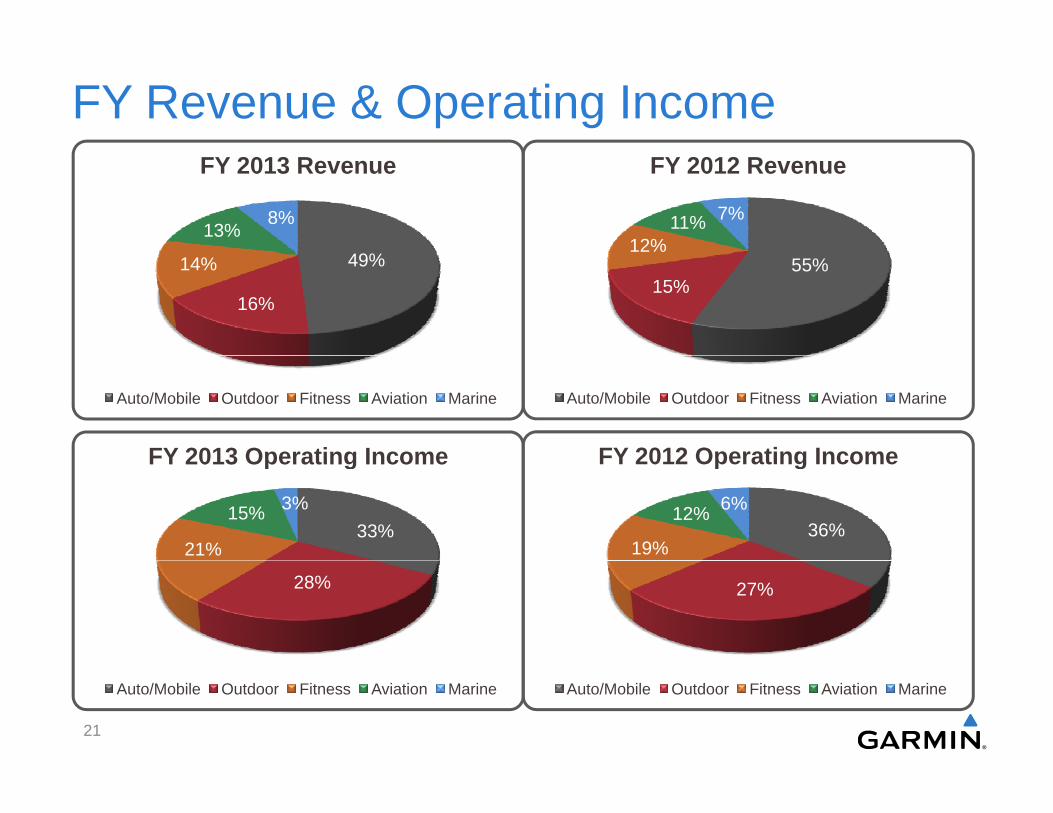
FY Revenue & Operating Income
%13%
8%
FY 2013 Revenue
12%11% 7%
FY 2012 Revenue
49%
16%
14% 55%15%
Auto/Mobile Outdoor Fitness Aviation Marine Auto/Mobile Outdoor Fitness Aviation Marine
FY 2013 Operating Income FY 2012 Operating Income
33%21%
15% 3%
FY 2013 Operating Income
36%19%
12% 6%
FY 2012 Operating Income
28% 27%
21
Auto/Mobile Outdoor Fitness Aviation Marine Auto/Mobile Outdoor Fitness Aviation Marine

Q4 Operating Expenses
R&D ($M) Advertising ($M) SG&A ($M)
83 88 96
88 93
80
100
80
100 g
94 86 88 86
95
80
100
40
60 47
2229 26
35 40
60
40
60
-
20
Q4 Q1 Q2 Q3 Q4
22
-
20
Q4 Q1 Q2 Q3 Q4-
20
Q4 Q1 Q2 Q3 Q4Q4 12
Q1 13
Q2 13
Q3 13
Q4 13
Q4 12
Q1 13
Q2 13
Q3 13
Q4 13
Q4 12
Q1 13
Q2 13
Q3 13
Q4 13
22
Balance Sheet/Cash FlowBalance Sheet
• Ended quarter with over $2.8 billion of cash and marketable securitiessecu es
• Accounts receivable increased sequentially in the holiday quarter but declined from the prior year
• Inventory balance decreased on a sequential and year-over-year basis
Cash FlowCash Flow
• Continued strong cash flow with $150 million of operating cash and $135 million of free cash flow in the quarter
• Repurchased $31 million in company stock; repurchase authorization remains in effect and management intends to repurchase shares in 2014
23
Taxes / DividendsTaxes
• Q4 2013 effective tax rate was 20.0% compared to 16.5% in prior yearyear
• 2013 pro forma tax rate was 16.8% compared to 13.1% in 2012
• Expect 2014 rate to be stable with 2013 full year pro forma rateExpect 2014 rate to be stable with 2013 full year pro forma rate
Dividend
• Dividend of $0 45 per share to be paid at close of March 2014Dividend of $0.45 per share to be paid at close of March 2014
• Seeking shareholder approval for $0.48 per share quarterly dividend beginning in June 2014
24
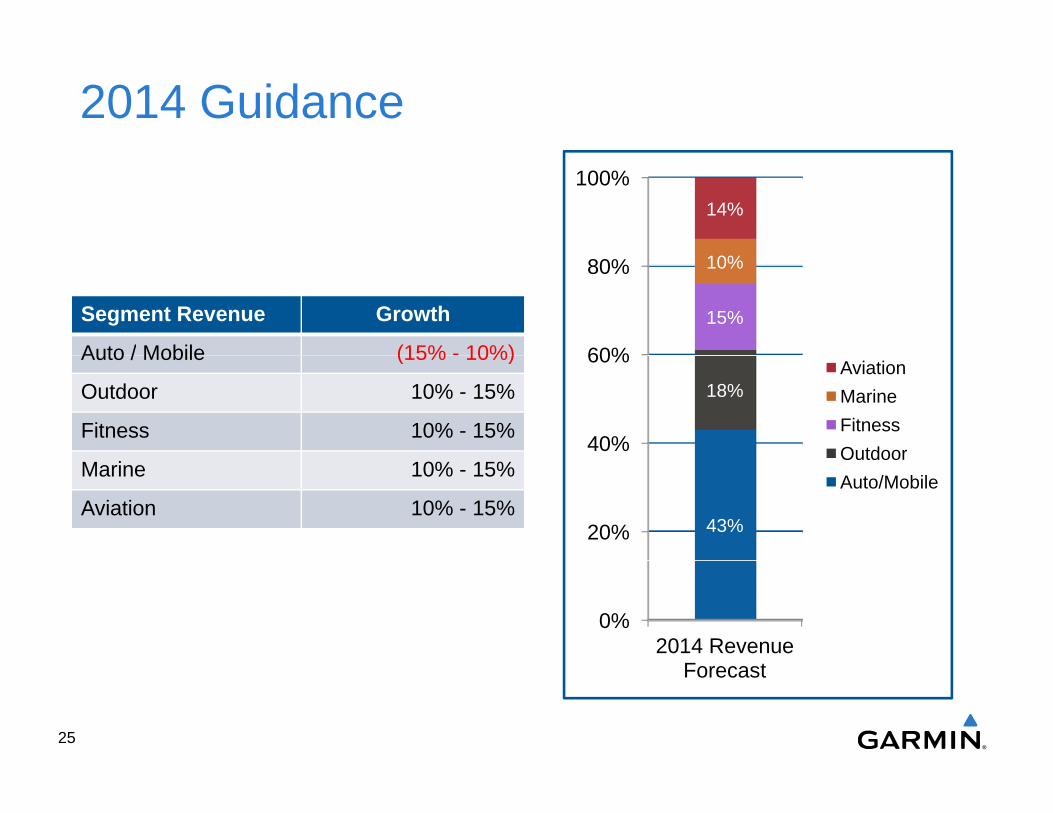
2014 Guidance100%
14% Growth segments to represent 52% of revenue in 2013
60%
80%
15%
10%
Segment Revenue Growth
Auto / Mobile (15% - 10%)
of revenue in 2013
40%
60%18%
AviationMarineFitnessOutdoor
Auto / Mobile (15% 10%)
Outdoor 10% - 15%
Fitness 10% - 15%
20% 43%
OutdoorAuto/MobileMarine 10% - 15%
Aviation 10% - 15%
0%2014 Revenue
F t
25
Forecast

Q4 2013 Earnings Call Webcast
February 19, 2014

AppendixFebruary 19, 2014February 19, 2014
27
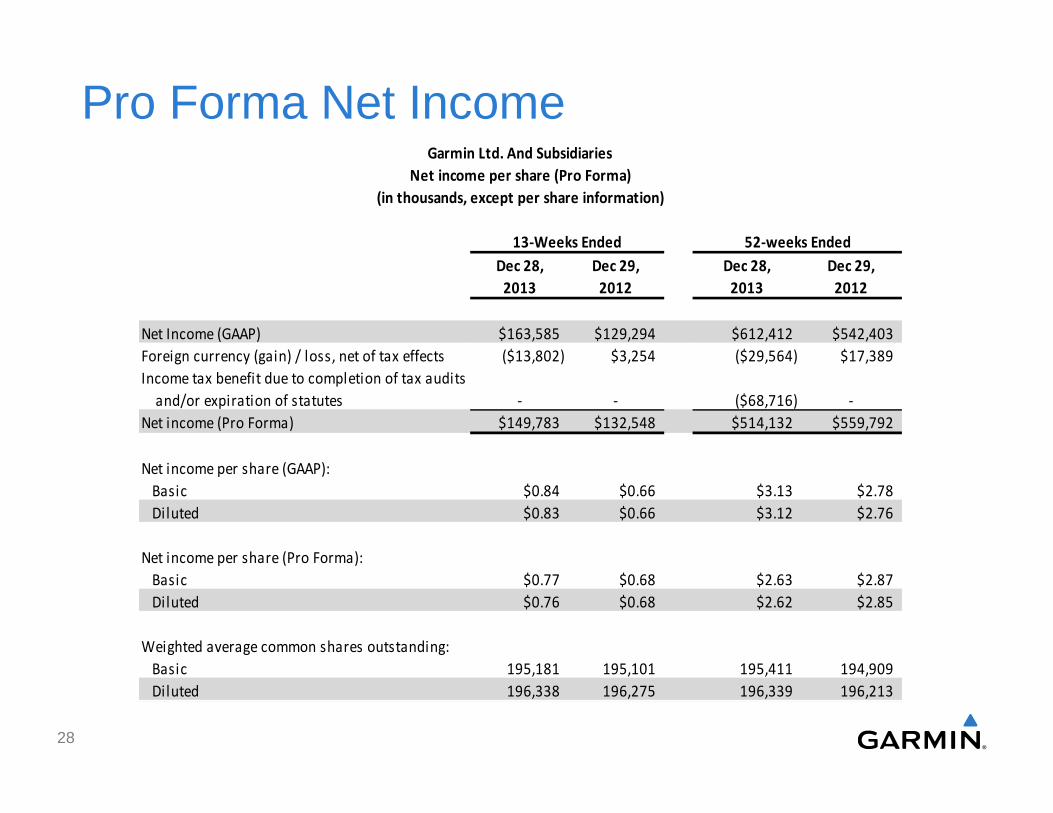
Pro Forma Net IncomeGarmin Ltd And S bsidiaries
13-Weeks Ended
Garmin Ltd. And SubsidiariesNet income per share (Pro Forma)
(in thousands, except per share information)
52-weeks EndedDec 28, Dec 29, Dec 28, Dec 29,
2013 2012 2013 2012
Net Income (GAAP) $163,585 $129,294 $612,412 $542,403Foreign currency (gain) / loss net of tax effects ($13 802) $3 254 ($29 564) $17 389Foreign currency (gain) / loss, net of tax effects ($13,802) $3,254 ($29,564) $17,389Income tax benefit due to completion of tax audits and/or expiration of statutes - - ($68,716) -Net income (Pro Forma) $149,783 $132,548 $514,132 $559,792
Net income per share (GAAP): Basic $0.84 $0.66 $3.13 $2.78 Diluted $0.83 $0.66 $3.12 $2.76
Net income per share (Pro Forma):Net income per share (Pro Forma): Basic $0.77 $0.68 $2.63 $2.87 Diluted $0.76 $0.68 $2.62 $2.85
Weighted average common shares outstanding:
Note: Tax effects are based on respective periods’ normalized effective tax rate.
28
Basic 195,181 195,101 195,411 194,909 Diluted 196,338 196,275 196,339 196,213

Free Cash Flow
Garmin Ltd. And SubsidiariesFree Cash Flow
13-Weeks Ended
Free Cash Flow(in thousands)
52-weeks Ended13 Weeks EndedDec 28, Dec 29, Dec 28, Dec 29,
2013 2012 2013 2012
52 weeks Ended
Management believes that free cash flow is an important financial measure because it represents the amount of cash provided by operations that is available
Net cash provided by operating activities $149,813 $174,711 $630,084 $684,745Less: purchases of property and equipment ($14,758) ($11,564) ($56,083) ($38,445)Free Cash Flow $135,055 $163,147 $574,001 $646,300because it represents the amount of cash provided by operations that is available
for investing and defines it as operating cash flow less capital expenditures for property and equipment.
Free Cash Flow $135,055 $163,147 $574,001 $646,300
29


