21
Mr. Stefan Borgas | President & CEO February 09, 2016 Q4 2015 Results

Mr. Stefan Borgas | President & CEO
February 09, 2016
Q4 2015 Results

2
Important Legal Notes
The information delivered or to be delivered to you does not constitute an offer or a recommendation to do any transaction in Israel Chemicals Ltd. (ICL) securities. Certain statements in this presentation and other oral and written statements made by ICL from time to time, are forward-looking statements, including, but not limited to, those that discuss strategies, goals, financial outlook or other non-historical matters. These forward-looking statements are subject to risks and uncertainties that may cause actual results to differ materially from those contained in the statements, including, among others, the following: loss or impairment of business licenses or mining permits or concessions; natural disasters; failure to raise the water level in evaporation Pond 5 in the Dead Sea; accidents or disruptions at our seaport shipping facilities or regulatory restrictions affecting our ability to export our products overseas; labor disputes, slowdowns and strikes involving our employees; currency rate fluctuations; rising interest rates; general market, political or economic conditions in the countries in which we operate; market fluctuations, among others in the YPH JV's manufacturing locations and target markets, changes in the demand and price environment for the YPH JV's products; shipping and energy costs; pension and health insurance liabilities; price increases or shortages with respect to our principal raw materials; volatility of supply and demand and the impact of competition; changes to laws or regulations (including environmental protection and safety and tax laws or regulations), or the application or interpretation of such laws or regulations; government examinations or investigations; the difference between actual resources and our resource estimates; failure to integrate or realize expected benefits from acquisitions and joint ventures; volatility or crises in the financial markets; cyclicality of our businesses; changes in demand for our fertilizer products due to a decline in agricultural product prices, lack of available credit, weather conditions, government policies or other factors beyond our control; decreases in demand for bromine-based products and other industrial products; litigation, arbitration and regulatory proceedings; closing of transactions, mergers and acquisitions; third party service providers' financial condition; war or acts of terror. We caution you that the above list of important factors is not comprehensive. We refer you to filings that we have made and shall make with the TASE and the U.S. SEC, including under “Risk Factors” in our annual report on Form 20-F. They may discuss new or different factors that may cause actual results to differ materially from this information. Forward-looking statements and projections are given only as of the date of this communication, and we disclaim any obligation to update or revise them, whether as a result of new information, future events or otherwise, except as required by law. Market data and certain industry data used in this communication were obtained from internal estimates and studies, where appropriate, as well as market research and publicly available information. The information they include has been obtained from sources believed to be reliable, but the accuracy and completeness of such information is not guaranteed. Internal estimates and studies, which we believe to be reliable, have not been independently verified. We cannot assure you that such data is accurate or complete. Readers and viewers are cautioned to consider these risks and uncertainties and to not place undue reliance on such information. Included in this presentation are certain non-GAAP financial measures, such as Adjusted Operating income and Adjusted Net income, designed to complement the financial information presented in accordance with U.S. GAAP because management believes such measures are useful to investors. These non-GAAP financial measures should be considered only as supplemental to, and not superior to, financial measures provided in accordance with GAAP. Please refer to Q4 2015 press release for a reconciliation of the non-GAAP financial measures included in this presentation to the most directly comparable financial measures prepared in accordance with GAAP.

3
Good Quarterly Performance in a Very Challenging Environment
$ millions Q4 15 Q4 14 % change 2015 2014 % change
Sales 1,427 1,403 1.7% 5,405 6,111 (11.6)%
Adjusted operating income 233 201 15.9% 994 960 3.5%
Net income 96 86 11.6% 509 464 9.7%
Adjusted net income 180 108 66.7% 699 695 0.6%
Adjusted EPS 0.14 0.09 0.55 0.55
Higher potash volumes, operational excellence deliveries and bromine value chain returns more than offset lower fertilizer prices in Q4
Efficiency and cost reduction initiatives will continue beyond 2016
Strengthening ICL’s integrated value chain driven by specialty businesses
See Q4 2015 press release for a reconciliation of Adjusted operating income to operating income and Adjusted net income to net income.
Business Environment & Major Developments
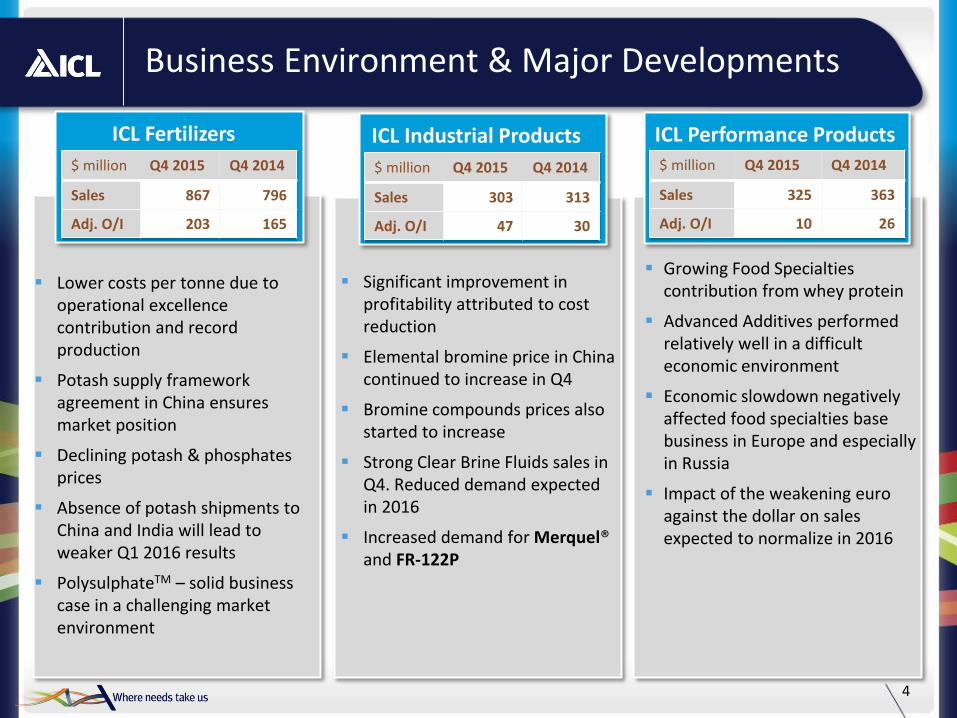
4
ICL Fertilizers
Lower costs per tonne due to operational excellence contribution and record production
Potash supply framework agreement in China ensures market position
Declining potash & phosphates prices
Absence of potash shipments to China and India will lead to weaker Q1 2016 results
PolysulphateTM – solid business case in a challenging market environment
ICL Performance Products ICL Industrial Products
Significant improvement in profitability attributed to cost reduction
Elemental bromine price in China continued to increase in Q4
Bromine compounds prices also started to increase
Strong Clear Brine Fluids sales in Q4. Reduced demand expected in 2016
Increased demand for Merquel® and FR-122P
Growing Food Specialties contribution from whey protein
Advanced Additives performed relatively well in a difficult economic environment
Economic slowdown negatively affected food specialties base business in Europe and especially in Russia
Impact of the weakening euro against the dollar on sales expected to normalize in 2016
$ million Q4 2015 Q4 2014
Sales 867 796
Adj. O/I 203 165
$ million Q4 2015 Q4 2014
Sales 303 313
Adj. O/I 47 30
$ million Q4 2015 Q4 2014
Sales 325 363
Adj. O/I 10 26

New culture of efficiency after strike in the Israeli sites
$275 million run-rate savings (vs. 2013)
Potash cost per tonne reduction
Continued profitability improvements in phosphates
YPH JV
Record production at ICL Dead Sea in Q4
Whey protein business integration
Divestitures
Bromine business turnaround
FR-122P product launch
Strategic cooperation agreement with the Government of Catalonia
SOP and phosphate resources identified in Ethiopia and Namibia
Ensure sustainability of ICL Dead Sea higher potash production
Double PolysulphateTM business
Grow ICL Industrial Products margins
Focus on Food Specialties and Bromine value chain R&D
Moving forward with feasibility studies for growth projects in Africa
Continue cost reduction including labor
Continue procurement savings trajectory
Exceed the 2016 savings target of $350 million per year vs. 2013
YPH JV - execute integration plan
Additional cash flow optimization measures
5
Strategy Implementation
2015 Achievements Plans for 2016

Efficiency Initiatives Contribution – Segment Breakdown
6
USD millions/year
2015 actual efficiency gains of $175M vs. 2014 Segment actual contribution
2016E2015E2014A
Potash Phosphates and fertilizers ICL IP ICL PP
$275 million
$100 million
$350-370 million
Labor costs savings in 2015 ~$25 million*
Gross average yearly labor costs savings as of 2017
~$80 million*
Anticipated labor costs savings in 2016 ~$70 million*
Operational Excellence
Procurement
Cost of
labor
*Labor cost reduction at ICL Dead Sea and ICL Neot Hovav
Target for 2018 – $75-100M vs. 2016

+15%* +58%* +117%* +45%* +63*
780 256 600
1,900
4,000
115
60
700
850
2,500
120
Transforming Into The World’s Leading Specialty Phosphate Player
7
ICL** YPH JV
Thousand tonnes
899 436
1,300
2,750
6,500
Expansions
Phosphate Fertilizers Food Specialties Advanced Additives Specialty Fertilizers
Specialty Commodity
New market supported by Chinese government policy
Grow sales in soluble MAP, MKP and Light Specialties
Build new CRF and WSNPK plants in China
Strengthen ICL PP base in the Asian market
Technical grade phosphoric acid volume growth, in addition to Fosbrasil
Build up niche market applications
Secure long term phosphate reserves
Expand ICL’s commodity portfolio
Establish a position in the Chinese and global commodity phosphates markets (DAP, MAP)
* Increase in capacity compared to 2015
Kunming
Volume increase of about 15%
New multi-ingredient blending plant and lab in China
Leveraging ICL’s expertise to build a new low cost purified acid plant
** Includes N. America and Brazil
Purified Phosphoric Acid
Phosphoric Acid
Commodity Fertilizers
Phosphate Rock
Specialty Fertilizers

8
Delivering on the Bromine Value Chain Strategy
Bromine price in China (RMB/MT)
Nov 2014 ICL announces a
20% price increase
Dec 2015
Price is up by 54%
vs. Nov 2014
About 50% y/y increase in Bromine prices in China
10% - 20% increase in Bromine compound prices
Focused on margin expansion rather than market share
Price over Volume 34% decrease in CAPEX vs. 2014
15% headcount reduction in Israel
Second FR122P plant fully operational
Efficiency Improvements
SAFR™ promotion
Merquel® promotion in EU, India & China
Advocacy
R&D pipeline encapsulates potential for growth of bromine demand – energy storage, gold extraction, 3D printing
R&D
16,500
25,500
9
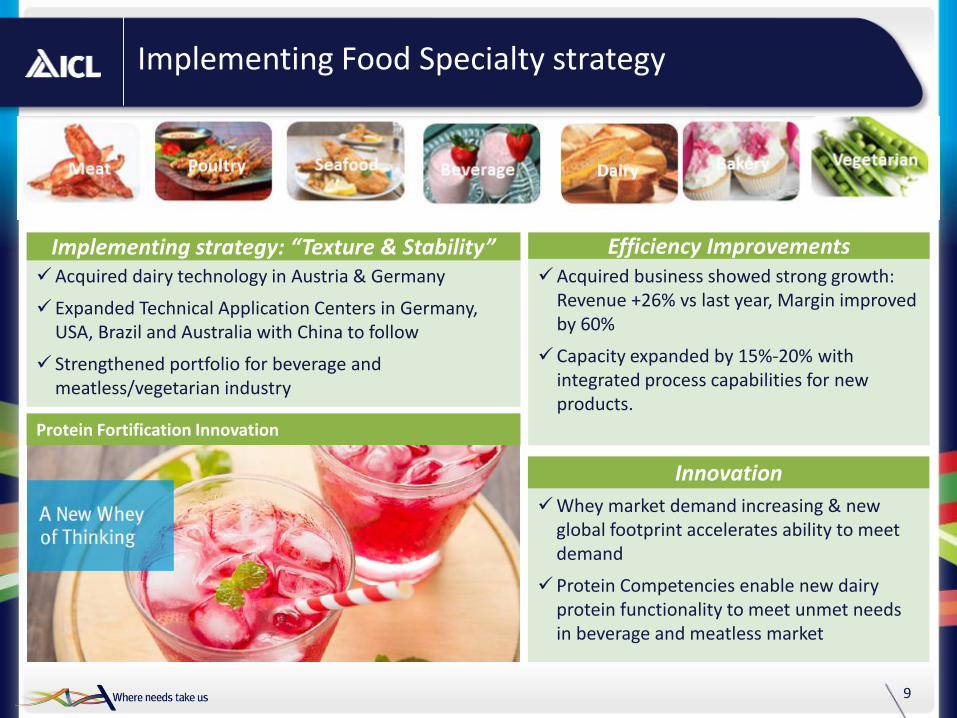
Implementing Food Specialty strategy
Protein Fortification Innovation
Acquired dairy technology in Austria & Germany
Expanded Technical Application Centers in Germany, USA, Brazil and Australia with China to follow
Strengthened portfolio for beverage and meatless/vegetarian industry
Implementing strategy: “Texture & Stability” Acquired business showed strong growth:
Revenue +26% vs last year, Margin improved by 60%
Capacity expanded by 15%-20% with integrated process capabilities for new products.
Efficiency Improvements
Whey market demand increasing & new global footprint accelerates ability to meet demand
Protein Competencies enable new dairy protein functionality to meet unmet needs in beverage and meatless market
Innovation
Beverage Dairy Bakery
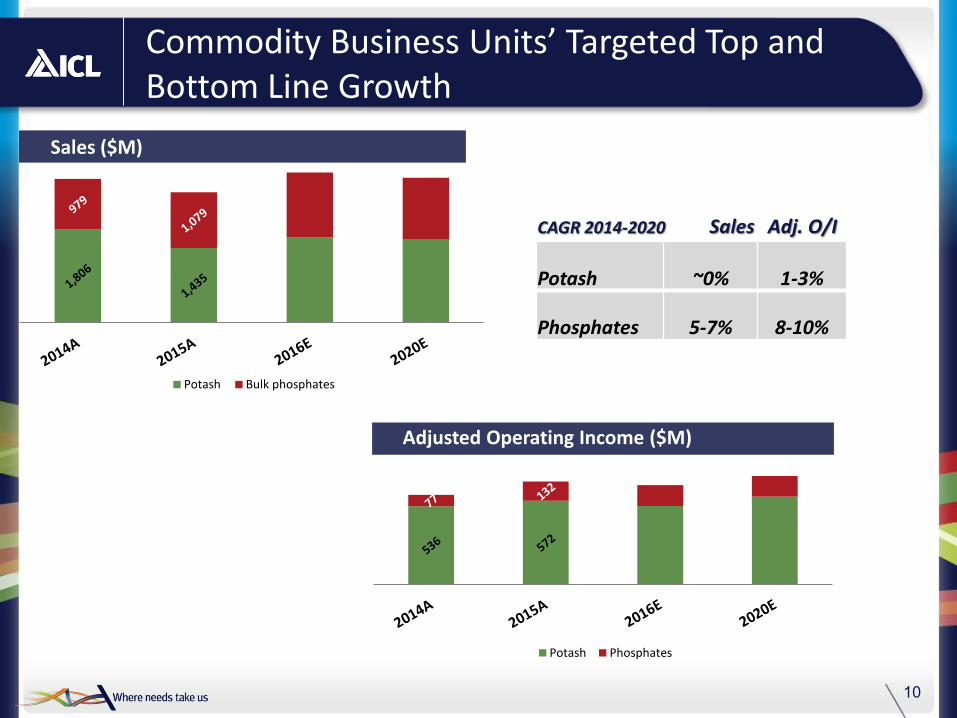
Potash Phosphates
10
Commodity Business Units’ Targeted Top and Bottom Line Growth
Potash operating income ($M) Sales ($M)
Adjusted Operating Income ($M)
Potash ~0% 1-3%
Phosphates 5-7% 8-10%
CAGR 2014-2020 Sales Adj. O/I
Potash Bulk phosphates

56 36
229 281
49 44
Specialty Business Units’ Targeted Top and Bottom Line Growth
11
Sales ($M)
Food specialties 8-10% 9-11%
Advanced additives 3-5% 8-10%
Industrial solutions ~0% 1-3%
Flame retardants 5% 30-40%
PolysulphateTM 30-50% 60-80%
Specialty Fertilizers (Incl. SOP, NOP) 8-10% 13-15%
CAGR 2014-2020 Sales Adj. O/I
Adjusted Operating Income ($M)
ICL Performance Products
ICL Industrial Products
ICL Fertilizers
780 708
1,990 1,833
525 632
Food specialties
Engineered Materials
Specialty Fertilizers (Incl.polysulphate, SOP & NOP)
Engineered Materials

12
Improving Our Commodity-Specialty Balance
Sales
Adjusted Operating Income
Specialty 56%
Specialty 35%
Commodity 44%
Specialty 48%
Specialty 62%
Commodity 38%
Commodity 65%
Commodity 52%
2014
2014
2020 Targeted
2020 Targeted

Financial Results
Mr. Kobi Altman Executive VP & CFO

14
Good Quarterly Performance Despite a Very Challenging Environment
Q4 2015 Sales Q4 2015 Adjusted operating income
Numbers may not add up due to rounding
$ millions Q4 15 Q4 14 % change 2015 2014 % change
Sales 1,427 1,403 1.7% 5,405 6,111 (11.6)%
Adjusted operating income 233 201 15.9% 994 960 3.5%
Net income 96 86 11.6% 509 464 9.7%
Adjusted net income 180 108 66.7% 699 695 0.6%
Cash flow from operations 56 310 (81.9)% 573 893 (35.8)%
External Potash sales (thousand tonnes) 1,416 1,150 23.1% 4,259 5,034 (15.4)%
201 233
66 19 51
2
1,403 1,427
123 104 104 51 48
See Q4 2015 press release for a reconciliation of Adjusted operating income to operating income and Adjusted net income to net income.
15
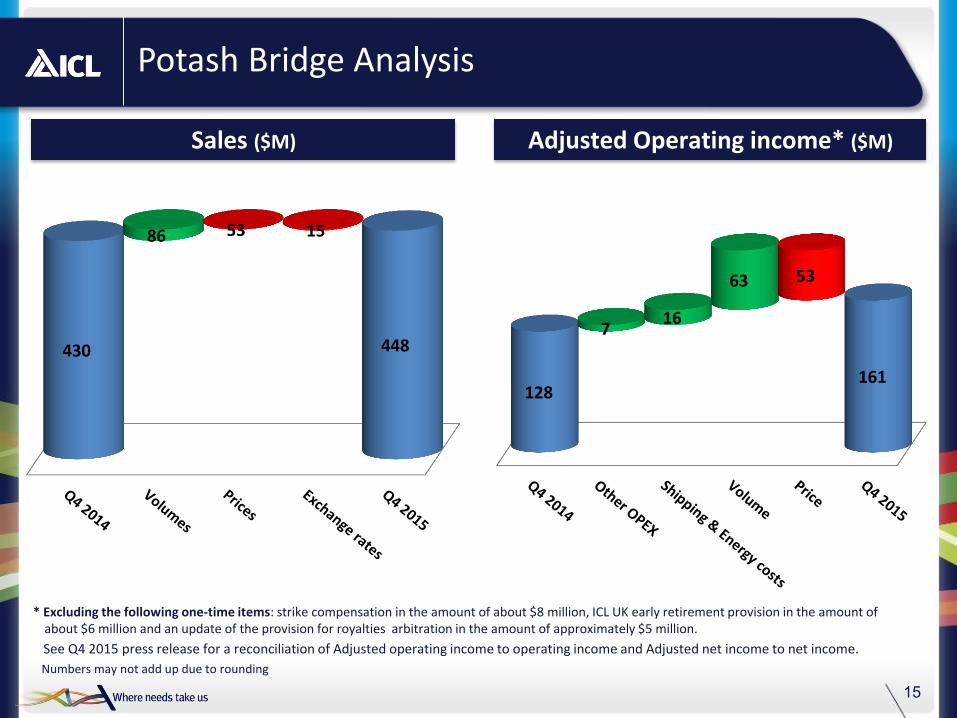
Potash Bridge Analysis
Sales ($M) Adjusted Operating income* ($M)
Numbers may not add up due to rounding
* Excluding the following one-time items: strike compensation in the amount of about $8 million, ICL UK early retirement provision in the amount of about $6 million and an update of the provision for royalties arbitration in the amount of approximately $5 million.
430 448
86 53 15
128 161
7 16
63 53
See Q4 2015 press release for a reconciliation of Adjusted operating income to operating income and Adjusted net income to net income.
60% 40%
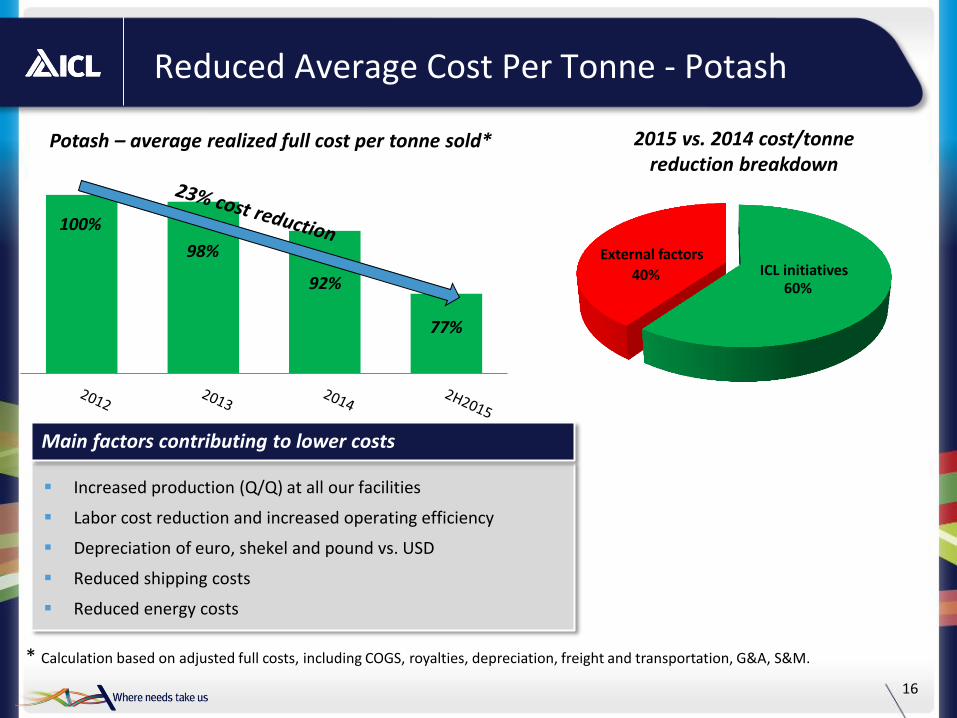
Reduced Average Cost Per Tonne - Potash
16
* Calculation based on adjusted full costs, including COGS, royalties, depreciation, freight and transportation, G&A, S&M.
Increased production (Q/Q) at all our facilities
Labor cost reduction and increased operating efficiency
Depreciation of euro, shekel and pound vs. USD
Reduced shipping costs
Reduced energy costs
Main factors contributing to lower costs
Potash – average realized full cost per tonne sold*
100%
98%
92%
77%
External factors ICL initiatives
2015 vs. 2014 cost/tonne reduction breakdown
17
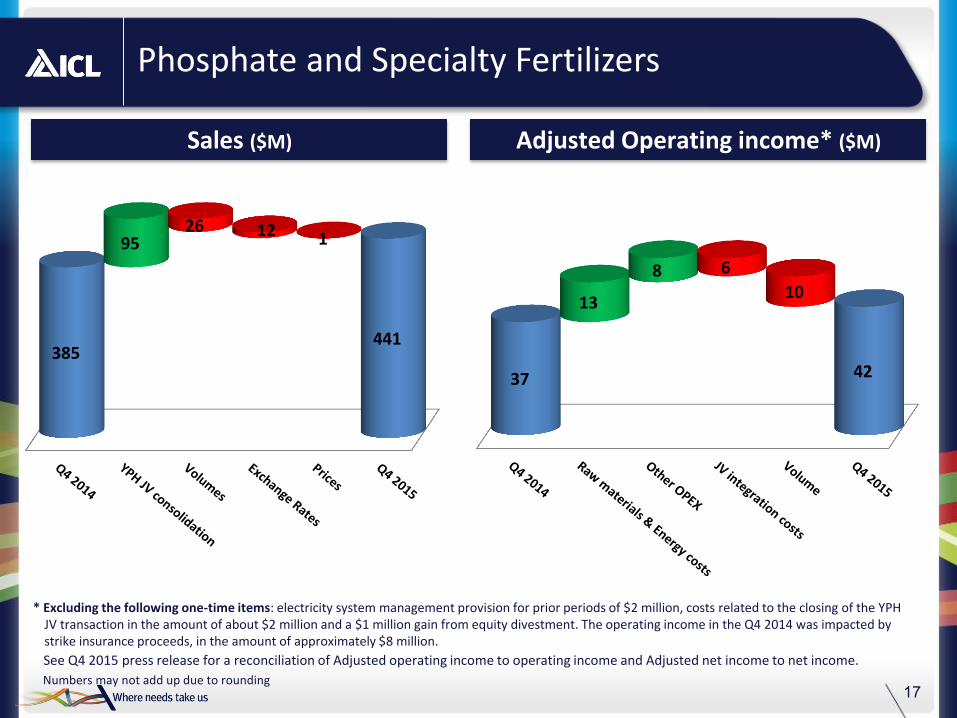
Phosphate and Specialty Fertilizers
Sales ($M) Adjusted Operating income* ($M)
Numbers may not add up due to rounding
* Excluding the following one-time items: electricity system management provision for prior periods of $2 million, costs related to the closing of the YPH JV transaction in the amount of about $2 million and a $1 million gain from equity divestment. The operating income in the Q4 2014 was impacted by strike insurance proceeds, in the amount of approximately $8 million.
385 441
95 26 12 1
37 42
13
8 6
10
See Q4 2015 press release for a reconciliation of Adjusted operating income to operating income and Adjusted net income to net income.

Reduced Average Cost Per Tonne - Phosphates
18
Cost per tonne decrease - mainly a result of company efforts
Green phosphoric Acid Cost $/tonne FOB
57% 43%
ICL Initiatives External factors
GTSP Cost $/tonne FOB
White phosphoric Acid Cost $/tonne FOB
Phosphate Rock Cost $/tonne FOB
78.4% 90.7%
98.6%
72.5% 80.6%
88.0%
82.4% 87.3% 91.5%
76.3% 85.2%
95.8%
100%
100%
100%
100%
2015 vs. 2014 cost/tonne reduction breakdown

19
Industrial Products
Sales ($M) Adjusted Operating income* ($M)
Numbers may not add due to rounding
* Excluding the following one-time items: Israel and the US asset impairments in the amount of approximately $56 million and $49 million in Q4 2014, a provision for historical waste treatment in the amount of $20 million and a strike related compensation of about $9 million.
313 303
3 9 4
30
46
3 6
8 1
See Q4 2015 press release for a reconciliation of Adjusted operating income to operating income and Adjusted net income to net income.

20
Performance Products
Sales ($M) Adjusted Operating income* ($M)
Numbers may not add due to rounding
363 325
1 77 104
12
26
10
1 4
7
27
1
* Excluding the following one-time items: Q4 2015: costs related to the sale of non-core business of about $7 million. Q4 2014: asset impairments of about $22 million, income from entry into a consolidation of about $36 million, and proceeds from strike insurance, in the amount of about $1 million
See Q4 2015 press release for a reconciliation of Adjusted operating income to operating income and Adjusted net income to net income.

Thank You


