19
Q4 2016 CANADIAN CAP RATES & INVESTMENT INSIGHTS A quarterly snapshot of Canadian commercial real estate cap rates and investment trends.
Q4 2016 CANADIAN CAP RATES & INVESTMENTINSIGHTS
A quarterly snapshot of Canadian commercial real estate cap rates and investment trends.
Q4 2016 CAP RATESINVESTMENT TRENDS
VIEW ALL CANADIAN CAP RATES ON PAGE 17
2
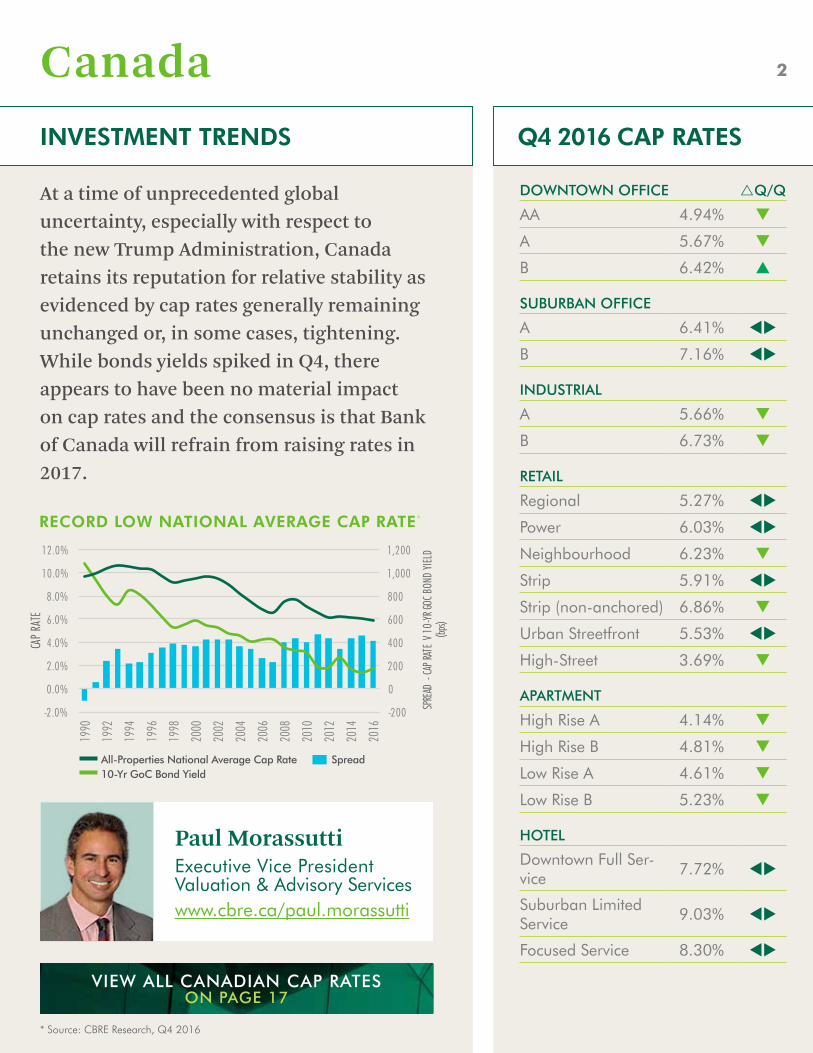
At a time of unprecedented global uncertainty, especially with respect to the new Trump Administration, Canada retains its reputation for relative stability as evidenced by cap rates generally remaining unchanged or, in some cases, tightening. While bonds yields spiked in Q4, there appears to have been no material impact on cap rates and the consensus is that Bank of Canada will refrain from raising rates in 2017.
Canada
Paul MorassuttiExecutive Vice PresidentValuation & Advisory Serviceswww.cbre.ca/paul.morassutti
DOWNTOWN OFFICE rQ/Q
AA 4.94% q
A 5.67% q
B 6.42% p
SUBURBAN OFFICE
A 6.41% tu
B 7.16% tu
INDUSTRIAL
A 5.66% q
B 6.73% q
RETAIL
Regional 5.27% tu
Power 6.03% tu
Neighbourhood 6.23% q
Strip 5.91% tu
Strip (non-anchored) 6.86% q
Urban Streetfront 5.53% tu
High-Street 3.69% q
APARTMENT
High Rise A 4.14% q
High Rise B 4.81% q
Low Rise A 4.61% q
Low Rise B 5.23% q
HOTEL
Downtown Full Ser-vice
7.72% tu
Suburban Limited Service
9.03% tu
Focused Service 8.30% tu
* Source: CBRE Research, Q4 2016
RECORD LOW NATIONAL AVERAGE CAP RATE*
All-Properties National Average Cap Rate10-Yr GoC Bond Yield
Spread
-200
0
200
400
600
800
1,000
1,200
-2.0%
0.0%
2.0%
4.0%
6.0%
8.0%
10.0%
12.0%
1990
1992
1994
1996
1998
2000
2002
2004
2006
2008
2010
2012
2014
2016
SPRE
AD -
CAP R
ATE
V 10-
YR GO
C BON
D YIE
LD
(bps)
CAP
RATE

VIEW ALL CANADIAN CAP RATES ON PAGE 17
3
MARKET MOVERSDEBT MARKET TRENDS
Canadian economic growth is lagging the U.S., but the theory of relativity has driven bond yields in Canada up as much as 60 basis points since the U.S. election on expectations for higher inflation and a larger U.S. deficit. Lenders indicate that debt capital will be in abundance in 2017 to meet balanced market transactions, however, allocations to the sector will moderate since last year’s allocations were considered excessive given unfulfilled use and the ‘opportunity cost rub’ exacerbated by a low yield environment.
MORTGAGE RATES TO GOVERNMENT OF CANADA BONDS
*Source: CBRE Limited, Bank of Canada, January 2017
Canada
Carmin Di Fiore Executive Vice PresidentDebt & Structured Financewww.cbre.ca/carmin.difiore
CAD/USD
2015 Q4 2016 Q4Change YoY (%)
$0.72 $0.74 p 3.03%
CANADA PRIME RATE
2015 Q4 2016 Q4Change YoY (%)
2.70% 2.70% tu 0.00%
30-DAY CDOR
2015 Q4 2016 Q4Change YoY (%)
0.88% 0.94% p 6.82%
WEST TEXAS INTERMEDIATE (USD)
2015 Q4 2016 Q4Change YoY (%)
$37.04 $53.72 p 45.03%
5-YEAR MORTGAGE SPREAD RANGE
2015 Q4 2016 Q4Change YoY (%)
1.95%-2.45% 1.85%-2.50% q -0.91%
10-YEAR MORTGAGE SPREAD RANGE
2015 Q4 2016 Q4Change YoY (%)
1.90%-2.60% 1.95%-2.55% tu 0.00%
Source: CBRE Limited, Bank of Canada, Thomson Reuters Eikon, October 2016
0.00%
0.50%
1.00%
1.50%
2.00%
2.50%
3.00%
3.50%
4.00%
4.50%
Mar-15
Apr-15
May-15
Jun-15
Jul-15
Aug-15
Sep-15
Oct-15
Nov-15
Dec-15
Jan-16
Feb-16
Mar-16
Apr-16
May-16
Jun-16
Jul-16
Aug-16
Sep-16
Oct-16
Nov-16
Dec-16
5-Yr Commercial Mortgage Rate 10-Yr Commercial Mortgage Rate
5-Yr GoC Bond Yield10-Yr GoC Bond Yield
VIEW ALL CANADIAN CAP RATES ON PAGE 17

REGIONAL RANKINGS
Canada
VIEW ALL CANADIAN CAP RATES ON PAGE 17
4
OFFICE INVESTMENT TRENDS
HISTORICAL OFFICE CAP RATES
Cap rates for Office assets continued to trend downward on a national basis dropping to new lows to end 2016. On a YoY basis, yield compression resulted from low levels reached in the leading gateway markets, as foreign and institutional investors centered on trophy assets. These were enough to overshadow upward yield trajectories in Alberta, whose lagging economy forced Office cap rates up from the prior year.
Vancouver and Toronto realized yield declines YoY in every category, coinciding with downtown vacancy rates. Yields in Vancouver Downtown-A class assets dipped to 3.94%, while Toronto settled at 4.38%. The sharpest YoY declines were seen in Toronto Downtown-B and Vancouver Suburban-B assets. Each compressing -100 bps YoY, reaching cap rates of 4.75% and 5.25% respectively. This contrasted with smaller markets that realized less yield movement, and Calgary and Edmonton, where yields grew across the board. Downtown-B assets in Alberta showed the greatest stress.
Downtown AA & ASuburban A
Downtown BSuburban B
DOWNTOWN B
Cap Rates (%) YoY Change (bps)
7.0% 5.0% 3.0% -100 0 100
DOWNTOWN A
Cap Rates (%) YoY Change (bps)
7.0% 5.0% 3.0% -100 0 100
SUBURBAN A
Cap Rates (%) YoY Change (bps)
7.0% 5.0% 3.0% -100 0 100
SUBURBAN B
Cap Rates (%) YoY Change (bps)
5.0%
5.5%
6.0%
6.5%
7.0%
7.5%Q1-14
Q2-14
Q3-14
Q4-14
Q1-15
Q2-15
Q3-15
Q4-15
Q1-16
Q2-16
Q3-16
Q4-16
VancouverTorontoNationalWinnipegOttawaMontrealK-WCalgaryEdmontonHalifaxLondon
VancouverTorontoMontrealNationalCalgaryOttawaWinnipegK-WEdmontonHalifaxLondon
VancouverTorontoMontrealOttawaNationalWinnipegCalgaryEdmontonK-WHalifaxLondon
VancouverTorontoOttawaMontrealNationalWinnipegK-WHalifaxCalgaryEdmontonLondon
7.0% 5.0% 3.0% -100 0 100

REGIONAL RANKINGS
Canada
VIEW ALL CANADIAN CAP RATES ON PAGE 17
5
INDUSTRIAL INVESTMENT TRENDS
HISTORICAL INDUSTRIAL CAP RATES
The Industrial sector was riding a wave of optimism and was considered the safest investment in Canada. As new supply tightened YoY, this paved the way for lower availability rates leading to increasing rents. This fueled investor demand, leading to consistent cap rate compression across all four quarters.
The Industrial sector’s performance was balanced in 2016. However, a growing conflict between Industrial-A and B product emerged. The Industrial-A category realized no yield movement to the upside, as demand remained strong. This resulted in YoY yield compression by at least -25 bps in six out of ten markets. Vancouver and Toronto Industrial-A yields declined -63 bps and -50 bps respectively, to reach 4.75% each, and Calgary declined -50 bps to reach 5.25%. Less convincing was the Industrial-B category, which saw stress developing in Edmonton and yields inflating by +50 bps to 7.38%.
Industrial AIndustrial B
5.00%
5.50%
6.00%
6.50%
7.00%
7.50%Q1-14
Q2-14
Q3-14
Q4-14
Q1-15
Q2-15
Q3-15
Q4-15
Q1-16
Q2-16
Q3-16
Q4-16
TorontoVancouverCalgaryEdmontonNationalOttawaMontrealWinnipegK-WHalifaxLondon
VancouverCalgaryEdmontonWinnipegOttawaNationalTorontoK-WHalifaxMontrealLondon
INDUSTRIAL A
Cap Rates (%) YoY Change (bps)
INDUSTRIAL B
Cap Rates (%) YoY Change (bps)
9.0% 7.0% 5.0% -100 0 100
9.0% 7.0% 5.0% -100 0 100

REGIONAL RANKINGS
Canada
VIEW ALL CANADIAN CAP RATES ON PAGE 17
6
MULTIFAMILY INVESTMENT TRENDS
Every market but one reacted favorably when compared YoY. Low vacancy rates and climbing rental rates, compounded by soaring housing prices in select markets, drove yields lower.
In Vancouver, record housing prices guaranteed that Multifamily assets were to react in kind, resulting in yields across Vancouver classes compressing YoY by as much as -125 bps and no less than -75 bps. Vancouver High-Rise and Low-Rise A classes compressed by -100 bps each, reaching yields of 2.75% and 3.00% respectively. Also reacting positively was Alberta, and the Kitchener-Waterloo region. Yields declined in K-W as much as -62 bps to 5.00% for High-Rise B assets. This is closely tied to the region’s young population, and rising residential ownership costs.
2016 was a strong year for Multifamily assets, as yields remain well below the national average. This has led to growing emphasis on new purpose-built developments in gateway markets, particularly from institutional investors.
HISTORICAL MULTIFAMILY CAP RATES
High Rise ALow Rise A
High Rise BLow Rise B
4.00%
4.25%
4.50%
4.75%
5.00%
5.25%
5.50%
5.75%Q1-14
Q2-14
Q3-14
Q4-14
Q1-15
Q2-15
Q3-15
Q4-15
Q1-16
Q2-16
Q3-16
Q4-16
VancouverTorontoCalgaryOttawaNationalHalifaxK-WWinnipegEdmontonMontrealLondon
VancouverTorontoOttawaNationalCalgaryMontrealHalifaxEdmontonK-WWinnipegLondon
VancouverTorontoCalgaryNationalEdmontonK-WOttawaHalifaxWinnipegMontrealLondon
VancouverTorontoOttawaNationalEdmontonCalgaryMontrealK-WHalifaxLondon
HIGH RISE A
Cap Rates (%) YoY Change (bps)
HIGH RISE B
Cap Rates (%) YoY Change (bps)
LOW RISE A
Cap Rates (%) YoY Change (bps)
LOW RISE B
Cap Rates (%) YoY Change (bps)
6.0% 4.0% 2.0% -150 0 150
6.0% 4.0% 2.0% -150 0 150
6.0% 4.0% 2.0% -150 0 150
6.0% 4.0% 2.0% -150 0 150

REGIONAL RANKINGS
Canada
VIEW ALL CANADIAN CAP RATES ON PAGE 17
7
RETAIL INVESTMENT TRENDS
During a period where Retail entered a state of flux, Canadian property was tested by the growth of e-commerce. What emerged, were yields reacting with minimal change, as intensification drove yields in certain markets to compress.
Yields across cities and classes remained stable, however, Vancouver yields fell. Retail Power fell -75 bps to 5.00%, while Retail Strip Non-Anchored declined -62 bps to 5.25%. Retail Strip, Anchored and Non-Anchored, declined in five markets, the most of any Retail class. Montreal Retail Strip declined -50bps, the sharpest drop in the category. Calgary was conflicted, with Retail Strip falling -25 bps to 5.50%, and Strip Non-Anchored moving up +25 bps to 6.50%. In Halifax, demand focused on quality assets rather than smaller neighborhood strip, which climbed +75 bps.
Due to urbanization, Urban Streetfront yielded below 5.00% in Vancouver, Toronto and Montreal, while High-Street Retail in Vancouver and Toronto yielded below 4.00% to end 2016.
HISTORICAL RETAIL CAP RATES
RegionalPower
NeighbourhoodStrip
Strip (non-anchored)
5.00%
5.50%
6.00%
6.50%
7.00%
7.50%Q1-14
Q2-14
Q3-14
Q4-14
Q1-15
Q2-15
Q3-15
Q4-15
Q1-16
Q2-16
Q3-16
Q4-16
VancouverCalgaryEdmontonTorontoNationalK-WOttawaWinnipegMontrealLondonHalifax
VancouverTorontoCalgaryEdmontonNationalOttawaMontrealWinnipegK-WHalifaxLondon
VancouverCalgaryTorontoEdmontonOttawaNationalK-WWinnipegLondonHalifaxMontreal
VancouverTorontoAverage
VancouverTorontoMontrealOttawaNationalCalgaryWinnipegEdmontonK-WHalifaxLondon
REGIONAL
Cap Rates (%) YoY Change (bps)
POWER
Cap Rates (%) YoY Change (bps)
NEIGHBOURHOOD
Cap Rates (%) YoY Change (bps)
7.0% 5.0% 3.0% -100 0 100
URBAN STREETFRONT HIGH STREET
Cap Rates (%) Cap Rates (%)
7.0% 5.0% 3.0%
3.8% 3.4% 3.0%
7.0% 5.0% 3.0% -100 0 100
7.0% 5.0% 3.0% -100 0 100
REGIONAL RANKINGS
Canada
VIEW ALL CANADIAN CAP RATES ON PAGE 17
8
HOTEL INVESTMENT TRENDS
HISTORICAL HOTEL CAP RATES
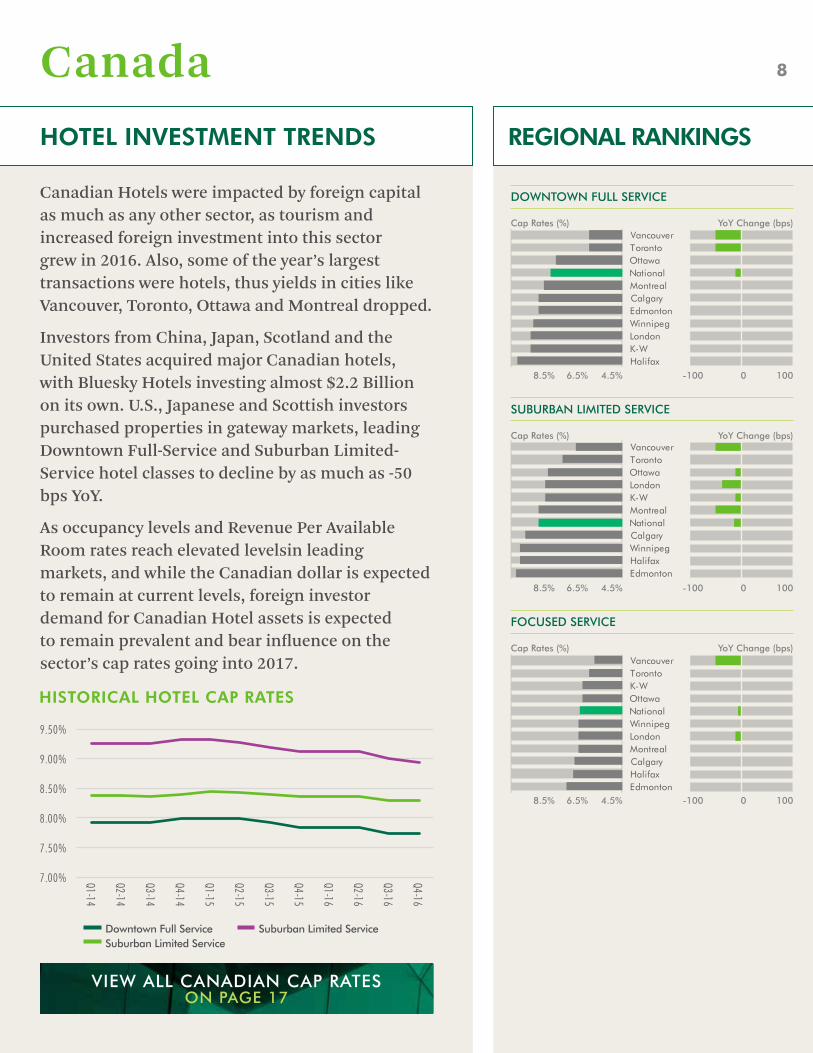
Canadian Hotels were impacted by foreign capital as much as any other sector, as tourism and increased foreign investment into this sector grew in 2016. Also, some of the year’s largest transactions were hotels, thus yields in cities like Vancouver, Toronto, Ottawa and Montreal dropped.
Investors from China, Japan, Scotland and the United States acquired major Canadian hotels, with Bluesky Hotels investing almost $2.2 Billion on its own. U.S., Japanese and Scottish investors purchased properties in gateway markets, leading Downtown Full-Service and Suburban Limited-Service hotel classes to decline by as much as -50 bps YoY.
As occupancy levels and Revenue Per Available Room rates reach elevated levelsin leading markets, and while the Canadian dollar is expected to remain at current levels, foreign investor demand for Canadian Hotel assets is expected to remain prevalent and bear influence on the sector’s cap rates going into 2017.
Downtown Full ServiceSuburban Limited Service
Suburban Limited Service
7.00%
7.50%
8.00%
8.50%
9.00%
9.50%Q1-14
Q2-14
Q3-14
Q4-14
Q1-15
Q2-15
Q3-15
Q4-15
Q1-16
Q2-16
Q3-16
Q4-16
VancouverTorontoK-WOttawaNationalWinnipegLondonMontrealCalgaryHalifaxEdmonton
VancouverTorontoOttawaNationalMontrealCalgaryEdmontonWinnipegLondonK-WHalifax
VancouverTorontoOttawaLondonK-WMontrealNationalCalgaryWinnipegHalifaxEdmonton
DOWNTOWN FULL SERVICE
Cap Rates (%) YoY Change (bps)
8.5% 6.5% 4.5% -100 0 100
SUBURBAN LIMITED SERVICE
Cap Rates (%) YoY Change (bps)
8.5% 6.5% 4.5% -100 0 100
FOCUSED SERVICE
Cap Rates (%) YoY Change (bps)
8.5% 6.5% 4.5% -100 0 100

INVESTMENT TRENDS Q4 2016 CAP RATES
VIEW ALL CANADIAN CAP RATES ON PAGE 17
9
While all asset classes are in demand, prices appear to have leveled off as investors are showing resistance to reach for values at cap rates beyond what has been reflected in recent trades.
Demand for Vancouver commercial real estate continues to fueled by a constant flow of new entrants into the market, domestic and foreign, as well as a strong appetite from existing owners.
There is a good balance between vendors and purchasers at current cap rates and another strong year of investment activity is expected in 2017.
CAP RATESSTABILIZE
Vancouver
Tony QuattrinVice ChairmanNational Investment Teamwww.cbre.ca/tony.quattrin
DOWNTOWN OFFICE rQ/Q
AA 3.75% - 4.00% tu
A 3.75% - 4.25% tu
B 4.00% - 4.50% tu
SUBURBAN OFFICE
A 4.75% - 5.50% tu
B 5.00% - 5.50% tu
INDUSTRIAL
A 4.50% - 5.00% tu
B 5.00% - 5.50% tu
RETAIL
Regional 4.00% - 4.75% tu
Power 5.00% - 5.00% tu
Neighbourhood 5.00% - 5.50% tu
Strip 4.75% - 5.25% tu
Strip (non-anchored)
5.00% - 5.50% tu
Urban Streetfront 3.75% - 4.25% tu
High Street 3.50% - 4.00% tu
APARTMENT
High Rise A 2.50% - 3.00% tu
High Rise B 3.00% - 3.50% tu
Low Rise A 2.75% - 3.25% tu
Low Rise B 3.25% - 4.25% tu
HOTEL
Downtown Full Service
5.50% - 6.50% tu
Suburban Limited Service
6.50% - 7.50% tu
Focused Service 6.50% - 7.50% tu

INVESTMENT TRENDS Q4 2016 CAP RATES
VIEW ALL CANADIAN CAP RATES ON PAGE 17
10
The recent uptick in investment activity is expected to be maintained in 2017 as energy prices and pipeline announcements boost optimism.
Investor interest broadened from retail, industrial and multifamily product to include more office assets this quarter.
Investment volume increased as investors have been drawn to higher returns and more available product compared to Vancouver and Toronto.
Calgary
Garry BeresExecutive Vice PresidentNational Investment Teamwww.cbre.ca/garry.beres
DOWNTOWN OFFICE rQ/Q
AA 5.25% - 5.75% tu
A 6.25% - 7.00% tu
B 7.75% - 8.50% tu
SUBURBAN OFFICE
A 6.25% - 6.75% tu
B 7.25% - 8.00% tu
INDUSTRIAL
A 5.00% - 5.50% tu
B 6.25% - 6.75% tu
RETAIL
Regional 5.00% - 5.50% tu
Power 5.75% - 6.25% tu
Neighbourhood 5.25% - 5.75% tu
Strip 5.25% - 5.75% tu
Strip (non-anchored)
6.25% - 6.75% tu
Urban Streetfront 5.75% - 6.25% tu
High Street N/A
APARTMENT
High Rise A 4.25% - 5.00% q
High Rise B 4.25% - 5.00% q
Low Rise A 4.25% - 5.00% q
Low Rise B 4.25% - 5.00% q
HOTEL
Downtown Full Service
7.75% - 8.75% tu
Suburban Limited Service
9.25% - 10.25% tu
Focused Service 8.25% - 9.25% tu

INVESTMENT TRENDS Q4 2016 CAP RATES
VIEW ALL CANADIAN CAP RATES ON PAGE 17
11
Grocery anchored retail continues to be the most sought after real estate in the Edmonton market.
Active sales in the downtown office market will provide some much needed data for buyers and sellers considering their options.
Core industrial product remains in demand, while small bay product and quality covenant, single tenant industrial product is experiencing modest demand from investors.
Edmonton
Dave YoungExecutive Vice PresidentNational Investment Teamwww.cbre.ca/dave.young
DOWNTOWN OFFICE rQ/Q
AA 5.50% - 6.00% tu
A 6.75% - 7.25% tu
B 7.75% - 8.50% tu
SUBURBAN OFFICE
A 6.75% - 7.25% tu
B 7.50% - 8.00% tu
INDUSTRIAL
A 5.25% - 5.75% tu
B 6.75% - 8.00% p
RETAIL
Regional 5.00% - 5.50% tu
Power 5.75% - 6.25% tu
Neighbourhood 5.75% - 6.25% tu
Strip 5.50% - 6.00% tu
Strip (non-anchored)
6.50% - 7.00% tu
Urban Streetfront 6.50% - 7.00% tu
High Street N/A
APARTMENT
High Rise A 4.00% - 4.75% q
High Rise B 4.75% - 5.25% tu
Low Rise A 5.00% - 5.75% q
Low Rise B 5.75% - 6.50% tu
HOTEL
Downtown Full Service
7.75% - 8.75% tu
Suburban Limited Service
10.00% - 10.50% tu
Focused Service 9.00% - 10.00% tu

INVESTMENT TRENDS Q4 2016 CAP RATES
VIEW ALL CANADIAN CAP RATES ON PAGE 17
12
Investors continue to pursue quality, cash flowing properties in all asset classes, as well as value-add projects that are fuelled by rental rate growth and intensification opportunities.
Cap rates remain stable across all asset classes despite upward movement in -year and 10-year bond yields since November.
Investors are regaining confidence in the office market following leasing activity in Kitchener and Waterloo, which is evidenced by the sale of the 1.0 million sq. ft. DREAM portfolio to Europro.
R E N TGROWTHINTENSIFICATION
Waterloo Region
Peter WhatmoreSenior Vice PresidentNational Investment Teamwww.cbre.ca/peter.whatmore
DOWNTOWN OFFICE rQ/Q
AA N/A
A 6.00% - 7.00% tu
B 6.50% - 7.25% tu
SUBURBAN OFFICE
A 6.25% - 7.50% tu
B 7.00% - 8.00% tu
INDUSTRIAL
A 5.90% 6.50% tu
B 6.75% 7.25% tu
RETAIL
Regional 5.50% - 6.00% tu
Power 5.75% - 6.50% tu
Neighbourhood 6.00% - 6.50% tu
Strip 5.25% - 6.50% tu
Strip (non-anchored)
5.25% - 7.00% tu
Urban Streetfront 6.50% - 7.50% tu
High Street N/A
APARTMENT
High Rise A 4.50% 5.00% tu
High Rise B 4.75% 5.25% tu
Low Rise A 5.00% 5.75% tu
Low Rise B 5.50% 6.00% tu
HOTEL
Downtown Full Service
8.25% - 9.00% tu
Suburban Limited Service
8.25% - 9.00% q
Focused Service 7.50% - 8.50% tu

INVESTMENT TRENDS Q4 2016 CAP RATES
VIEW ALL CANADIAN CAP RATES ON PAGE 17
13
After a record trading year, capital is lining up and ready for deployment in 2017. The higher the quality of an asset and its cash flow, the stronger the market response.
Notable market dynamics in 2016 involved the rise of residential land volumes and increased foreign buyer activity.
Development or redevelopment is the strategy that all investors seem interested in pursuing for most asset classes.
2017
Toronto
Peter SenstPresident, Canadian Capital MarketsNational Investment Teamwww.cbre.ca/peter.senst
DOWNTOWN OFFICE rQ/Q
AA 4.00% - 4.50% tu
A 4.25% - 4.75% tu
B 4.50% - 5.00% tu
SUBURBAN OFFICE
A 5.75% - 6.25% tu
B 6.75% - 7.25% tu
INDUSTRIAL
A 4.50% - 5.00% q
B 6.00% - 6.50% q
RETAIL
Regional 4.50% - 5.50% tu
Power 5.50% - 6.50% tu
Neighbourhood 5.00% - 6.25% q
Strip 5.25% - 6.25% tu
Strip (non-anchored)
6.25% - 7.25% tu
Urban Streetfront 4.00% - 4.50% tu
High Street 3.25% - 4.00% q
APARTMENT
High Rise A 3.25% - 3.75% tu
High Rise B 4.00% - 5.00% tu
Low Rise A 3.25% - 3.75% tu
Low Rise B 4.00% - 5.00% tu
HOTEL
Downtown Full Service
5.50% - 6.50% tu
Suburban Limited Service
7.00% - 8.50% tu
Focused Service 7.00% - 8.00% tu

INVESTMENT TRENDS Q4 2016 CAP RATES
VIEW ALL CANADIAN CAP RATES ON PAGE 17
14
Investors have indicated that commercial property in Ottawa is among their top targets following Vancouver and Toronto, and recent momentum is expected to continue through 2017.
2016 was a solid year for investment activity in Ottawa and was fuelled by some of the largest trades in the capital's recent history.
Land will account for a more significant contribution to overall investment volume in 2017, while cap rates are expected to remain steady.
2 13
YYZYOWYVR
Ottawa
Nico ZentilVice PresidentNational Investment Teamwww.cbre.ca/nico.zentil
DOWNTOWN OFFICE rQ/Q
AA 5.00% - 5.50% q
A 5.25% - 5.75% q
B 5.75% - 6.25% p
SUBURBAN OFFICE
A 6.25% - 7.00% tu
B 7.00% - 7.50% tu
INDUSTRIAL
A 6.00% - 6.25% tu
B 6.50% - 7.25% tu
RETAIL
Regional 5.00% - 5.75% tu
Power 5.75% - 6.50% tu
Neighbourhood 5.75% - 6.50% tu
Strip 5.50% - 6.25% tu
Strip (non-anchored)
6.50% - 7.50% tu
Urban Streetfront 4.75% - 5.50% tu
High Street N/A
APARTMENT
High Rise A 3.75% - 4.50% tu
High Rise B 4.75% - 5.50% tu
Low Rise A 4.00% - 4.75% tu
Low Rise B 4.75% - 5.50% tu
HOTEL
Downtown Full Service
7.00% - 8.00% tu
Suburban Limited Service
8.00% - 9.00% tu
Focused Service 7.50% - 8.50% tu

INVESTMENT TRENDS Q4 2016 CAP RATES
VIEW ALL CANADIAN CAP RATES ON PAGE 17
15
Investors craving a piece of Montreal’s high-performing industrial sector are being forced to sit on the sidelines as no product is for sale and construction is at decade lows.
A handful of landmark transactions put downward pressure on cap rates throughout 2016.
Despite record pricing across most sectors and classes, investors are increasingly diligent before setting new pricing records, particularly with office properties.
Montreal
Serge DuvalSenior Vice PresidentNational Investment Teamwww.cbre.ca/serge.duval
DOWNTOWN OFFICE rQ/Q
AA 4.75% - 5.25% tu
A 5.25% - 5.75% tu
B 5.75% - 6.50% tu
SUBURBAN OFFICE
A 5.75% - 6.75% tu
B 7.00% - 7.75% tu
INDUSTRIAL
A 5.75% - 6.50% tu
B 6.75% - 7.75% tu
RETAIL
Regional 5.00% - 5.75% tu
Power 5.75% - 6.75% tu
Neighbourhood 7.00% - 7.75% tu
Strip 5.25% - 6.00% tu
Strip (non-anchored)
7.25% - 8.00% tu
Urban Streetfront 4.50% - 5.00% tu
High Street N/A
APARTMENT
High Rise A 4.25% - 5.00% tu
High Rise B 5.00% - 5.75% tu
Low Rise A 4.75% - 5.50% tu
Low Rise B 5.75% - 6.75% tu
HOTEL
Downtown Full Service
7.50% - 8.50% tu
Suburban Limited Service
8.50% - 9.50% tu
Focused Service 8.00% - 8.75% tu

INVESTMENT TRENDS Q4 2016 CAP RATES
VIEW ALL CANADIAN CAP RATES ON PAGE 17
16
Retail accounted for the greatest proportion of investment trades in the Atlantic Region in 2016 and has done so for three of the last five years.
Fiera Properties completed the acquisition of HOOPP’s five building, 400,000 sq. ft. industrial portfolio in December.
Halifax’s apartment rental market tightened with vacancy dropping to 2.6% in 2016 from 3.4% in 2015.
Halifax
Chris CarterVice PresidentNational Investment Teamwww.cbre.ca/chris.carter
DOWNTOWN OFFICE rQ/Q
AA N/A
A 6.25% - 6.75% tu
B 7.00% - 7.50% tu
SUBURBAN OFFICE
A 6.50% - 7.50% tu
B 7.50% - 8.00% tu
INDUSTRIAL
A 6.00% - 7.00% q
B 7.25% - 7.75% tu
RETAIL
Regional 5.50% - 6.00% tu
Power 6.25% - 7.00% tu
Neighbourhood 6.75% - 7.75% tu
Strip 6.50% - 7.50% tu
Strip (non-anchored)
7.50% - 8.25% tu
Urban Streetfront 6.50% - 7.50% tu
High Street N/A
APARTMENT
High Rise A 4.75% - 5.25% tu
High Rise B 5.00% - 5.50% tu
Low Rise A 5.00% - 5.25% tu
Low Rise B 5.25% - 6.00% tu
HOTEL
Downtown Full Service
8.75% - 9.75% tu
Suburban Limited Service
9.50% - 10.50% tu
Focused Service 8.25% - 9.50% tu

rQ/Q Vancouver Calgary Edmonton Winnipeg London-Windsor
Q4 2016 Canadian Cap Rates
3.75% - 4.00% tu 5.25%- 5.75% tu 5.50%- 6.00% tu N/A N/A
3.75% - 4.25% tu 6.25%- 7.00% tu 6.75%- 7.25% tu 5.50%- 6.00% tu 6.50%- 8.50% tu
4.00% - 4.50% tu 7.75%- 8.50% tu 7.75%- 8.50% tu 6.50%- 7.00% tu 8.00%- 9.00% tu
4.75% - 5.50% tu 6.25%- 6.75% tu 6.75%- 7.25% tu 6.50%- 7.00% tu 7.50%- 8.00% tu
5.00% - 5.50% tu 7.25%- 8.00% tu 7.50%- 8.00% tu 7.00%- 7.50% tu 8.00%- 8.50% tu
4.50% - 5.00% tu 5.00%- 5.50% tu 5.25%- 5.75% tu 6.00%- 6.50% tu 7.00%- 8.00% tu
5.00% - 5.50% tu 6.25%- 6.75% tu 6.75%- 8.00% p 6.50%- 7.25% tu 7.75%- 9.00% tu
4.00% - 4.75% tu 5.00%- 5.50% tu 5.00%- 5.50% tu 5.50%- 6.00% tu 5.50%- 6.50% tu
5.00% - 5.00% tu 5.75%- 6.25% tu 5.75%- 6.25% tu 6.00%- 6.50% tu 6.25%- 7.00% tu
5.00% - 5.50% tu 5.25%- 5.75% tu 5.75%- 6.25% tu 6.50%- 7.00% tu 6.25%- 7.50% tu
4.75% - 5.25% tu 5.25%- 5.75% tu 5.50%- 6.00% tu 6.50%- 7.00% tu 6.00%- 7.00% tu
5.00% - 5.50% tu 6.25%- 6.75% tu 6.50%- 7.00% tu 6.75%- 7.50% q 6.00%- 7.50% tu
3.75% - 4.25% tu 5.75%- 6.25% tu 6.50%- 7.00% tu 6.00%- 6.75% tu 7.00%- 8.50% q
3.50% - 4.25% tu N/A N/A N/A N/A
2.50% - 3.00% tu 4.25%- 5.00% q 4.00%- 4.75% q N/A 5.00%- 5.50% tu
3.00% - 3.50% tu 4.25%- 5.00% q 4.75%- 5.25% tu 5.00%- 5.75% tu 5.25%- 6.50% tu
2.75% - 3.25% tu 4.25%- 5.00% q 5.00%- 5.75% q 5.50%- 6.00% tu 5.75%- 6.75% tu
3.25% - 4.25% tu 4.25%- 5.00% q 5.75%- 6.50% tu 5.75%- 6.00% tu 6.00%- 7.25% tu
5.50% - 6.50% tu 7.75%- 8.75% tu 7.75%- 8.75% tu 8.00%- 9.00% tu 8.25%- 9.00% tu
6.50% - 7.50% tu 9.25%- 10.25% tu 10.00%- 10.50% tu 9.50%- 10.50% tu 8.25%- 9.00% q
6.50% - 7.50% tu 8.25%- 9.25% tu 9.00%- 10.00% tu 8.00%- 8.75% tu 7.75%- 9.00% q
Downtown Office
AA
A
B
Suburban Office
A
B
Industrial
A
B
Retail
Regional
Sector/Power
Neighborhood
Strip
Non-anchored Strip Mall
Urban Streetfront
High Street
Apartment
High Rise A
High Rise B
Low Rise A
Low Rise B
Hotel
Downtown Full Service
Suburban Limited Service
Focused Service

rQ/Q Kitchener-Waterloo Toronto Ottawa Montreal Halifax
Q4 2016 Canadian Cap Rates
Downtown Office
AA
A
B
Suburban Office
A
B
Industrial
A
B
Retail
Regional
Sector/Power
Neighborhood
Strip
Non-anchored Strip Mall
Urban Streetfront
High Street
Apartment
High Rise A
High Rise B
Low Rise A
Low Rise B
Hotel
Downtown Full Service
Suburban Limited Service
Focused Service
N/A 4.00%- 4.50% tu 5.00%- 5.50% q 4.75%- 5.25% tu N/A
6.00%- 7.00% tu 4.25%- 4.75% tu 5.25%- 5.75% q 5.25%- 5.75% tu 6.25%- 6.75% tu
6.50%- 7.25% tu 4.50%- 5.00% tu 5.75%- 6.25% p 5.75%- 6.50% tu 7.00%- 7.50% tu
6.25%- 7.50% tu 5.75%- 6.25% tu 6.25%- 7.00% tu 5.75%- 6.75% tu 6.50%- 7.50% tu
7.00%- 8.00% tu 6.75%- 7.25% tu 7.00%- 7.50% tu 7.00%- 7.75% tu 7.50%- 8.00% tu
5.90%- 6.50% tu 4.50%- 5.00% q 6.00%- 6.25% tu 5.75%- 6.50% tu 6.00%- 7.00% q
6.75%- 7.25% tu 6.00%- 6.50% q 6.50%- 7.25% tu 6.75%- 7.75% tu 7.25%- 7.75% tu
5.50%- 6.00% tu 4.50%- 5.50% tu 5.00%- 5.75% tu 5.00%- 5.75% tu 5.50%- 6.00% tu
5.75%- 6.50% tu 5.50%- 6.50% tu 5.75%- 6.50% tu 5.75%- 6.75% tu 6.25%- 7.00% tu
6.00%- 6.50% tu 5.00%- 6.25% q 5.75%- 6.50% tu 7.00%- 7.75% tu 6.75%- 7.75% tu
5.25%- 6.50% tu 5.25%- 6.25% tu 5.50%- 6.25% tu 5.25%- 6.00% tu 6.50%- 7.50% tu
5.25%- 7.00% tu 6.25%- 7.25% tu 6.50%- 7.50% tu 7.25%- 8.00% tu 7.50%- 8.25% tu
6.50%- 7.50% tu 4.00%- 4.50% tu 4.75%- 5.50% tu 4.50%- 5.00% tu 6.50%- 7.50% tu
N/A 3.25%- 4.00% q N/A N/A N/A
4.50%- 5.00% tu 3.25%- 3.75% tu 3.75%- 4.50% tu 4.25%- 5.00% tu 4.75%- 5.25% tu
4.75%- 5.25% tu 4.00%- 5.00% tu 4.75%- 5.50% tu 5.00%- 5.75% tu 5.00%- 5.50% tu
5.00%- 5.75% tu 3.25%- 3.75% tu 4.00%- 4.75% tu 4.75%- 5.50% tu 5.00%- 5.25% tu
5.50%- 6.00% tu 4.00%- 5.00% tu 4.75%- 5.50% tu 5.75%- 6.75% tu 5.25%- 6.00% tu
8.25%- 9.00% tu 5.50%- 6.50% tu 7.00%- 8.00% tu 7.50%- 8.50% tu 8.75%- 9.75% tu
8.25%- 9.00% q 7.00%- 8.50% tu 8.00%- 9.00% tu 8.50%- 9.50% tu 9.50%- 10.50% tu
7.50%- 8.50% tu 7.00%- 8.00% tu 7.50%- 8.50% tu 8.00%- 8.75% tu 8.25%- 9.50% tu
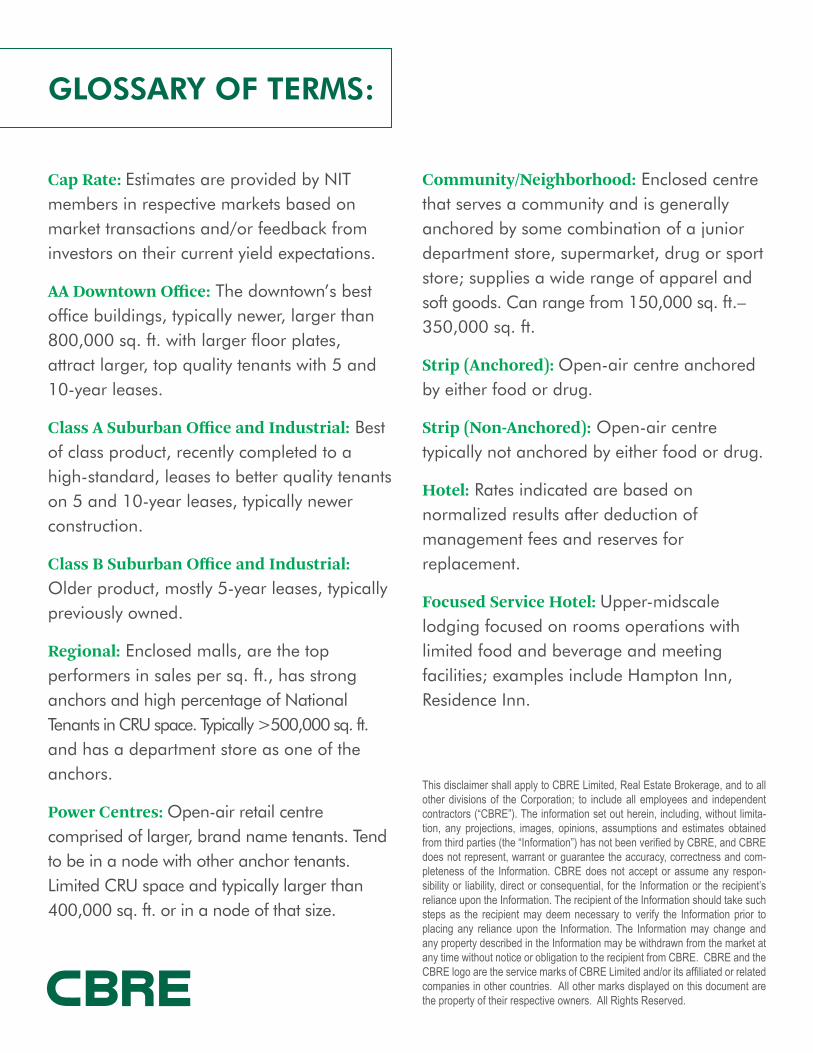
Cap Rate: Estimates are provided by NIT members in respective markets based on market transactions and/or feedback from investors on their current yield expectations.
AA Downtown Office: The downtown’s best office buildings, typically newer, larger than 800,000 sq. ft. with larger floor plates, attract larger, top quality tenants with 5 and 10-year leases.
Class A Suburban Office and Industrial: Best of class product, recently completed to a high-standard, leases to better quality tenants on 5 and 10-year leases, typically newer construction.
Class B Suburban Office and Industrial: Older product, mostly 5-year leases, typically previously owned.
Regional: Enclosed malls, are the top performers in sales per sq. ft., has strong anchors and high percentage of National Tenants in CRU space. Typically >500,000 sq. ft. and has a department store as one of the anchors.
Power Centres: Open-air retail centre comprised of larger, brand name tenants. Tend to be in a node with other anchor tenants. Limited CRU space and typically larger than 400,000 sq. ft. or in a node of that size.
Community/Neighborhood: Enclosed centre that serves a community and is generally anchored by some combination of a junior department store, supermarket, drug or sport store; supplies a wide range of apparel and soft goods. Can range from 150,000 sq. ft.–350,000 sq. ft.
Strip (Anchored): Open-air centre anchored by either food or drug.
Strip (Non-Anchored): Open-air centre typically not anchored by either food or drug.
Hotel: Rates indicated are based on normalized results after deduction of management fees and reserves for replacement.
Focused Service Hotel: Upper-midscale lodging focused on rooms operations with limited food and beverage and meeting facilities; examples include Hampton Inn, Residence Inn.
GLOSSARY OF TERMS:
This disclaimer shall apply to CBRE Limited, Real Estate Brokerage, and to all other divisions of the Corporation; to include all employees and independent contractors (“CBRE”). The information set out herein, including, without limita-tion, any projections, images, opinions, assumptions and estimates obtained from third parties (the “Information”) has not been verified by CBRE, and CBRE does not represent, warrant or guarantee the accuracy, correctness and com-pleteness of the Information. CBRE does not accept or assume any respon-sibility or liability, direct or consequential, for the Information or the recipient’s reliance upon the Information. The recipient of the Information should take such steps as the recipient may deem necessary to verify the Information prior to placing any reliance upon the Information. The Information may change and any property described in the Information may be withdrawn from the market at any time without notice or obligation to the recipient from CBRE. CBRE and the CBRE logo are the service marks of CBRE Limited and/or its affiliated or related companies in other countries. All other marks displayed on this document are the property of their respective owners. All Rights Reserved.


