-,, .' FINAL REPORT CONTRACT NASW- 1 625 NASA HEADQUARTERS Washington, D. C. and JET PROPULSION LABORATORY Pasadena , Cal ifornia i INVESTIGATION OF POLYMERIC COATINGS BY ELECTRODELESS DISCHARGE 7 qb BY 1- J. P. Redmond 8 A. F. Pitas w w OLL 11 cn -- u ral nr - 1 0 u O 2 z S G m an E 2 : xr;: n a o = F o w nk Q O 8= m COMMONWEALTH SCIENT IFIC CORPORATION (0 500 Pendleton Street Alexandria, Virginia -22039 i https://ntrs.nasa.gov/search.jsp?R=19680012570 2020-03-15T22:11:39+00:00Z
Transcript
- , ,
.'
FINAL REPORT
CONTRACT NASW- 1 625
NASA HEADQUARTERS Washington, D. C.
and
JET PROPULSION LABORATORY Pasadena , Cal ifornia
i INVESTIGATION OF POLYMERIC COATINGS
BY ELECTRODELESS DISCHARGE
7
q b BY
1 - J. P. Redmond 8 A. F. Pitas w w O L L 1 1 cn - -
COMMONWEALTH SCIENT IFlC CORPORATION 500 Pendleton Street AI exandria, Virginia
INDEX
e i I
I I I I I I I
I
I
II
Ill
IV
V
V I
SUMMARY
INTRODUCTION
EXPERIMENTAL APPARATUS
RESULTS AND DISCUSS IONS
A. Ethylene and Isobutylene Fi lm
B. Acetylene Films
C. Diacetylene Films
D. Fluorinated Films
E. Toluene Films
DEPOS IT ION PARAMETERS
A. Kinetics
B . Composition
C. Oxygen Studies
INFRARED RESULTS
A. Aliphatic Films
B. Absorbency Ratio
C.
D. Deuterium Content of Films
E.
F. Polyethylene Chain
G.
H.
Degree of Unsaturation Present in Films
Presence of Carbonyl Groups in Films
Infrared Spectra of Films Produced from Toluene
Infrared Spectra of Films Produced from Trifluoroethylene and Tetrafluoroethylene
VI1 CONCLUSION
Page 1
4
7
10
10
15
15
15
16
17
17
17
22
23
23
28
29
31
34
36
36
-
36
38
e c I I t I
I SUMMARY
The intent of this program was to investigate the composition, structure, chemical
and physical properties of polymeric films deposited via electrical discharge from low
molecular weight organic compounds. To accomplish this a series of hydrocarbons were
selected with varying hydrogen to carbon compositions as the reactants. These monomers
included isobutylene (C4H8), ethylene (C H ), acetylene (C2H ) and diacetylene
(C4HJ, a liquid. Also, plastic films were deposited from toluene (C H ), trifluoro- 2 4 2
7 8 ethylene (C HF ) and tetrafluoroethylene (C F ) to aid i n the identification of the 2 3 2 4 structure of the hydrocarbon fi lms.
the selected hydrocarbons, followed by chemical and infrared analysis to note the changes
in the properties of the fi lms.
analyzed for carbon, hydrogen and residue.
were investigated in strong acids, bases and in organic solvents. The physical properties
of the f i lms such as color and thermal stability in air were characterized. Finally the
deposition parameters were investigated to elucidate the reaction mechanism.
Likewise, hydrogen or deuterium were premixed with
Besides infrared analysis, the fi lms were quantitatively
In addition, the solubility of the f i lms
This program was carried out over a nine month period, and was divided into five
phases. The first phase was the construction of a vacuum apparatus to deposit the fi lms.
The second phase was to deposit sufficient quantities of the fi lms prepared from the four
selected hydrocarbons to characterize these polymers. The third phase was to prepare
polymers from the selected compounds after premixing them with hydrogen or deuterium
in mlecular ratios of 1/1, 2/1 and 4/1. The fourth phase was to investigate the
structure of fi lms prepared from toluene, trifluoroethylene and tetrafluoroethylene. The
final phase was to evaluate the results of the study as to the nature of the f i l m and to
clarify as much as possible the deposition process.
The results from the infrared and chemical analysis data established that f i lms
deposited from ethylene have a structure analogeous to a highly cross-linked poly-
ethylene. The infrared spectra were strikingly similar to the spectra obtained from
commercial plastics which were chemically cross-linked or cross-linked by high energy
radiation. The fi lms prepared from isobutylene were similar to those prepared from
1
. . ! -
I
I I I I t
ethylene except that in the infrared spectra of the isobutylene fi lms aromaticity was
detected. Thus the structure of this f i lm was more analogeous to a polyethylene-
polystrene copolymer. The fi lms generated from acetylene or diacetylene were also
similar to the polyethylene infrared spectras, however, the acetylene and diacetylene
fi lms possessed a larger fraction of carbon-carbon double bonds. From the infrared
spectras it was clearly evident that diacetylene f i lms contained a greater degree of
unsaturated linkages than the acetylene. This was also consistent with their hydrogen/
carbon ratios obtained by the chemical analysis of the f i lm as well as their color.
fact, a correlation was obtained between the relative degree of unsaturation of the
f i l m and the hydrogen/carbon content of the f i lm .
to monitor the incorporation of deuterium into the polymeric f i lms to verify that the
composition of the fi lms are more a factor of the atomic concentration rather than the
chemical reactivities of the monomer. Toluene fi lms exhibited considerable aromaticity
i n i t s spectra and more closely resembled the spectra of polystyrene. The infrared
spectras of tri- and tetrafluoroethylene gave very broad bands, consequently, it was
not possible to catagorize these teflon-like f i lms.
In
Infrared analysis was further used
The presence of carbonyl groups was identified i n the structure of a l l the
deposited film; this was verified with the compositional analysis. While no systematic
investigation was undertaken to establish the source of oxygen, i t was found that pre-
mixing oxygen with the hydrocarbon reactants inhibited or removed any f i l m formation.
We tend to support the explanation presented by others (see reference 4) that the
presence of carbonyl groups in the f i lms i s due to oxidation of the f i lm on exposure
t o air.
The color of the f i lms varied from light yellow to a dark reddish brown. The
higher the percentage of hydrogen in the f i l m the lighter i t s color. All f i lms were
rather britt le. The fi lms were insoluble in hydrochloric acid, sodium hydroxide and
common organic solvents such as trichloroethylene and acetone. However, the fi lms
containing a relatively greater amount of hydrogen showed some reactivity to concen-
trated sulfuric acid.
2
I I I I I I
In the evaluation of the deposition parameter data, it was found that gases con-
taining a low ratio of hydrogen to carbon deposited f i lms at a much faster rate than
starting gases containing a higher hydrogen ratio. It was noted that when the plasma
was initiated in the presence of acetylene the pressure in the system decreased while
the opposite was true for gas mixtures containing higher hydrogen to carbon ratios
such as isobutylene.
ing low molecular weight hydrocarbon products. The ratio of hydrogen to carbon in
these f i lms varied from 1/1 to 1.9/1 and was clearly dependent on the hydrogen to
carbon ratios of the input gases.
In essence, the hydrogen inhibited the f i l m deposition by reform-
The net result from this study i s that continuous, homogeneous, adherent
plastic coatings can be vapor deposited via an electrical discharge. These f i lms are
very highly cross-linked, consequently, they possess good thermal and chemical
stabilities. In addition they are nonpermeable and would exhibit low outgassing
characteristics. Even more significant i s the fact that the f i lm can be tailored to
meet specific applications. For example, one could init ial ly deposit a f i l m from
ethylene and then gradually switch the gas composition to deposit a teflon-like f i l m
from tetrafluoroethylene with no demarkation line. The chemical and thermal inert-
ness of these films suggest they might find applications as nonpermeable coatings in
fuel storage containers, however, more work i s needed to establish commercial
applications of these polymers. During this program it was not possible to investigate
the dielectric properties of the polymers or to investigate other f i lm forming materials
such as the organosilanes, phosphines or boranes.
3
t . . .
i I I I I I I I I I I I I I I
II INTRODUCTION
The use of an electrical discharge as a means of initiating unusual chemical
reaction i s receiving renewed attention"). By the use of this technique a variety of
organic polymeric films can be deposited. Vastola and Wightman ( 2) employing a
microwave discharge have prepared films from low molecular weight strength chain
hydrocarbons plus benzene and napthadene. While there i s some question as to the
structures of the polymeric films, it i s evident that adherent, nonpermeable poly-
meric f i lms can be deposited with unusual chemical and thermal stability. Thus the
f i lms may be uti l ized in applications requiring corrosion protection, a permeation
barrier, or as coupling agents. Also, these fi lms could be used in circumstances
requiring a low vapor pressure material or a plastic with extreme chemical inertness.
These properties make the plasma deposited polymer attractive candidate materials
for aerospace applications.
Therefore, this process should be further investigated for the following
reasons: To elucidate the nature of these hydrocarbon films, to establish the deposi-
t ion mechanism and to deposit and evaluate other f i l m forming materials. This
program was initiated to accomplish these objectives and thus to provide a foundation
for engineered coatings designed to meet specific aerospace requirements
In order t o clarify the structure of the polymeric films, a series of organic
compounds were examined to determine the correlation between the starting com-
pounds and their deposited f i lms. The four hydrocarbon compounds selected for study
were isobutylene (i C H ), ethylene (C H ), acetylene (C2H2) and diacetylene
(C H ). These compounds were chosen because of their hydrogen to carbon ratios 4 2 and total carbon content
and the structures of their polymeric f i lms were investigated by infrared analysis and
by chemical analysis. The physical properties of the f i lms were obtained by softening
4 8 2 4
These monomers were reacted and deposited in a plasma
1 . 2.
"Symposium on Chemical Reactions in Electrical Discharges" American Chemical Society, 153d National Meeting, April 1967. F. J. Vastola and J. P. Wightman, J. Appl. Chem. - 14 69 (1964).
4
h I I I I I I I I I I I I I
point or thermal degradation measurements and solubility test. The f i lms were tested
for solubility i n concentrated hydrochloric and sulfuric acids and sodium hydroxide
plus the common organic solvents such as trichloroethylene and acetone. The solu-
b i l i ty of a material in a particular solvent provides a clue as to the functional groups
and structure of the material.
The deposition process was studied by following the effect of system pressure,
gas flow rates, power input to plasma and gas composition on the rate at which the
f i l m i s deposited. In order to more fully understand the deposition process and the
structure of the film, both hydrogen and deuterium were premixed with each of the
four hydrocarbon compounds in molar ratios of 1/1, 2/1 and 4/1. The premixing of
hydrogen with the starting monomer was used to correlate the composition of the
starting gas with the composition of the f i l m as well as the color and physical
properties of the fi lms and to determine the effect of added hydrogen on the deposi-
t ion rate. The premixing of deuterium with each of the four starting compounds was
designed to be used in the interpretations of the infrared spectras of the films, thus
i t s purpose was to verify the extent which hydrogen enters into the deposited fi lms.
Besides the four aliphatic compound, coatings were also prepared from toluene
trifluoroethylene and tetrafluoroethylene. Toluene was included in the study to com-
pare the structure and properties of films prepared from an aromatic compound with
aliphatic hydrocarbons. The two fluoronated compounds were added to the program
t o evaluate as potential f i l m materials. In addition, since hydrofluoric acid vapors
were used to remove the deposited hydrocarbon f i lms from the walls of the reaction
tube there was the possibility of fluorine reacting with the coatings and confusing
the interpretation of the infrared patterns.
Thus a research program was devised to extensively investigate the structure,
composition and properties of polymeric-l ike materials deposited from an electrical
discharge. This was a nine month program.
of an apparatus to produce the films; the preparation and examination of samples
prepared from isobutylene, ethylene, acetylene and diacetylene; the study of
hydrogen and deuterium additions to the starting compounds and the examination of
It called for the design and construction
5
f i lms prepared from toluene and fluoronated ethylenes as well . All these objectives
of the program were accomplished, and significant findings were obtained both as to
the structure of the f i lms and the deposition process and a basis has been laid for the
extensive development of tailor-made coatings and free-standing specimens.
I I I I I I I I
I
6
Ill EXPERIMENTAL APPARATUS
I I I I I I I I I
~ ~~
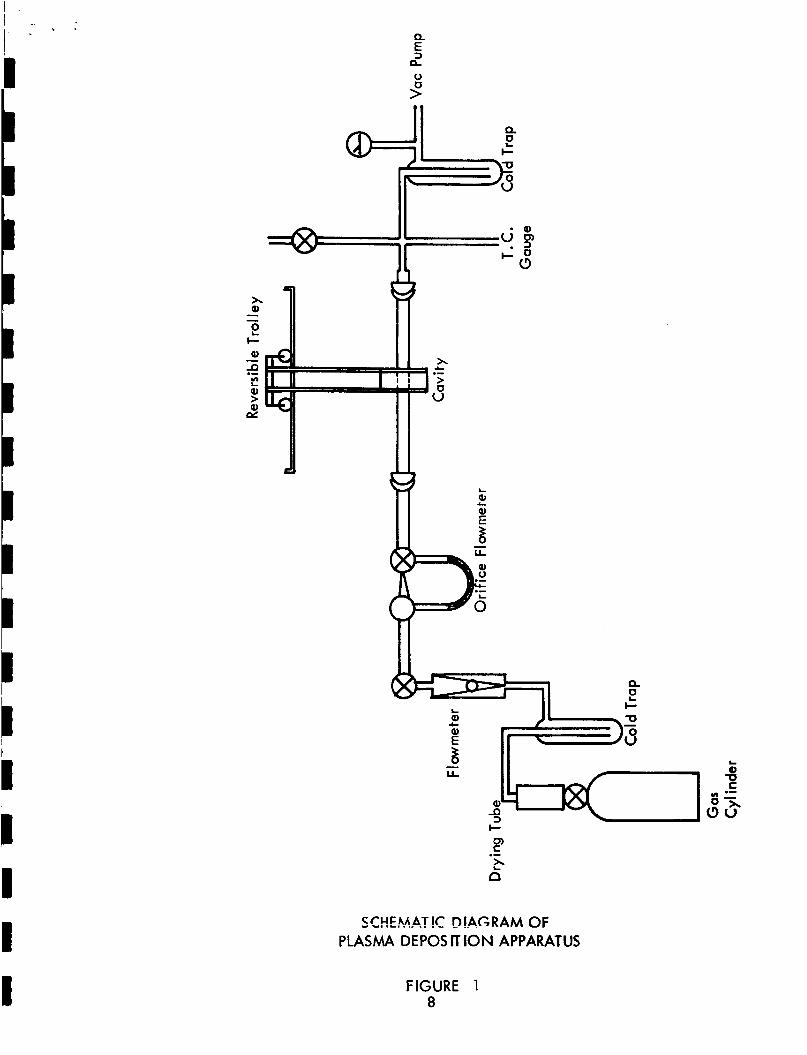
Essentially the coating apparatus consisted of a vacuum rig to control and
monitor the gases, a microwave generator with a resonance cavity and a means of
sliding the microwave cavity back and forth along the reaction chamber t o provide
for the collection of a sufficient quantity of sample.
A schematic drawing of the apparatus has been shown in Figure 1 . Essentially,
the experimental apparatus consisted of a gas purifying system to remove any impuri-
ties entrained i n the gas being supplied to the system. A flowmeter (J. T . Baker)
with both pyrex and stainless steel floats was used to measure the gas flow from
5.0 cc/min. to 150 cc/min. A Nupro needle valve was used to control the gas
flow. An orifice type flowmeter was added to the system to increase the sensitivity
of the measurement of gas flows particularly at low flow rates. This flowmeter
consisted of a U-tube on which a stopcock with a hollow stopper was mounted. The
stopper contains four orifices from approximately 1/4 to 2 mm. i n diameter. Silicone
f luid i s used in the U-tube to measure the pressure drop across the orifice, this
pressure drop i s directly related to the gas flow rate.
containing silicone oil was employed to measure the total pressure of the system, while
a Televac thermocouple gauge was used to measure ultimate vacuum within the
system.
pressure measurement. A Welsh two-stage, duo-seal, model 1405 vacuum pump was
used to evacuate the system.
In addition, a U-tube mannometer
Finally, a Bourdon gauge was incorporated in the system to obtain a rough
A trolley was used to slide the cavity of the microwave generator back and
forth along the reaction tube. The length of travel of the cavity i s 3-1/2 ft.
required ten seconds for the cavity to traverse the length of the reaction tube.
Microswitches and an impulse relay are employed to reverse the slo-syn synchronous
motor at the end of the travel.
It
A Raytheon microwave generator model PGM-10 which operates at 2450
megacycles was used to produce the plasma. The generator transrnited the high
C - - - l ~ - n c \ / I I by’”’.”, alortrnmnanetic - .“_. * -...- rndiation to an Opthos quarter wave resonance cavity.
7
. . I .. I ’ .
c
SC!-!E?.A..A.?!C D!AGRAM OF PLASMA DEPOSIT ION APPARATUS
FIGURE 1 8
e
This cavity was tuneable and was air cooled. The power input from the generator t o
the cavity was measured by a Micromatch reflected power meter. A Teslo coi l was
used to ignite the plasma.
Before a run, the system was evacuated to 0.1 torr and leak checked. The
flow rate of the starting gas was measured along with the system pressure. When the
plasma was generated the run was commenced, and, in general, the experiment dura-
t ion was from ten minutes to an hour. The microwave power was generally set at
25 watts. The flow rate of starting gases was varied from 0.01 to 0.06 cubic feet
per hour (CFH) and the pressure during a run ranged from 0.5 to 1.5 torr.
After a run, the reaction chamber was removed from the system and the
deposited f i l m was released from the walls of the tube by scratching the f i l m with a
wire and passing hydrofluoric acid vapor down the tube. By scratching the fi lm,
the acid vapors were able to undercut the fi lm and release the coating. The f i l m
was then brushed off the walls into a collecting bottle. The sample was then weighed,
examined microscopically and sent for analysis.
Aldridge Associates of Washington, D. C. performed the chemical analysis.
The samples were analyzed for carbon, hydrogen and residue. Oxygen percentage
content of the film was calculated by subtracting the sum of the carbon, hydrogen
and residue from one hundred. The infrared analysis was done at the Jet Propulsion
Laboratory under the direction of Mr. David Lawson. A Perkin and Elmer Model 421
Infrared Spectrometer was used. The fi lms were examined by mixing approximately
0.05% of the ground plastic film with potassium bromide and pressing a 13 mm disc
at 21,000 psi.
The hydrocarbon gases were purchased from Matheson Chemical Co. and no
special purification treatments were given to the gases outside of passing through a
drying tube prior to entering the system. Diacetylene was prepared in our laboratory (3 )
by the procedure described by Armitage et al .
3. Armitage, Jones & Whitney, J. Chem. SOC. 44 (195 ).
9
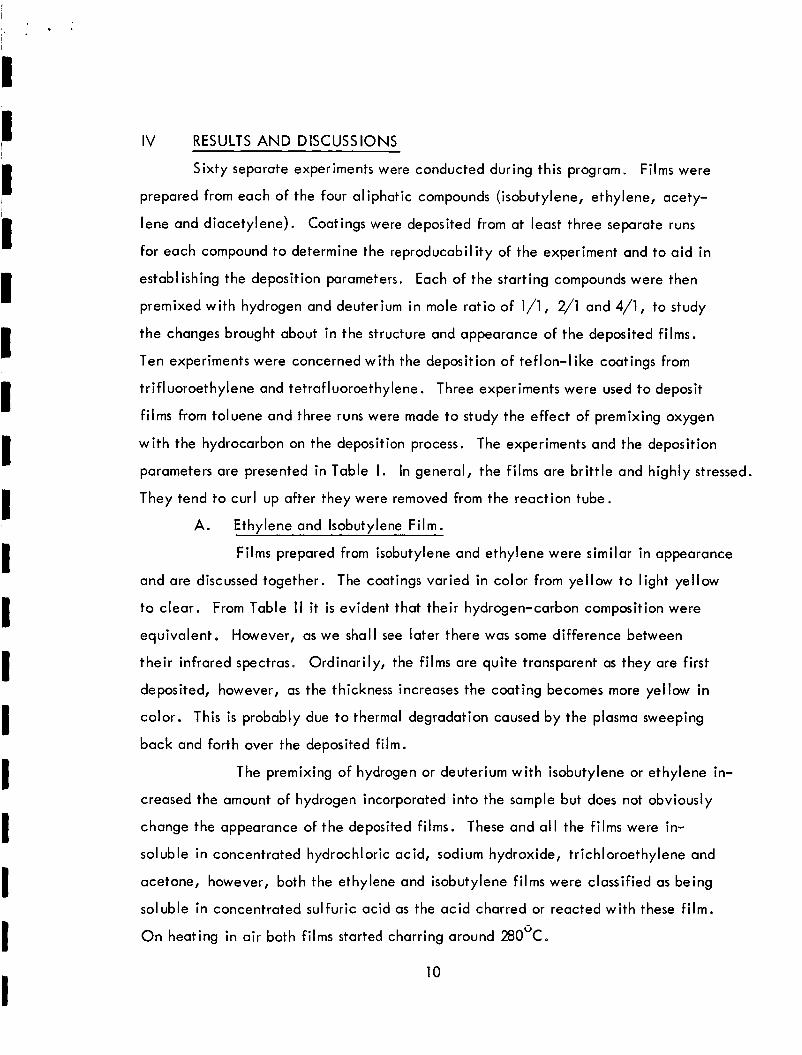
IV RESULTS AND DISCUSSIONS
Sixty separate experiments were conducted during this program. Films were
prepared from each of the four aliphatic compounds (isobutylene, ethylene, acety-
lene and diacetylene). Coatings were deposited from at least three separate runs
for each compound to determine the reproducability of the experiment and to aid i n
establishing the deposition parameters. Each of the starting compounds were then
premixed with hydrogen and deuterium in mole ratio of 1/1, 2/1 and 4/1, to study
the changes brought about in the structure and appearance of the deposited films.
Ten experiments were concerned with the deposition of teflon-like coatings from
trifluoroethylene and tetrafluoroethylene. Three experiments were used to deposit
f i lms from toluene and three runs were made to study the effect of premixing oxygen
with the hydrocarbon on the deposition process. The experiments and the deposition
parameters are presented in Table I . In general, the fi lms are brittle and highly stressed.
They tend to curl up after they were removed from the reaction tube.
A. Ethylene and Isobutylene Fi lm.
Films prepared from isobutylene and ethylene were similar in appearance
and are discussed together. The coatings varied in color from yellow to light yellow
to clear. From Table I 1 it i s evident that their hydrogen-carbon composition were
equivalent. However, as we shall see later there was some difference between
their infrared spectras. Ordinarily, the f i lms are quite transparent as they are first
deposited, however, as the thickness increases the coating becomes more yellow in
color. This i s probably due to thermal degradation caused by the plasma sweeping
back and forth over the deposited fi lm.
The premixing of hydrogen or deuterium with isobutylene or ethylene in-
creased the amount of hydrogen incorporated into the sample but does not obviously
change the appearance of the deposited films. These and al l the f i lms were in-
soluble in concentrated hydrochloric acid, sodium hydroxide, trichloroethylene and
ng
m.
acetone, however, both the ethylene and isobutylene f i lms were classified as be
soluble in concentrated sulfuric acid as the acid charred or reacted with these f i
O n heating in air both f i lms started charring around 280°C.
10
TABLE 1 PROCESS CONDITIONS FOR DEPOS IT ION OF POLYMERIC COATINGS~
Expt Gases H/C Flow Rate Pres A P Dep' n Rate No. Moles Rat io CFHC Torr Torr Mg/Mi n
I 2/1 0.06 : - . v 1 .5 0.5 0.6 I gb 'qH8
2/1 0.05 1 . 1 0.1 1 .o 7 l C q H 8 I I
8 C2H4 2/1 I 9 C2H4 2/i
0.02
0.05
1/1 0.05
2/1 0.07 C2H2 10
1 1 l C q H 8
1/1 0.01 C2H2
C2H2
16
17 C2H4 1 Ar 2/1 0.04
I I 18
1 Ar 1/1 0.02
I 19 10 C2H2
1 .o -- 3.5
1.4 0.4 0.6
1 .o 0 3.0
0.7 -- -- 0.8 0.2 --
-- 0.5 0
1.3 -0.3 --
-- 1.9 0
0.5 -0.2 --
0.6 -0.1 19.0
1.8 -0.1 1.7
C2H2
H2
H2
H2
21
3/1 0.03
C2H4 22 I
3/1 0.03
C2H4 23
4/1 0.01
1 .o -0.1 1.8
2.6 -- 0.5
0.6 0 7 .O
3/1 0.02 1.3 -- 1.7 C2H4 24
D2
a.
b. c .
Power imput from microwave yei-lerafs; was set nt 75 watts, runs lasted from 15 min. to
180 min. Data for runs 1 thru 5 were not recorded. CFH = Cubic feet per hour at STP condition.
1 1
I I
Expt Gases H/C Flow Rate Pres P Dep’n Rate No. Moles Ratio CFH Torr Torr Mg/Mi n
25
26
27
28
29
30
31
32
33
34
35
0.01
0.02
2.1
0.4
1.3 --
-0.37 --
0.02 1.5 -1.0 --
Experiment Terminated -- See Expt. No. 34
0.02
0.02
0.03
0.03
0.03
0.02
0.8
1 . 1
0 1.8
0.9 1.4
0.9
1.5
0.4
0.2
0.2 0.9
0.3 0.3
0.15 0.4
-- 0.73
I C2H4 H2
5/2 0.03
36
37 3/1 0.02 0.7 0.14 1.3
4/1 0.03 1 .o ,0.1 -- 38
39
0.03 1.3 0 0.5
0.03
0.17
0.05
-- 6.8
0.2 I ‘qH2
‘qH2
40 41
42 i i 4 H 2
D2 3/2 0.01 0.7 .0.74 1.8
12
I
I C i
I c c e 1 I I I I I I
I
H/C Flow Rate Pres P Dep’n Rate Expt Gases No. Moles Rat io CFH Torr Torr Mg/Min
43
44
45
46
47
48
49
50
51
52
53
54
55
56
57
58
59
60
‘qH2
l C q H 2
l C q H 2
lCqH2
l C q H 2
C2HF3
C2HF3 1 C2HF3 + 1 Ar C2HF3 + H 2
D2
D2
H2
H2
2H F3 C2HF3 + O2
C2H2 + O2
CH3 CH3 + O2
2F4
2F4
2F4
c2F4
0.02 --
0.02 0.8
0.02 0.4
0.01+ 0.5
Experiment terminated
0.01+ 0.15 0.005 --
0.02 0.01
0.005
0.005
0.06
0.01
0.005
0.01
0.005
0.005
0.01
13
0.07 -- .15 -- -- .88 -- Varied
0.15
.15 --
2.6
1.25
0.70
0.6
4.93
1.73
1.93 4.9
3.1
No coating
N o coating
4.33
No coating
-- -- -- 1.7
i I I I I i I I I I I I I I I
TABLE II
CHEMICAL ANALYSIS OF POLYMERIC FILMS
Expt Gases H/C Ratio Analysis Wt % H/C Ratio(b) No. Mole/Ratio Input C H Res. Dif.(a) F i lm
Isobutylene 1 1 C4H8 2 72.9 8.8 5.8 0.52 1.46
31 C4H8 +4H2 4 55.8 8.3 14.8 21.1 1.79
Ethylene
13 C2H4 2 79.1 9.5 4.8 6.6 1.44
17 C2H4 + A r 2 81.5 9.3 TR 9.2 1.37
23 C2H4 + 2H2 4 78.0 10.5 4.0 7.6 1.62
32 C2H4+4H2 6 59.5 8.7 12.4 23.3 1.76
38 C2H4+4D2 6 71.4 10.5 6.1 12.0 1.79
Acet VI ene
15 C2H2 1
18 C2H2+Ar 1
83.5 8.4 2.4 5.7 1.2
71.7 7.1 9.2 12.0 1.2
21 C2H2+2H2 3 83.6 9.7 TR 6.7 1.39
33 C2H2+4H2 5 61.3 8.9 8.9 21. 1.75
Diacetyl ene
41 C4H2 0.5 64.5 6.2 2.5 26.8 1.15
1 74.5 8.4 5.3 11.8 1.35 43 C4H2+D 2
42 C4H2+2D2 1.5 59.0 7.8 2.0 31.2 1.58
F/C Ratio Fluorinated Ethylene F/C Ratio
51 C2HF3+H2 1.5 36.8 2.9 52.7 -- 0.94
60 C2F4 2 29.7 0.7 68.4 1.45
(a) ' \ I ne ulrl~lcllbG l'rr------ I; VY,U...rr -L4.-.:naA h\, -, cllht ---.rscting the combined weight percentages from 100. The difference i s taken as the oxygen content of the films.
(b) This i s calculated from the respective atomic mole fractions.
14
B. Acetylene Films.
The f i lms prepared from acetylene were brown to orange-brown in
appearance. The addition of hydrogen tended to lighten the fi lm color t o a yellow.
The compositional analysis of the acetylene f i lm which i s listed i n Table II showed a
lower hydrogen/carbon ratio i n the f i lm as compared to isobutylene or ethylene films.
This evidence combined with the color of the f i l m suggest increased unsaturation in
this f i lm. This i s verified from the infrared results which w i l l be discussed later.
The acetylene f i l m did not react with the concentrated sulfuric acid and was
classified as insoluble. O n heating these film, they started charring near 34OoC.
C. Diacetylene Films.
The f i lms prepared from diacetylene were black to dark red-brown in
color. Table 11 shows that these f i l m have the lowest hydrogen to carbon ratio. Pre-
mixing hydrogen with the diacetylene while passing the mixture through the plasma
deposits a f i l m with a higher hydrogen ratio in addition it lightens the color from a
black to an orange-brown. As we shall see later from the infrared results, the diacety-
lene fi lms contain the highest percentage of carbon-carbon double bonds. Though the
f i lms are also insoluble i n sulfuric acid, they do start to char on heating to above
30OoC.
D. Fluorinated Films.
Coatings were deposited from trifluoroethylene and tetrafluoroethylene.
In physical properties the fi lm were similar to each other but they differed in
appearance. Both f i lms were insoluble in al l the solvents previously mentioned.
They both had a charring point in the range of 320° to 340°C. However, the tetra-
fluoroethylene gas produced a dirty-white polymeric material greatly resembling
teflon; whereas, the trifluoroethylene produced a brown f i l m similar to the hydro-
carbon films. The chemical analysis of these fi lms showed that the tetrafluoroethylene
had a stoichmetric composition of C F while the trifluoroethylene had a composition 2 3 The infrared patterns for the fi lms were very similar. Both samples
Of C2F2H1 .5 ' S l i c i + - ~ c I B vcyj drffvse, Clrclnd; poorly resolvable spectra.
15
E. Toluene Films.
Toluene deposited at a relatively high deposition rate (3 mg/min). The
pressure in the system decreased (-0.3 torr) when the plasma was initiated indicating
a fairly efficient deposition process. The films were yellow in color much l ike the
aliphatic hydrocarbon fi lms. Unfortunately no chemical analysis were made on the
deposited f i lm. The infrared spectra suggested that fi lms were analogeous in structure
to a polystyrene plastic. This w i l l be discussed in more detail i n the section on
infrared.
16
V DEPOS IT ION PARAMETERS
A. Kinetics.
The deposition rate of the p.xma deposited f i lms was directly related
again to the hydrogen-carbon ratio of the input gases. The deposition rates for
over twenty runs has been plotted in Figure 2. The microwave power input used
in these runs to generate the plasma was approximately 25 watts. The flow rate
for the gases was varied from 0.01 to 0.04 CFH. The pressure during a run ranged
from 0.5 to 1.5 torr. The system was evacuated to a pressure of 0.1 torr and leak
checked before a run commenced. It should be noted i n Figure 2 that over a ten-
fold change in deposition rate was observed over the range of gas compositions
studied. The low deposition rate for the gas mixtures containing a high hydrogen
concentration was due to formation of low molecular weight products such as methane
i n the plasma. This was substantiated by the data shown in Figure 3 where the
pressure change in the system was measured before and after when the plasma was
initiated and this differential pressure change was plotted against the hydrogen-
carbon ratio of the input gases. Again, to obtain this differential pressure change,
the pressure i n the system was measured with reactant gases flowing, and then the
system pressure i s re-measured after the piasma was iyri i td. This p r c x x e C~(?I?- a-
could have been an increase or decrease depending on the hydrogen content of the
starting gases. Evidently the hydrogen was inhibiting the deposition process by
forming law molecular weight exhaust products.
The results of the kinetic data indicate that the deposition rate was
more of a function of the element content of the reactants than the concentration of
the individual compounds. N o effort was made to determine a rate expression from
the data as there was too much scatter i n the data.
B. Composition.
In order to clarify the relationship between the starting gases and their
fi lm, the four aliphatic compounds were premixed with hydrogen in molar ratios of
l/l, 2/1 and 4/1 and the resulting f i lms deposited by the plasma were quantitatively
analyzed. The plot of data for the hydrogen-carbon compositionai ratio for the
17
. .
I I I I I I
6.0
5 .O
W I- 2 4.0 z '=; z 4
(3
z 3.0
z 0
5 2.0
-
o?:
A A
W
o?:
Z I- - L W n
1 .o
0
-? Monomer With or Without Hydrogen Added
0 C2H4
P.,A.T!O OF !-!/C OF !NPlJT GASES
FIGURE 2 18
I i
c I I 1 I
E 1
I
I
I 1
0.4 n
4 t 0.3 Z
W I-
- 3 0.2 v)
4 z 0.1 L
W
$ 0 W
0 Z
v $4.1
W cki
m m W
L
3 -0.2
-0.3
-0.4
a
RATIO OF H/C OF INPUT GASES
FIGURE 3 19
. . i - .
various deposited film against the total hydrogen to carbon content of the input
gases has been shown in Figure 4. While there was some data scatter, it was clearly
evident there i s a nearly linear correlation between the f i l m composition and starting
gases. While this was expected, the relative amount of hydrogen contained in
the f i l m was not directly equal to the relative amount of hydrogen present in the
starting gas. As more and more hydrogen was added the hydrogen-carbon ratio in
the f i lm should asymptotically approach a ratio of 2.0 which was the vaiue for a
linear chain f i l m of polyethylene. A l ine has been marked on the graph which
notes the solubility of the fi lms in concentrated sulfuric acid. The f i l m containing
a H/C ratio of greater than 1.4 were soluble in the acid and had a lower charring
temperature which was an indication of the reactive hydrogen content in the films.
20
2.0/1
1.75/'
1.5/1
.E/
Y = 1/1
8 Q 3 I-
0.75/
0.5/1
0
A
Without Hydrogen
C. Oxygen Studies.
During the course of this study it became obvious that there was a
relatively large amount of oxygen in the f i lm . This was evident from the infra-
red results as well as the chemical analysis of the film. The question arose as to
the source of oxygen. Therefore to help resolve this problem runs were made in
which oxygen was premixed with the reactant gas, and the deposition process
studied. Oxygen was premixed with acetylene, trifluoroethylene and toluene as
starting gases. In each and every case a measurable amount of oxygen inhibited,
or removed the polymeric film. At low oxygen concentration the deposition rate
was reduced by a factor of ten. At higher concentrations the oxygen completely
eliminated the formation of an acetylenic film. Since oxygen was such an
efficient getter, later on in the program it was used to preclean the reaction tube
before a run. Oxygen plasma has long been used to ash hydrocarbon solids for
analysis of the inorganic material present in the sample. Thus we tend to support
the conclusion of Neiswender
t o the reaction with molecular oxygen on exposure of the f i lms to air.
(4) who states that the oxygen in the f i l m was due
I
4. D. D. Neiswender "Polymerization of Benzene in a Radio Frequency Dis- charge", American Chemical Society's "Symposium on Chemical Reactions i n Electrical Discharges" 153d National Meeting, p. 274-81, April 1967.
22
. .
I I I I I 1 I I I I I I I I I I I I
V I INFRARED RESULTS
A comparison of the infrared spectra of the polymeric fi lms produced from
the five hydrocarbon monomers (isobutylene, ethylene, acetylene, diacetylene and
toluene) revealed that the infrared patterns of the deposited f i lms were remarkably
similar in appearance. Infrared spectras of the f i lms prepared from these five com-
pomds plus four spectra for other starting gases are shown in Figures 5 , 6 and 7.
Though the spectras were similar, on closer examination it was evident that there
were significant differences in the patterns. For example, some additional peaks
were found in the toluene spectra. These peaks have been attributed to the aromatic
structure present in the f i lm . Of the previously mentioned aliphatic compounds
these same peaks (to a lesser degree) were found only i n the spectra of the f i l m
deposited from isobutylene. A thorough examination of the infrared spectra have
provided a clearer understanding of the structure of the f i lms.
A. Aliphatic Films.
In general, the infrared patterns of the polymeric films deposited from
the aliphatic compounds exhibited the following characteristics: A broad medium
intensity band at 3400 cm ; a strong reasonable sharp band between 3100 cm-’
to 2800 cm-l; a very broad band around 1700 cm
reasonably sharp medium intensity peaks appear at 1450 and 1380 cm
very broad band i s seen between 1100 and 1000 cm-l and finally a variable peak
-1
- 1 of medium intensity; two
- 1 ; a shallow
- I i s found near 740 cm . Analogeous infrared spectra have been reported by Vastola
and Wightman (2) employing a similar experimental apparatus.
The infrared patterns for diacetylene gave a more diffuse spectra than
the other three aliphatic hydrocarbons.
diacetylene the resulting f i l m produced infrared patterns closely resembling the
other aliphatic patterns. No acetylenic or allenic linkages were found in the
diacetylene patterns only a higher percentage of olefenic bond were observed.
However when hydrogen was premixed with
In the interpretation of the patterns, the band at 3400 cm-’ has been
cssignerl tn t h e OH stretching vibration. Since the samples were enmeshed in
23
I
4 2 20
0 4wo >5m
FIGURE 5 24
" .
I I f I I I c I I c I I I I I I I I
00 I
_c_
0 6
08 10 15
2000 IPOO 1800 1700 1693 1500 !do0 1300 1200 1100 1000 Po0 800 700 Mx) 500 4a) FREQUENCY CM
4 m 3503
, 00
i e02
% t 0 4
Q Z m u
1 0 6
08 IO 15
2ooO loo0 800 1700 IMx) 1500 1400 '300 ' 2 0 0 l!00 1 C B l 900 800 700 MKI 4000 3500 , 3000 2500 rS€GilEYCY CM EP r#46 b / q m & - 2.l"
500 400
x 0 4
06 V ' 08 IO
. .
I I I I I I I I I I I I I I I I I I
-----I 0 0
5 0 4
O b - 0 8 I O 1 5
4000 3500 3000 H #
1400 1300 1200 I 100 I000 930 600 700 boo 500 400
FIGURE 7
26
. .
potassium bromide pellets no efforts were made to determine what fraction of the
OH band was due to the f i l m and what part was contributed by the potassium
bromide. The strong absorption peak around 2900 cm
least three distinct peaks; one at 2960 another at 2930 and a final one at 2870 cm-l.
These resolvable peaks have been assigned to the CH and CH stretching vibrations.
Since this band extends to a slightly higher wave number than 3000 cm
evidence of olefenic linkages as well as the carbon hydrogen stretching frequencies.
The broad band covering from 1800 to 1550 cm-' has been found to contain at -1
least two peaks. The one at 1700 cm
peak at 1620 cm
carbon-carbon double bond. There i s evidence to support these peak assignment,
- 1 was resolvable into at
- 1 3 2 , there i s
i s assumed to be due to carbonyl and the
i s conjectured to be the stretching vibrational frequency of a -1
as we shall see later. The peaks at 1450 and 1380 cm-l have been ascribed to the
carbon-hydrogen bending vibration frequency. The variable weak broad band
covering the region from 1100 to 1000 cm
silica contaminate i s due to i t s entrapment in the f i l m during the removal of the
- 1 has been identified as silica. The
- 1 f i lms from the walls of the reaction tube.
has been assigned to a methylene rocking vibration which occurs in a long carbon
chain such as polyethylene.
Finally the variable peak at 740 cm
A search of the literature for infrared spectras of plastic material was
made in order to determine i f any of the reported patterns were similar to the spectra
obtained in this work, particularly for the ethylene film. We found that the spectras
reported by Stemler and Kagarese@) for cross-I inked polyethylene were similar.
Their reported infrared spectra for Cabot's (CAB-XLl411) chemically cross-linked
polyethylene, duPont's Suryln A a cross-linked polyethylene resin containing
both covalent and ionic chemical bonds and Electronized Chemical Corporation's
insulrod, a polyethylene cross-linked by irradiation al I were characteristic of the
spectras reported in this work. This similarity of spectras applies i n some degree
5. S. S. Stimler & R. E . Kagarise, NRL Report 6392, AD #634 427 (1966)
27
to the plastic film that we prepared from toluene in spite of the fact that its infra-
red spectra indicate the presence in some degree of aromaticity in the plastics.
B . Absorbency Rat io.
It was reasoned that a comparison of the infrared patterns between the
different starting materials would lead to the identification of the structures of
the fi lms and would provide some insight as to reaction mechanism. While a
qualitative examination of the patterns did reveal that films consisted primarily
of a highly cross-linked polyethylene w i t h some unsaturation and aromaticity, i t
did not reveal the exact relationship between the structure of the f i l m and the
starting material. Therefore, a quantitative evaluation of the absorption peak
intensity was undertaken to determine i f a correlation between the peak intensity
and composition of the starting gas did exist.
Using Beer's Law the logarithm of the intensity of a peak was directly
proportional to the concentration. By selecting a particular peak in the infrared
pattern as an internal standard it was feasible to devise a method to determine the
relative concentrations. Therefore by dividing the absorbancy of a specified peak
by the absorbancy of the standard peak it i s possible to obtain a value for the
relative concentration. Thus this absorbancy ratio provides a means of comparing
the infrared spectras from different samples and a means of establishing whether a
correlation exists between the starting compound and the structure of the resultant
f i lm . The peak at 1450 cm was taken as the standard, and the absorbancy ratio
o f the following peaks were calculated: A290dAl 450; Al 70dA1 450; Al 6 d A 1 450; and %4dA1450 plus the absorbancy ratio of A
samples. The AB0dA1450 ratio was chosen to compare the carbon-hydrogen
stretching vibration with the deformation vibration for the series of hydrocarbons.
The ratio of A
between the carbonyl present i n the f i l m and the starting materials. The absorbancy
ratio of 1620 cm
t ion between degree of double bonding in the f i l m and the hydrogen content of the
starting materials. The ratio of A74dA,450 was considered to be an indiwtiori
-1
for the deuterated 290dA*1 60
was selected to determine i f there was a relationship 1 70dA 1 450
- 1 -1 /1450 cm was evaluated to determine i f there was a correla-
28
. .
of the extent of the build-up of the linear ethylenic type structure wi th starting
material. The substitution of deuterium for hydrogen in the fi lms was monitored by
A290dA? 1 bo' The tabulation of the absorbancy ratio data has been listed in Table
It should be mentioned Ill along with the composition of the starting materials.
that the deposited films were reasonably homogeneous; infrared patterns prepared
from different portions of the same sample gave identical patterns (absorption
intensities within 90% of each other) even though many of the second spectra was
prepared after a time lapse as long as a month. Spectra obtained from samples
prepared under identical conditions gave absorption coefficient ratios within 10
to 20%.
Correlations were found not only for the degree of carbon-carbon double
1 6 d A 1 4 5 0 ) and the bonding in the f i l m with the composition of the reactants (A
deuterium incorporation in the fi lm w i t h the amount of deuterium in the starting
gases (A290dA2,60), but a correlation was found between the ratio of A
Al 450 rat io of A BodA,450, the values were fairly consistent only varying from 1.9
to 2.5 over the whole range of compositions studied. The absorbancy ratio values
for the methylene chain ( A 7 d A 1 4 5 0 ) scattered considerably and no consistent
trend was evident. The catagorizing of this peak near 740 cm as a CH rocking
mode i s not completely substantiated other than by the contour of the peak.
1 7 0 d and the oxygen content of the f i lm. While no trend was observed for the
- 1 2
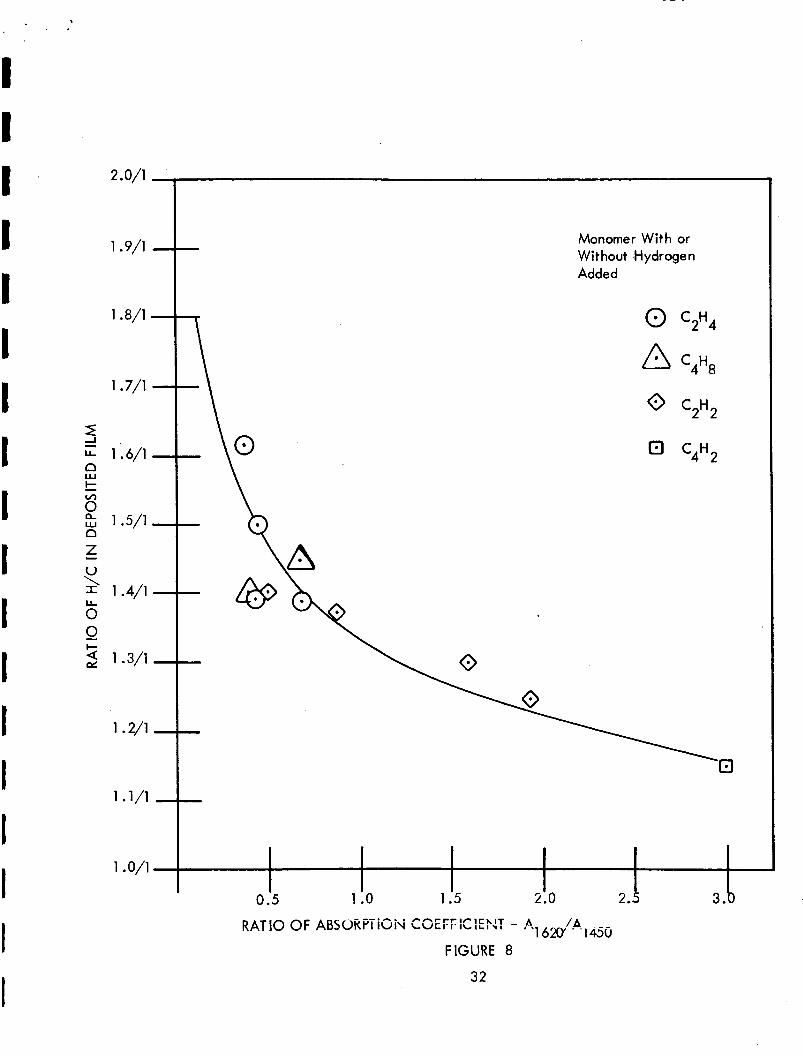
C. Denree of Unsaturation Present in Films.
An obvious correlation exist for the degree of unsaturation (carbon-
carbon double bonds) ( A 1 6 d A 1 4 5 0 ) and the hydrogen/carbon (H/C) ratio of the
input gases. The absorbancy ratio for isobutylene and ethylene both with a H/C
ratio of 2/1 for the gases varies from 0 . 4 to 0.66. While the "A" ratio for
acetylene i s in the range of 1.7 ,+ .2; while the absorbancy ratio i s near 3.0 for
diacetylene which has a H/C ratio of 0.5/1 for the compound. Also, it i s evident
that i f you premix hydrogen with the last two compounds (acetylene and diace-
tylene) the number of double bond in the f i l m decreases accordingly. _. I his correiation
29
. .
I I I I I I I I I I I I I I I I I I
TABLE Ill
INFRARED ABSORBANCY RAT 1 0 s cm-’/cm-’ OF POLYMER IC F I LMS
Expt No Composition 2900/1450 1700/1450 1620/1450 7C , I 1 4 2900/216
6
7
35
37
8
9
17
22
23
24
38
10
18
20
21
27
39
41
45
46
43
42
44
‘qH8
‘qH8
C4H8 ’ D2 C4H8 & 4D2
C2H4
C2H4
C2H4
C2H4 ‘ H2 C2H4 & 2H2
C2H4 8t D2 C2H4 & 4 D2
C2H 2
C2H 2
C2H2 H2
C2H2 & D2
C2H2 & 2H2
C2H2 & 4D2
‘qH2
‘qH2& H2 C4H2 & 2H2
C”H,& D, L ’ t L
C4H2 & 2D2
C4H2 & 4D2
2.3
2.2 -- --
2.0
2.2
2.1
2.5
2.4 -- --
2.2
2.2
1.9
2.1 -- --
-- 2.2
2.4 -- -- --
lsobut ylene 1 .o 0.5
0.8
0.2
E t h y I ene
0.2
0.3
0.1
0.2
0.9
2.1
0.7
0.7
0.3
0.2
0.2
1.4
Diacetylene 2.9
1.9
1.5
2.1
3.1
2.9
30
--
Acetylene
0.66
0.40 -- --
-- 0.41
0.66
0.45
0.40 -- --
1.90
1.52
0.87
0.51 -- --
2.97
0.7
0.6 -- -- --
3.1
0.2
-- -- 0.2 -- 0 .2
1.5
2.6
-- -- 1.4 -- 0.9
0.5
0.9
0.7
0.8
0.5
i .6 --
I
i s shown in Figure 8 where the absorbancy ratio is plotted against the H/C ratio
present in the film. Because not al l the fi lms were chemically analyzed, it was
necessary to estimate the hydrogen-carbon composition for some of the fi lms reported
in the graph. This was done by referring to Figure 4 and using the data presented
there as a calibration curve. Since this curve i s fairly linear, it i s relatively easy
to estimate the composition. Thus by knowing the H/C ratio of the reactant gases
one could arrive at an estimate of the H/C ratio in the f i lm. This proceuure was
used because it was felt that this approach gave a clearer picture of the degree of
unsaturation of the fi lms. However a similar shaped plot would have obtained
for Figure 8 i f instead we had used the H/C ratio of the reactant gases. Some of
the significant aspects of this correlation i s that i t demonstrates that the composi-
t ion of the deposited f i lms i s more of a function of the atomic ratio of the input
gases than it i s on the chemical reactivity of the reactant gases and it also sub-
stantiates our interpretation of the infrared patterns. For example, i t i s unlikely - 1
that i f the absorption peak at 1620 cm
we would find a correlation with the peak intensity and chemical composition.
Naturally i f the f i lm has a polyethylene like structure, the decrease of hydrogen
content i n the fi lm would lead to more unsaturated linkages in the polymer.
did not correspond to an olefinic grouping
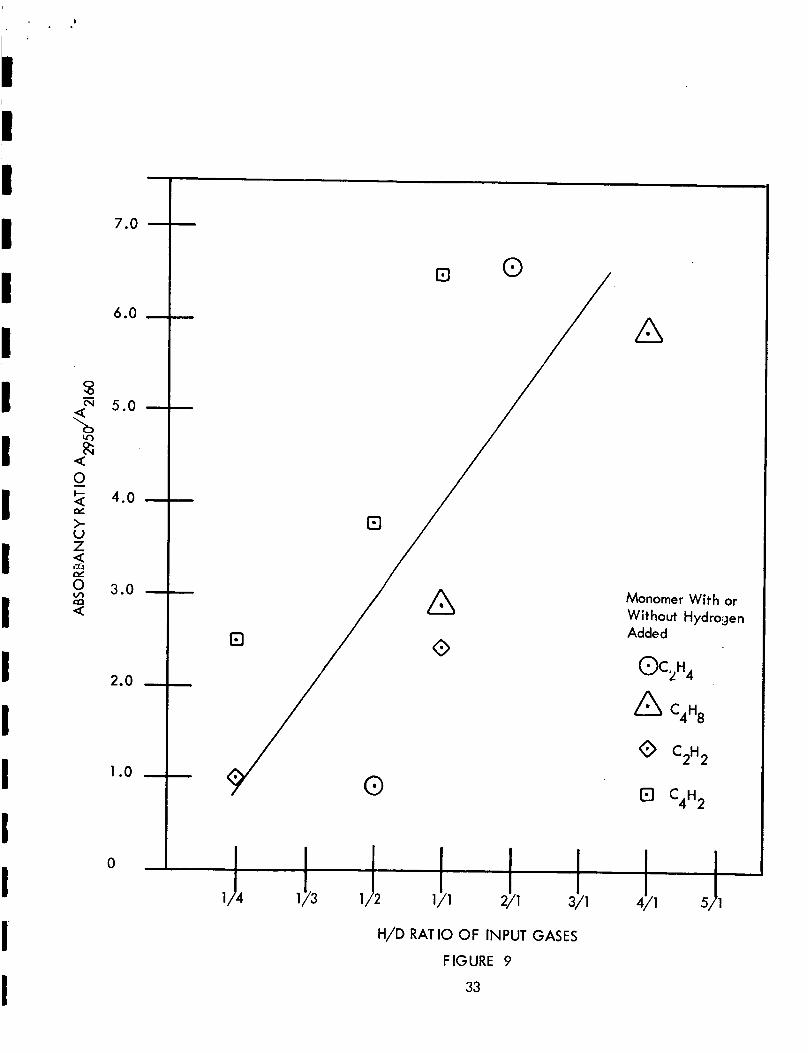
D. Deuterium Content of Films.
The fact that deuterium i s readily incorporated i n the f i lm also supports
the first conclusion mentioned above; i.e., the composition of the deposited poly-
mer i s more of a function of the atomic constituents of the gases present in the plasma
rather than the chemical reactivity of these gases.
absorbancy ratio for the stretching frequency of C-H and C-D in the polymers
versus the hydrogen-deuterium ratio of the imput gases. As more and more deuterium
i s premixed with the hydrocarbon monomer the intensity of the peak at 2160 cm-’
increases relative to the band around 2900 cm . While there i s some variation of
the slopes of the data plots for different hydrocarbon gases studied, al l curves show
the same trend.
percent of deuterium on the film at this time, but this couid have been obiained b y
a mass spectrometry analysis of the pyrolysis products of the fi lms.
Figure 9 i s a plot of the
-1
No quantitative analysis has been made to determine the weight
31
1.9/1 Monomer With or Without Hydrogen Added
1.0/1
7.0
6.0
5 .O
4.0
3 .O
2.0
1 .o
0
Monomer With or Without Hydrogen Added
C4H8
0 C2H2
H/D RATIO OF INPUT GASES
FIGURE 9
33
. .
E. Presence of Carbonyl Groups in Films.
The assumption that the peak at 1700 cm - 1
i s due to carbonyl groups
i s substantiated by the fact that there i s a relationship between the amount of
oxygen present i n the f i l m and the ratio of the absorption coefficient at 1700 cm
with respect to the absorption coefficient at 1450 cm
Tabie IV. While there i s some scatter i n the data the trend towards higher ratios
with increasing oxygen content of the f i lm i s clearly evident. This brief investiga-
t ion was not sufficient to establish the source of the oxygen contamination on the
films, however, from Table IV i t was also obvious there was no correlation between
the oxygen content of the f i l m and the addition of hydrogen or deuterium to the
hydrocarbons.
however, the presence of oxygen containing groups was observed in the spectra
published by Wightman") in addition to the previously mentioned plastics analyzed
by Stemler and Kagare~e'~) and i n the spectras of N e i s ~ n d e r ' ~ ) . Thus we conclude
the presence of oxygen i s not unique to our system and we tend to support the con-
clusion of Neiswender .
-1
. This data i s presented in -1
The large amount of oxygen in the f i lms was rather anmonolous,
(4)
34
1 .
Expt No.
17
23
38
18
21
41
43
42
TABLE IV
OXYGEN CONTENT OF FILM AND THE CARBONYL ABSORPTION COEFFICIENT RATIO
Gas Composition Wt %* o2
C2H4 9 .2
C2H4 & 2H2 7.5
C2H4 & 4D2 12.0
C2H2 & Ar 12.0
C2H2& 2H2 6.7
‘qH2 26.8
‘qH2 ‘ D2 11.8
C4H2 & 2D2 30.4
A1 7odA1 450
0.3
0.2
2.1
0.7
0.2
2.9
2.0
3.1
*The oxygen weight % i s determined from the chemical analysis by the
differences.
35
. .
F. Polyethylene Chain.
There i s a variable absorption peak that appears i n the infrared patterns - 1
between 700 to 800 cm
location in the pattern may vary, generally the peak appears at 740 cm
speculated that this peak i s primarily the result of the "CH
chain. This shift in absorption frequency may be due to a variation i n length of
the et.hylene chain. However, the peak could also be the result of a "CH wag"
on alkyl substituted olefins or due to the crystalline content of the polymer.
However, the fluoronated ethylene deposited polymers also have been found to
absorb i n this frequency range which i s very perplexing, but to our best estimate,
this peak i s judged to be the result of the rocking of the ethylene chain; this was
based on the contour of the peak as well as i t s frequency.
. The peak not only fails to appear on occasion, but i t s -1 . It i s
rock'' of an ethylene 2
G. Infrared Spectra of Films Produced from Toluene.
Toluene was employed in the investigation to aid i n the identification
of the structure of the plasma deposited films. While there was a striking similarity
of the spectras between the f i lm produced from this aromatic compound and that
from the aliphatic materials i t i s apparent toluene f i l m contain a relatively high
degree of aromatic character and more closely resembles the spectra of a poly- - 1
styrene plastic. The narrow sharp band at 700 cm with a broad band adjacent
to it i s characteristic of an aromatic compound. The same goes for the very broad
band from 1000 to 1300 cm
These plus the additional small detail i n the C-H stretching band which extend
- 1 and the sharp peakat 1500, 1580 and 1600 cm-'.
-1 above 3000 cm
most of the aliphatic materials supports the aromatic character of the films.
should be mentioned again that the f i lm prepared from isobutylene display a small
degree of aromaticity in their spectras. The cause of this i s unknown but the sig-
nificance of this finding warrants further study.
and which has not been observed i n the polymers deposited from
It
H. Infrared Spectra of Films Produced from Trifluoroethylene and
Tetrnfl uoroethylene
Since hydrofluoric acid vapor are used to release the polymeric f i lm
36
. .
I I I I I I I I I I I I I I
from the reaction tube it was thought advisable to prepare polymeric f i lms from
trifluoro andtetrafluoroethylene and determine i f the hydrofluoric acid vapors are
reacting with the deposited polymer to give an infrared spectra of a fluoronated
hydrocarbon polymer instead of the primary deposited polymer. Thus by a com-
parison of these infrared patterns with the aliphatic patterns we could establish
whether the hydroflouric acid vapor are interfering.
of both fi lms produced from tri- and tetrafluoroethylene were rather amorphous.
These polymers displayed a relatively strong intense very broad band from 1000 to
1400 cm-’ which was impossible to separate out. Outside of a medium intense -1
band at 740 cm
hydroxyl group band at 3400 cm
corresponding to the carbonyl functional group.
i s perplexing. The infrared patterns of fluoronated ethylene plastics in the litera-
ture show an absorption peak in this region. However these reported peaks as
well as our fluorinated peaks have a different profile from the peak at 740 cm
for the hydrocarbons. The hydrocarbon peak i s asymetric almost characteristic of
two adjunct peaks having different intensities relative to each other. Additional
work i s needed to determine the exact nature of the peak to insure that the peak
observed at 740 cm
However, the infrared spectra
the infrared patterns revealed l i t t le else except a variable - 1
and a smal I variable band at 1700 cm-’ - 1
However, the band at 740 cm
- 1
- 1 for the aliphatic f i lms i s not due to the methylene chain.
37
. .
VI1 CONCLUSION ~ ~~~
Coatings deposited via an electrodeless, microwave discharge process from
relatively low molecular weight hydrocarbons produce highly cross-linked adherent
f i lms. In general these films are resistant to most solvents as well as having a high
thermal resistance. The color of the films vary from light yellow to dark brown, de-
pending on the composition of the reactant gases.
1 . Films deposited from ethylene are light yellow to clear in color, char
or react with only concentrated sulfuric acid and are thermally stable in air to
280°C. Their infrared spectra indicates that the f i l m have a highly cross-linked
polyethylene structure.
2. Films prepared from isobutylene are similar i n appearance and
properties to the polyethylene films but their infrared spectra indicates a small
degree of polystyrene like structure in the fi lms in conjunction with the poly-
ethylene structure.
3 . The f i lms prepared from acetylene are orange to brown in color. 0
The f i lms are insoluble i n al l solvent and do not thermally degrade in air to 340 C.
The infrared spectra indicates a polyethylene structure with a high degree of un-
saturated groups.
4. Diacetylene fi lms are black to red brown in color. Their chemical
analysis supports the fact that these fi lms are highly unsaturated. These polymers
contain the least amount of hydrogen in their structures. They are insoluble in
a l l solvents and withstand heating in air to above 300OC.
5. Premixing hydrogen with the aliphatic monomers increases the hydrogen
content of the f i l m up t o a certain point, decreases the degree of unsaturation i n
the films, lightens their color and causes them to be soluble in concentrated sul-
furic acid.
6. By mixing deuterium with the aliphatic reactants in various ratios it
i s possible to follow the incorporation of deuterium into the polymers structure by
infrared analysis indicating that the incorporation of hydrogen into films i s indepen-
dent of its source.
7. Toluene fi lms are yellow in color and similar i n appearance to the
f i lms prepared from polyethylene. Their infrared spectra suggest the f i lms have a
structure analogeous to a pol ystyrene-polyethylene copolymer.
8. The deposition rate of the various f i lms are reduced by the addition of
hydrogen to the reactant gas and the deposition rate correlates with the gas composi-
tion.
9. The infrared and chemical analysis of the various f i lms indicates the
presence of oxygen in the fi lms as carbonyl groups. Nei~wender '~) claims the
carbonyl bands are formed by a rapid oxidation by molecular oxygen on exposure
of the sample to air. N o verification of this claim was made except to note that
when oxygen was premixed with the aliphatic monomer it inhibited the deposition
or stripped the polymeric f i l m from the reactor.
10. The films produced from trifluoroethylene and tetrafluoroethylene
are similar i n physical properties. Both films are insoluble in al l solvents; they do
not degrade until heated to a temperature near 330 C. However, the trifluoro-
ethylene produces a brown colored f i lm while the tetrafluoroethylene produces a
dirty white, teflon-like f i lm. The infrared patterns do not reveal enough detail
for identification of functional grouping in the films.


![Blue-Green Lasers and Electrodeless Flashlamps Lasers and Electrodeless Flashlamps F. W. Perkins CIAM * Accesion For7 DTIC TAB [] Urnannouriced lI Justification By Dist ibutio.. August](https://static.documents.pub/doc/80x56/5ab786897f8b9a684c8b991e/blue-green-lasers-and-electrodeless-flashlamps-lasers-and-electrodeless-flashlamps.jpg)
![[MI 611-150] 871EC Electrodeless Conductivity Sensors and ...](https://static.documents.pub/doc/80x56/6169f15c11a7b741a34d15aa/mi-611-150-871ec-electrodeless-conductivity-sensors-and-.jpg)
![[MI 611-261] Model 876EC Intelligent Electrochemical ... · Instruction MI 611-261 February 2015 Model 876EC Intelligent Electrochemical Transmitter for Electrodeless Conductivity](https://static.documents.pub/doc/80x56/5b5977b87f8b9a6c4f8d3bb1/mi-611-261-model-876ec-intelligent-electrochemical-instruction-mi-611-261.jpg)
![Santiago Calatrava's Dynamic Urbanism [Portfolio] · PLACES eScholarship University of Ca ifornia . Title: Santiago Calatrava's Dynamic Urbanism [Portfolio] Created Date](https://static.documents.pub/doc/80x56/5d09c11688c993aa488ba27c/santiago-calatravas-dynamic-urbanism-portfolio-places-escholarship-university.jpg)

