An ASHRAE research project (RP-1018) that wasconducted at the Institute for Research in Construction,National Research Council Canada, has resulted in a uniquedatabase on many hygrothermal properties of many commonbuilding and insulation materials that are currently used inNorth America. The properties that are determined includethermal conductivity, equilibrium moisture content, watervapor transmission characteristics, water absorption coeffi-cient, moisture diffusivity, and airflow characteristics. Theexperimental and analytical procedures used in the researchproject are all based on either international standards or onwell-documented and peer-reviewed approaches. The materi-als that have been investigated in the project include severalwood-based products, such as oriented strand board, plywood,wood fiberboard, and composite wood siding; masonry prod-ucts, such as clay brick, mortar, and aerated concrete; fivespecies of lumber; cladding products, such as stucco, fibercement board, and the exterior coatings of EIFS systems; seveninsulation products; six sheathing membranes; interiorgypsum board, primer, and a latex paint; and a natural stone,a cement-based sheathing board, and vinyl wallpaper. Thispaper lists the basic information on all materials that wereinvestigated. It also summarizes the principles of the experi-mental procedures. Illustrative examples of the informationthat has been generated in the research project are presented.Results from statistical analyses are highlighted.
INTRODUCTION
With the advent of high-power personal computers,hygrothermal computer models have become powerful toolsfor building physicists and building practitioners alike. Signif-
icant advances were made during the past two decades in thedevelopment of hygrothermal models that are now useful inassessing the real-time responses of building envelope assem-blies to the variations in weather parameters and indoor envi-ronments. One major task in the International Energy AgencyAnnex 24 (Hens 1996) evaluated many hygrothermal modelswith diverse capabilities from European and Scandinaviancountries and North America. More recent developments aredocumented in an ASTM manual (Trechsel 2001). All thesemodels require a set of very reliable inputs to yield meaningfulresults. Among these inputs are the properties of the buildingmaterials.
The information on material properties available in theliterature (Kumaran 1996; Trechsel 1994, 2001) is useful as astarting point in the application of hygrothermal models, but itis not adequate for various reasons. Building materials evolvecontinuously and the properties may change significantly.Another problem is that none of these previous works addressall relevant hygrothermal properties of all products either.Usually the information is assembled from various sources.Even some of the most well-planned works are incomplete andoften become outdated (Tveit 1966; Hansen 1986; Burch et al.1992; Richards et al. 1992). Hence the need for a systematicinvestigation of the properties of all current building materialswas recognized and ASHRAE Research Project 1018 wasformulated in this context. The original scope of the projectwas to “generate a set of reliable and representative data on thehygrothermal properties of 25 common building materials.”
The project is now complete and has resulted in detailedinformation on various hygrothermal properties of more than35 building products. The properties that are determinedinclude thermal conductivity, equilibrium moisture content,
A Thermal and Moisture Property Database for Common Building andInsulation Materials
Mavinkal K. Kumaran, PhD
Mavinkal K. Kumaran is a principal research officer in the Heat and Moisture Performance of Envelopes group, Institute for Research inConstruction, National Research Council Canada, Ottawa, Ontario.
water vapor transmission characteristics, water absorptioncoefficient, moisture diffusivity, and airflow characteristics.The experimental and analytical procedures used in theresearch project are all based on either international standardsor on well-documented and peer-reviewed approaches.
This paper lists the basic information on all products thatwere investigated. It also summarizes the principles of theexperimental procedures. Illustrative examples of the infor-mation that has been generated in the research project arepresented. Results from statistical analyses, albeit ratherlimited by the available information, are highlighted.
GENERAL DESCRIPTIONS OF THE BUILDING PRODUCTS
Relevant information on all the products included in theproject is given below. The information includes the physicaldetails of the products, as these are available in the market,bulk densities, thickness, and, if available, details on the rawmaterials used in the manufacture.
1. Aerated Concrete: The test samples are taken from1 × 1 × 1.5 ft blocks of the material. The bulk density is(460 ± 15) kg m-3.
2. Interior Gypsum Board: This product is available as4 × 8 ft boards at a nominal thickness of ½ in. A paperlayer is adhered to the major surfaces. Labels on the prod-uct say the following: Manufactured to exceed standardsCan/CSA-A82.27 and ASTM C 36. The bulk density is(625 ± 7) kg m-3.
3. Oriented Strand Board-1: This product is available as4 × 8 ft boards at a nominal thickness of ½ in. The strandsof this product are manufactured from poplar and aspen.The bulk density is (650 ± 30) kg m-3.
4. Oriented Strand Board-2: This product is available as4 × 8 ft boards at a nominal thickness of 3/8 in. Thestrands of this product are manufactured from balsam,poplar, and trembling aspen. The bulk density is(660 ± 30) kg m-3.
5. Oriented Strand Board-3: This product is available as4 × 8 ft boards at a nominal thickness of 7/16 in. Thestrands of this product are manufactured from birch,poplar, and aspen. The bulk density is (650 ± 30) kg m-3.
6. Plywood-1: This product is available as 4 × 8 ft boards ata nominal thickness of ¾ in. It is certified as conformingto Canadian plywood manufacturing standard CSA O151,Canadian Softwood Plywood. The bulk density is(445 ± 5) kg m-3.
7. Plywood-2: This product is available as 4 × 8 ft boards ata nominal thickness of ½ in. It is certified as conforming toCanadian plywood manufacturing standard CSA O121,Douglas Fir Plywood. The bulk density is (470 ± 5) kg m-3.
8. Plywood-3: This product is available as 4 × 8 ft boards ata nominal thickness of 5/8 in. It is certified as conforming
to Canadian plywood manufacturing standard CSA O121,Douglas Fir Plywood. The bulk density is (550 ± 5) kg m-3.
9. Woodfiber Board: This product is available as 4 × 8 ftboards at a nominal thickness of 7/16 in. Both majorsurfaces are coated black (bituminous). The bulk densityis (320 ± 10) kg m-3.
10. Eastern White Cedar: The specimens used for varioustests are taken from 1 in. (nominal thickness) × 8 in. × 8 ftplanks. The bulk density is (360 ± 20) kg m-3.
11. Western Red Cedar: The specimens used for varioustests are taken from 1 in. (nominal thickness) × 8 in. × 8 ftplanks. The bulk density is (350 ± 20) kg m-3.
12. Spruce: The specimens used for various tests are takenfrom 1 in. (nominal thickness) × 8 in. × 8 ft planks. Thebulk density is (400 ± 50) kg m-3.
13. Eastern White Pine: The specimens used for varioustests are taken from 1 in. (nominal thickness) × 8 in. × 8 ftplanks. The bulk density is (460 ± 60) kg m-3.
14. Southern Yellow Pine: The specimens used for varioustests are taken from 1 in. (nominal thickness) × 8 in. × 8 ftplanks. The bulk density is (500 ± 40) kg m-3.
15. Composite Wood Siding: This product is available as4 × 8 ft boards at a nominal thickness of 7/16 in. Thematerial is made out of high-density wood fiberboard,and one major surface is coated with a paint at a fractionof a millimeter thickness. The bulk density is(740 ± 30) kg m-3.
16. Clay Brick: The brick is manufactured in Canada and isidentified as Charleston brick. Test specimens areprepared from a production batch of 72 × 78 × 250 mmbricks. The bricks are light reddish brown in color andreferred to as “extruded clay brick.” The bulk density is(1980 ± 30) kg m-3.
17. Mortar: The mortar is from a masonry cement mortarmix, type N: 1 part by volume of masonry cement type Nand 2¼ to 3 parts by volume of aggregate. The bulkdensity is (1600 ± 30) kg m-3.
18. Stucco: This is a regular Portland stucco mix. The bulkdensity is (1985 ± 30) kg m-3.
19. Fiber Cement: This product is available as 4 × 8 ft boardsat a nominal thickness of 5/16 in. The bulk density is(1380 ± 40) kg m-3.
20. Cement Board: This product is available as 4 × 8 ftboards at a nominal thickness of ½ in. This is used as anexterior sheathing member in EIFS type walls. The bulkdensity is (1130 ± 50) kg m-3.
21. Limestone: This product is called Georgian Bay lime-stone, available as slabs of various sizes. The bulk densityis (2500 ± 100) kg m-3.
22. Low-Density Glass Fiber Batt Insulation: Batt at anominal thickness of 4 in. The bulk density is
ASHRAE Transactions 487
(11.5 ± 1.5) kg m-3. The fibers are held together using abinder.
23. Cellulose Fiber Insulation: All test specimens areprepared from samples blown from a commercial cellu-lose insulation product according to the manufacturer’sdirections. The product is prepared from recycled news-paper as the starting material using a dry fiberizationtechnology. The fire retardant and fungicide are alsoapplied as dry raw materials during the productionprocess. The applied density of the insulation is(30 ± 4) kg m-3.
24. Expanded Polystyrene Insulation: This product meetsCAN/ULC-S701-01 requirements for Type 1 expandedpolystyrene insulation. The bulk density is(14.8 ± 0.2) kg m-3.
25. Extruded Polystyrene Insulation: A commercial prod-uct available as 4 × 4 ft boards at a nominal thickness of4 in. The product meets CAN/CGSB/ONGC: 51.20-M87and is type 4. The bulk density is (28.6 ± 0.2) kg m-3.
26. Sprayed Polyurethane Foam Insulation: Test speci-mens are taken from a 4 ft × 4 ft sample prepared using acommercial product by spraying three passes at a totalthickness of 6 in. The bulk density is (39 ± 2) kg m-3.
27. Polyisocyanurate Board Insulation: Test specimensare taken from a 4 ft × 8 ft board at a nominal thicknessof 3 in. The facers were removed from both majorsurfaces before specimens were prepared for all tests. Thebulk density is (26.5 ± 0.2) kg m-3.
28. Low-Density Sprayed Polyurethane Foam Insulation:Test specimens are taken from a 4 × 4 ft sample preparedusing a commercial product sprayed at 8 to 10 ft height.The bulk density is 6.5 to 8.5 kg m-3.
29. #15 Felt: Mass per area is approximately 515 g m-2. Thethickness is (0.72 ± 0.03) mm.
30. 10 Minute Paper: Mass per area is approximately170 g m-2. The thickness is (0.20 ± 0.01) mm.
31. 30 Minute Paper: Mass per area is approximately200 g m-2. The thickness is (0.22 ± 0.01) mm.
32. 60 Minute Paper: Mass per area is approximately280 g m-2. The thickness is (0.34 ± 0.01) mm.
33. Spun Bonded Polyolefin: Mass per area is approxi-mately 65 g m-2. The thickness is from 0.14 to 0.15 mm.
34. Spun Bonded Polyolefin with Crinkled Surface: Massper area is approximately 67 g m-2. The thickness is about0.1 mm.
35. Vinyl Wallpaper: Mass per area is approximately170 g m-2. The thickness is (0.205 ± 0.008) mm.
36. Primer and Two Coats of a Latex Paint on GypsumBoard: Negligible thickness change for the gypsumboard due to the coatings.
37. EIFS Base and Finish Coats: The base coat is polymercement and the finish coat is latex acrylic. The combinedthickness is approximately 4.5 mm and bulk density isapproximately 1140 kg m-3.
The properties reported include:
• thermal conductivity, • sorption-desorption isotherms, • water vapor permeance or permeability, • moisture diffusivity, • water absorption coefficient, • and air permeance or permeability.
Attempts to measure liquid permeability directly were notsuccessful, within the scope of the project. A method to eval-uate this property from the information on desorptionisotherm and moisture diffusivity was documented in one ofthe project reports and values given for many of the productsinvestigated here (NRC 2000).
PRINCIPLES OF THE EXPERIMENTAL PROCEDURES
Well-developed experimental procedures or internationalstandard test procedures exist to determine the propertiesmentioned above. The principles of the experimental proce-dures that are used to determine the hygrothermal properties ofbuilding materials in the present investigation are given below.Heat capacity data that are listed in the final report (NRC2002) are those taken from the International Energy AgencyAnnex 24 report (Kumaran 1996). Density data reported arethe averages of the densities of many test specimens (condi-tioned to laboratory environment, approximately 21°C and50% RH) for each material, calculated from direct measure-ments on the weight and on the geometric dimensions that areused to characterize each test specimen. Further details oneach experimental procedure and data analyses may be foundin the NRC Report No. B-1115.3 (NRC 1999).
Thermal Conductivity of Dry Materials
The heat conduction equation is used directly to deter-mine the thermal conductivity of dry materials. Equipmentthat can maintain a known unidirectional steady-state heat flux(under known constant boundary temperatures) across a flatslab of known thickness is used for the measurements. Themost commonly used equipment is the guarded hot plate appa-ratus or the heat flow meter apparatus. ASTM Standards C177, Standard Test Method for Steady-State Heat fluxMeasurements and Thermal Transmission Properties byMeans of the Guarded-Hot-Plate Apparatus, and C518, Stan-dard Test Method for Steady-State Heat Flux Measurementsand Thermal Transmission Properties by Means of the HeatFlow Meter Apparatus, are widely used for this purpose. Thelatter is used in the present investigation. Similar standards areavailable from the International Standards Organization and
488 ASHRAE Transactions
the European Union. In the ASTM standards, the heat conduc-tion equation is written for practical applications as
λ = Q · l/(A · ΔT) , (1)
where
Q = heat flow rate across an area A,
l = thickness of test specimen, and
ΔT = hot surface temperature – cold surface temperature.
The thermal conductivity calculated according to Equa-tion 1 is called apparent thermal conductivity. It is a functionof the average temperature of the test specimen.
Sorption/Desorption Isotherm
For sorption measurements, the test specimen is dried atan appropriate drying temperature to constant mass. Whilemaintaining a constant temperature, the dried specimen isplaced consecutively in a series of test environments, withrelative humidity increasing in stages, until equilibrium isreached in each environment. Equilibrium in each environ-ment is confirmed by periodically weighing the specimen untilconstant mass is reached. From the measured mass changes,the equilibrium moisture content at each test condition can becalculated and the adsorption isotherm drawn.
The starting point for the desorption measurements isfrom an equilibrium condition very near 100% RH. Whilemaintaining a constant temperature, the specimen is placedconsecutively in a series of test environments, with relativehumidity decreasing in stages, until equilibrium is reached ineach environment. Equilibrium in each environment isconfirmed by periodically weighing the specimen untilconstant mass is reached. Finally, the specimen is dried at theappropriate temperature to constant mass. From themeasured mass changes, the equilibrium moisture content ateach test condition can be calculated and the desorptionisotherm drawn.
A new CEN standard (89 N 337 E) is under developmentfor the determination of “hygroscopic sorption curve.” ASTMStandard C1498 addresses the same procedure.
Desorption Isotherm above 95% RH from Pressure Plate Measurements
The test specimens are saturated with water undervacuum. Those are then introduced in a pressure plate/membrane apparatus that can maintain pressures up to 100 barfor several days. The plates/membrane in perfect hygriccontact with the specimens extract water out of the pore struc-ture until an equilibrium state is established. The equilibriumvalues for moisture content in the specimens and the corre-sponding pressures (measured as the excess over atmosphericpressure; the negative of this value is referred to as the “porepressure” while the absolute value is the suction) are recorded.The equilibrium pressure ph can be converted to a relativehumidity, ϕ, using the following equation:
(2)
where
M = the molar mass of water
R = the ideal gas constant
T = the thermodynamic temperature
ρ = the density of water
A Nordtest technical report (Hansen 1998) brieflydescribes a procedure for pressure plate measurements andreports the results from an interlaboratory comparison.Measurements done by five laboratories on Baumberger sand-stone and Sander sandstone are listed in the report. The resultsare statistically analyzed and comments are made on the diffi-culty of assigning uncertainties to the derived results. No stan-dard procedure has yet been developed for the pressure platemeasurements.
Water Vapor Permeability/Permeance
The vapor diffusion equation is directly used to determinethe water vapor permeability of building materials. Themeasurements are usually done under isothermal conditions.A test specimen of known area and thickness separates twoenvironments that differ in relative humidity (RH). Then therate of vapor flow across the specimen, under steady-stateconditions (known RHs as constant boundary conditions), isgravimetrically determined. From these data, the water vaporpermeability of the material is calculated as
δp = Jv · l/(A · Δp) , (3)
where
Jv = water vapor flow rate across an area A,
l = thickness of the specimen, and
Δp = difference in water vapor pressure across the specimen surfaces.
Often, especially for membranes and composite materi-als, one calculates the water vapor permeance δl of a productat a given thickness from the above measurements as
δl = Jv/(A · Δp) . (4)
ASTM Standard E96, Test Methods for Water VaporTransmission of Materials, prescribes two specific cases ofthis procedure—a dry cup method that gives the permeance orpermeability at a mean RH of 25% and a wet cup method thatgives the permeance or permeability at a mean RH of 75%. Anew CEN standard (89 N 336 E) is being developed in theEuropean Union based on an ISO standard. More recently, anumber of technical papers that deal with various technicalaspects, limitations, and analyses of the experimental data ofthese procedures have appeared in the literature (Hansen andLund 1990; Lackey et al. 1997; Kumaran 1998).
Water Absorption Coefficient. One major surface ofeach test specimen is placed in contact with liquid water. Theincrease in mass as a result of moisture absorption is recorded
lnϕM
ρRT----------- p
h–=
ASHRAE Transactions 489
as a function of time. Usually, during the initial part of theabsorption process, a plot of the mass increase against thesquare root of time is linear. The slope of the line divided bythe area of the surface in contact with water is the waterabsorption coefficient (Kumaran 1999).1
CEN Standard 89 N 370 E on the determination of waterabsorption coefficients is now available. The use of a waterabsorption coefficient together with capillary saturation mois-ture content to derive information on an average moisture diffu-sivity for building products is explained in Kumaran (1999).
Moisture Diffusivity. Moisture diffusivity Dw definesthe rate of movement of water Jl within a material, induced bya water concentration gradient according to the followingequation:
Jl = –ρ0Dw grad u (5)
whereρ0 = density of the dry material u = moisture content expressed as mass of water/dry
mass of materialIn the experimental procedure, liquid water in contact
with one surface of a test specimen is allowed to diffuse intothe specimen. The distribution of moisture within the speci-men is determined as a function of time at various intervalsuntil the moving moisture front advances to half of the spec-imen. Gamma spectroscopy is used as the experimental tech-nique. The data are analyzed using the Boltzmanntransformation (Bruce and Klute 1956; Kumaran et al. 1989;Marchand and Kumaran 1994) to derive the moisture diffu-sivity as a function of moisture content.
There is no standard test procedure for the determinationof moisture diffusivity. There are many publications in theliterature that describe the technical and experimental details(Marchand and Kumaran 1994; Descamps 1997; Pel 1995).
Air Permeability/Permeance. Test specimens withknown areas and thickness are positioned to separate tworegions that differ in air pressure, and the airflow rate at asteady state and the pressure differential across the specimenare recorded. From these data, the air permeability ka is calcu-lated as
ka = Ja · l/(A · Δp) (6)
whereJa = air flow rate across an area A,l = thickness of the specimen, and Δp = difference in air pressure across the specimen
surfaces.Often, especially for membranes and composite materi-
als, one calculates the air permeance Ka of a product at a giventhickness from the above measurements as
Ka = Ja/(A · Δp) . (7)
ASTM Standard C 522, Standard Test Method forAirflow Resistance of Acoustical Materials, prescribes amethod based on this principle. Bomberg and Kumaran(1986) have extended the method for general application tobuilding materials.
Comments on the Uncertainty of the Results
From the description given above, it may be seen that thebasic physical quantities that need to be measured in each ofthe test procedures are quantities such as mass, length, time,temperature, and voltage. At the Institute for Research inConstruction, the instruments that are used to record thesebasic quantities are traceable to Canadian national standards.Mass can be measured within a milligram, length within afraction of a millimeter, time differences within a second,temperature within a few centi-Kelvin, and voltage withinfew micro-volt. Other physical quantities, such as relativehumidity and air pressure, are maintained and measuredwithin a few tenths of a percentage and these are also trace-able to Canadian national standards. But the high precisionthat is attainable does not mean that the physical quantitiesmeasured are known within a few fractions of one percent.The basic inhomogeneity of all building products introducesuncertainties in the derived hygrothermal properties that arefar greater than the uncertainties in the measurements of thebasic physical quantities. The magnitude of these uncertain-ties depends on the building product under investigation. Thisaspect is clearly brought out in the final report of ASHRAEResearch Project 1018.
The measurements on one particular test specimen in aparticular test method may yield the property for that speci-men well within a percent. For example, the water vaportransmission for one test specimen can be determined wellwithin a percent, as is evident from the project report. Butwhen all the measurements on all test specimens used arecombined to designate the water vapor permeability (orpermeance) of the product, the uncertainty may be as large as30% (see, for example, the results on aerated concrete in thispaper). If the product is reasonably homogeneous, such as abuilding membrane, the uncertainty may be less that 10%. Ifresults from more than one test laboratory are used to desig-nate the property for a given product line, the uncertainty maystill increase.
Thus it is futile to say that such and such a test procedurecan yield the corresponding material property within a givenuncertainty. The result depends on the extent of inhomogene-ity of the building product under investigation. Therefore, inthe final report of the project, wherever possible, the uncer-tainty of each listed material property is individually assignedfor each material.
ILLUSTRATIVE EXAMPLES: PROPERTIES OF AERATED CONCRETE
Illustrative examples are given below to show thedetails that have been reported in the final project report.
1. When this method was applied to membranes, the membraneswere put in perfect hygric contact with a substrate such as OSB.
490 ASHRAE Transactions
Primary data, test conditions, uncertainties of measure-ments, and, wherever applicable, error analyses are docu-mented in the report. Not all methods are applicable to allmaterials, and often not all properties are relevant to allmaterials. Aerated concrete is one of the products that hasgone through the entire sets of measurements, so it serves asa good example to demonstrate the details of all experimen-tal and analytical results.
Thermal Conductivity
Measurements are done according to ASTM StandardC518, and 30 × 30 cm specimens are used (Table 1). Thetemperatures of the plates are maintained within 0.02 °C forthese measurements for a 12-hour period to confirm steadystate.
Note that the heat flow meter apparatus is built to measurethe heat transmission characteristics of insulating materials,
and for those materials the measurement uncertainties arewithin 2%. Aerated concrete is more conductive than tradi-tional insulation, and the large heat fluxes measured may givemeasurement uncertainties as high as 5%.
Sorption-Desorption Measurements2
Either eight specimens, 40 mm × 40 mm × 20 mm each,or three specimens, 40 mm × 40 mm × 6 mm each, are used inthese measurements; the numbers in parentheses in Tables 2and 3 indicate the experimental uncertainties.
2. In the hygroscopic range, the measurements are done using theproposed procedure for ASTM Standard C1498, which in turn isbased on CEN 89 N 337 E “Hygroscopic Sorption Curve”; at thehigher range, the pressure plate method is used. Details of thepressure plate method are given in Hansen (1998), page 63.
Table 1. Thermal Conductivity of Aerated Concrete
Specimen Thicknessmm
Hot Surface Temperature°C
Cold Surface Temperature°C
ConductivityW m-1 K-1
24.24 31.51 9.75 0.121
24.24 11.45 -2.44 0.119
Table 2. Sorption Data for Aerated Concrete
RH, % Temperature, °C Moisture Content, kg kg-1
100, vacuum saturation Lab at 22 (1) 1.720(0.01), eight specimens
88.1 (1) 23.0 (0.1) 0.050 (0.002), three specimens
71.5 (1) 23.0 (0.1) 0.021 (0.001), three specimens
0.6 (1) 23.0 (0.1) 0.011 (0.001), three specimens
Table 3. Desorption Data for Aerated Concrete
RH, % Temperature, °C Moisture Content, kg kg-1
99.99 (0.01) Lab at 22 (1) 0.92 (0.13), eight specimens
99.98 (0.01) Lab at 22 (1) 0.81 (0.09), eight specimens
99.96 (0.01) Lab at 22 (1) 0.77 (0.07), eight specimens
99.93(0.01) Lab at 22 (1) 0.75 (0.06), eight specimens
99.85 (0.01) Lab at 22 (1) 0.72 (0.05), eight specimens
99.78(0.01) Lab at 22 (1) 0.70 (0.05), eight specimens
99.71 (0.01) Lab at 22 (1) 0.68 (0.04), eight specimens
99.47 (0.01) Lab at 22 (1) 0.64 (0.04), eight specimens
99.34(0.01) Lab at 22 (1) 0.61 (0.02), eight specimens
99.19(0.01) Lab at 22 (1) 0.57 (0.02), eight specimens
98.97(0.01) Lab at 22 (1) 0.54 (0.02), eight specimens
88.1 (1) 23.0 (0.1) 0.063 (0.001), three specimens
71.5 (1) 23.0 (0.1) 0.022 (0.001), three specimens
50.6 (1) 23.0 (0.1) 0.011 (0.001), three specimens
ASHRAE Transactions 491
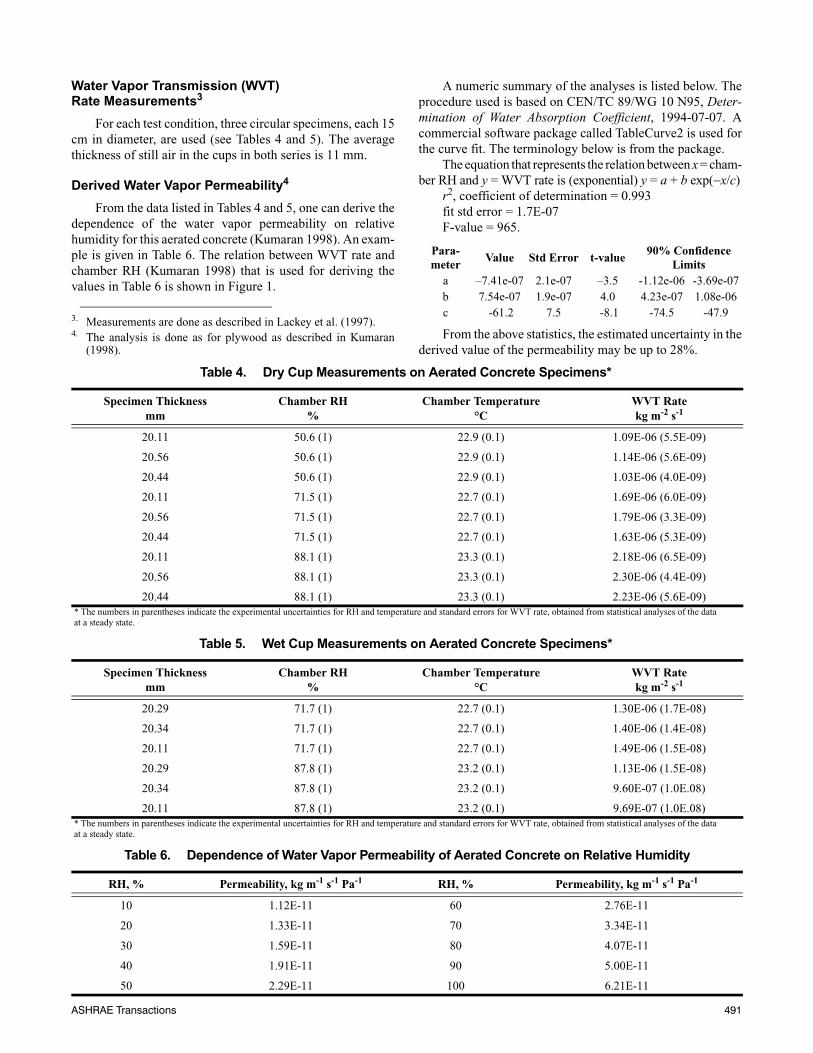
Water Vapor Transmission (WVT) Rate Measurements3
For each test condition, three circular specimens, each 15cm in diameter, are used (see Tables 4 and 5). The averagethickness of still air in the cups in both series is 11 mm.
Derived Water Vapor Permeability4
From the data listed in Tables 4 and 5, one can derive thedependence of the water vapor permeability on relativehumidity for this aerated concrete (Kumaran 1998). An exam-ple is given in Table 6. The relation between WVT rate andchamber RH (Kumaran 1998) that is used for deriving thevalues in Table 6 is shown in Figure 1.
A numeric summary of the analyses is listed below. Theprocedure used is based on CEN/TC 89/WG 10 N95, Deter-mination of Water Absorption Coefficient, 1994-07-07. Acommercial software package called TableCurve2 is used forthe curve fit. The terminology below is from the package.
The equation that represents the relation between x = cham-ber RH and y = WVT rate is (exponential) y = a + b exp(−x/c)
Table 4. Dry Cup Measurements on Aerated Concrete Specimens*
Specimen Thicknessmm
Chamber RH%
Chamber Temperature°C
WVT Ratekg m-2 s-1
20.11 50.6 (1) 22.9 (0.1) 1.09E-06 (5.5E-09)
20.56 50.6 (1) 22.9 (0.1) 1.14E-06 (5.6E-09)
20.44 50.6 (1) 22.9 (0.1) 1.03E-06 (4.0E-09)
20.11 71.5 (1) 22.7 (0.1) 1.69E-06 (6.0E-09)
20.56 71.5 (1) 22.7 (0.1) 1.79E-06 (3.3E-09)
20.44 71.5 (1) 22.7 (0.1) 1.63E-06 (5.3E-09)
20.11 88.1 (1) 23.3 (0.1) 2.18E-06 (6.5E-09)
20.56 88.1 (1) 23.3 (0.1) 2.30E-06 (4.4E-09)
20.44 88.1 (1) 23.3 (0.1) 2.23E-06 (5.6E-09)* The numbers in parentheses indicate the experimental uncertainties for RH and temperature and standard errors for WVT rate, obtained from statistical analyses of the dataat a steady state.
Table 5. Wet Cup Measurements on Aerated Concrete Specimens*
Specimen Thicknessmm
Chamber RH%
Chamber Temperature°C
WVT Ratekg m-2 s-1
20.29 71.7 (1) 22.7 (0.1) 1.30E-06 (1.7E-08)
20.34 71.7 (1) 22.7 (0.1) 1.40E-06 (1.4E-08)
20.11 71.7 (1) 22.7 (0.1) 1.49E-06 (1.5E-08)
20.29 87.8 (1) 23.2 (0.1) 1.13E-06 (1.5E-08)
20.34 87.8 (1) 23.2 (0.1) 9.60E-07 (1.0E.08)
20.11 87.8 (1) 23.2 (0.1) 9.69E-07 (1.0E.08)* The numbers in parentheses indicate the experimental uncertainties for RH and temperature and standard errors for WVT rate, obtained from statistical analyses of the dataat a steady state.
Table 6. Dependence of Water Vapor Permeability of Aerated Concrete on Relative Humidity
RH, % Permeability, kg m-1 s-1 Pa-1 RH, % Permeability, kg m-1 s-1 Pa-1
10 1.12E-11 60 2.76E-11
20 1.33E-11 70 3.34E-11
30 1.59E-11 80 4.07E-11
40 1.91E-11 90 5.00E-11
50 2.29E-11 100 6.21E-11
492 ASHRAE Transactions
One may find another mathematical expression to obtain abetter fit to the experimental data than what is shown in Figure1. For example, a cubic equation (such as y = a + bx + cx2 + dx3)apparently gives a better fit to the experimental data than thatgiven by the exponential equation in Figure 1. However, the firstderivative of this “apparently better fit” results in excursionsthat, in turn, result in a decrease in the vapor permeability withincreasing relative humidity, through a certain range of RHvalues, below 50%RH. It is difficult to explain such a depen-dency. Therefore, in the final report of ASHRAE RP-1018, thebehavior of the first derivative of the mathematical expressionwas also taken into account before the mathematical expressionwas chosen for the derivation of the dependency of water vaporpermeability of each material on RH. The first derivative of theexponential equation in Figure 1 is free from any excursions.The users of the raw data in tables similar to Tables 4 and 5 havethe freedom to choose any analytical expression that best fits theexperimental data, but they must be cautious about the behaviorof the first derivative.
Water Absorption Coefficient5
Five test specimens, 5 cm × 5 cm × 5 cm each, were usedin these measurements. Water is maintained at 22 (± 1) °C. Thenumbers in parentheses in Table 7 give the standard devia-tions. Linear regression, using all the data from the first linearpart of the absorption process for the five specimens, gives:Water absorption coefficient for the major surfaces = 0.036 ±0.002 kg m-2 s-½.
Moisture Diffusivity
Gamma ray method (Kumaran and Bomberg 1985) isused to measure the distribution of moisture in three test spec-imens, 5 cm × 23 cm × 2.4 cm each, during the moisture uptakethrough the edge. The principle of the methodology isdescribed by Kumaran et al. (1989). Marchand and Kumaran(1994) reported the procedure used for the data reduction.
The running average method that is described by March-and and Kumaran (1994) gives the characteristic curve shown
5. The procedure used is based on CEN/TC 89/WG 10 N95, Deter-mination of Water Absorption Coefficient, 1994-07-07.
Figure 1 All data are interpreted as dry cup measurements; RH inside the cup is “zero,” and chamber RH is the RH outsidethe cup.
Table 7. Water Absorption Data for Aerated Concrete
Square Root of time, s1/2
Water Absorptionkg m-2
7.75 0.93 (0.13)
13.42 1.24 (0.17)
17.32 1.41 (0.21)
24.49 1.73 (0.25)
30.00 1.96 (0.29)
38.73 2.29 (0.34)
45.83 2.55 (0.37)
54.77 2.87 (0.44)
64.81 3.20 (0.47)
73.48 3.48 (0.53)
81.24 3.71 (0.56)
91.65 4.05 (0.62)
101.00 4.31 (0.69)
ASHRAE Transactions 493
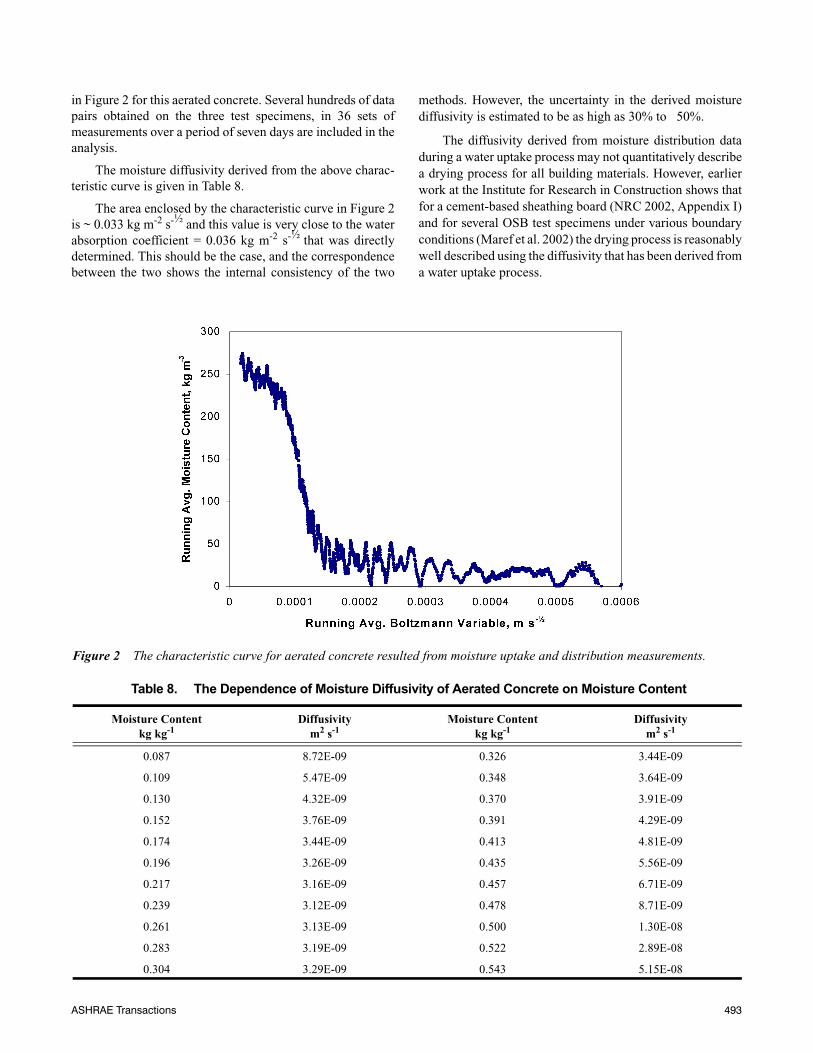
in Figure 2 for this aerated concrete. Several hundreds of datapairs obtained on the three test specimens, in 36 sets ofmeasurements over a period of seven days are included in theanalysis.
The moisture diffusivity derived from the above charac-teristic curve is given in Table 8.
The area enclosed by the characteristic curve in Figure 2is ~ 0.033 kg m-2 s-½ and this value is very close to the waterabsorption coefficient = 0.036 kg m-2 s-½ that was directlydetermined. This should be the case, and the correspondencebetween the two shows the internal consistency of the two
methods. However, the uncertainty in the derived moisturediffusivity is estimated to be as high as 30% to 50%.
The diffusivity derived from moisture distribution dataduring a water uptake process may not quantitatively describea drying process for all building materials. However, earlierwork at the Institute for Research in Construction shows thatfor a cement-based sheathing board (NRC 2002, Appendix I)and for several OSB test specimens under various boundaryconditions (Maref et al. 2002) the drying process is reasonablywell described using the diffusivity that has been derived froma water uptake process.
Figure 2 The characteristic curve for aerated concrete resulted from moisture uptake and distribution measurements.
Table 8. The Dependence of Moisture Diffusivity of Aerated Concrete on Moisture Content
Moisture Contentkg kg-1
Diffusivitym2 s-1
Moisture Contentkg kg-1
Diffusivitym2 s-1
0.087 8.72E-09 0.326 3.44E-09
0.109 5.47E-09 0.348 3.64E-09
0.130 4.32E-09 0.370 3.91E-09
0.152 3.76E-09 0.391 4.29E-09
0.174 3.44E-09 0.413 4.81E-09
0.196 3.26E-09 0.435 5.56E-09
0.217 3.16E-09 0.457 6.71E-09
0.239 3.12E-09 0.478 8.71E-09
0.261 3.13E-09 0.500 1.30E-08
0.283 3.19E-09 0.522 2.89E-08
0.304 3.29E-09 0.543 5.15E-08
494 ASHRAE Transactions
For the present investigation, two series of drying exper-iments were conducted on this same aerated concrete. Bothseries of investigations suggest that the diffusivity determinedfrom a “wetting process” describes the “drying process” withreasonable accuracy. Further details are given in the project’sfinal report (NRC 2002, Appendix II).
Air Permeability
Bomberg and Kumaran (1986) have reported the princi-ple of the method used in these measurements. Three circulartest specimens (thickness of 20.29 mm, 20.56 mm, 20.34 mm),each approximately 15 cm in diameter, are used in thesemeasurements. The measurements are conducted at a temper-ature = 22 (±1)°C. All data obtained from two series ofmeasurements on each specimen are shown in Figure 3.
For the range of pressure differences between 25 Pa and700 Pa, the flow rate linearly varies with the pressure differ-ence for each test specimen. If each set is independentlyanalyzed, the following three values are obtained for the airpermeabilities:
4.2E-09 kg m-1 Pa-1 s-1 with a linear correlation coefficient equal to 0.997,
3.0E-09 kg m-1 Pa-1 s-1 with a linear correlation coefficient equal to 0.994, and
7.4E-09 kg m-1 Pa-1 s-1 with a linear correlation coefficient equal to 0.991.
The mean of these three values is 4.9E-09 kg m-1 Pa-1 s-1.From the deviation of each test specimen from this mean value,within a confidence interval of 95% (this was the default valuethat was used for each of the three linear regressions), one mayassign (4.9 ± 2.6) E-09 kg m-1 Pa-1 s-1 for the air permeabilityof this aerated concrete.
OUTCOME OF ASHRAE RESEARCH PROJECT 1018
All applicable test procedures were applied to all thematerials listed earlier. A summary of the information gener-ated can be found in Table 9. A “yes” entry in any location inthe table indicates the corresponding information has beengenerated and reported. A “no” entry indicates that the testmethod was not applicable. This may be due to lack ofresponse or very slow response such that it was not practicableto generate the information. A vacant location indicates thatthe measurement was not planned in the project proposal.
CONCLUDING REMARKS
ASHRAE Research Project 1018 has now resulted in a setof information that building physicists were hoping to findreadily available. These are documented in the project finalreport, “A Thermal and Moisture Transport Property Databasefor Common Building and Insulating Materials, Final Reportfrom ASHRAE Research Project 1018-RP” (NRC 2002).Values for thermal conductivities, water vapor transmissionproperties, water absorption coefficients, moisture diffusivi-
Figure 3 The dependence of airflow rate on pressure difference for aerated concrete. As noted earlier, the materialinhomogeneity results in three separate series of results on three separate test specimens. This, in turn, introducesmore than 50% uncertainty in the assigned air permeability of this aerated concrete.
ASHRAE Transactions 495
Table 9. Matrix Showing Available Information from ASHRAE RP-1018
MaterialThermal
Conductivity
Vapor Permeability/
Permeance
Sorption/Desorption
SuctionMoisture
Diffusivity
Air Permeability/
Permeance
Absorption Coefficient
Clay Brick Yes Yes Yes Yes Yes Yes Yes
Aerated Concrete Yes Yes Yes Yes Yes Yes Yes
Mortar Yes Yes Yes Yes Yes Yes Yes
Stucco Yes Yes Yes Yes Yes Yes Yes
EIFS (Base & Finish Coat) No Yes No No No Yes No
Composite Wood Siding Yes Yes Yes No Yes Yes Yes
Limestone Yes Yes Yes Yes No Yes Yes
OSB-1 Yes Yes Yes Yes Yes Yes Yes
OSB-2 Yes Yes Yes Yes Yes Yes Yes
OSB-3 Yes Yes Yes Yes Yes Yes Yes
Plywood-1 Yes Yes Yes Yes Yes Yes Yes
Plywood-2 Yes Yes Yes Yes Yes Yes Yes
Plywood-3 Yes Yes Yes Yes Yes Yes Yes
Woodfiber Board Yes Yes Yes Yes Yes Yes Yes
Fibercement Board Yes Yes Yes Yes Yes Yes Yes
Cementitious Board Yes Yes Yes Yes Yes Yes Yes
Spun Bonded Polyolefin-1 Yes Yes Yes
Spun Bonded Polyolefin-2 Yes Yes Yes
#15 Felt Yes Yes Yes
10 min Paper Yes Yes Yes
30 min Paper Yes Yes Yes
60 min Paper Yes Yes Yes
Glassfiber Batts Yes Yes Yes Yes
Cellulose Fiber Yes Yes Yes Yes Yes
Expanded Polystyrene Yes Yes Yes Yes
Extruded Polystyrene Yes Yes Yes Yes
Spray Polyurethane Yes Yes Yes Yes
Polyisocyanurate Yes Yes Yes Yes
Low-Density Foam Yes Yes Yes Yes
Spruce Yes Yes Yes Yes Yes Yes Yes
Eastern White Pine Yes Yes Yes Yes Yes Yes Yes
Southern Yellow Pine Yes Yes Yes Yes Yes Yes Yes
Eastern White Cedar Yes Yes Yes Yes Yes Yes Yes
Western Red Cedar Yes Yes Yes Yes Yes Yes Yes
Interior Gypsum Yes Yes Yes No Yes Yes Yes
Vinyl Wall paper Yes Yes Yes
Primer Yes Yes Yes
Paint Yes Yes Yes
496 ASHRAE Transactions
ties from water uptake processes, and airflow characteristicsof all materials, if applicable, are uniquely determined for eachtest specimen that has been investigated in the project. Thesame cannot be said about the equilibrium moisture contents.The responses shown by most materials were rather slow, andoften equilibration took too long. The number of materialsselected for the project for the equilibrium moisture contentmeasurements was too high to be completed within theproject’s life. So these measurements were not done to thesame detail as originally planned. Suction measurement usingthe pressure plate apparatus needs further investigation beforeit can be applied to all building materials. Depending on thestarting point of saturation—vacuum saturation or capillarysaturation through total submersion or capillary saturation onpartial immersion—one may end up with slightly differentequilibrium moisture content at each stage of the measure-ments. Efforts should be directed toward the development ofan international standard to determine equilibrium moisturecontents at very high relative humidities, close to saturation.
Attempts to directly measure liquid permeabilities arecontinuing at the Institute for Research in Construction. Theexperiments to date have proven to be rather tedious and timeconsuming. No conclusive results are yet available. It is desir-able to determine liquid permeabilities of building materialsdirectly. Efforts should also be directed to develop a standardprocedure for that purpose.
ACKNOWLEDGMENTS
The planning, attention, and dedication shown by Mr.John Lackey, Mrs. Nicole Normandin, Mr. Fitsum Tariku, andMr. David van Reenen during the course of this work arelargely responsible for the success of this project. They jointlyperformed all the measurements reported here. The onlyexceptions are some of the measurements on aerated concretethat are chosen as illustrative examples in this paper. Mr. Xiao-chuan Qiu performed some of those measurements under thesupervision of either Mr. Lackey or Mrs. Normandin, while hewas working at the Institute as a guest worker.
Financial support from ASHRAE for this project is grate-fully acknowledged.
NOMENCLATURE
A = area, m2
Dw = moisture diffusivity, m2s–1
Ja = airflow rate across an area, A, kg·m–2s–1
Jl = liquid water flow rate across an area, A, kg·m–2s–1
Jv = water vapor flow rate across an area, A, kg·m–2s–1
ka = air permeability, kg·m–1s–1Pa–1
Ka = air permeance, kg·m–2s–1Pa–1
l = thickness, m
M = molar mass, kg·mol–1
p = air pressure or water vapor pressure, Pa
ph = equilibrium air pressure, Pa
Q = heat flow rate across an area, A, W·m–2
R = ideal gas constant, J·mol–1K–1
T = temperature, K
u = moisture content, kg·kg–1
δp = water vapor permeability, kg·m–1s–1Pa–1
δl = water vapor permeance for thickness, l, kg·m–2s–1 Pa–1
Δ = difference in a physical quantity
λ = thermal conductivity, W·m–1K–1
ϕ = relative humidity, [–]
ρ = density, kg·m–3
ρ0 = density of dry material, kg·m–3
REFERENCES
Bomberg, M.T., and M.K. Kumaran. 1986. A test method todetermine airflow resistance of exterior membranes andsheathings. Journal of Thermal Insulation 9:224–35.
Bruce, R.R., and A. Klute. 1956. The measurement of soildiffusivity. Soil Science Society of America Proceedings20:251–57.
Burch, D.M., W.C. Thomas, and A.H. Fanney. 1992. Watervapor permeability measurements of common buildingmaterials. ASHRAE Transactions 98(2):486–94.
Descamps, F. 1997. Continuum and discrete modelling ofisothermal water and air transfer in porous media. PhDthesis, Katholieke University–Leuven, pp. 57–107.
Hansen, M.H. 1998. Retention curves measured using pres-sure plate and pressure membrane. Nordtest TechnicalReport 367, Danish Building Research Institute, p. 63.
Hansen, K.K. 1986. Sorption isotherms, a catalogue. The Tech-nical University of Denmark Technical Report 162/86.
Hansen, K.K., and H.B. Lund. 1990. Cup method for deter-mination of water vapor transmission properties ofbuilding materials. Sources of uncertainty in themethod. Proceedings of the 2nd Symposium, BuildingPhysics in Nordic Countries, pp. 291–98.
Hens, H. 1996. Heat, air and moisture transport. Final report,Vol 1, Task 1: Modelling. International Energy AgencyAnnex 24, Laboratorium Bouwfysica, Katholieke Uni-versity–Leuven, Belgium.
Kumaran, M.K. 1996. Heat, air and moisture transport. Finalreport, Vol 3, Task 3: Material properties. InternationalEnergy Agency Annex 24, Laboratorium Bouwfysica,Katholieke University–Leuven, Belgium.
Kumaran, M.K. 1998. An alternative procedure for the anal-ysis of data from the cup measurements for determina-tion of water vapor transmission properties. Journal ofTesting and Evaluation 26:575–81.
Kumaran, M.K. 1999. Moisture diffusivity of building mate-rials from water absorption measurements. Journal ofThermal Envelope and Building Science 22:349–55.
Kumaran, M.K., and M.T. Bomberg. 1985. A gamma-spec-trometer for determination of density distribution andmoisture distribution in building materials. Moisture
ASHRAE Transactions 497
and Humidity: Measurements and Control in Scienceand Industry: Proceedings of International Symposium,pp. 485–90.
Kumaran, M.K., G.P. Mitalas, R. Kohonen, and T. Ojanen.1989. Moisture transport coefficient of pine fromgamma ray measurements. Collected Papers in HeatTransfer, ASME Heat Transfer Division 123:179–83.
Lackey, J.C., R.G. Marchand, and M.K. Kumaran. 1997. Alogical extension of ASTM Standard E96 to determinethe dependence of water vapor transmission on relativehumidity. In ASTM STP 1320, Insulation Materials:Testing and Applications, R.S. Graves and R.R. Zarr,eds., vol. 3, pp. 456–70. West Conshohocken, PA:American Society for Testing and Materials.
Marchand, R.G., and M.K. Kumaran. 1994. Moisture diffu-sivity of cellulose insulation. Journal of Thermal Insula-tion and Building Envelopes 17:362–37.
Maref, W., M.K. Kumaran, M.A. Lacasse, M.C. Swinton,and D. van Reenen. 2002. Laboratory measurement andbenchmarking of an advanced hygrothermal model.Proceedings of the 12th International Heat TransferConference, Grenoble, France, pp. 117–22.
NRC. 1999. A thermal and moisture transport property data-base for common building and insulating materials—1018-RP. NRC Canada Client Report to ASHRAE, No.B-1115.3. National Research Council Canada, Ottawa.
NRC. 2000. Thermal and moisture transport property data-base for common building and insulating materials—1018-RP. NRC Canada Client Report to ASHRAE, No.B-1115.9. National Research Council Canada, Ottawa.
NRC. 2002. A thermal and moisture transport property data-base for common building and insulating materials,Final Report from ASHRAE Research Project RP-1018.NRC Canada Client Report, No. B-1115.13. NationalResearch Council Canada, Ottawa.
Pel, L. 1995. Moisture transport in porous building materi-als. PhD thesis, Eindhoven University of Technology,The Netherlands, pp. 47–80.
Richards, R.F., D.M. Burch, and W.C. Thomas. 1992. Watervapor sorption measurements of common buildingmaterials. ASHRAE Transactions 98(2):475–85.
Tveit, A. 1966. Measurements of moisture sorption andmoisture permeability of porous materials. Report 45,Norwegian Building Research Institute, Oslo.
Trechsel, H. R., ed. 1994. Manual on Moisture Control inBuildings. ASTM Manual Series: MNL 18:35–53. Phil-adelphia: American Society for Testing and Materials.
Trechsel, H.R., ed. 2001. Moisture Analysis and Condensa-tion Control in Building Envelopes. ASTM ManualSeries: MNL 40:29–65, 161–183. Philadelphia: Ameri-can Society for Testing and Materials.