Page 1
University of Arkansas, FayettevilleScholarWorks@UARK
Theses and Dissertations
5-2013
QCM Aptasensor for Rapid and Specific Detectionof Avian Influenza VirusLuke BrockmanUniversity of Arkansas, Fayetteville
Follow this and additional works at: http://scholarworks.uark.edu/etd
Part of the Pathogenic Microbiology Commons, Pathology Commons, and the VirologyCommons
This Thesis is brought to you for free and open access by ScholarWorks@UARK. It has been accepted for inclusion in Theses and Dissertations by anauthorized administrator of ScholarWorks@UARK. For more information, please contact [email protected] , [email protected] .
Recommended CitationBrockman, Luke, "QCM Aptasensor for Rapid and Specific Detection of Avian Influenza Virus" (2013). Theses and Dissertations. 789.http://scholarworks.uark.edu/etd/789
Page 2
QCM Aptasensor for Rapid and Specific Detection of Avian Influenza Virus
Page 3
QCM Aptasensor for Rapid and Specific Detection of Avian Influenza Virus
A thesis submitted in partial fulfillment
of the requirements for the degree of
Master of Science in Biomedical Engineering
By
Luke David Brockman
University of Arkansas
Bachelor of Science in Biological Engineering, 2010
May 2013
University of Arkansas
Page 4
Abstract
There has been a need for rapid detection of avian influenza virus (AIV) H5N1 due to it
being a potential pandemic threat. Most of the current methods, including culture isolation and
PCR, are very sensitive and specific but require specialized laboratories and trained personnel in
order to complete the tests and are time-consuming. The goal of this study was to design a
biosensor that would be able to rapidly detect AIV H5N1 using aptamers as biosensing material
and a quartz crystal microbalance (QCM) for transducing method. Specific DNA aptamers
against AIV H5N1 were immobilized, through biotin and streptavidin conjugation, onto the gold
surface of QCM sensor to capture the target virus. Magnetic nanobeads (150 nm in diameter)
were then added as amplifiers considering its large surface/volume ratio which allows for a
higher target molecule binding rate and faster movement. The result showed that the captured
AIV caused frequency change, and more change was observed when the AIV concentration
increased. The nanobead amplification was effective at the lower concentrations of AIV;
however, it was not significant when the AIV concentration was 1 HAU or higher. The detection
limit of the aptasensor was 1 HAU with a detection time of 1 h. The capture of the target virus on
to the surface of QCM sensor and the binding of magnetic nanobeads with the virus was
confirmed with electron microscopy. Aptamers have unlimited shelf life and are temperature
stable which allows this aptasensor to give much more consistent results specifically for in field
applications.
Keywords: Aptasensor, Avian Influenza, QCM, Aptamer, Nanobeads
Page 5
This thesis is approved for recommendation
to the Graduate Council.
Thesis Director:
__________________________________
Dr. Yanbin Li
Thesis Committee:
__________________________________
Dr. David Zaharoff
__________________________________
Dr. Michael Slavik
Page 6
Thesis Duplication Release
I hereby authorize the University of Arkansas Libraries to duplicate this thesis when
needed for research and/or scholarship.
Agreed _____________________________________
Luke David Brockman
Refused ____________________________________
Luke David Brockman
Page 7
Acknowledgments
First, I would like to thank my advisor, Dr. Yanbin Li, for his support throughout my
Master's research. He was committed to helping me grow as a researcher which has been an
extremely valuable experience. I have learned a lot by seeing first hand his passion for research.
Secondly, I would like to thank my committee members, Dr. Michael Slavik and Dr.
David Zaharoff, for taking the time to review my Master's Thesis.
I would also like to thank Dr. Huaguang Lu of Penn State University for providing the
non-target viruses used in my research.
I especially need to thank the research group for all of their support: Dr. Ronghui Wang
for her help with all thing research related; Jacob Lum for being a great friend and also being
there for me whenever I had questions or needed help in the Lab; Lisa Cooney for her help in
SEM imaging; Dr. Yingchun Fu for sharing his knowledge of the QCM and analytical chemistry.
I would also like to thank the rest of the research group for their friendship and support.
I would like to thank the Department of Biomedical Engineering for supporting me
throughout my Master’s program and the Department of Biological and Agricultural Engineering
for supporting me with a teaching assistantship throughout my graduate studies.
This research was supported in part by the Arkansas Biosciences Institute and they are
greatly appreciated for their financial support.
Lastly, and most importantly, I would like to thank my parents for everything they have
done for me. They have always been supportive of whatever I chose to do and I can't thank them
Page 8
enough for that. Their love and support is what made it possible for me to achieve my academic
goals and I can't put in to words how much they have meant to me.
Page 9
Table of Contents
Chapter 1 Introduction.................................................................................................................1
Chapter 2 Objectives.....................................................................................................................4
Chapter 3 Review of Literature....................................................................................................6
3.1 H5N1 Influenza Virus................................................................................................................7
3.2 Current Detection Methods for H5N1.......................................................................................9
3.3 Biosensors................................................................................................................................10
3.3.1 Major Types of Biosensors used in Microbial Detection.........................................11
3.3.2 Biosensors for Detection of Avian Influenza............................................................13
3.3.3 Quartz Crystal Microbalance Biosensors..................................................................14
3.3.4 Aptamers...................................................................................................................16
3.3.5 Electrode Modification in QCM Biosensors.............................................................17
3.4 Magnetic Nanoparticles...........................................................................................................18
Chapter 4 Materials and Methods..............................................................................................19
4.1 Materials..................................................................................................................................20
4.1.1 Biological and Chemical Reagents...........................................................................20
4.1.2 Virus and Aptamers..................................................................................................20
4.1.3 Instruments and Electrodes.......................................................................................21
4.2 Detection of AIV H5N1...........................................................................................................23
4.2.1 Pretreatment of Electrodes........................................................................................23
4.2.2 Preparation of 150 nm Magnetic Nanobeads............................................................23
4.2.3 Detection of AIV H5N1............................................................................................24
4.2.4 Specificity Tests........................................................................................................26
4.2.5 Data Analysis............................................................................................................26
4.3 Calculation of Captured Virus.................................................................................................27
Page 10
Chapter 5 Results and Discussion..............................................................................................28
5.1 Fabrication and Characterization of the QCM Aptasensor......................................................29
5.2 Detection of AIV H5N1...........................................................................................................31
5.3 Specificity of the Aptasensor...................................................................................................36
Chapter 6 Conclusions.................................................................................................................38
Chapter 7 Recommendations for Future Research..................................................................40
References.....................................................................................................................................42
Page 11
List of Tables
Table 5.1 Frequency values of the QCM aptasensor for each titer (HAU) of AI H5N1 virus in
PBS solution. Error values indicate the standard deviation (n=3).................................................32
Table 5.2 Comparison of calculated virus captured versus the number of virus added…...........33
Table 5.3 Comparison of treatment means. Levels not connected by the same letter are not
significantly different.....................................................................................................................34
Table 5.4 P values for each H5N1 concentration determining the significance of nanobead
amplification. P values greater than .05 are considered not significantly different. .....................34
Page 12
List of Figures
Figure 4.1 H5N1 aptamer secondary structure.............................................................................21
Figure 4.2 Schematic of the aptasensor. The biological sensing element is immobilized on the
electrode surface. The quartz in the electrode acts as a transducer, converting the mass change to
a frequency signal. The QCM processes and records all of the data............................................22
Figure 4.3 Instruments and electrodes. (a) QCA 922 quartz crystal analyzer. (b) 8 MHz AT-cut
quartz crystal electrode. (c) 70 µl acrylic flow cell.......................................................................22
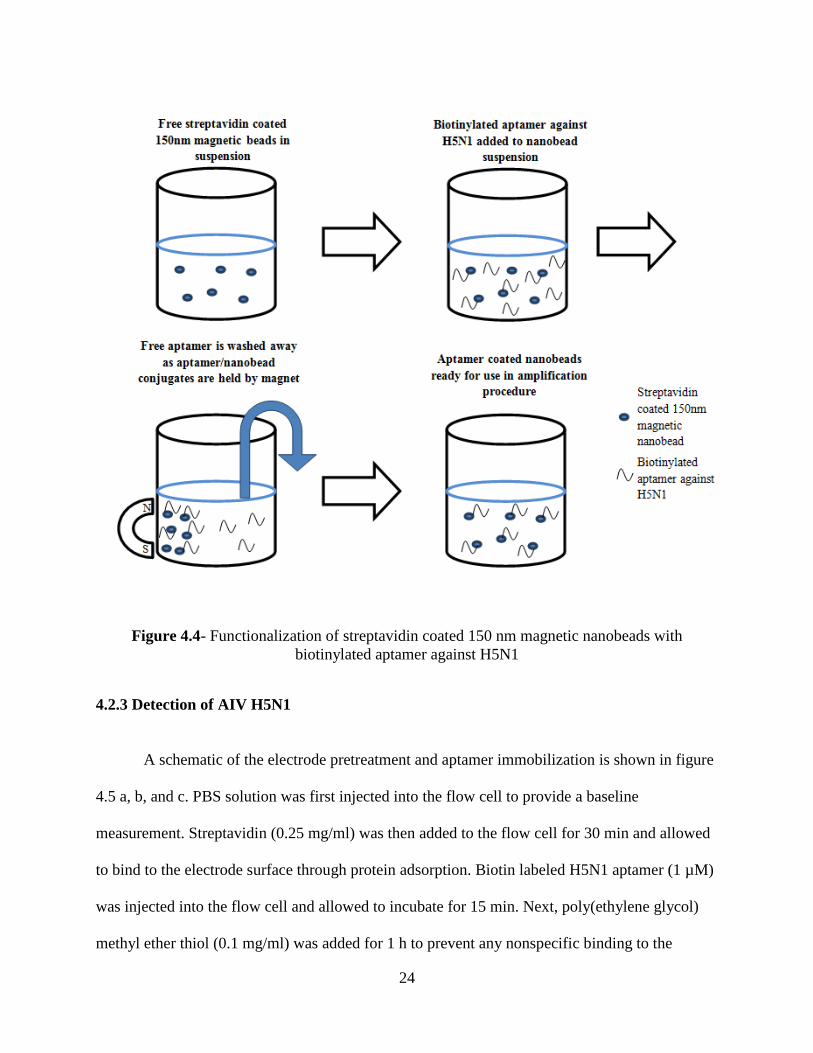
Figure 4.4 Functionalization of streptavidin coated 150 nm magnetic nanobeads with
biotinylated aptamer against H5N1...............................................................................................24
Figure 4.5 The electrode modification, virus detection and signal amplification of the
aptasensor. a) Streptavidin adsorption; b) aptamer immobilization by streptavidin binding; c)
PEG blocking of unbound sites; d) capturing of target H5N1 virus; e) amplification by nanobead
labeling...........................................................................................................................................25
Figure 5.1 Frequency shifts of the QCM aptasensor comparing BSA and PEG blocking agents
for AIV H5N1................................................................................................................................30
Figure 5.2 Typical sensorgram of the QCM aptasensor for surface modification, aptamer
immobilization, target AIV detection and signal amplification with nanobeads. The concentration
of AIV H5N1 was 1 HA in this test...............................................................................................31
Figure 5.3 Frequency shifts of the QCM aptasensor as a function of the titer (HAU) of AI H5N1
virus in PBS solution. The detection limit is determined as 1 HAU. Error bars indicate the
standard deviation (n=3)................................................................................................................32
Page 13
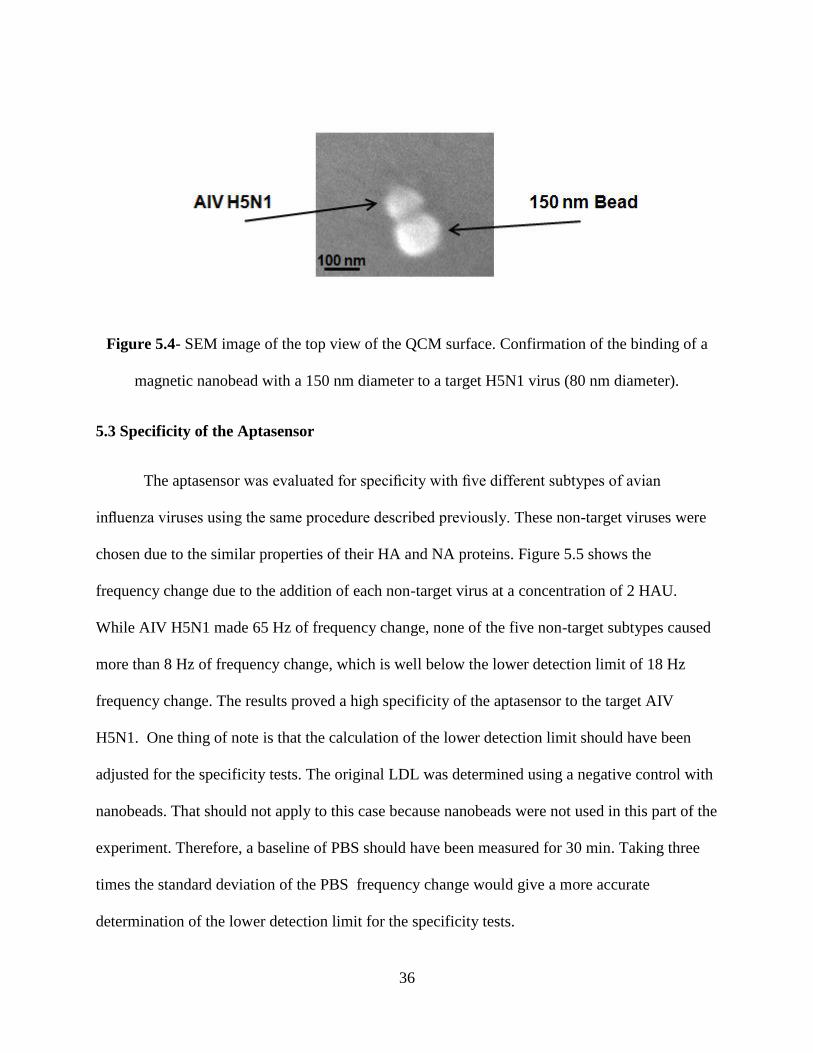
Figure 5.4 SEM image of the top view of the QCM surface. Confirmation of the binding of a
magnetic nanobead with a 150 nm diameter to a target H5N1 virus (80 nm diameter)................36
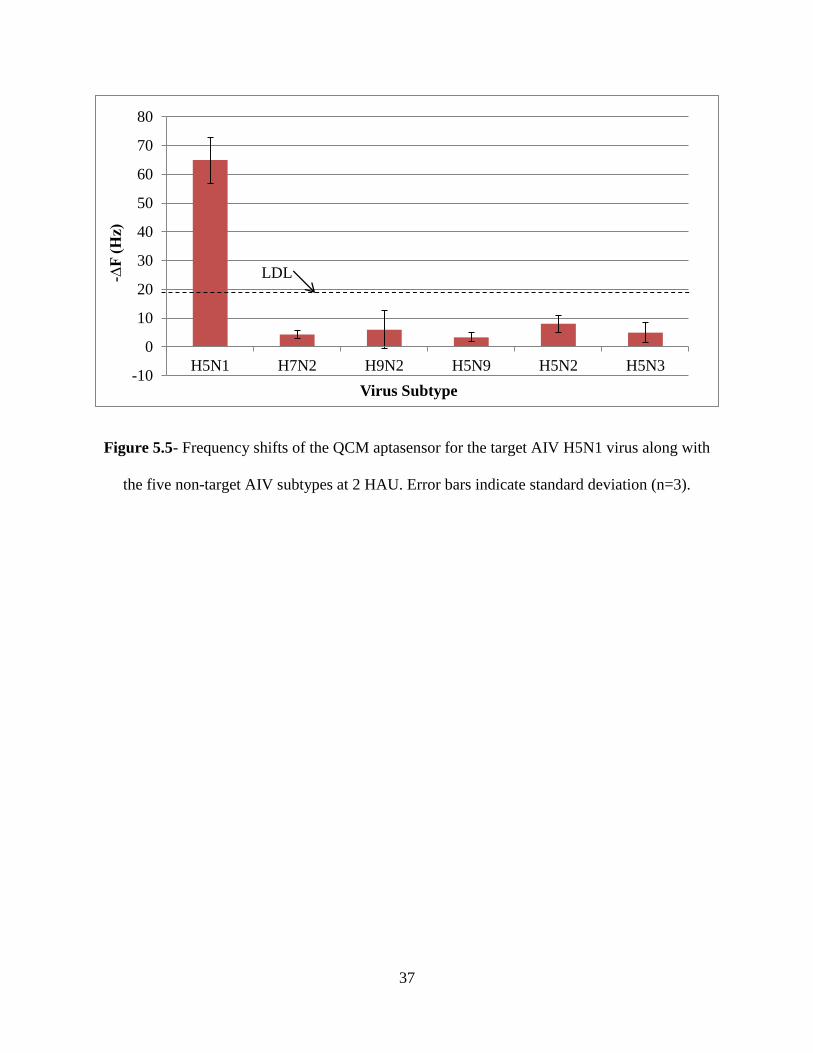
Figure 5.5 Frequency shifts of the QCM aptasensor for the target AIV H5N1 virus along with
the five non-target AIV subtypes at 2 HAU. Error bars indicate standard deviation (n=3)..........37
Page 14
1
Chapter 1 Introduction
Page 15
2
Avian influenza viruses (AIV) are a genus of virus in the family Orthomyxoviridae
consisting of a single stranded negative sense RNA genome segmented into eight fragments (Lee
& Saif, 2009). They can occur in both low pathogenic and high pathogenic strains. Two types of
antigen proteins are found on the surface of the virus, hemagglutinin (HA) and neuraminidase
(NA), which determine the subtype of the virus. High pathogenic avian influenza subtype H5N1
mainly affects birds but in rare cases humans can become infected after close, direct contact with
infected birds (Fang et al., 2008). It was first discovered in humans in 1997 in Hong Kong. Since
then the virus has spread throughout much of south Asia and parts of Europe and Africa. The
virus often has a mortality rate of 100% in poultry while having a 60% mortality rate in humans.
Since 2003, there have been a total of 622 reported cases in humans resulting in 371 deaths
(WHO, 2013). It is estimated that H5N1 has already cost the poultry industry over $10 billion
and the World Bank has estimated that a severe human outbreak would cost upwards of $3
trillion to the global economy (Burns et al., 2008). For these reasons, it is extremely important to
have rapid detection of AIV H5N1 to prevent outbreaks. The current gold standard for avian
influenza detection are viral isolation cultures and real-time RT-PCR. They both provide high
sensitivity but are time consuming, expensive, and require special training and facilities
(Charlton et al., 2009; Ellis & Zambon, 2002). These longer tests may allow the virus to spread
which is why more reliable, rapid detection methods are needed.
As an alternative, biosensors have been studied for the detection of avian influenza virus.
Biosensors, which combine a biological sensing element, a transducer, and a signal processing
unit, have shown a lot of promise for rapid detection of virus (Amano & Cheng, 2005). Quartz
crystal microbalance (QCM) has gained popularity due to its simplicity and cost effectiveness
(Ivnitski et al., 1999). The QCM biosensor is based on the piezoelectric properties of a quartz
Page 16
3
crystal wafer when an electric field is applied across the electrodes. The change in resonant
frequency can be attributed to a change in mass on the electrode surface. Many biological
sensing elements have been used with biosensors, but aptamers are becoming more popular due
to their stability and ease of manipulation.
In this research, a previously developed aptamer against AIV H5N1 was used with the
QCM biosensor along with nanobead amplification. The objective was to improve specificity,
decrease the lower detection limit and reduce the detection time for AIV H5N1.
Page 17
4
Chapter 2 Objectives
Page 18
5
Avian influenza H5N1 is a highly pathogenic virus that has the potential to have major
health and economic impacts. Current detection methods either lack specificity or are too time
consuming and expensive to be used for rapid, on-site testing. The QCM biosensor has been
developed to meet these goals but is currently lacking the sensitivity required. The objective of
this study was to improve the specificity and sensitivity of the biosensor by using an aptamer
against AIV H5N1, rather than the traditional antibody, as well as nanobead amplification to
further increase the sensitivity.
The specific objectives of this project were as follows:
1. To determine the effectiveness of using an aptamer as an alternative biological recognition
element for improving the specificity and sensitivity of the biosensor for H5N1.
2. To determine the effectiveness of using aptamer labeled nanobeads as mass amplifiers to
further lower the detection limit of the AIV H5N1 biosensor.
Page 19
6
Chapter 3 Review of the Literature
Page 20
7
3.1 H5N1 Influenza virus
Influenza A viruses are a genus of virus in the family Orthomyxoviridae consisting of a
single stranded negative sense RNA genome segmented into 8 fragments (Lee & Saif, 2009).
The structure of the virus is a helical capsid surrounded by a lipoprotein envelope. For the virus
to be infectious a functional copy of each genome segment must be present. The nucleocapsid is
covered by a lipoprotein membrane which consists of a lipid layer interspersed with membrane
proteins. The lipoprotein envelope of Orthomyxoviridae viruses can occur in either spherical or
helical forms with the shape being dependent on its surface proteins (Jin et al., 1997). Spherical
virus particles are typically 50-120 nm in diameter, while filamentous particles typically have a
diameter around 20 nm and a length of 200-300 nm.
Two types of antigen proteins are found on the surface of the virus, hemagglutinin (HA)
and neuraminidase (NA). Each virus particle contains 500-1000 hemagglutinin proteins and 100-
500 neuraminidase proteins (Mitnaul et al., 2000). The virus subtype is determined by the
specific type of hemagglutinin and neuraminidase present on the surface. In total there are 16
different HA subtypes and 9 NA subtypes.
The natural host of influenza A particles are wild birds, primarily water fowl. These can
carry and shed virus even while showing no outward symptoms. The primary virus transmission
route is fecal-oral in birds while mammals transmit infection more through respiratory. Though
the virus can be stable up to a week in the environment, the presence of a lipoprotein envelope
makes the virus particles susceptible to deactivation by disinfectants and detergents (Harder &
Werner, 2006).
Page 21
8
High pathogenic avian influenza subtype H5N1 mainly affects birds but in rare cases
humans can become infected after close, direct contact with infected birds (Fang et al., 2008).
The high pathogenic strain of H5N1 was first isolated from a farm goose in Guangdong parish of
China in 1996. In 1997 the first known human case occurred in Hong Kong when 18 people
became infected, resulting in 6 deaths. Since 2003, there have been a total of 622 reported cases
in humans resulting in 371 deaths (WHO, 2013). It is estimated that H5N1 has already cost the
poultry industry over $10 billion and the World Bank has estimated that a severe human
outbreak would cost upwards of $3 trillion to the global economy (Burns et al., 2008). So far
there is very little evidence of human to human transmission but there is always the danger that
H5N1 will gain a mutation which would allow for efficient transmission between humans (Li et
al., 2004).
The difference between the high pathogenic and low pathogenic strains of H5N1can be
attributed to the ease of which the H5-variant of the HA protein can be cleaved. The cleavage
site of high pathogenic H5N1 contains a large number of basic amino acid residues allowing it to
be cleaved by a variety of host proteases. This allows the virus to be able to infect more of the
body outside the respiratory tract (Steinhaeur, 1999).
In birds typical symptoms of H5N1 include swelling of the head and neck region,
reduced egg production, decreased food and water consumption, ruffled feathers, conjunctivitis,
and throat and nasal discharge. High pathogenic H5N1 has a high mortality rate of between 90-
100% in domestic birds (Boyce et al., 2009). Symptoms in humans are similar to those of the
common flu but are much more severe and include fever, cough, sore throat, muscle aches,
conjunctivitis, and sometimes even pneumonia (Hien et al., 2009). It is estimated that many mild
Page 22
9
cases of H5N1 go unreported which would therefore cause the reported mortality rate of 60% in
humans to be lower (Thorson et al., 2006).
3.2 Current Detection Methods for H5N1
An avian influenza virus outbreak would have huge economic impacts on top of the
potential loss of human life. Poultry industries would be crippled not only by the loss of their
flock but also from the time it would take to quarantine the infected birds to prevent further
spread (Burns et al., 2008). For these reasons, it is essential to have reliable, rapid detection
methods for reducing the spread of avian influenza. Some of the current detection methods for
avian influenza include viral isolation culture, immunochromatographic strips, direct
immunofluorescent assay, enzyme-linked immunoassay, hemagglutinin-inhibition, and reverse-
transcription-polymerase chain reaction (Amano & Cheng, 2005).
The gold standard method for which all virus detection methods are compared is the viral
isolation culture with immunological antigen conformation (Leland & Ginocchico, 2007). For
viral isolation specific pathogen free embryonated chicken eggs or cell cultures must first be
inoculated with the virus sample. Doing this allows the virus infectivity to be measured in either
50% Egg Infectious Dose per ml (EID50/ml) or 50% Tissue Culture Infectious Dose per ml
(TCID50/ml). Following this technique, hemagglutinin inhibition is performed for subtyping of
the virus. First antisera must be isolated from an infected bird and then serially diluted. This is
then added to a standard HA concentration of different virus subtypes along with erythrocytes.
Antibody binding will hinder the agglutination of erythrocytes, thus identifying the subtype of
virus. Although viral isolation provides great sensitivity and is inexpensive in comparison to
other methods, its requirement of long incubation times, high technical expertise, specialized
Page 23
10
eggs or cell cultures, and live viruses prevents it from a being an efficient detection method
(Charlton et al., 2009).
A lot of the disadvantages of cell culture techniques, such as long incubation times and
high expertise requirements, have been overcome by molecular detection methods. One
molecular detection method that offers fast detection times and high sensitivity is reverse
transcription-polymerase chain reaction (RT-PCR). Because avian influenza has a RNA genome
reverse transcriptase must be used to convert the genome to DNA copies (cDNA) for use in
PCR. The cDNA segments are then further amplified by the enzyme polymerase. DNA primers
are used to serve as a starting point for DNA replication and can also be used for the detection of
a specific avian influenza gene (Dawson et al., 2007). Other methods for detection of H5N1
include the use of real time RT-PCR. It is based on the RT-PCR method but uses fluorescent
probes to detect specific gene fragments at the same time as gene amplification. These probes are
specific to the desired sequence of DNA which makes the real time RT-PCR method much more
specific than the traditional RT-PCR. In addition to increased specificity, real time RT-PCR also
has the capability of using multiple probes to detect multiple genes simultaneously. RT-PCR
methods are still the gold standard for rapid tests because of their sensitivity and specificity but
they still have the disadvantage of being expensive, having high false positive rates, requiring
specialized laboratories and equipment, and consist of a complicated procedure which requires
extensive training (Ellis & Zambon, 2002).
Immunochromatographic strips are a very simple detection method which use enzyme-
labeled anti-nucleoprotein antibodies bound to a membrane and reagents to cause a color change
on a strip signifying the presence of virus. These tests can be completed in less than 30 min and
Page 24
11
are very easy to perform. The downside is that they do not provide any subtype information for
the virus and have low sensitivity requiring follow up testing in most situations (Marandi, 2010).
3.3 Biosensors
A biosensor consists of three parts: biological element, transducing element, and a signal
processing element. The biosensor uses the biological element as a functional group which may
be an enzyme, antibody, protein, cell, virus, organelle or aptamer. This recognition element’s
interaction with the target analyte causes a biochemical change in the environment that the
transducing element can detect through mechanical, electrochemical, piezoelectric, optical or
thermal measurements (Nayak et al, 2009). The signal from the transducer is then converted by
the processing element to produce useable data.
Biosensor research first began in the 1960s when Clark and Lyons proposed the first
glucose sensor at Children’s Hospital in Cincinnati. Since then, biosensors applications have
expanded throughout the medical field as well as agriculture, food safety, environmental
protection, biodefense and many others (Wang, 2001). Biosensors offer many advantages over
conventional methods including targeted specificity, fast response times, continuous data
collection and simplified sample preparation (Deisingh & Thompson, 2004).
3.3.1 Major Types of Biosensors used in Microbial Detection
As previously mentioned there are now many types of biosensors but two main types
have been studied for microbial detection: electrochemical and optical.
Electrochemical biosensors measure the changes in the electrical properties caused by
biochemical reactions to detect an analyte (Grieshaber et al., 2008). They offer many advantages
Page 25
12
including low cost, ease of miniaturization and low power costs (Pejcic et al., 2006). There are
four main types of electrochemical biosensors: amperometric, potentiometric, conductimetric,
and impedimetric. Amperometric biosensors apply a constant potential across an electrode and
measure the current associated with either the reduction or oxidation of an electroactive species
created by its interaction with the biological element (Lojou & Bianco, 2006). Potentiometric
biosensors convert the biological reaction into a potential signal by using ion-selective electrodes
(Konki, 2007). Conductimetric biosensors simply measure the conductivity change caused by the
analytes. Impedance or impedimetric biosensors are a class of electrochemical biosensors which
measure a combination of the resistive and capacitive or inductive properties of a material in
response to a small amplitude sinusoidal excitation signal (Varshney & Li, 2009).
Electrochemical biosensors have been extensively researched for the detection of cells,
bacteria, viruses, proteins and chemicals. They have made major advances in the areas of point-
of-care cancer diagnosis, cancer-related proteins and specific mutations in DNA (Wang, 2006).
Food safety is also another popular field for the use of electrochemical biosensors. They have
been used to detect the presence of antibiotics in milk products down to 2.6 ng/ml (Davis &
Higson, 2010). There are numerous impedance biosensors that have been shown to be able to
detect bacteria and viruses (Varshney & Li, 2009; Wang et al., 2009; Lum et al., 2012; Bai et al.,
2012). Finally, the most common electrochemical sensor today is the glucose sensor which is
used by millions of diabetics on a daily basis (Wang, 2008).
Optical biosensors use visual phenomenon to detect any interaction between the sensing
element and the analyte. Examples of these sensors include surface plasmon resonance (SPR),
absorption, luminescence and fluorescence sensors. These biosensors can work in multiple ways:
the binding of the analyte can directly affect the optical properties of the environment, such as in
Page 26
13
SPR or absorption, or the analyte can be tagged with a label that produces an optical
phenomenon, such as fluorescence.
Fluorescence is one of the most commonly studied types of optical sensors and they
typically use dyes, quantum dots and fluorescent proteins as labels (Medintz et al., 2005).
Because quantum dots have a narrow excitation wavelength they have been successfully used to
simultaneously detect separate pathogens (Yang & Li, 2006). A green fluorescence protein gene
has also been successfully inserted into Listeria monocytogenes for the detection of bacteria
inside of cells (Fortineau et al., 2000).
Label-free optical biosensors are able to avoid some of the disadvantages of fluorescent
labels, such as false positives and negatives and requiring an extra step (Cooper, 2002). SPR
biosensors measure the refractive index of the electrode surface which changes with the addition
of biomolecules. The SPR has proven to be effective in the detection of bacteria, viruses and
proteins in real time (Phillips & Cheng, 2007). It has also been used to quantify influenza virus
for vaccine production using an antibody inhibition assay on the sensor surface (Estmer-Nilsson
et al., 2008).
3.3.2 Biosensors for Detection of Avian Influenza
Since the global outbreak of avian influenza, there has been a large emphasis for
developing biosensors for the detection of the avian influenza virus. Bai et al. (2012) was able to
use an SPR aptasensor to detect H5N1 from swab samples all the way down to 0.128 HAU.
Chang et al. (2010) developed a surface plasmon fluorescence fiber-optic biosensor to detect
H1N1 down to 13.9 pg/ml. A fluorescence biosensor using CdTe quantum dots was developed
by Nguyen et al. (2012) to successfully detect 3 ng/µl of H5N1 virus. Xu et al. (2007) developed
Page 27
14
an optical interferometry biosensor to capture influenza subtypes H7 and H8 using antibodies
with detection limits as low as 0.0005 hemagglutination units per milliliter. Electrically active
magnetic nanoparticles were used by Kamikawa et al. (2010) in their electrochemical biosensor
to detect H5N1 at 1.4 µM. Lastly, Lum et al. (2012) developed an impedance biosensor with red
blood cell amplification for H5N1 with a detection limit of 103 EID50/ml. These developed
sensors have shown potential but are not suitable for rapid, in-field testing due to either their lack
of specificity, are too time-consuming, or are not practical for use on site.
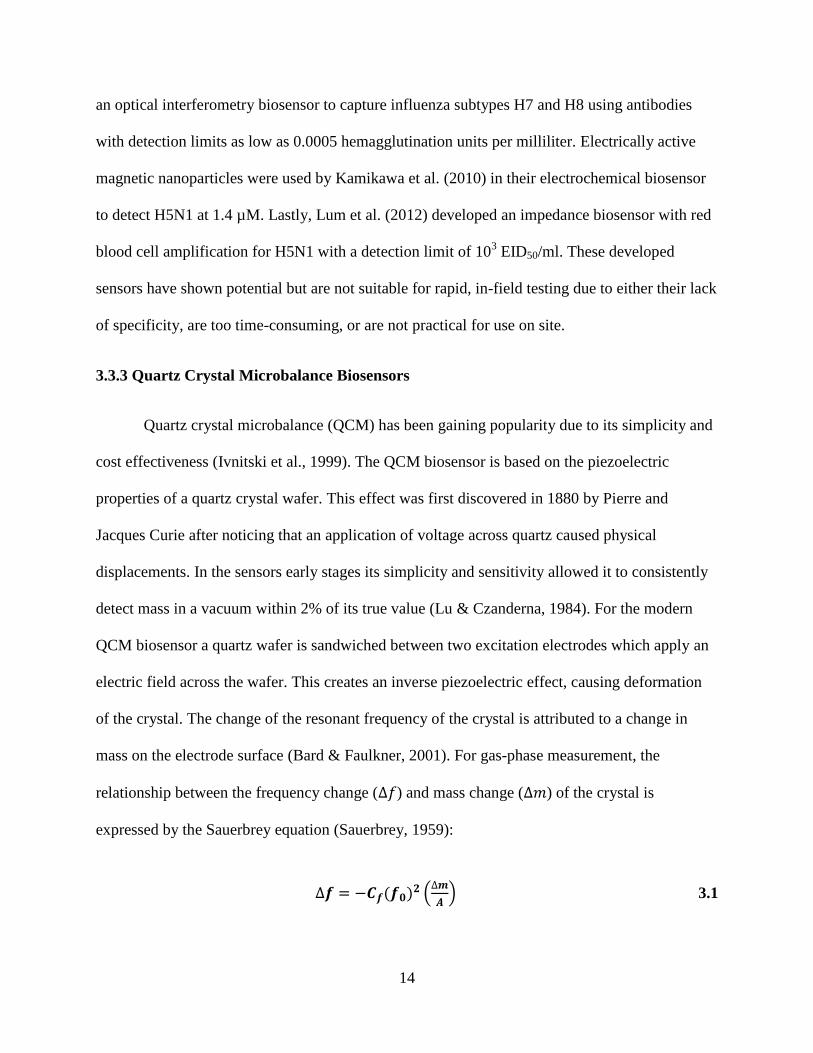
3.3.3 Quartz Crystal Microbalance Biosensors
Quartz crystal microbalance (QCM) has been gaining popularity due to its simplicity and
cost effectiveness (Ivnitski et al., 1999). The QCM biosensor is based on the piezoelectric
properties of a quartz crystal wafer. This effect was first discovered in 1880 by Pierre and
Jacques Curie after noticing that an application of voltage across quartz caused physical
displacements. In the sensors early stages its simplicity and sensitivity allowed it to consistently
detect mass in a vacuum within 2% of its true value (Lu & Czanderna, 1984). For the modern
QCM biosensor a quartz wafer is sandwiched between two excitation electrodes which apply an
electric field across the wafer. This creates an inverse piezoelectric effect, causing deformation
of the crystal. The change of the resonant frequency of the crystal is attributed to a change in
mass on the electrode surface (Bard & Faulkner, 2001). For gas-phase measurement, the
relationship between the frequency change ( ) and mass change ( ) of the crystal is
expressed by the Sauerbrey equation (Sauerbrey, 1959):
(
) 3.1
Page 28
15
where A is the electrode area, is the resonant frequency and is the sensitivity factor for the
crystal. More recently the sensor has evolved to be able to measure mass in liquid media as well.
For liquid-phase measurement, a most commonly used model was by Kanazawa and Gordon
(1985) as follows (Vogt et al., 2004):
√
√
3.2
where is the thickness of the quartz crystal, is the density of the quartz, is the resonance
frequency of the unloaded resonator, and , , and are density, magnitude of the complex
viscosity, and relative phase angle of the liquid medium, respectively. The combination of
equations 3.1 and 3.2 can describe the behavior of biological applications in liquid media. While
rapid and easy to use, the QCM biosensor still lacks the sensitivity needed to be considered an
effective detection method for avian influenza virus.
QCM biosensors have been well studied for the detection of bacteria, viruses, cells,
proteins and nucleic acids. Other techniques are often coupled with QCM to increase the
performance and capability of the biosensor. Liu et al. (2007) used the QCM to detect E. coli
O157:H7 at 102 cfu/ml while also comparing different nanobead sizes for amplification.
Magnetic separation in combination with the QCM has shown to be effective in demonstrating
the feasibility of QCM as an on-line detection technique (Tsai et al., 2008).
There have been a few previous studies using the QCM to rapidly detect AIV. Perduru
Hewa et al. (2009) were able to use the QCM to detect influenza virus in nasal washings with a
lower detection limit of 104
plaque forming units/ml (pfu/ml). With the addition of gold
nanoparticles they were able to further reduce the detection limit down to 103
pfu/ml which is
Page 29
16
comparable to the sensitivity of viral isolation techniques. However, this was only able to detect
influenza A virus with no subtype information. Li et al. (2011) was able to successfully detect
H5N1 using antibodies and nanobead amplification down to 1 HAU with a detection time of 2 h.
Owen et al. (2007) used aerosolized influenza virus with the QCM and successfully detected
down to 4 virus particles/ml in a gas media. Most recently, Wang & Li (2013) developed a
hydrogel based QCM aptasensor to greatly reduce their detection limit down to 0.0128 HAU.
Improvements can still be made not only in the sensitivity and specificity of these tests but in the
detection time and simplicity of the tests as well. Traditionally the QCM immunosensors have
been developed for bacteria and virus detection but the emergence of aptamers has led to more
alternatives in QCM biosensor research.
3.3.4 Aptamers
The ability to create recognition molecules with specific properties is ideal for use in
biosensor research. Because of this much time and effort has been put in to the molecular
engineering of oligonucleotides due to their ease of design. This can be done with extreme
accuracy, thus there is little or no batch to batch variation in their production (Sefah et al., 2009).
Therefore, aptamers can offer a strong and reliable alternative as a biological element in many
biosensing applications. Aptamers are artificially created single-stranded oligonucleotides that
have the ability to bind to targets such as amino acids, drugs, proteins, cells, and viruses with
high affinity and specificity (Jayasena, 1999). They are selected through an in vitro process from
random oligonucleotide pools called Systematic Evolution of Ligands by EXponential
enrichment (SELEX). Simply put, this involves the combination of an oligonucleotide library
with the target molecule. After washing, the bound sequences are amplified by PCR and the
process is repeated again until the pool is enriched with oligonucleotide strands that are specific
Page 30
17
to only the target (Tuerk & Gold, 1990; Ellington & Szostak, 1990). This allows aptamers to be
generated against a wide variety of targets and this list will continue to grow as technology and
research expands. Aptamers show a very high affinity to their targets, comparable to those of
monoclonal antibodies (Jenison et al., 1994). Aptamers can provide a number of advantages over
antibodies, namely the ease at which they are designed and modified, higher thermal stability, no
batch to batch variation and a much longer shelf life (Sefah et al., 2009). In addition, the small
size and uniformity of aptamers is especially important for the QCM as it allows the captured
mass to be closer to the electrode surface, providing lower noise and higher repeatability.
These great properties of aptamers have allowed them to be implemented in many
different fields of, such as bio-technology, medicine, pharmacology, cell biology, microbiology,
and analytical chemistry to name a few (Mascini, 2009). They have also been considered by
researchers to improve the sensitivity and specificity of QCM biosensors. Bai et al. (2012) used
an aptamer based SPR biosensor for the detection of AIV H5N1 and successfully detected down
to 0.128 HAU. As previously mentioned, Wang and Li (2013) developed a hydrogel based QCM
aptasensor for the detection of AIV H5N1. Cui et al. (2011) was able to use aptamers specifically
as a labeling technique for quantum dots against Influenza A particles.
3.3.5 Electrode Modification in QCM Biosensors
Because the QCM relies on detecting changes in mass by the capturing of targets by a
recognition molecule, it is important that the recognition elements are not only securely
immobilized on the electrode but properly arranged to have the highest possibly capture
efficiency as well. To do this it is necessary to choose an immobilization method that preserves
the aptamer affinity, controls their orientation and minimizes their interference with the
Page 31
18
capturing of the target. For aptamers there are only two main immobilization techniques. Self-
assembled monolayers (SAMs) can be created by submersing the electrode in a thiol buffer
solution. After rinsing, the addition of aptamers with an amine group attached will then become
immobilized on the surface. Aptamers can also be immobilized on the gold surface through
biocoating. Avidin (or one of its derivatives) can easily coat the gold electrode surface through
physisorption. Biotin conjugated aptamers are then immobilized on the electrode through the
biotin-avidin conjugation (Balamurugan et al., 2007). Because SAMs are time consuming and
potentially less effective, the biocoating technique seems more efficient.
3.3.6 Magnetic Nanoparticles
Magnetic nanoparticles are defined as a paramagnetic material with at least one
dimension ranging in the size of 1-100 nm. Magnetic nanobeads are widely used for biosensors
not only for signal amplification but separation as well due to their strong magnetic properties
and low toxicity (Hewa et al., 2009; Li et al, 2011; Lum et al., 2012). Magnetic nanobeads have
several advantages in biosensing applications over the previously used microbeads. They have a
larger surface/volume ratio allowing for faster movement and high target molecule binding rate
(Hsing et al., 2006).
Page 32
19
Chapter 4 Materials and Methods
Page 33
20
4.1 Materials
4.1.1 Biological and Chemical Reagents
Phosphate buffered saline (PBS, 10X) was purchased from Sigma-Aldrich (St. Louis,
MO) and diluted with Milli-Q (Mill-Q, Bedford, MA) water to 10 mM (pH 7.4) for use in all
tests. Poly (ethylene glycol) methyl ether thiol (PEG) was purchased from Sigma-Aldrich (St.
Louis, MO). PEG was dissolved in 10 mM PBS to a concentration of 0.1 mg/ml and prepared
fresh for each test. Bovine serum albumin (BSA) from Sigma–Aldrich (St. Louis, MO, USA)
was prepared in PBS (1.0%, w/v) as an alternative blocking solution. Streptavidin was purchased
from Rockland Inc. (Gilbertsville, PA). It was reconstituted in 10 mM PBS and stored in 1
mg/ml aliquots at -20 °C. The streptavidin was diluted to 0.25 mg/ml for use in tests. All water
used in tests was obtained from a Millipore water purification system (Mill-Q, Bedford, MA).
4.1.2 Virus and Aptamers
Inactivated avian influenza A/H5N1 virus was obtained from the USDA/National
Veterinary Services Laboratory in Ames, Iowa. The virus was inactivated by the USDA lab
using β-propiolactone. The H5N1 virus used in the tests was isolated from chickens in Scotland
in 1959. The stock concentration of the virus was 128 Hemagluttination unit/50 µl (HAU). All
dilutions were done using PBS. Killed AIV H7N2, H9N2, H5N9, H5N2, and H5N3 were
obtained from Animal Diagnostic Laboratory at Penn State University, University Park, PA.
Subtypes were picked for overlapping antigenic properties with AIV H5N1.
The H5N1 aptamer was previously developed in our laboratory through the SELEX
method (Wang & Li, 2013), and the sequence is as follows:
Page 34
21
5’-GTGTGCATGGATAGCACGTAACGGTGTAGTAGATACGTGCGGGTAGGAAGAAAG
GGAAATAGTTGTCCTGTTG-3’
Figure 4.1- H5N1 aptamer secondary structure (from Wang & Li, 2013)
The aptamer was synthesized and biotin labeled by Integrated DNA Technologies (Coralville,
IA). The aptamer was aliquoted and stored at -20 °C. The aliquots were diluted using PBS to a
working concentration of 0.023 mg/ml (1 µM).
4.1.3 Instruments and Electrodes
Figure 4.2 shows the general aptasensor set up. All measurements were taken with the
QCA 922 Quartz Crystal Analyzer from Princeton Applied Research (Oak Ridge, TN) with the
WinEchem software used to collect and plot the data. The leads of the QCM were connected to
the electrode and frequency and resistance measurements were taken at 1 s intervals. All
measurements were done in PBS at room temperature.
Page 35
22
Figure 4.2 - Schematic of the aptasensor. The biological sensing element is immobilized
on the electrode surface. The quartz in the electrode acts as a transducer, converting the mass
change to a frequency signal. The QCM processes and records all of the data.
AT-cut quartz crystals (13.7 mm diameter) were obtained from International Crystal
Manufacturing (Oklahoma City, OK). The crystals had a resonant frequency of 7.995 MHz, and
its surface was polished with gold (5.1 mm diameter).
A flow cell from International Crystal Manufacturing (Oklahoma City, OK) was used for
mounting the crystal electrode and holding the testing sample. The two flow cell pieces were
screwed together to hold the electrode in place and was sealed with two O-rings. A 70 µl
chamber was located above the polished gold surface for the injection of the testing samples.
(a) (b) (c)
Figure 4.3- Instruments and electrodes. (a) QCA 922 quartz crystal analyzer. (b) 8 MHz AT-cut
quartz crystal electrode. (c) 70 µl acrylic flow cell.
Page 36
23
4.2 Detection of AIV H5N1
4.2.1 Pretreatment of Electrodes
The crystal’s electrodes were first cleaned by immersing them in 1 M NaOH for 20 min.
Then a freshly prepared piranha solution (1:3 H2O2:H2SO4) was dropped on the gold surface for
1 min. Special care was taken to keep this solution away from the electrode leads. The electrodes
were washed with deionized water and dried in a stream of nitrogen after each pretreatment. The
crystal was then ready for installation into the flow cell.
4.2.2 Preparation of 150 nm Magnetic Nanobeads
MagCellect Streptavidin Ferrofluid nanobeads with a diameter of 150 nm were obtained
from R&D systems (Minneapolis, MN) and used at stock concentration. The MagCellect
Streptavidin Ferrofluid was a colloid of magnetic nanoparticles conjugated to streptavidin in
solution containing Bovine Serum Albumin (BSA) and preservatives.
A 20 µl streptavidin coated nanobead solution was mixed with 200 µl of PBS and then a
magnetic field at 0.8 T was applied for 2 min using a magnetic separator (AIBIT LLC., Jiangyin,
China). The nanobeads were then resuspended in 100 µl of aptamers and 100 µl of PBS. The
solution was rotated at 15 rpm for 30 min. Next, the nanobeads were suspended in 100 µl of PBS
and 100 µl of biotin solution and rotated again for 10 min. After each step the magnetic
separation and washing was repeated, resuspending the nanobeads in 200 µl of PBS.
Page 37
24
Figure 4.4- Functionalization of streptavidin coated 150 nm magnetic nanobeads with
biotinylated aptamer against H5N1
4.2.3 Detection of AIV H5N1
A schematic of the electrode pretreatment and aptamer immobilization is shown in figure
4.5 a, b, and c. PBS solution was first injected into the flow cell to provide a baseline
measurement. Streptavidin (0.25 mg/ml) was then added to the flow cell for 30 min and allowed
to bind to the electrode surface through protein adsorption. Biotin labeled H5N1 aptamer (1 µM)
was injected into the flow cell and allowed to incubate for 15 min. Next, poly(ethylene glycol)
methyl ether thiol (0.1 mg/ml) was added for 1 h to prevent any nonspecific binding to the
Page 38
25
electrode surface. Before the use of PEG, BSA was tested as a blocking agent. 1% BSA was
injected and allowed to incubate for 20 min. Inactivated AIV H5N1 with titers in the range of
0.01-4 HAU/50 µl in PBS were added to the flow cell for capturing by the aptamer immobilized
on the surface of QCM sensor and allowed to incubate for 30 min (figure 4.5 d). All uses of
HAU refer to HAU/50 µl. Next, the aptamer coated nanobeads were injected into the flow cell
for 30 min to allow binding to the captured virus (figure 4.5 e).
(a)
(b)
(c)
Page 39
26
(d)
(e)
Figure 4.5- The electrode modification, virus detection and signal amplification of the
aptasensor. a) Streptavidin adsorption; b) aptamer immobilization by streptavidin binding; c)
PEG blocking of unbound sites; d) capturing of target H5N1 virus; e) amplification by nanobead
labeling.
4.2.4 Specificity Tests
Specificity tests were conducted using inactivated AIV H7N2, H9N2, H5N9, H5N2, and
H5N3 subtypes at 2 HAU. These were chosen because of their overlapping antigenic properties
with H5N1. Triplicate tests were run at this concentration to determine the aptasensor's
sensitivity and specificity to non-target viruses.
4.2.5 Data Analysis
Page 40
27
The mean and standard deviation of frequency changes were calculated and plotted using
Microsoft Excel. The threshold for positive detection or lower detection limit was set as
signal/noise ratio of 3 where the noise is defined as the standard deviation of the control sample.
JMP was used for all statistical analysis. Analysis of variance (ANOVA) was used to calculate
the P values of each of the treatments comparing the frequency changes before and after
nanobead amplification.
4.3 Calculation of Captured Virus
Using our measured frequency values along with the equations suggested in the literature
review the approximate number of target virus particles captured by the aptasensor could be
calculated. Equation 3.2 reflects the changes made to the frequency due to a liquid solution being
present. Because we focused on the change in frequency before and after the addition of AIV
H5N1, the liquid portion of the equation could be cancelled out due to both measurements being
taken in a PBS solution. Thus, equation 3.1 was used to calculate the number of virus particles
captured based on the measured frequency changes for each titer. Assuming an average size of
80 nm and a density of 1.1 g/cm3 (Kahler & Lloyd, 1951) the calculated change in mass could be
converted to an actual number of virus particles captured.
The values and units for each term in equation 3.1 are as follows: = measured value
(Hz), = 2.3x10⁻⁶
(cm2/g∙Hz), = 8 (MHz), = mass of virus captured (g), = .196 (cm
2).
The number of virus particles captured was estimated by using the equation:
4.1
where is the number of virus particles, is the density of the virus in g/cm3, and V is the
volume of one virus particle in cm3.
Page 41
28
Chapter 5 Results and Discussion
Page 42
29
5.1 Fabrication and Characterization of the QCM Aptasensor
As shown in Figure 4.5, the experiments were conducted by following the stepwise
fabrication and detection of the QCM biosensor, including target binding and signal
amplification. Initial tests were run with no blocking agent prior to the addition of H5N1 virus
and magnetic nanobeads. Negative control tests showed a significant amount of non-specific
binding of the virus and nanobeads to the gold surface in the absence of aptamers. The first
solution was to use Bovine Serum Albumin (BSA) to block the remaining free gold surface from
any non-specific binding. However, this was found to also inhibit the capturing of the target
virus by the aptamer, most likely due to the large size of BSA (≈12 nm) relative to the aptamer
size (≈3 nm). Poly(ethylene glycol) methyl ether thiol (PEG) was then used due to its small size
and strong blocking capabilities. PEG proved to be very effective for not only preventing non-
specific binding to the gold surface but also not interfering with the aptamer’s ability to capture
the target virus. Figure 5.1 shows a comparison of the two blocking agents. BSA blocking
actually caused a decrease in mass after the addition of AIV H5N1 virus at 4 HAU, most likely
due to the BSA being washed away easily from the shear stress of the fluid flow. PEG clearly
allows the aptamer to still capture the target virus. The target H5N1 virus was then added to the
flow cell and would bind to the immobilized aptamer. Lastly, 150 nm magnetic nanobeads
modified with the H5N1 aptamer were used as biolabels for further amplifying the mass of the
virus particles. Each of these steps caused a decrease in the resonant frequency of the electrode
due to an increase in mass. The net response from each step is determined by the difference in
the corresponding PBS baselines.
Page 43
30
Figure 5.1- Frequency shifts of the QCM aptasensor comparing BSA and PEG blocking
agents for AIV H5N1.
Figure 5.2 shows a typical sensorgram of virus detection with the aptasensor. The
adsorption of streptavidin to the gold surface along with the immobilization of the aptamer were
both verified in real time by the decreases in frequency, 77 Hz and 46 Hz respectively. PEG
required a long binding time of 1 h in order to completely block the remaining electrode surface
and further decreased the frequency by 2 Hz. Following the blocking step, the target virus was
captured by the aptamer and caused a 44 Hz decrease in frequency. Lastly, nanobead
amplification further increased the frequency change by 10 Hz by binding to the H5N1 virus.
Each step was followed by a PBS washing step to wash away any unbound materials and to
create a stable baseline prior to the next injection.
0
20
40
60
80
100
120
BSA PEG
-∆F
(H
z)
Blocking Agent
Block
Block+
Virus
Page 44
31
Figure 5.2- Typical sensorgram of the QCM aptasensor for surface modification, aptamer
immobilization, target AIV detection and signal amplification with nanobeads. The concentration
of AIV H5N1 was 1 HA in this test.
5.2 Detection of AIV H5N1
The total detection time for the detection of virus and amplification with nanobeads is 1 h
for this sensor. The detection signal was the change in frequency of the PBS baselines due to the
addition of the virus and nanobeads and the results can be seen in figure 5.3. The threshold for
positive detection was set as 3 x noise (addition of nanobeads with no virus present). The
detection limit of this sensor was determined to be 1 HAU. Using the same calculation method,
the detection limit of the biosensor was also 1 HAU for H5N1 detection without nanobead
amplification.
7979700
7979750
7979800
7979850
7979900
0 2000 4000 6000 8000 10000 12000
Fre
qu
ency
(H
z)
Time (sec)
Page 45
32
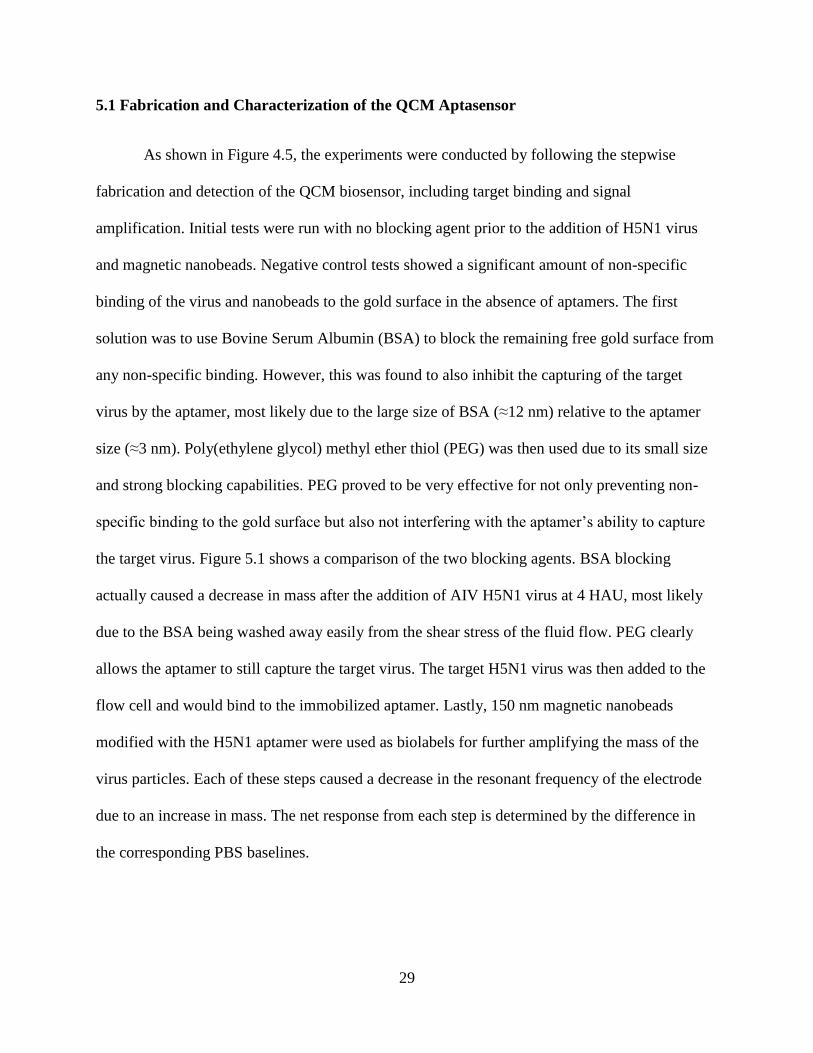
Figure 5.3- Frequency shifts of the QCM aptasensor as a function of the titer (HAU) of AI
H5N1 virus in PBS solution. The detection limit is determined as 1 HAU. Error bars indicate the
standard deviation (n=3).
Table 1 presents the detailed frequency shifts of the QCM aptasensor caused by the
capturing of the target H5N1 virus along with the amplification by 150 nm magnetic nanobeads.
Table 5.1- Frequency values of the QCM aptasensor for each titer (HAU) of AI H5N1 virus in
PBS solution. Error values indicate the standard deviation (n=3).
Frequency Shift (-∆F (Hz) ± S.D.)
Titers of H5N1 Virus (HA unit) Virus Virus+Nanobeads
4 92 ± 24 115 ± 40
2 65 ± 8 75 ± 4
1 72 ± 31 78 ± 26
0.1 7 ± 3 17 ± 9
0.01 1 ± 6 13 ± 18
Control 0 ± 0 9 ± 6
-20
0
20
40
60
80
100
120
140
160
control 0.01 0.1 1 2 4
-∆F
(H
z)
Virus Concentration (HAU)
Virus
Virus+
BeadsLDL
Page 46
33
Table 5.2 shows the calculated virus numbers for each titer. The numbers show that more
virus particles were potentially captured than that was added in to the system. This could
possibly be explained by the presence of other impurities that would settle on the electrode
surface. Also, there might be a small change in the viscoelastic properties of the solution which
would have some effect on the frequency measurements.
Table 5.2- Comparison of calculated virus capture versus the number of virus added.
Titers of H5N1 Virus (HA unit) -∆F (Hz) No. of Virus Captured No. of Virus Added
4 92 4.15E+08 2.00E+08
2 65 2.93E+08 1.00E+08
1 72 3.25E+08 5.00E+07
0.1 7 3.31E+07 5.00E+06
0.01 1 6.02E+06 5.00E+05
JMP was used to perform statistical analysis of the data collected. Table 5.3 compares
each of the treatments (titers) to determine which are significantly different from each other. The
results are pretty expected. The concentrations below the detection limit all came back as not
significantly different from one another because the aptasensor was not sensitive enough to
detect them.
Page 47
34
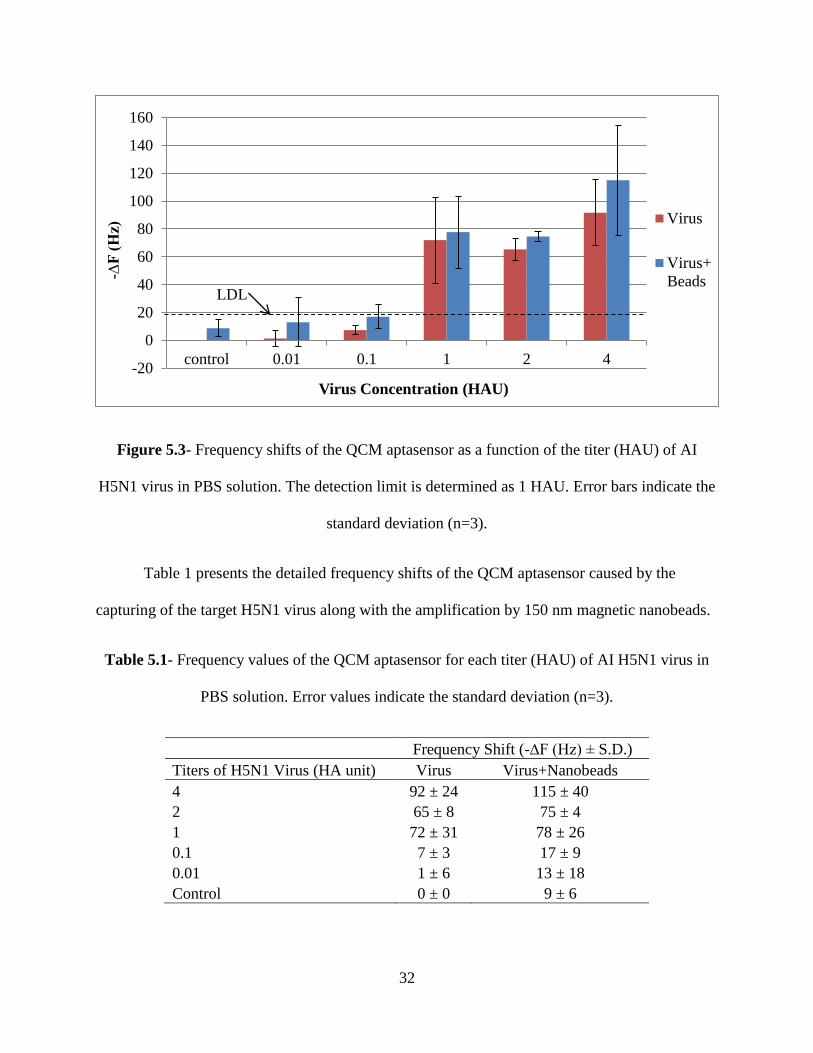
Table 5.3- Comparison of treatment means. Levels not connected by the same letter are not
significantly different.
In addition to comparing treatment values, the means of the virus and virus+beads values
were compared to determine whether the addition of beads was significant in increasing the
sensitivity of the sensor. The P value for each concentration was determined using ANOVA
analysis in JMP. P values greater than our alpha (α=.05) are considered not significantly
different. Table 5.4 shows that the nanobead amplification was insignificant for all
concentrations of virus.
Table 5.4- P values for each H5N1 concentration determining the significance of nanobead
amplification. P values greater than .05 are considered not significantly different.
Concentration P value
4 0.4311
2 0.1444
1 0.8188
0.1 0.1388
0.01 0.3405
control 0.0675
Levels Least Sq Mean
4 A 103.33333
1 B 74.83333
2 B 70.00000
0.1 C 12.16667
0.01 C 7.16667
0 C 4.33333
Page 48
35
Compared to the QCM immunosensor reported by Li et al. (2011), the aptamer seemed to
be much more effective in the capturing virus than the more commonly used antibody. Not only
was the magnitude of the frequency change higher for each respective titer, but the aptamer also
cut the detection time in half compared to antibody tests. Also, the aptamers did not require
chemical immobilization which is time consuming and material intensive. However, the aptamer
coated nanobeads were not as effective as a mass amplifier as hoped. While they did slightly
increase the sensitivity of the biosensor, this was not enough to lower the detection limit from the
pure virus detection limit. It should be noted that as the titer concentration lowered, the bead
amplification became more and more significant. At 0.1 and 0.01 HAU the nanobeads more than
doubled the frequency change due to the capture of AIV H5N1. Unfortunately, this was still
below the lower detection limit of the aptasensor. If the noise level could be lowered by further
reducing nonspecific binding of nanobeads the aptasensor would prove to be even more
sensitive. A possible explanation for the failure of the nanobead amplification could be the non-
rigid structure of the AIV/nanobead complex. The QCM is much more sensitive to rigid
structures compared to elastic ones. Antibodies provide a more rigid structure and can bind to
multiple virus particles as well while aptamers are more flexible and only have one binding site.
While aptamers are still great for very specific virus detection, they are not as strong when it
comes to nanobead amplification because of the elasticity of their structure.
Figure 5.4 shows an SEM image of the top of the QCM electrode surface. The image
confirms the capturing of the target H5N1 virus by the aptamer and also the binding of the 150
nm magnetic nanobead to the virus.
Page 49
36
Figure 5.4- SEM image of the top view of the QCM surface. Confirmation of the binding of a
magnetic nanobead with a 150 nm diameter to a target H5N1 virus (80 nm diameter).
5.3 Specificity of the Aptasensor
The aptasensor was evaluated for specificity with five different subtypes of avian
influenza viruses using the same procedure described previously. These non-target viruses were
chosen due to the similar properties of their HA and NA proteins. Figure 5.5 shows the
frequency change due to the addition of each non-target virus at a concentration of 2 HAU.
While AIV H5N1 made 65 Hz of frequency change, none of the five non-target subtypes caused
more than 8 Hz of frequency change, which is well below the lower detection limit of 18 Hz
frequency change. The results proved a high specificity of the aptasensor to the target AIV
H5N1. One thing of note is that the calculation of the lower detection limit should have been
adjusted for the specificity tests. The original LDL was determined using a negative control with
nanobeads. That should not apply to this case because nanobeads were not used in this part of the
experiment. Therefore, a baseline of PBS should have been measured for 30 min. Taking three
times the standard deviation of the PBS frequency change would give a more accurate
determination of the lower detection limit for the specificity tests.
Page 50
37
Figure 5.5- Frequency shifts of the QCM aptasensor for the target AIV H5N1 virus along with
the five non-target AIV subtypes at 2 HAU. Error bars indicate standard deviation (n=3).
-10
0
10
20
30
40
50
60
70
80
H5N1 H7N2 H9N2 H5N9 H5N2 H5N3
-∆F
(H
z)
Virus Subtype
LDL
Page 51
38
Chapter 6 Conclusions
Page 52
39
A QCM aptasensor was designed and fabricated for rapid detection of avian influenza
virus. Experiments were completed to determine the effectiveness of aptamers as a biological
recognition element as well as magnetic nanobeads as mass amplifiers in order to improve the
sensitivity and specificity of the AIV H5N1 biosensor. The results of this study showed that the
aptamer not only increased the specificity of the aptasensor to the target virus but also reduced
the detection time, compared with the immunosensor developed by Li et al. (2011). A detection
limit of 1 HAU was determined for AIV H5N1. Unfortunately, the nanobead amplification
proved to be insignificant by not amplifying the frequency change enough to lower the detection
limit. If the noise level could be reduced the sensor’s sensitivity could be greatly increased since
the nanobead significantly increased the signal when the concentration of AIV was low. While
the detection limit of this aptasensor was very similar to previous studies (1 HAU), it has the
advantage of being specific to the H5N1 virus rather than just the H5 protein. The aptasensor
was proven to have no non-specific binding to similar non-target AIV subtypes. The detection
time of the aptasensor was also greatly reduced down to 1 h.
Page 53
40
Chapter 7 Recommendations for Future Research
Page 54
41
Further improvements of the biosensor could be accomplished by addressing the issue of
the nanobead amplification. More testing could be done using several types of nanoparticles to
determine which one is the optimal choice for QCM and virus labeling. The colloid beads were
not very effective in binding to the target virus which could have been caused by their random
shape. A more uniform nanobead could be much more effective. Also trying nanowire and
nanotubes along with different sizes of nanobeads could prove to be beneficial in determining the
best amplification agent.
Page 55
42
References
Amano, Y., & Cheng, Q. (2005). Detection of influenza virus: Traditional approaches and
development of biosensors. Anal. Bioanal. Chem. 381(1), 156-164.
Bai, H., Wang, R., Hargis, B., Lu, H., & Li, Y. (2012). A SPR aptasensor for detection of avian
influenza virus H5N1. Sensors 12(9), 12506-12518.
Balamurugan, S., Obubuafo, A., Soper, S. A., & Spivak, D. A. (2007). Surface immobilization
methods for aptamer diagnostic applications. Anal. Bioanal. Chem. 390(1), 1009-1021.
Bard, A. J., & Faulkner, L.R. (2001). Electrochemical Methods: Fundamentals and Applications.
2nd Edition. John Wiley & Sons. New York.
Boyce, W. M., Sandrock, C., Kreuder-Johnson, C., Kelly, T., & Cardona, C. (2009). Avian
influenza viruses in wild birds: A moving target. Comp. Immunol. Microbiol. Infect. Dis.
32(4), 275-286.
Burns, A., van der Mensbrugghe, & D., Timmer, H. (2008). Evaluating the economic
consequences of avian influenza. World Bank report.
http://siteresources.worldbank.org/EXTAVIANFLU/Resources/EvaluatingAHIeconomic
s_2008.pdf. Accessed September 12, 2012.
Chang, Y., Wang, S., Huang, J.C., Su, L., Yao, L., Li, Y. et al. (2010). Detection of swine-origin
influenza A (H1N1) viruses using a localized surface plasmon coupled fluorescence
fiber-optic biosensor. Biosens. Bioelectron. 26(3), 1068-1073.
Charlton, B., Crossley, B., & Hietala, S. (2009). Conventional and future diagnostics for avian
influenza. Comp. Immunol. Microbiol. Infect. Dis. 32(4), 341-350.
Cooper, M. A. (2002). Optical biosensors in drug discovery. Nat. Rev. Drug Discov. 1(7), 515-
528.
Cui, Z., Ren, Q., Wei, H., Chen, Z., Deng, J., et al. (2011). Quantum dot-aptamer nanoprobes for
recognizing and labeling influenza A virus particles. Nanoscale 3(1), 2454-2457.
Davis, F., & Higson, S. P. (2010). Label-free immunochemistry approach to detect and identity
antibiotics in milk. Pediatr. Rev. 67(5), 476-480.
Dawson, E. D., Moore, C. L., Dankbar, D. M., Mehlmann, M., Townsend, M. B., Smagala, J. A.,
et al. (2007). Identification of A/H5N1 influenza viruses using a single gene diagnostic
microarray. Anal. Chem. 79(1), 378-384.
Deisingh, A. K., & Thompson, M. (2004). Biosensors for the detection of bacteria. Can. J.
Microbiol. 50(2), 69-77.
Page 56
43
Ellington, A.D., & Szostak, J.W.. (1990). In vitro selection of RNA molecules that bind specific
ligands. Nature 346(6287), 818-822.
Ellis, J. S., & Zambon, M. C. (2002). Molecular diagnosis of influenza. Rev. Med. Virol. 12(6),
375-389.
Estmer-Nilsson, C., Abbas, S., Bennemo, M., Larsson, A., Hämäläinen, M. D., & Frostell-
Karlsson, Å. (2010). A novel assay for influenza virus quantification using surface
plasmon resonance. Vaccine 28(3), 759-766.
Fang, L. Q., de Vlas, S. J., Liang, S., Looman, C. W., Gong, P., Xu, B., et al. (2008).
Environmental factors contributing to the spread of H5N1 avian influenza in mainland
china. PloS One 3(5), e2268.
Fortineau, N., Trieu-Cuot, P., Gaillot, O., Pellegrini, E., Berche, P., & Gaillard, J. (2000).
Optimization of green fluorescent protein expression vectors for in vitro and in vivo
detection of listeria monocytogenes. Res. Microbiol. 151(5), 353-360.
Grieshaber, D., MacKenzie, R., Vörös, J., & Reimhult, E. (2008). Electrochemical biosensors -
sensor principles and architectures. Sensors 8(3), 1400-1458.
Harder, T.C., & Werner, O. (2006). Avian influenza. Influenza report.
http://www.influenzareport.com/ir/ai.htm. Accessed September 18, 2012.
Hien, N. D., Ha, N. H., Van, N. T., Ha, N. T., Lien, T. T., Thai, N. Q., et al. (2009). Human
infection with highly pathogenic avian influenza virus (H5N1) in northern vietnam, 2004-
2005. Emerg. Infect. Diseases 15(1), 19-23.
Hsing, I., Xu, Y., & Zhao, W. (2007). Micro- and nano- magnetic particles for applications in
biosensing. Electroanal. 19(7-8), 755-768.
Ivnitski, D., Abdel-Hamid, I., Atanasov, P., & Wilkins, E. (1999). Biosensors for detection of
pathogenic bacteria. Biosens. Bioelectron. 14(7), 599-624.
Jayasena, S.D. (1999). Aptamers: An emerging class of molecules that rival antibodies in
diagnostics. Clin. Chem. 45(9), 1628-1650.
Jenison, R.D., Gill, S.C., Pardi A., & Polisky, B. (1994). High-resolution molecular
discrimination by RNA. Science 263(5152), 1425-1429.
Jin, H., Leser, G. P., Zhang, J., & Lamb, R. A. (1997). Influenza virus hemagglutinin and
neuraminidase cytoplasmic tails control particle shape. EMBO J. 16(6), 1236-1247.
Kahler, H., & Lloyd Jr., B.J. (1951). Density of polystrenelatex by a centrifugal method. Science
114(1), 34-35.
Page 57
44
Kamikawa, T. L., Mikolajczyk, M. G., Kennedy, M., Zhang, P., Wang, W., Scott, D. E. et al.
(2012). Nanoparticle-based biosensor for the detection of emerging pandemic influenza
strains. Biosens. Bioelectron. 26(4), 1346-1352.
Kanazawa, K.K., & Gordon, J.G. (1985). The oscillation frequency of a quartz resonator in
contact with liquid. Anal. Chim. Acta 175(1), 99-105.
Koncki, R. (2007). Recent developments in potentiometric biosensors for biomedical analysis.
Anal. Chim. Acta 599(1), 7-15.
Lee, C., & Saif, Y. M. (2009). Avian influenza virus. Comp. Immunol. Microbiol. Infect. Dis.
32(4), 301-310.
Leland, D. S., & Ginocchio, C. C. (2007). Role of cell culture for virus detection in the age of
technology. Clin. Microbiol. Rev. 20(1), 49-78.
Li, D., Wang, J., Wang, R., Li, Y., Abi-Ghanem, D., Berghman, L., Hargis, B. & Lu, H. (2011).
A nanobeads amplified QCM immunosensor for the detection of avian influenza virus
H5N1. Biosens. Bioelectron. 26(1), 4146-4154.
Li, K. S., Guan, Y., Wang, J., Smith, G. J., Xu, K. M., Duan, L., et al. (2004). Genesis of a
highly pathogenic and potentially pandemic H5N1 influenza virus in eastern asia. Nature
430(6996), 209-213.
Liu, F., Li, Y., Su, X., Slavik, M.F., Ying, Y., & Wang, J. (2007). QCM immunosensor with
nanoparticle amplification for detection of Escherichia coli O157:H7. Sens. Instrumen.
Food Qual. 1(1), 161–168.
Lojou, E., & Bianco, P. (2006). Application of the electrochemical concepts and techniques to
amperometric biosensor devices. J. Electroceram. 16(1), 79-91.
Lu, C., & Czanderna, A. W. (1984). Methods and Phenomena 7: Applications of Piezoelectric
Quartz Crystal Micobalance. Volume 7. Elsevier. Amsterdam.
Lum, J., Wang, R., Lassiter, K., Srinivasan, B., Abi-Ghanem, D., Berghman, L. et al. (2012).
Rapid detection of avian influenza H5N1 virus using impedance measurement of
immuno-reaction coupled with RBC amplification. Biosen. Bioelectron. 38(1), 67-73.
Marandi, V. (2010). Assesment of a rapid immunochromatographic assay for the detection of
avian influenza viruses. Int. J. Vet. Res. 4(3), 183-188.
Mascini, M. (2009). Aptamers in Bioanalysis. John Wiley & Sons. Chichester.
Medintz, I. L., Uyeda, H. T., Goldman, E. R., & Mattoussi, H. (2005). Quantum dot
bioconjugates for imaging, labelling and sensing. Nature Mat. 4(6), 435-446.
Page 58
45
Mitnaul, L. J., Matrosovich, M. N., Castrucci, M. R., Tuzikov, A. B., Bovin, N. V., Kobasa, D.,
et al. (2000). Balanced hemagglutinin and neuraminidase activities are critical for
efficient replication of influenza A virus. J. Virol. 74(13), 6015-6020.
Nayak, M., Kotian, A., Marathe, S., & Chakravortty, D. (2009). Detection of microorganisms
using biosensors—A smarter way towards detection techniques. Biosens. Bioelectron.
25(4), 661-667.
Nguyen, T. N., Ung, T. D., Vu, T. H., Tran, T. K., Dong, V. Q., Dinh, D. K. et al. (2012).
Fluorescence biosensor based on CdTe quantum dots for specific detection of H5N1
avian influenza virus. Adv. Nat. Sci: Nanosci. Nanotechnol. 3(035014), 5 pp.
Owen, T.W., Al-Kaysi, R.O., Bardeen, C.J. & Cheng, Q. (2007). Microgravimetric
immunosensor for direct detection of aerosolized influenza A virus particles. Sensors and
Actuators B 126(1), 691-699.
Peduru Hewa, T. M., Tannock, G. A., Mainwaring, D. E., Harrison, S., & Fecondo, J. V. (2009).
The detection of influenza A and B viruses in clinical specimens using a quartz crystal
microbalance. J. Virol. Meth. 162(1-2), 14-21.
Pejcic, B., De Marco, R., & Parkinson, G. (2006). The role of biosensors in the detection of
emerging infectious diseases. Analyst 131(10), 1079-1090.
Phillips, K. S., & Cheng, Q. (2007). Recent advances in surface plasmon resonance based
techniques for bioanalysis. Anal. Bioanal. Chem. 387(5), 1831-1840.
Sauerbrey, G. (1959). Verwendung von schwingquarzen zur wägung dünner schichten und zur
mikorwägung. Zeitschrift für Physik 155(1), 206-222
Sefah, K., Phillips, J.A., Xiong, X., Meng, L., Van Simaeys, D., Chen, H. et al. 2009. Nucleic
acid aptamers for biosensors and bio-analytical applications. Analyst 134(1), 1765-1775.
Steinhauer, D. A. (1999). Role of hemagglutinin cleavage for the pathogenicity of influenza
virus. J. Virol. 258(1), 1-20.
Thorson, A., Petzold, M., Nguyen, T. K., & Ekdahl, K. (2006). Is exposure to sick or dead
poultry associated with flulike illness?: A population-based study from a rural area in
vietnam with outbreaks of highly pathogenic avian influenza. Arch. Intern. Med. 166(1),
119-123.
Tsai, H., Lin, Y., Chang, H. W., & Fuh, C. B. (2008). Integrating the QCM detection with
magnetic separation for on-line analysis. Biosens. Bioelectron. 24(3), 485-488.
Tuerk, C., & Gold, L. (1990). Systematic evolution of ligands by exponential enrichment: RNA
ligands to bacteriophage T4 DNA polymerase. Science 249(4968), 505-510.
Page 59
46
Varshney, M., & Li, Y. (2009). Interdigitated array microelectrodes based impedance biosensors
for detection of bacterial cells. Biosens. Bioelectron. 24(10), 2951-2960.
Vogt, B. D., Lin, E. K., Wu, W., & White, C. C. (2004). Effect of film thickness on the validity
of the sauerbrey equation for hydrated polyelectrolyte films. J. Phys. Chem. B 108(1),
12685-12690.
Wang, J. (2001). Glucose biosensors: 40 years of advances and challenges. Electroanal. 13(12),
983-988.
Wang, J. (2006). Electrochemical biosensors: Towards point-of-care cancer diagnostics. Biosens.
Bioelectron. 21(10), 1887-1892.
Wang, J. (2008). Electrochemical glucose biosensors. Chem. Rev. 108(2), 814-825.
Wang, R., & Li, Y. (2013). Hydrogel based QCM aptasensor for detection of avian influenza
virus,” Biosens. Bioelectron. 42(1), 148-155.
Wang, R., Wang, Y., Lassiter, K., Li, Y., Hargis, B., Tung, S., et al. (2009). Interdigitated array
microelectrode based impedance immunosensor for detection of avian influenza virus
H5N1. Talanta 79(2), 159-164.
WHO. (2013). Cumulative Number of Confirmed Human Cases of Avian Influenza A/(H5N1)
Reported to WHO, 2003-2013.
http://www.who.int/influenza/human_animal_interface/EN_GIP_20130312CumulativeN
umberH5N1cases.pdf. Accessed July 22, 2010.
Xu, J., Suarez, D., & Gottfried, D.S. (2007). Detection of avian influenza virus using an
interferometric biosensor,” Anal. Bioanal. Chem. 389(1), 1193-1199.
Yang, L., & Li, Y. (2006). Detection of viable salmonella using microelectrode-based
capacitance measurement coupled with immunomagnetic separation. J. Microbiol. Meth.
64(1), 9-16.