QconCAT method development and applications in proteomics Thesis submitted in accordance with the requirements of the University of Liverpool for the degree of Master in Philosophy by Victoria Margaret Elizabeth Harman April 2012
Transcript
QconCAT method development and applications in proteomics
Thesis submitted in accordance with the requirements of the University of Liverpool for the degree of Master in Philosophy by
Victoria Margaret Elizabeth Harman
April 2012
Acknowledgements
Acknowledgements
I would like to thank my supervisors, especially Prof. Rob Beynon for giving me the
opportunity to write this thesis and for his invaluable guidance. I would also like to thank the
members of PFG for their help and friendship, especially Philip Brownridge for taking the time
to answer all of my incessant silly questions and Amy Claydon for lending a sympathetic ear
and a hug whenever I needed it.
Finally I’d like to thank my family for always encouraging my continuing education and Ed for
his support and an endless supply of cups of tea!
Contents
Table of Contents
List of Figures i List of Tables ii List of abbreviations ii Abstract iii 1. Introduction 8
1.1 Proteomics 8 1.2 Protein quantification 9 1.3 Mass Spectrometry 11 The mass spectrometer 11 Ionisation 12 The mass analyser 15 1.4 Quantitative techniques utilising mass spectrometry 19 Label-free quantitative strategies 19 Label mediated quantitative strategies 21 1.5 QconCAT technology 27 Selection of peptides 29 Selecting the expression strain 30 The T7 expression system 30 Quantification with QconCAT 32
2. Aims and Objectives 35 3. Materials and Methods 38
3.1 Transformation 39 3.2 Glycerol stocks 39 3.3 Expression via LB IPTG 39 3.4 Expression via minimal media IPTG 40 3.5 Expression via autoinduction – unlabelled and stable isotope labelled cultures 40 3.6 Cell lysis using BugBuster 40 3.7 Cell lysis using sonication 40 3.8 Purification with the NiMAC column method 41 3.9 Preparation of purification fraction samples for SDS-PAGE analysis 41 3.10 Purification with the spin column method 42 3.11 Purification with Protino Ni-TED resin 42 3.12 Solubilisation in RapiGest as an alternative to purification 43 3.13 Protein assay 43 3.14 1D SDS-PAGE gels 43 3.15 Western blotting 43 3.16 In-gel digests 44 3.17 In-solution digests 44
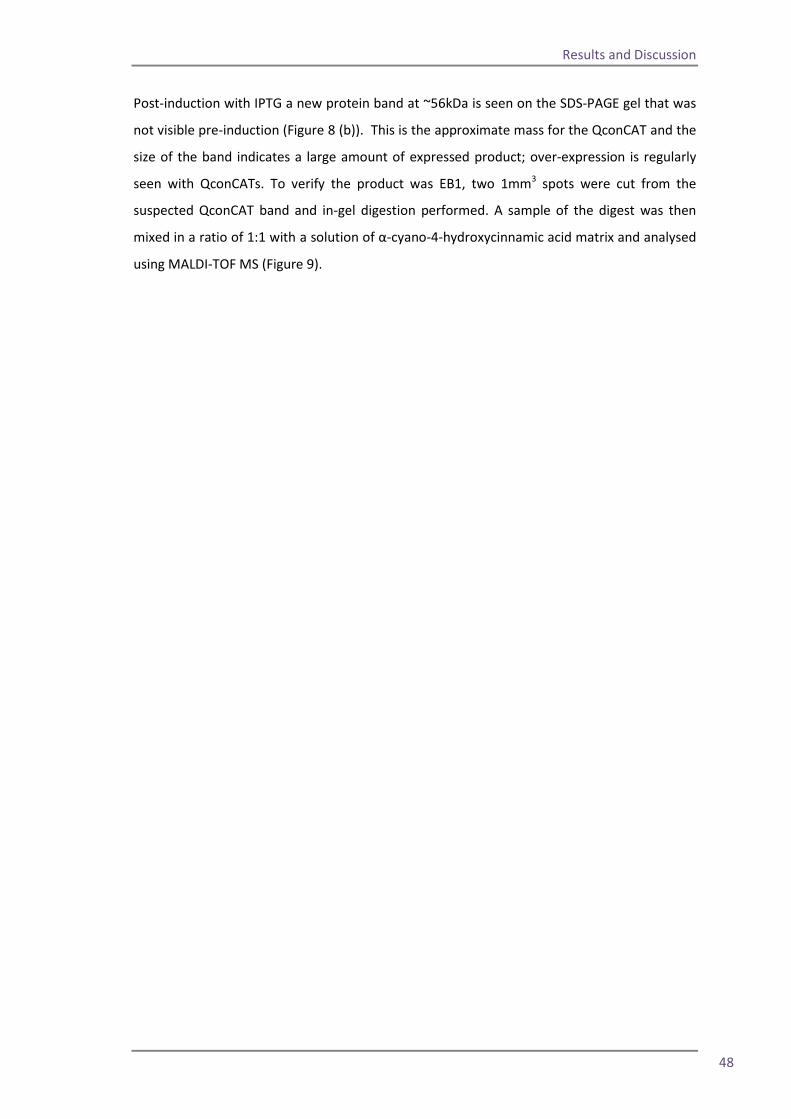
3.18 Preparation for MALDI-TOF analysis of digests 44 4. Results and Discussion 46
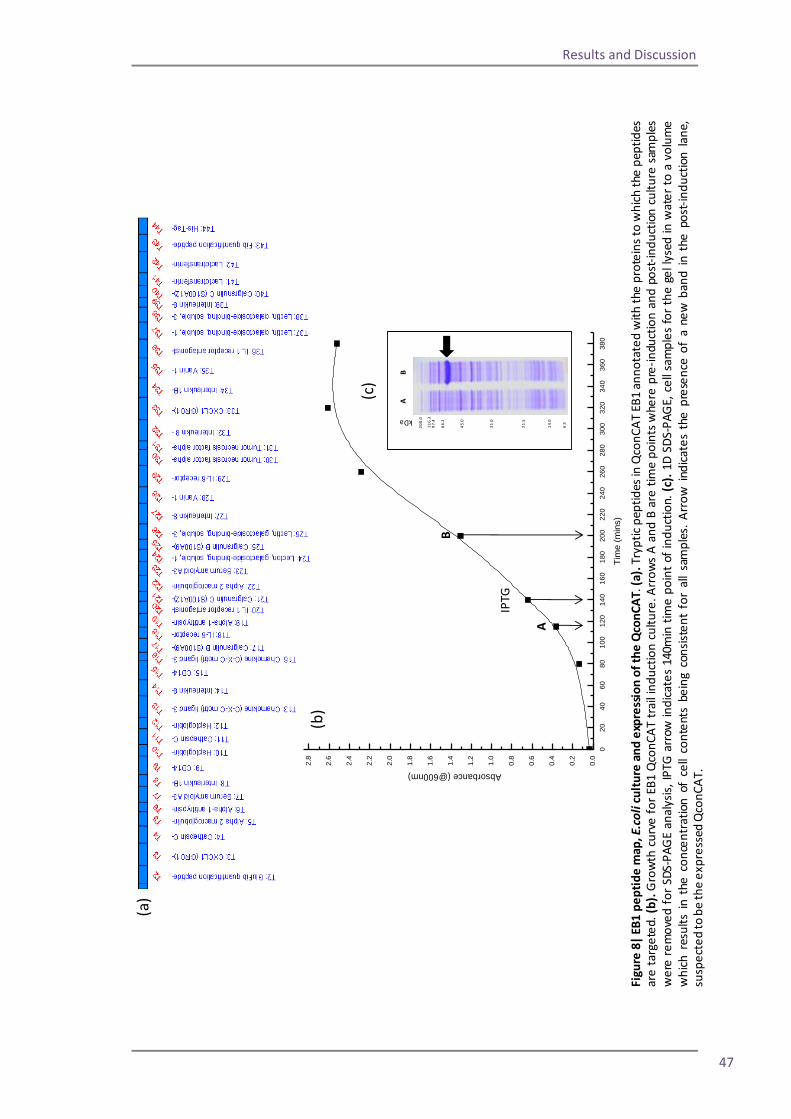
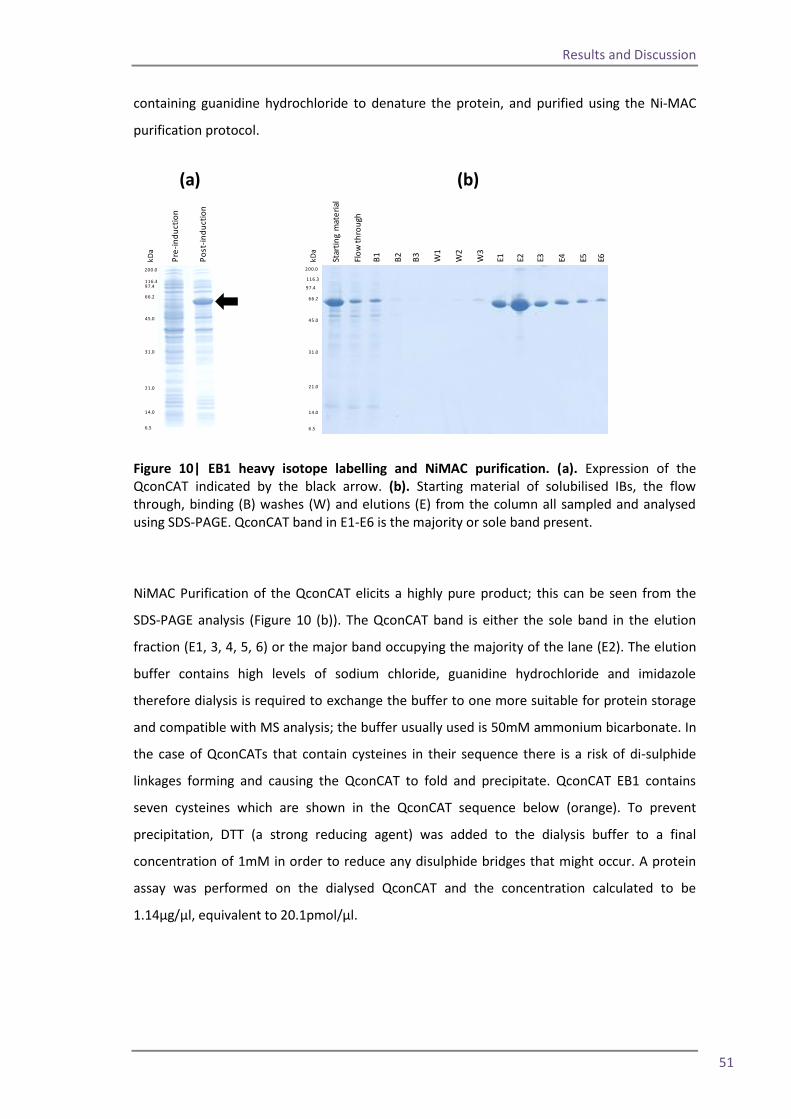
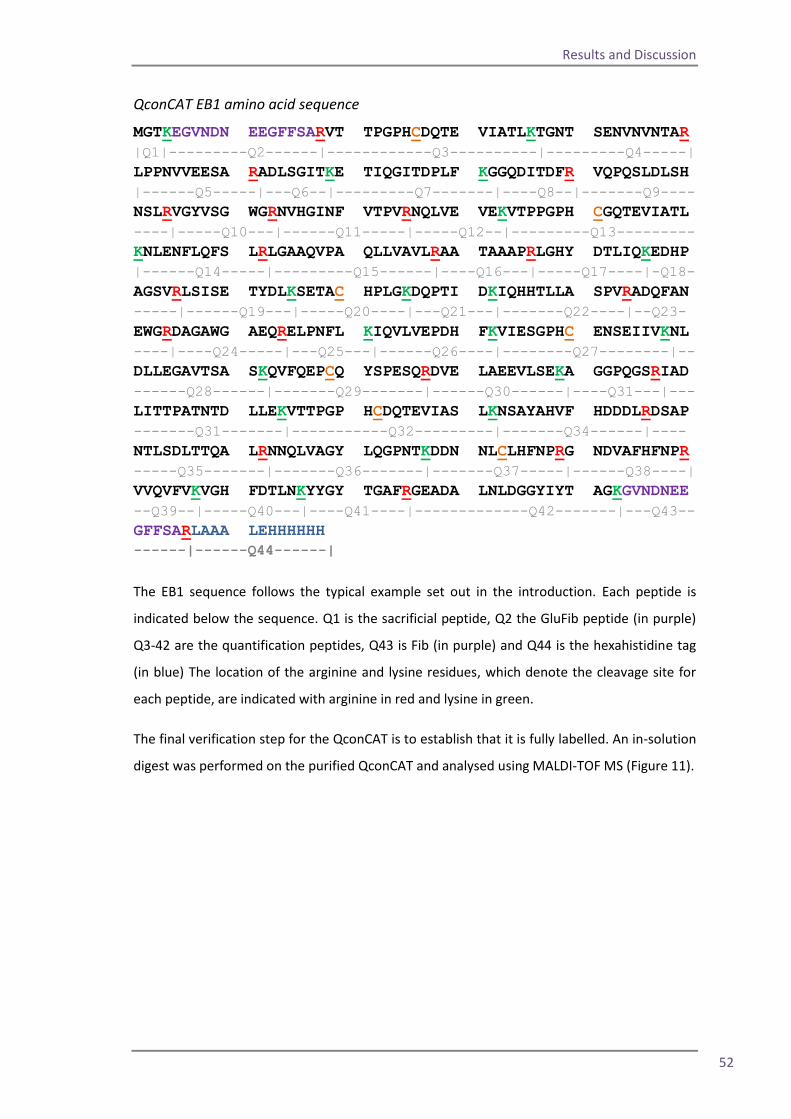
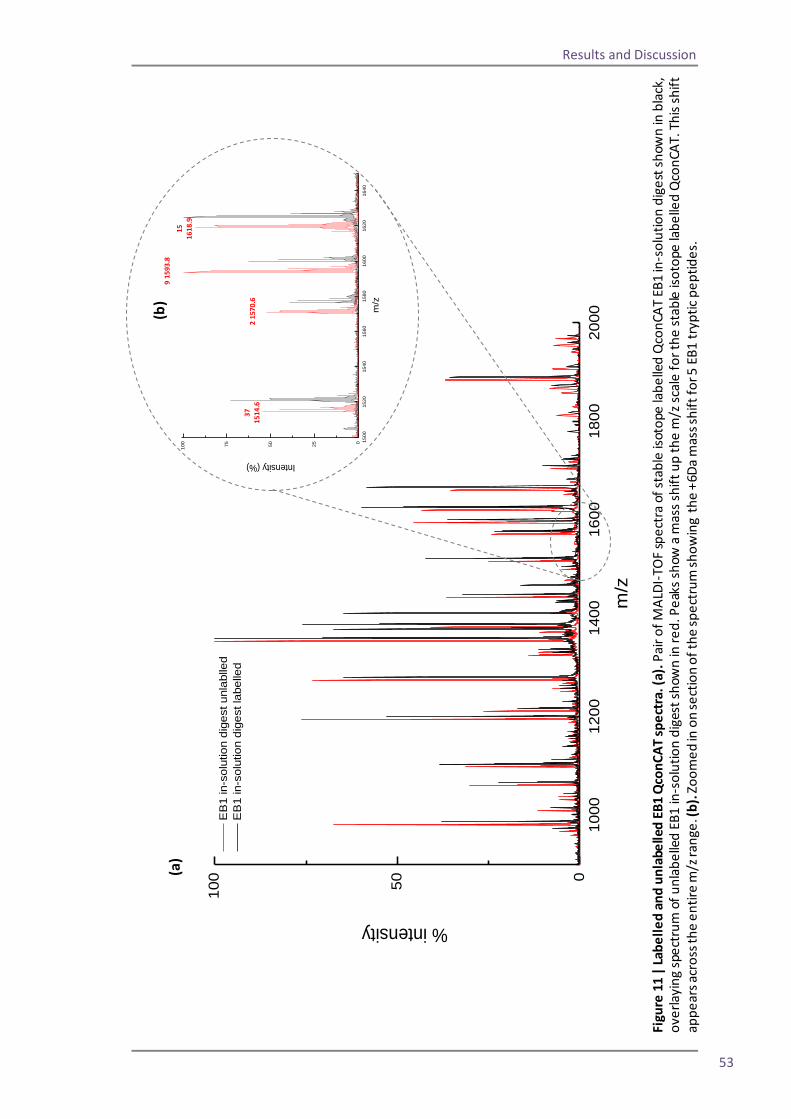
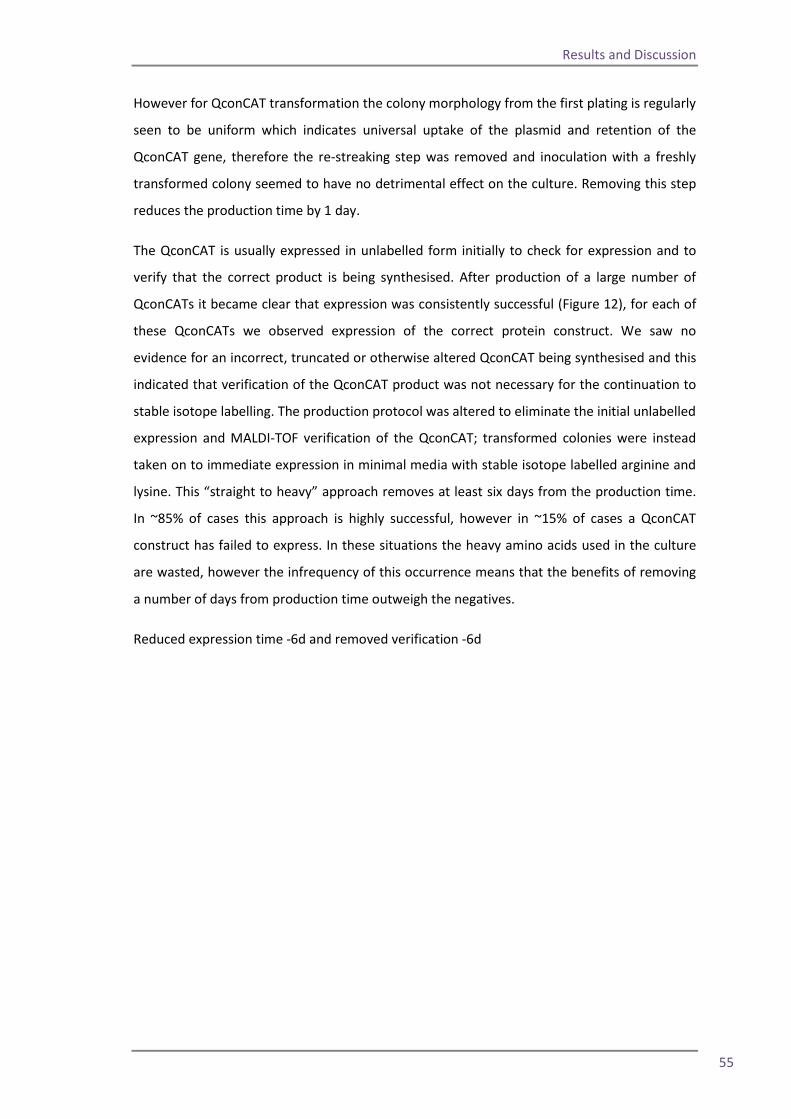
4.1 Production of QconCAT EB1 with the original protocol 46 Section 1: modifying the QconCAT production protocol 54
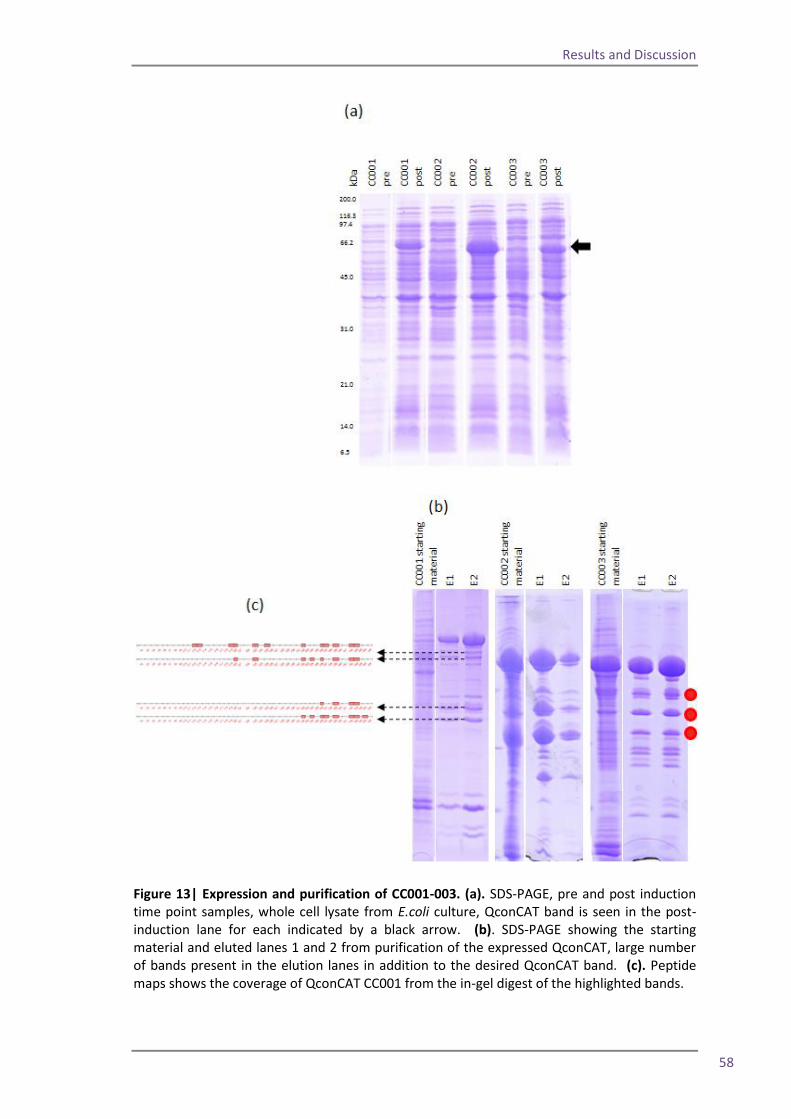
4.2 Reducing expression time 54 4.3 Alterations to the cell lysis protocol 57 4.4 Alternations to the purification protocol 62
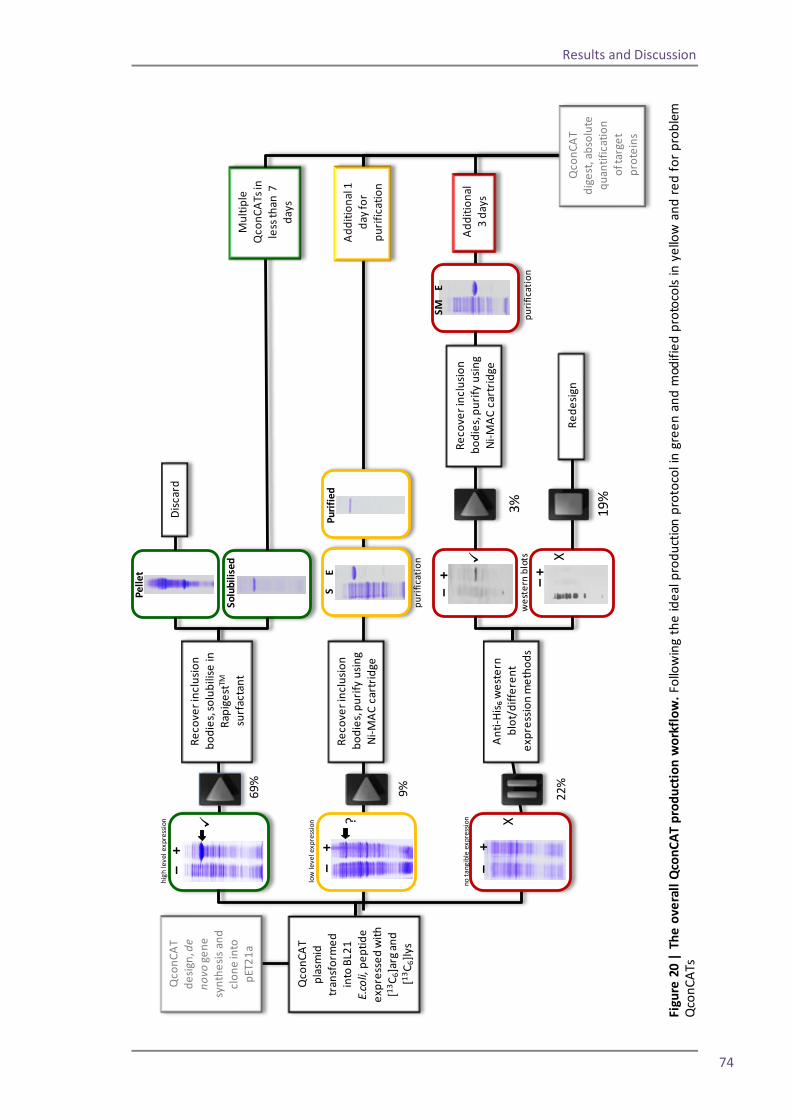
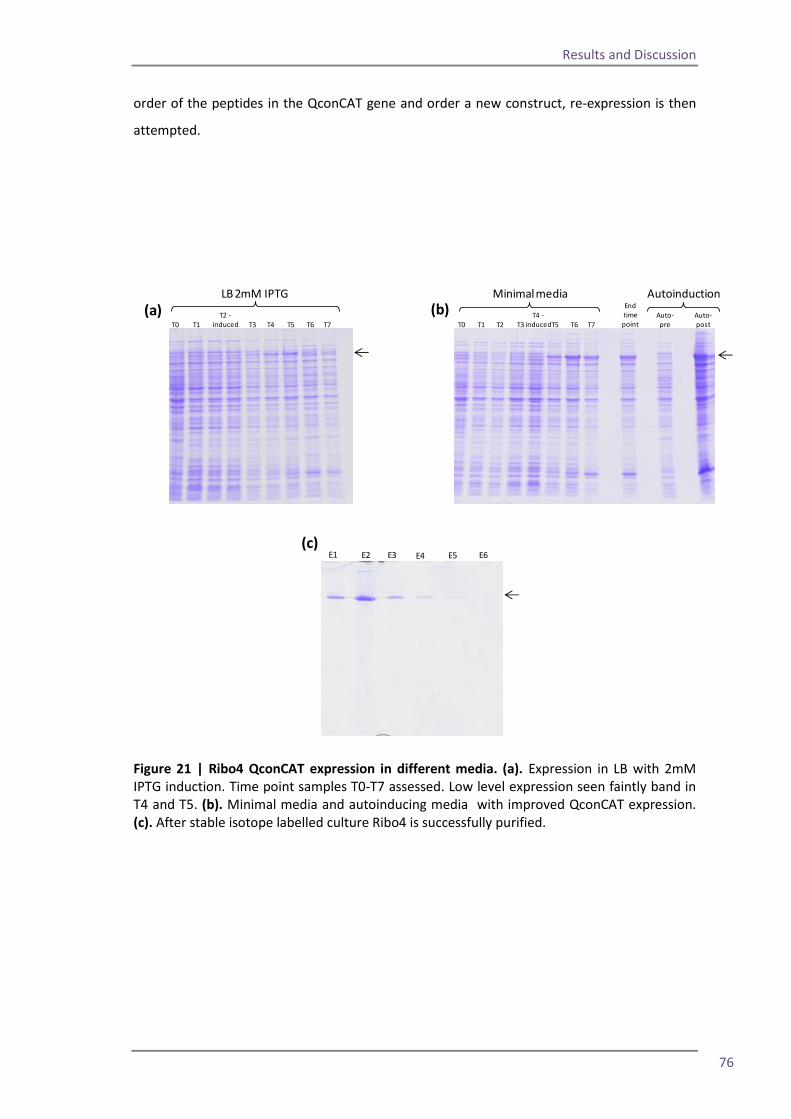
Spin column 63 Flow through study 66 RapiGest solubilisation 69 4.5 The optimised method and troubleshooting 75
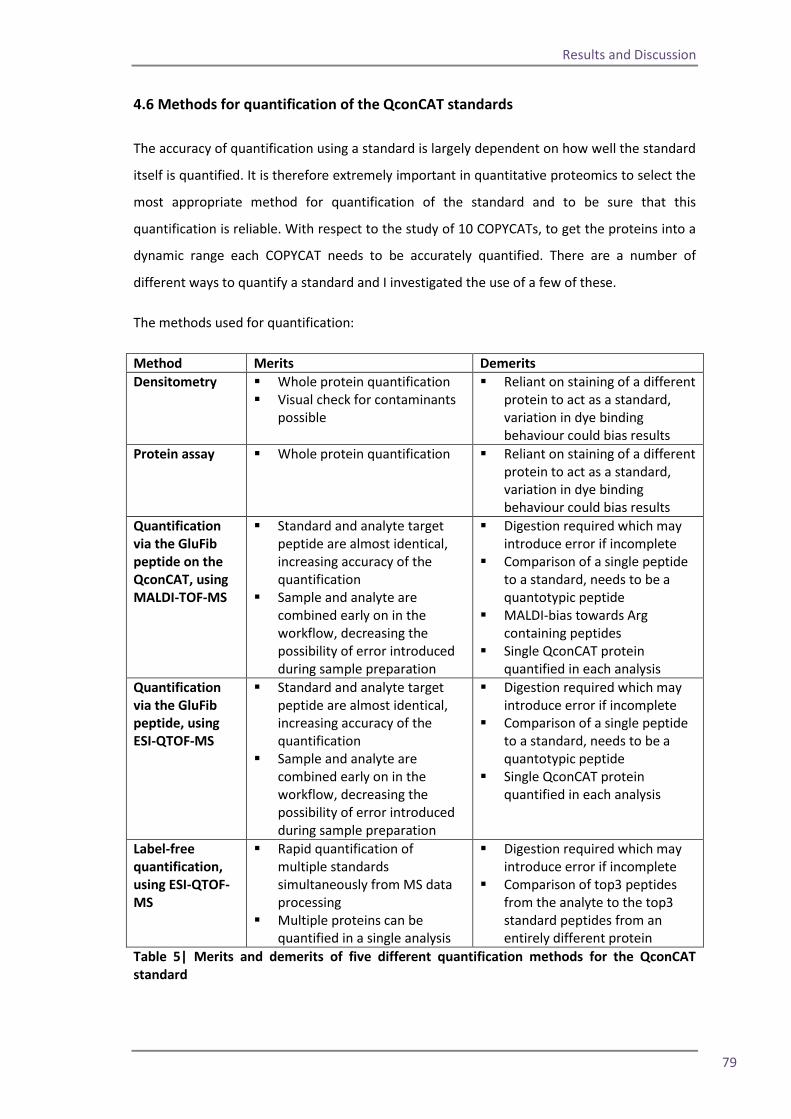
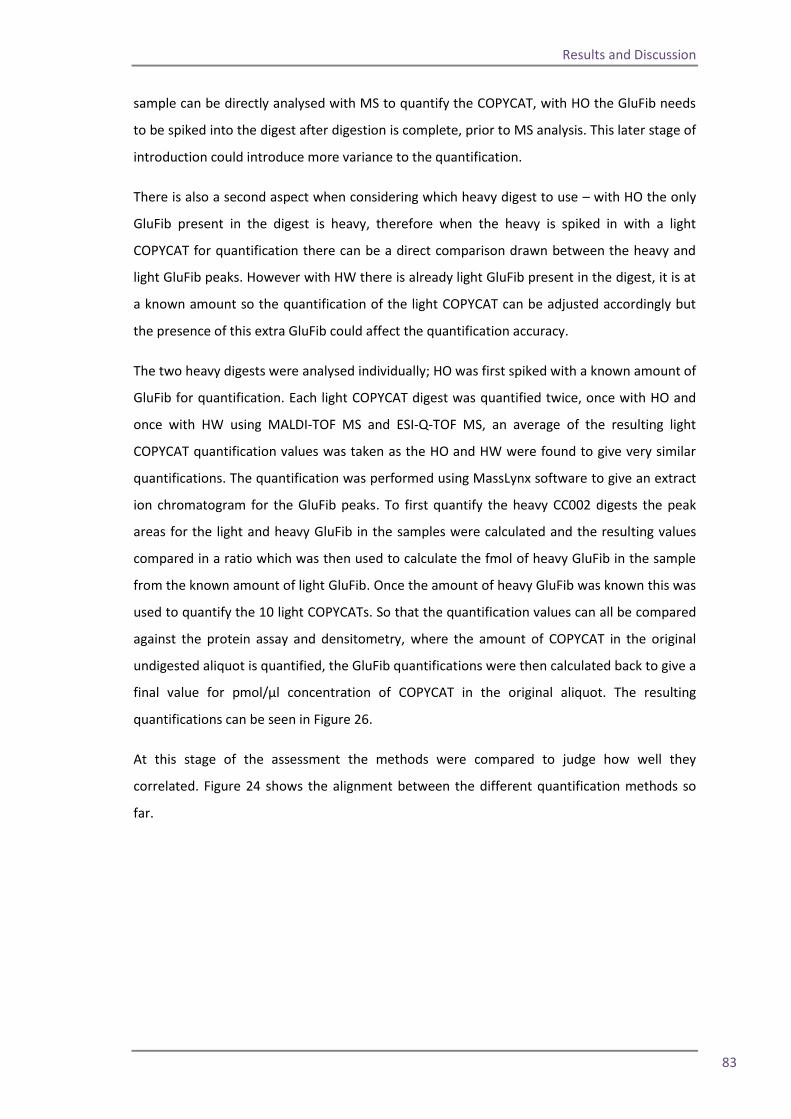
Section 2: QconCAT protein as a quality control standard 77 4.6 Methods for quantification of the QconCAT standards 79 Densitometry 80 Protein assay 82 Quantification using the GluFib peptide 82 Label-free quantification 89 Summary 95 4.7 QconCATs to assess instrument performance 95
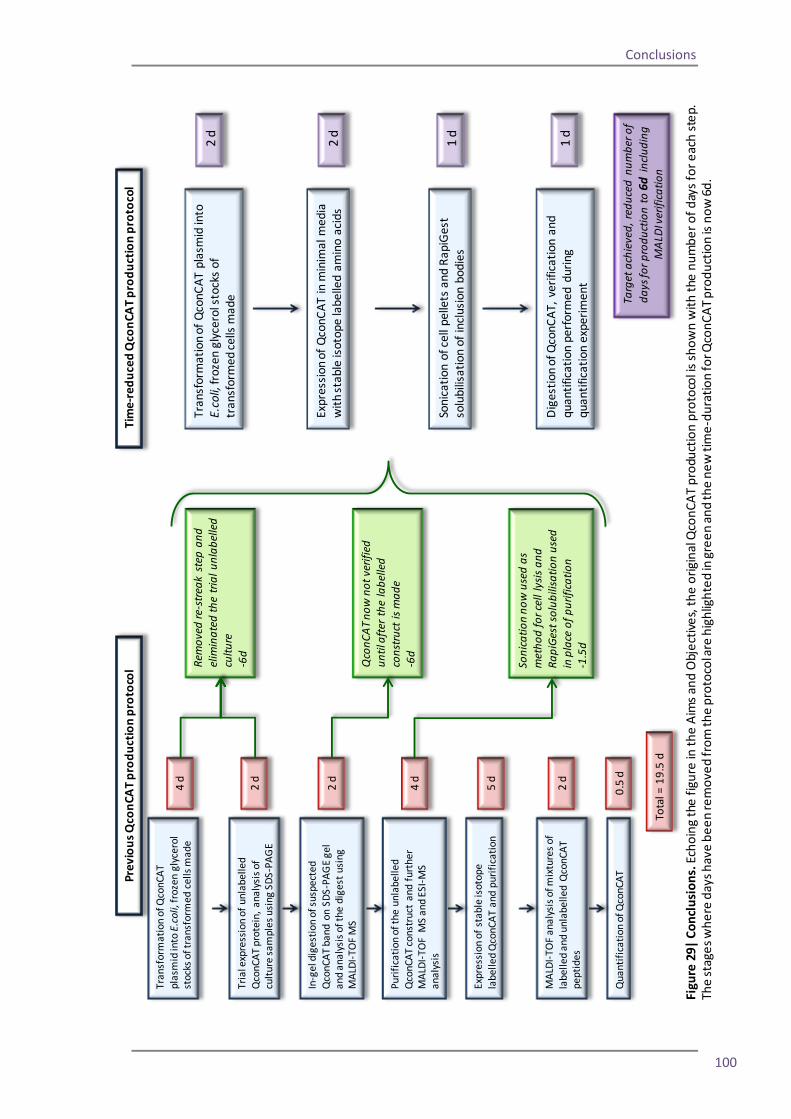
5. Conclusions 98 6. References 102 7. Publications containing work from this thesis 107
Figures
i
List of Figures Introduction Figure 1|MALDI ionisation of peptides 13 Figure 2|ESI ionisation of peptides 14 Figure 3|Schematic of Q-TOF instrument Synapt G2 17 Figure 4|Quantitative methods 20 Figure 5|Stages in the quantitative workflow where samples can be combined 22 Figure 6|QconCAT overview of production and use 28
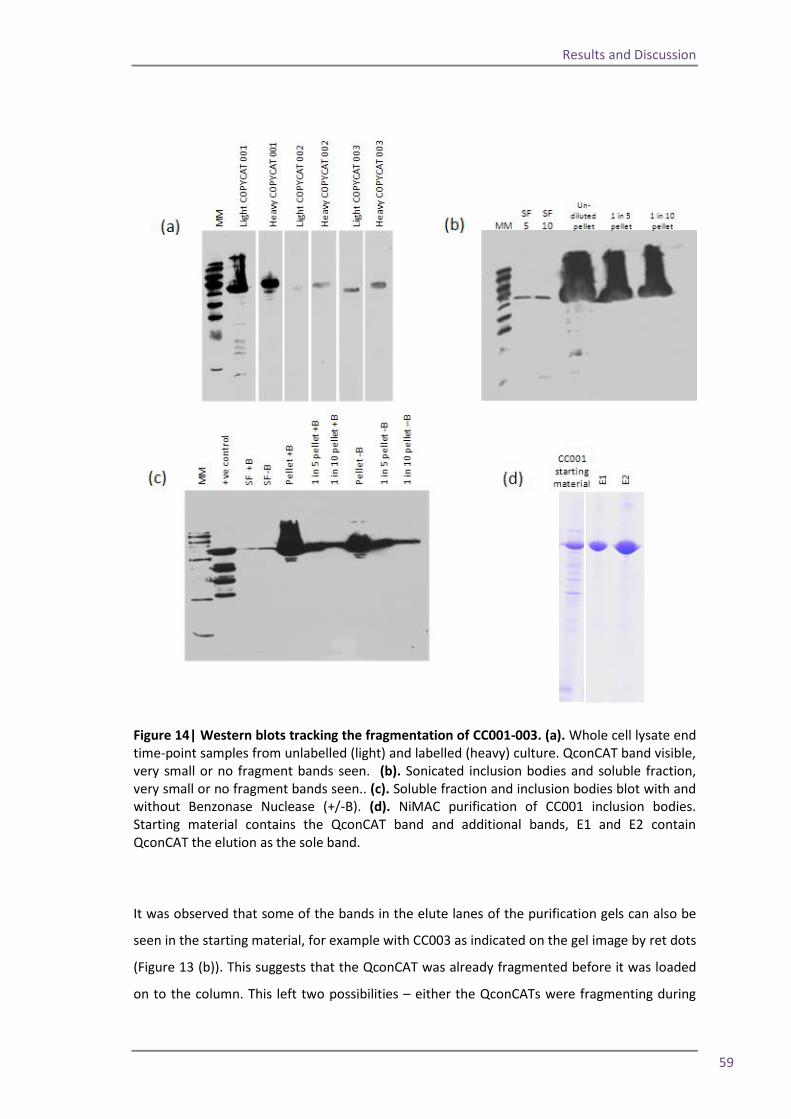
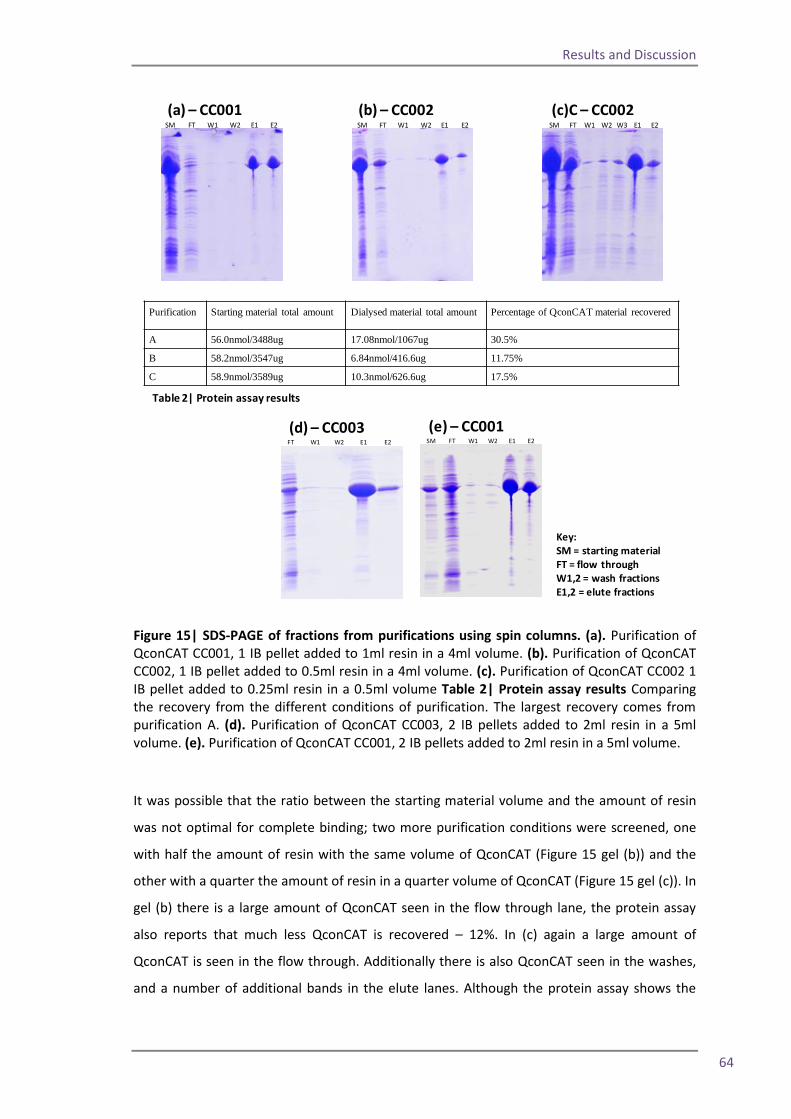
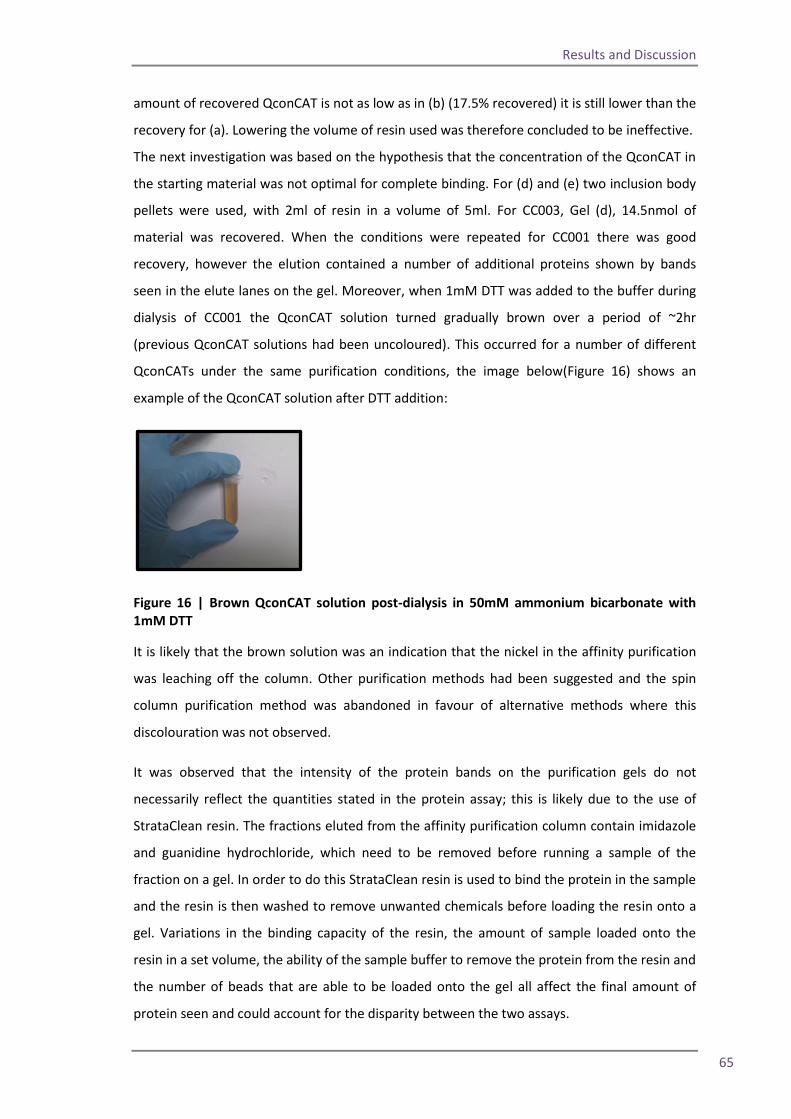
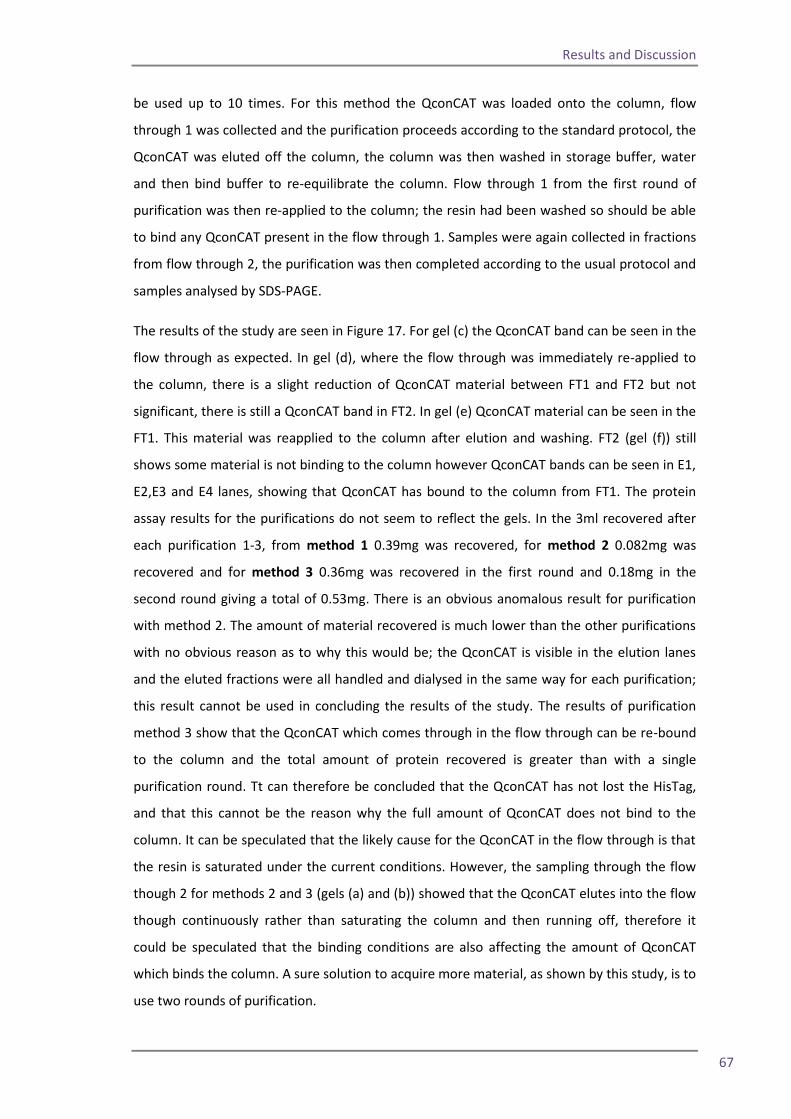
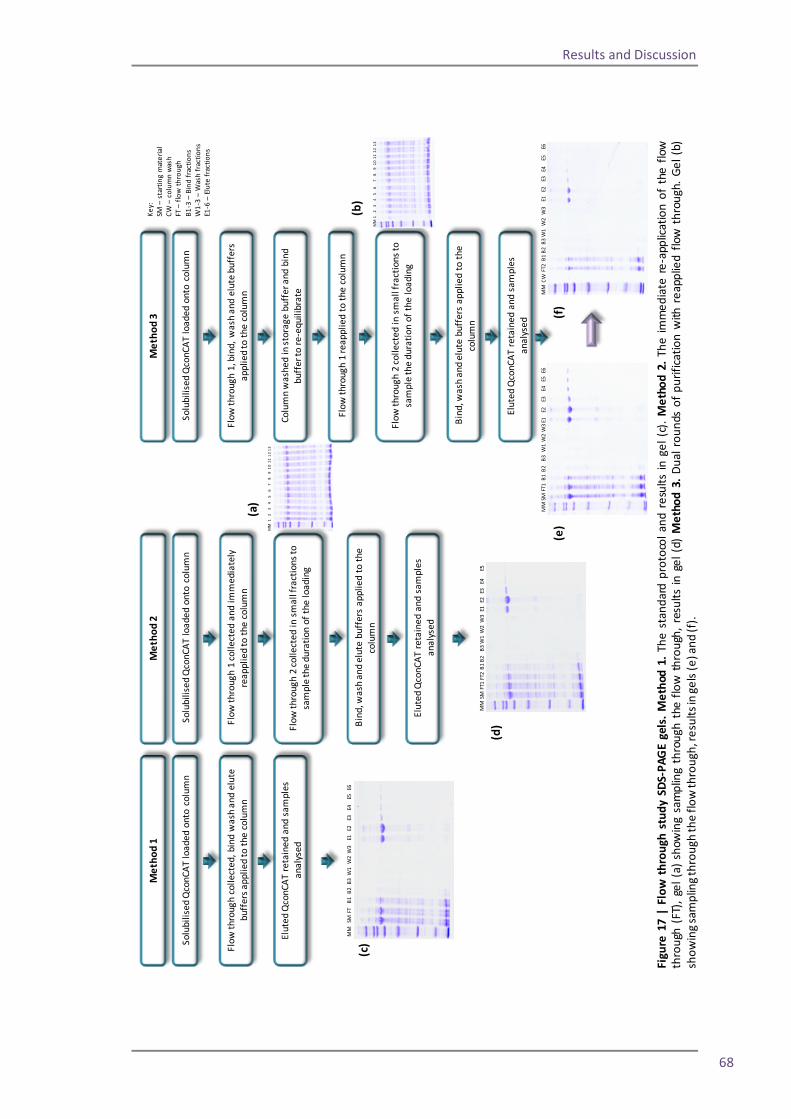
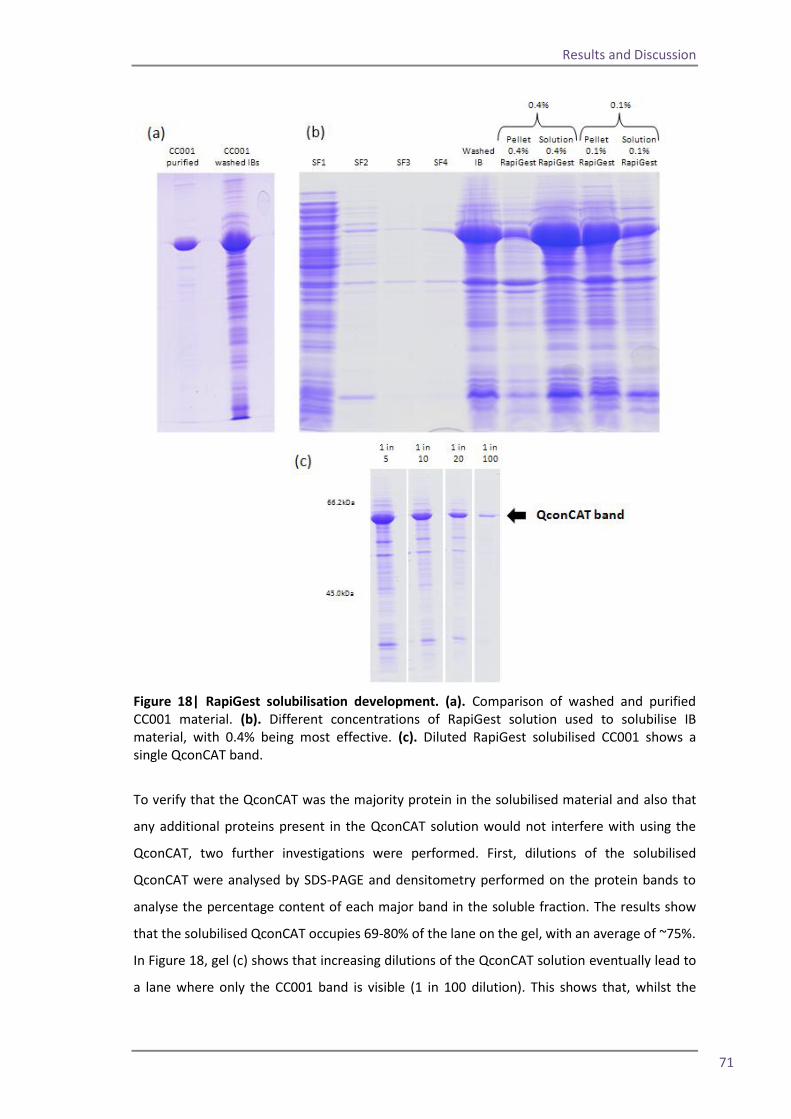
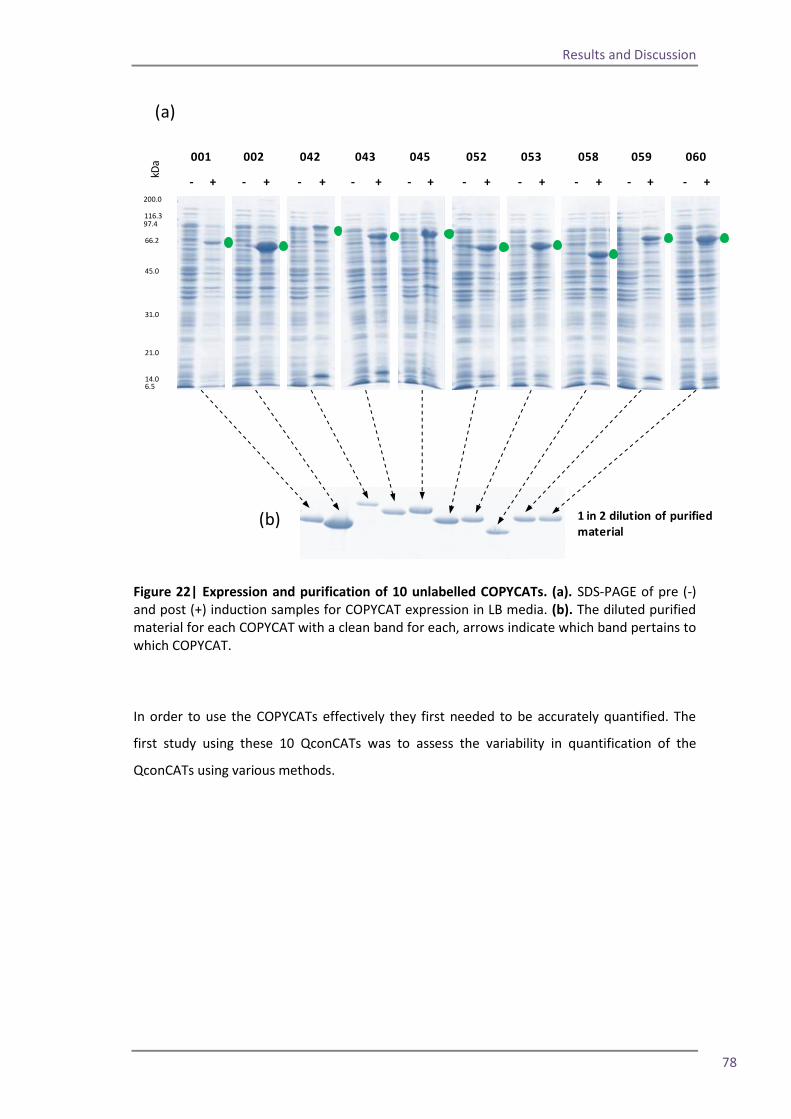
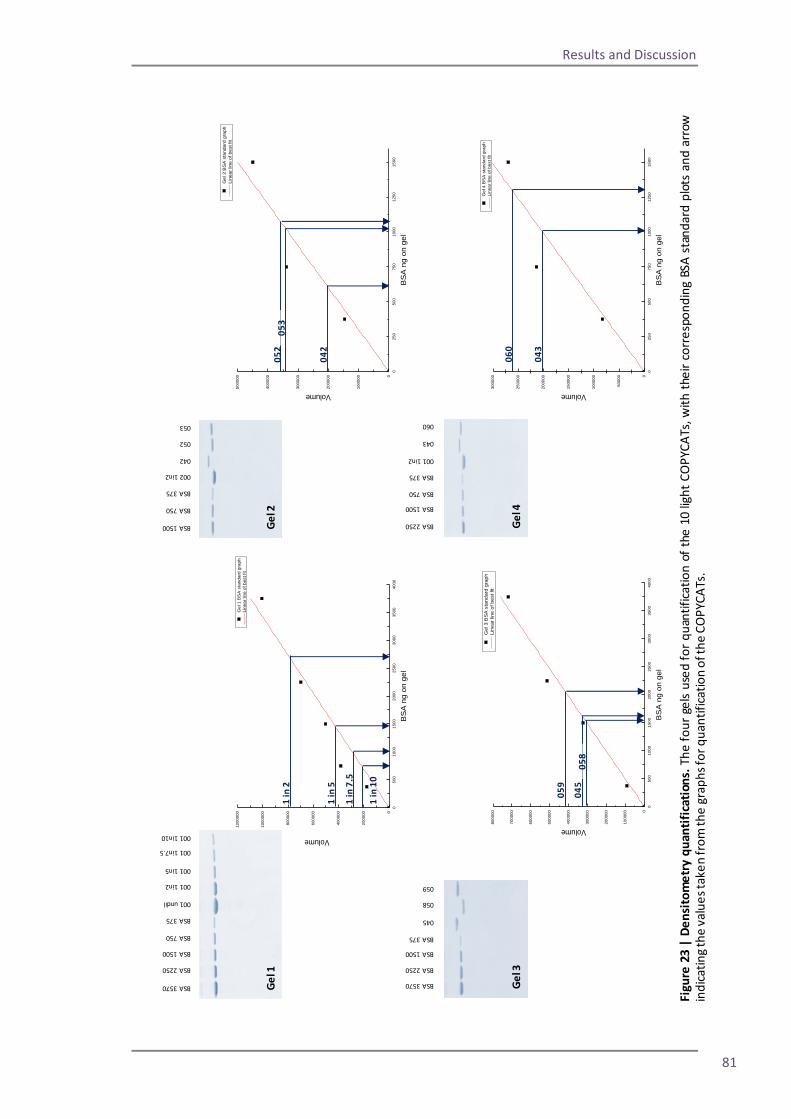
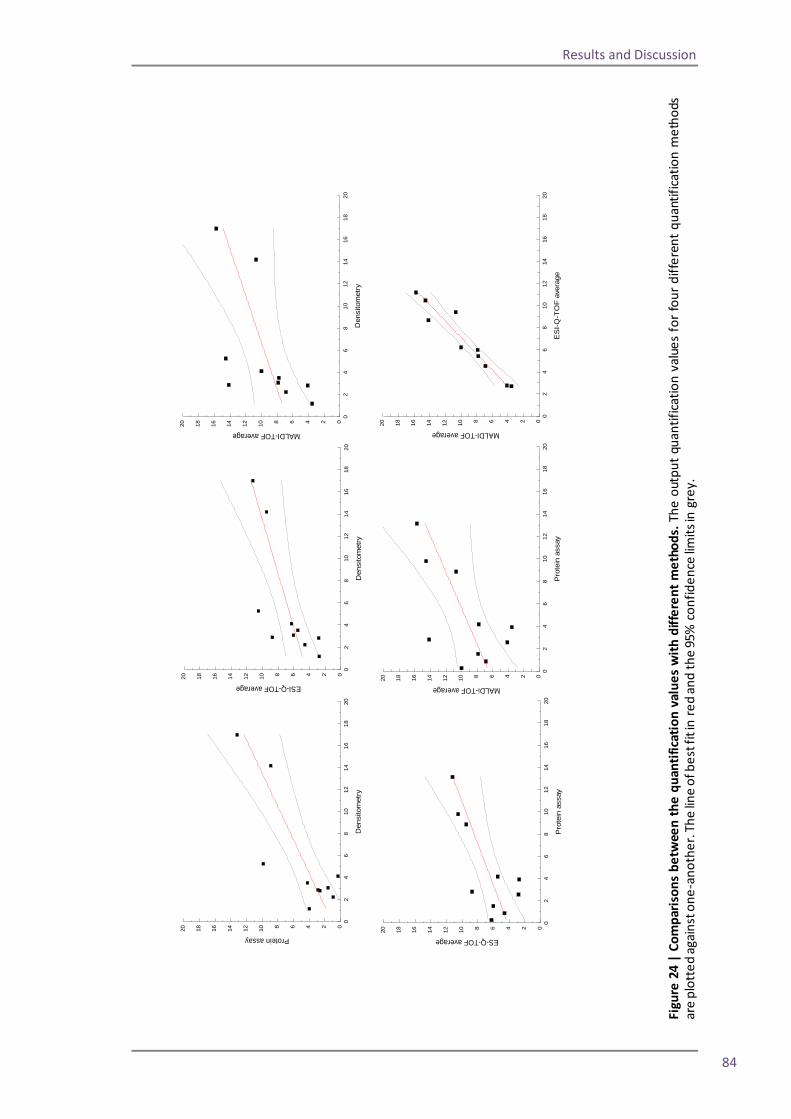
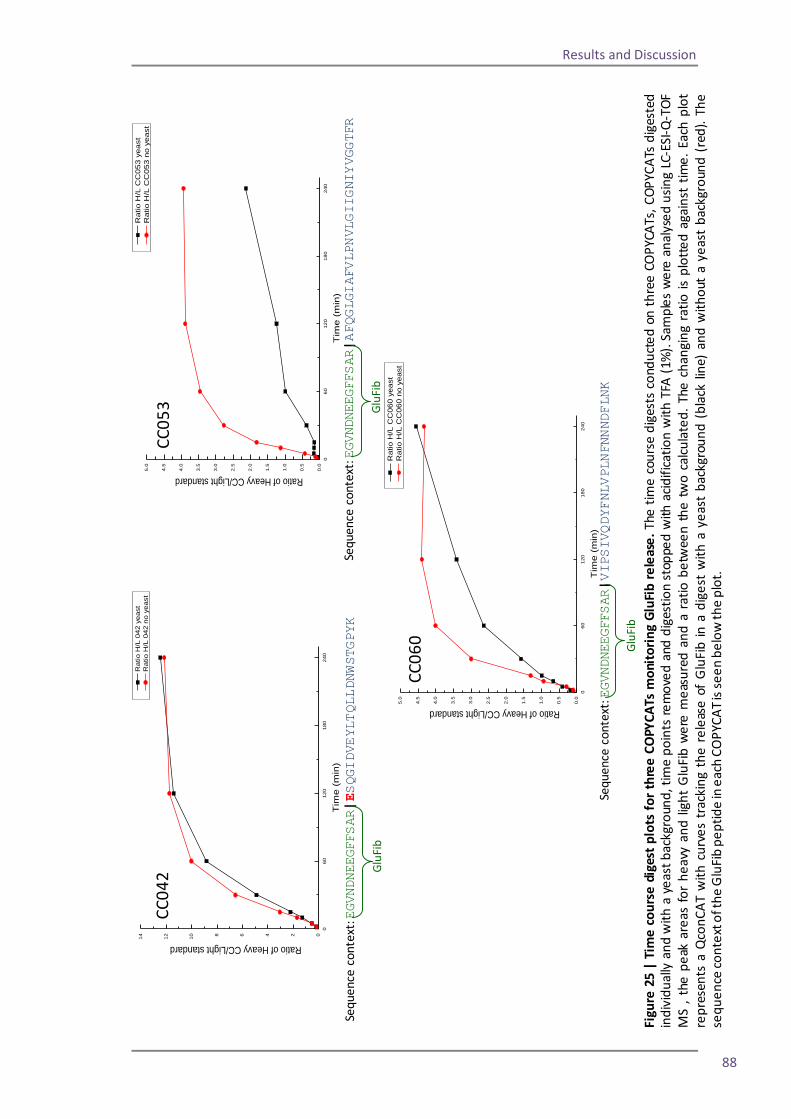
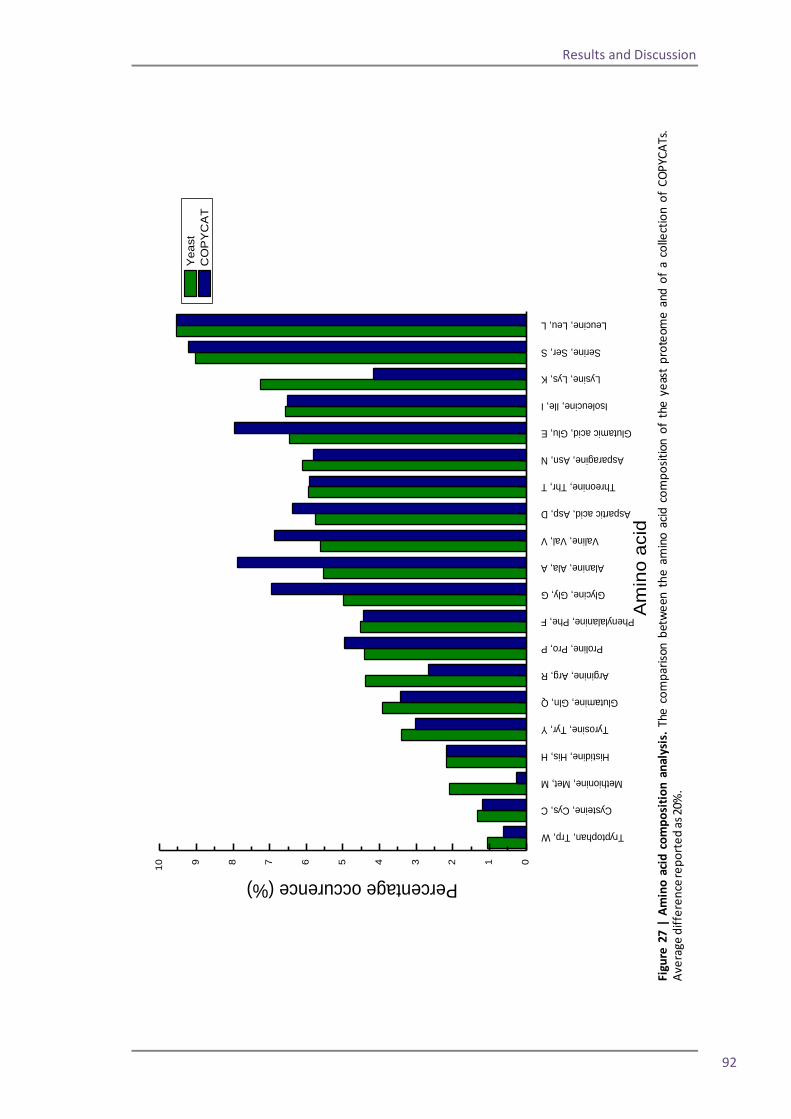
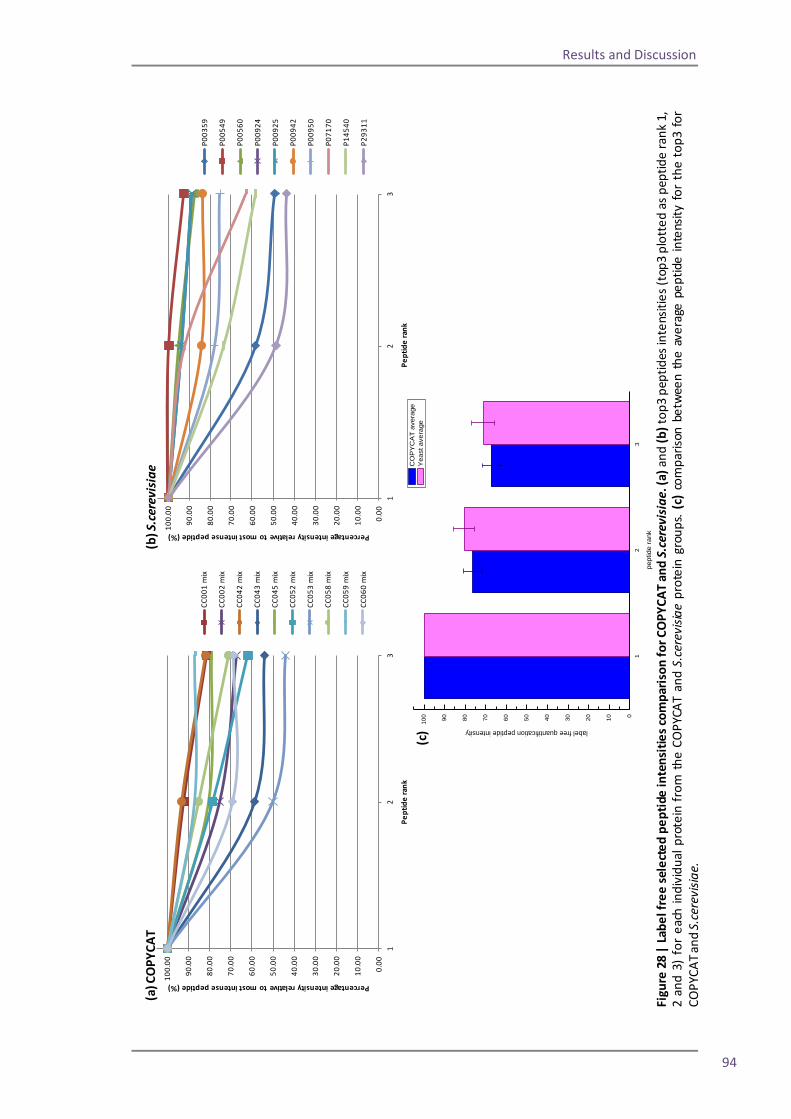
Aims and Objectives Figure 7|Aims and objectives 36 Results and Discussion Figure 8|EB1 peptide map, E.coli culture and expression of the QconCAT 47 Figure 9|In-gel digestion of QconCAT EB1 49 Figure 10|EB1 heavy isotope labelling and NiMAC purification 51 Figure 11|Labelled and unlabelled EB1 QconCAT spectra 53 Figure 12|Consistent successful expression of QconCATs 56 Figure 13|Expression and purification of CC001-003 58 Figure 14|Western blots tracking the fragmentation of CC001-003 59 Figure 15|SDS-PAGE of fractions from purifications using spin columns 64 Figure 16|Brown QconCAT solution post-dialysis in 50mM ammonium bicarbonate with 1mM DTT 65 Figure 17|Flow through study SDS-PAGE gels 68 Figure 18|RapiGest solubilisation development 71 Figure 19|QconCAT selection for purification or RapiGest solubilisation 73 Figure 20|The overall QconCAT production workflow 74 Figure 21|Ribo4 QconCAT expression in different media 76 Figure 22|Expression and purification of 10 unlabelled COPYCATs 78 Figure 23|Densitometry quantifications 81 Figure 24|Comparisons between the quantification values with different methods 84 Figure 25|Time course digest plots for three COPYCATs monitoring GluFib release 88 Figure 26|Quantification values for the 10 COPYCATs 90 Figure 27|Amino acid composition analysis 92 Figure 28|Label free selected peptide intensities comparison for COPYCAT and S.cerevisiae 94 Conclusions Figure 29|Conclusions 100
Abstract
iii
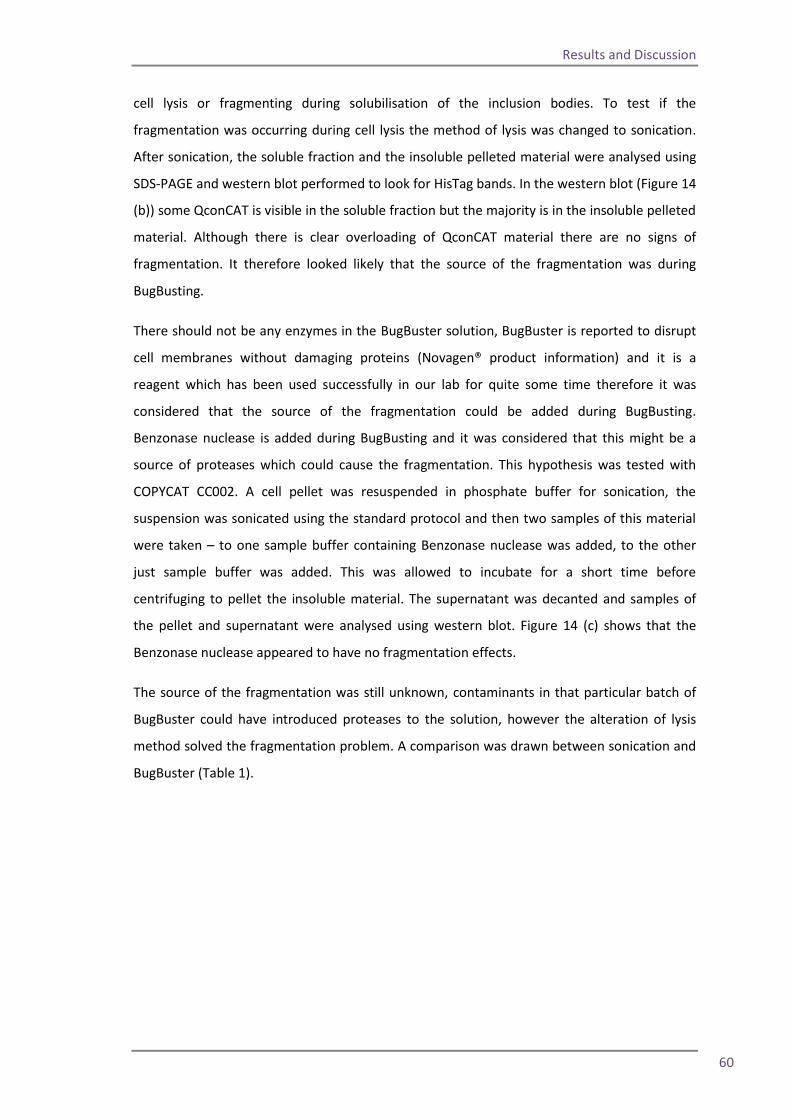
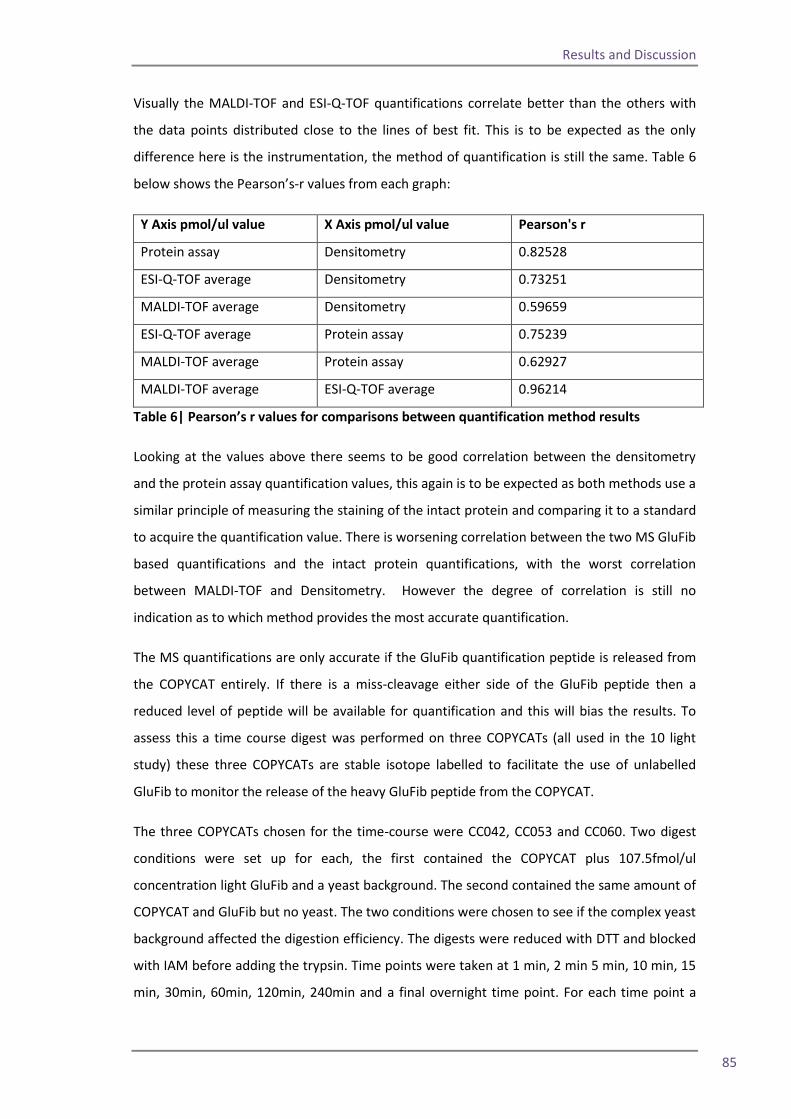
List of Tables Results and Discussion Table 1|Comparison between BugBuster and sonication methods of cell lysis 61 Table 2|Protein assay results 64 Table 3|RapiGest solubilised CC001, protein hits from the E.coli database 72 Table 4|Purified CC001, protein hits from the E.coli database 72 Table 5|Merits and demerits of five different quantification methods for the QconCAT standard 79 Table 6|Pearson’s r values for comparisons between quantification method results 85
List of Abbreviations QconCAT| Concatemer of standard Q-peptides ELISA| Enzyme-Linked Immunosorbent Assay AQUA| Absolute Quantification TAP-tag| Tandem Affinity Purification tag ICPL| Isotope-Coded Protein Label ICAT| Isotope-Coded Affinity Tag iTRAQ| Isobaric Tag for Relative and Absolute Quantification TMT| Tandem Mass Tag PSAQ| Protein Standard Absolute Quantification SILAC| Stable Isotope Labelling by Amino Acids in Cell Culture MS| Mass Spectrometry RT| Retention Time SRM| Selected Reaction Monitoring MRM| Multiple Reaction Monitoring m/z| Mass to charge ratio MALDI| Matrix Assisted Laser Desorption Ionisation ESI| Electrospray Ionisation LC| Liquid Chromatography HPLC| High Performance Liquid Chromatography TOF| Time of Flight Q-TOF| Quadrupole-Time of Flight CID| Collision Induced Dissociation AMRT| Accurate Mass Retention Time AUC| Area Under the Curve PLGS| ProteinLynx Global Server CV| Coefficient of Variation SD| Standard Deviation SDS-PAGE| Sodium Dodecyl Sulphate - Polyacrylamide Gel Electrophoresis OD| Optical Density Glufib| [Glu1]-FibrinopeptideB peptide IPTG| isopropyl β-D-1-thiogalactopyranoside BSA| Bovine Serum Albumin ORF| Open Reading Frame EDTA| Ethylenediaminetetraacetic acid DTT| Dithiothreitol IAM| Iodoacetamide
Abstract
iii
Abstract
Quantitative data is an excellent resource in any proteomics study but is essential in many. In
recent years this area has expanded from relative to absolute quantification with a wide range
of methods available for absolute quantitative proteomics. In general protein quantification is
based on either label-mediated or label-free strategies. Common label-mediated approaches
are isotope dilution strategies, such as AQUA, coupled with mass spectrometry, where analyte
signal is compared to a stable isotope labelled standard added in known abundance. These
methods are suited to small-scale studies but increasing demand for large-scale proteome
quantification exposed the need for alternative quantification methodologies. The QconCAT
technology, first published in 2005, is a label mediated approach which utilises the principle of
surrogacy to quantify analyte proteins based on a signature peptide, or peptides, for each
protein. QconCATs are concatenations of quantotypic peptides for a group of proteins, the
QconCAT gene is designed in silico and expressed heterologously in E.coli with [13C6]arg and
[13C6]lys to elicit a stable isotope labelled multiplexed absolute quantification standard.
In this thesis I describe several developments to the QconCAT production protocol. These
developments reduce the production time from ~19d, using the initial method, to less than
7d. Time gains have been made across the whole workflow in the areas of protein expression,
cell lysis, and product purification. Moreover verification of the QconCAT is delayed until the
final product is synthesised, made possible by evidence of high quality reproducible
expression. I explain how these alterations allow for production of several QconCATs in
parallel, giving added efficiency. The success of the method is demonstrated through the use
of multiple QconCATs. As a result of this work it is now possible to make at least eight
QconCATs per week and the rate-limiting step of the quantification workflow has migrated
from standard preparation to data processing. The final study in this thesis discusses methods
for accurate quantification of the QconCAT protein and additional applications of QconCATs
for testing mass spectrometer performance.
Introduction
1. Introduction 8 1.1 Proteomics 8 1.2 Protein quantification 9 1.3 Mass Spectrometry 11 The mass spectrometer 11 Ionisation 12 The mass analyser 15 1.4 Quantitative techniques utilising mass spectrometry 19 Label-free quantitative strategies 19 Label mediated quantitative strategies 21 1.5 QconCAT technology 27 Selection of peptides 29 Selecting the expression strain 30 The T7 expression system 30 Quantification with QconCAT 32
Introduction
8
1. Introduction
Proteomics is a wide ranging discipline, of which quantitative proteomics is just one aspect;
QconCAT is one of many methods which can be used for quantification. In order to introduce
the QconCAT methodology I will discuss some background to proteomics with an emphasis on
quantitative proteomics. I will also introduce mass spectrometry as the major analysis tool
most commonly used with QconCAT mediated quantification and discuss the instrumentation
used.
1.1 Proteomics
The proteome (Wilkins et al., 1996) (a) (Wilkins et al., 1996) (b) of an organism describes the
full complement of proteins expressed from its genetic material under a defined physiological
and pathophysiological state. Proteomics is the study of the proteome, with an aim to
characterise every protein expressed and map each protein to its cellular location, function
and interactions. The field defines identification proteomics, where expressed proteins in a
particular cell state are identified as present or absent, and quantification proteomics, which
assesses the amount of protein expressed in a given cell state. This quantification can be given
relative to other proteins in the cell or sample or as an absolute value. Disciplines such as
genomics, a study of genes and their function, and transcriptomics, a study of mRNA in a
genome, work in conjunction with proteomics. However the key advantage of proteomics is
its ability to look at the changes in protein expression by directly analysing the levels of a
protein present. The discrepancy between the level of mRNA produced within a cell and the
resulting level of protein expression was first noticed during a study of human liver proteins
(Anderson and Seilhamer, 1997), another study into the protein and mRNA in Saccharomyces
cerevisiae cells (Gygi et al., 1999) revealed a similar discrepancy. More recently a study
combining transcriptome and proteome analyses on a number of Escherichia coli samples
revealed that whilst many results from the transcriptome and proteome aligned well there
were also frequent cases where the values were inconsistent (Yoon et al., 2003). Vogel also
found this to be true during a study on oxidative stress in Saccharomyces cerevisiae (Vogel et
al., 2011). This illustrates the importance of proteomics as an alternative to gene-focussed
studies so that the full picture of cell dynamics can be understood.
As previously mentioned, there are many facets to proteomics; often analysis of a biological
sample begins with identification of a target protein or proteins, the proteins can be
sequenced and characterised to define the structure, post-translational modifications,
Introduction
9
localisation within the cell, and associated proteins and function. To acquire all of this
information a wide range of techniques can be employed. The proteins can also be quantified,
either by relative abundance in changing cell or tissue states, or by absolute abundance in
copies per cell, and again quantification can employ a variety of methodologies.
1.2 Protein quantification
An established and widely used approach to protein quantification is through the use of
protein binding reagents. Applications range from specific protein targeting to analyses of
entire proteomes; an atlas of more than 700 antibodies to human proteins has been
generated, covering tissues in normal and disease states (Uhlen et al., 2005). Two major
affinity techniques are Enzyme Linked Immunosorbent Assay (ELISA) (Engvall and Perlmann,
1971) and western blotting (Towbin et al., 1979). More recently the non-affinity based
technique of mass spectrometry (MS) has also been used for protein quantification.
An ELISA uses antibodies to probe for specific proteins of interest. A simple ELISA involves the
immobilisation of a sample, containing the “analyte” protein, onto a surface; a primary
antibody is then used to bind the analyte. Often a secondary antibody is used to bind the
primary antibody and this antibody is conjugated to an enzyme. To develop the assay the
substrate for the enzyme is added, the enzyme catalyses the breakdown of the substrate to a
product, this is usually detectable by fluorescence or absorbance. If the fluorescence or
absorbance can be detected quantitatively then the technique can be used to quantify the
amount of secondary antibody bound and to therefore infer the amount of analyte protein
bound to the primary antibody. The quantification values obtained can be relative to other
samples in the assay, or if a “standard” is included in the assay, where a known protein is
measured in a range of defined amounts, this can be used to create a standard curve, from
which the absorbance or fluorescence values for the analyte can be read off to give an
absolute quantification value. This type of assay is specific and sensitive due to the use of
antibodies which are targeted solely to the protein of interest. The use of an enzyme coupled
to the secondary antibody allows for possible amplification of signal which increases the
sensitivity of the assay.
The western blotting technique also involves the use of antibodies and often detection using
enzymes, so like ELISA it can be specific and sensitive. For the blot the sample is initially
separated using SDS-PAGE. The separated proteins in the sample are then transferred to a
membrane (often nitrocellulose) using an electric field and the membrane is incubated with
Introduction
10
an antibody to detect the protein of interest. As with ELISA the antibody can be conjugated to
a radioactive, fluorescent or enzyme marker to allow detection of the bound antibody. When
an enzyme is used often the product of catalysis will give off a chemiliminescence which can
either be detected on an x-ray film or with a specialised camera. The resulting image (either
from the developed film or the image from the camera) will show bands, reflecting where the
analyte protein was present on the membrane. This image can be analysed using
densitometry to compare the optical densities (ODs) of the protein bands. If a number of
samples are present on the blot the relative ODs provide information about the relative
abundance of the analyte protein between samples. Additionally a standard can be applied in
a range of known concentrations to the same SDS-PAGE gel as the analyte protein. The ODs
from the standard can then be used to create a standard curve as with the ELISA technique,
and the OD of the analyte bands can be used to calculate the amount of analyte in the sample.
Another affinity technique involves tagging a protein of interest. The tagging of a protein was
initially used as a purification technique to extract specific proteins and protein complexes
from a solution. Two plasmids were developed which “tag” an inserted gene with the
Staphylococcal protein A gene, when the inserted gene is transcribed the protein produced is
tagged with protein A. The ability of protein A to bind immunoglobulin, particularly
immunoglobulin G (IgG), is used to remove the protein and tag by interaction with
immobilised IgG (Uhlen et al., 1983). The idea was developed to produce TAP-tags – tandem
affinity purification tags. In this design the tag consisted of protein A, as previously used,
followed by a TEV protease recognition sequence and then the calmodulin-binding peptide
(CBP). The TAP-tag was fused to a target protein, and then introduced into cells where the
target protein-tag conjugate was expressed. The benefit of the dual tag is that there can be a
two step purification to ensure that the final protein isolated is highly pure and that any
further analysis of the protein can be as accurate as possible (Rigaut et al., 1999). The TAP-tag
idea was expanded to quantification through tagging each of the open reading frames (ORFs)
in S. cerevisiae. A library of S.cerevisiae ORFs was created where, for each ORF, the gene was
tagged with a TAP and inserted into the chromosome. The method was designed not to alter
the expression levels of the tagged protein so, after isolation, quantification could be
completed on each protein in the given cell state. Quantification was performed by
quantitative western blotting (Ghaemmaghami et al., 2003).
Introduction
11
1.3 Mass spectrometry
Mass spectrometry (MS) is a key tool in proteomics; major applications of MS include protein
identification, peptide or protein sequencing, and importantly for this thesis, protein
quantification. The diversity of the instrumentation and sample preparation techniques
available mean that MS can be used for studying a small number of proteins or peptides, up to
large scale analysis of highly complex samples.
ELISA and western blotting techniques are typically performed on intact protein. MS can also
be used to analyse an intact protein but in quantification it is more common to analyse
peptides resulting from a digested protein or proteins. Within the mass spectrometer peptides
can be fragmented through collision with an inert gas to give characteristic ion products which
can be used to sequence the protein, and the use of peptides also gives a wider scope of
possible methods for quantification. When a peptide is used in a quantitative experiment the
principle of surrogacy is applied. In proteomics surrogacy presumes that the molar
quantification of a peptide, arising from a proteolytically digested target protein, can be used
to directly infer the quantification of that protein. The assumption is made that the peptide
chosen is present in the same molar amount as the protein itself. The peptide is chosen as a
“proteotypic” peptide, meaning that it is a sequence unique signature peptide for that
protein, when the chosen peptide is used for quantification the term “quantotypic” can be
used, meaning that the peptide is both proteotypic for the protein and also that it is suitable
for quantification. The criteria which define a peptide as being suitable for quantification will
be discussed later.
Typically trypsin is used to digest protein samples; this enzyme is most often chosen as it
reliably and consistently recognises specific cleavage sites on the C-terminal side of arginine
(arg) and lysine (lys) residues, except when they are followed by a proline. Tryptic cleavage
produces predictable arg and lys terminated peptides, with the exception of the C-terminal
peptide. Once the sample has been fully digested into peptides it is then ready to be analysed.
THE MASS SPECTROMETER
A mass spectrometer has three components; an ionisation source, a mass analyser and a
detector. The role of the ionisation source is to deliver the peptides to the mass analyser in
the form of charged ions in the gas phase. Once inside the instrument the ions travel through
a vacuum in the mass analyser, the primary purpose of which is to separate the ions according
to their mass (m) and charge (z) in the relationship m/z. It is the mass to charge ratio (m/z) of
Introduction
12
an ion which determines how it will travel through the analyser. Once separated the ions
collide with the detector, each event is recorded and measured. The output from the detector
is plotted as a spectrum of ion intensity plotted against m/z. There are a range of ionisation
techniques which are currently used. The two mostly commonly used in biological sciences,
which will be discussed here, are both soft ionisation techniques and produce positively
charged ions by addition of a proton or protons.
IONISATION
Matrix Assisted Laser Desorption Ionisation (MALDI), as its name suggests, uses a matrix in
order to convert analyte (in our case peptides) into positive singly charged ions in the gas
phase. Matrix ionisation techniques were developed as a way to ionise large intact masses of
polymers and proteins (Karas and Hillenkamp, 1988) and are extremely effective for peptides.
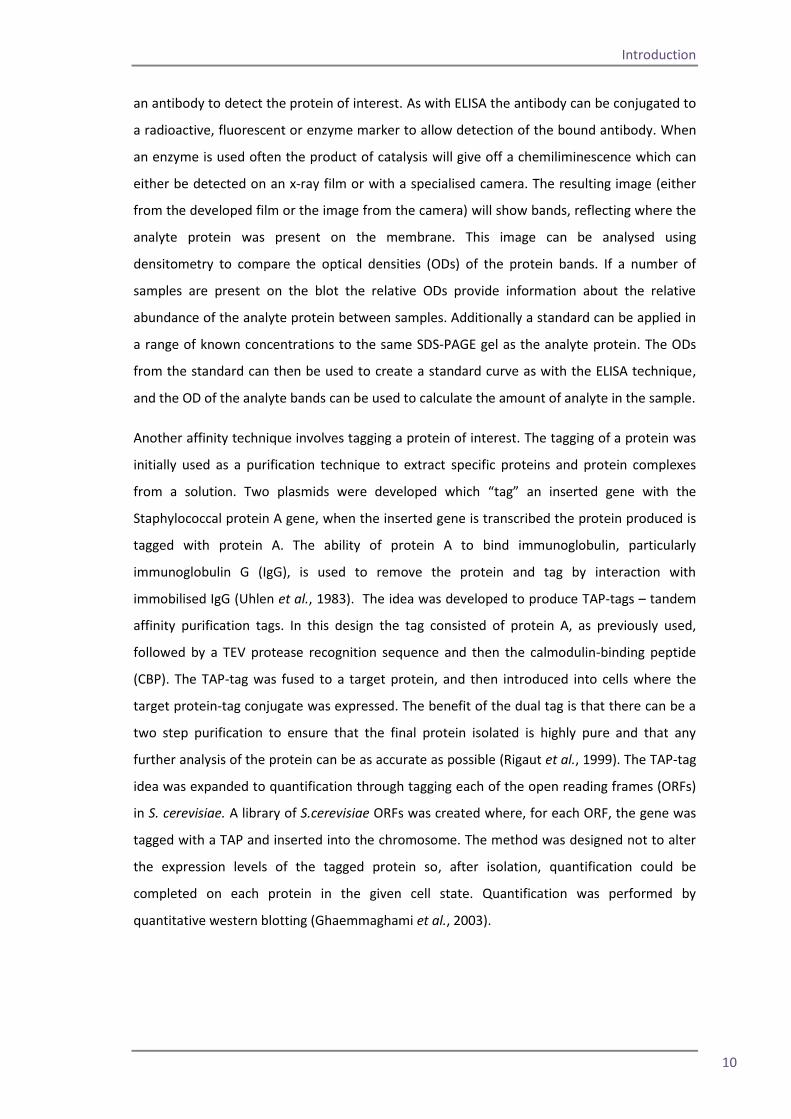
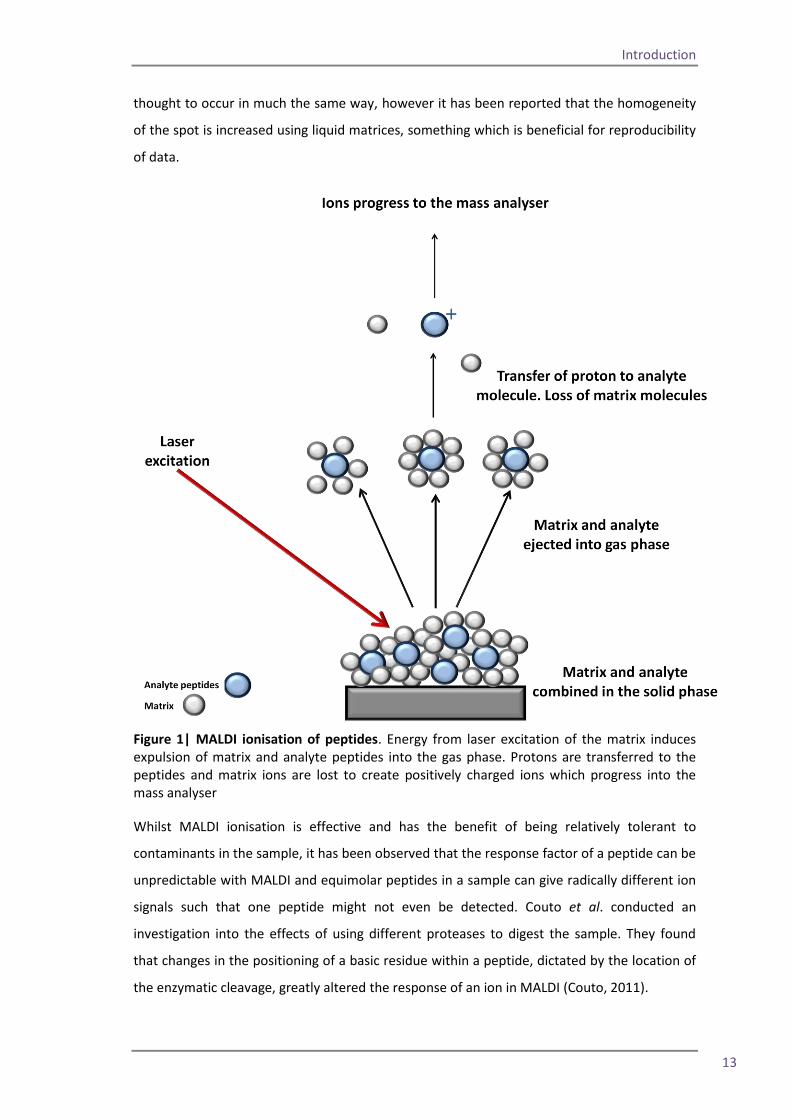
The principle of matrix assisted ionisation, (Figure 1) is that the analyte is embedded into
crystals of a matrix which absorb energy from a laser, in this way energy can be delivered to
the analyte to induce the non-volatile components into the gas phase without the molecules
being damaged by extremely high levels of energy; matrix and analyte are ejected into the gas
phase together (Fitzgerald et al., 1993). It is thought that charge is delivered to the analyte, to
create ions, via photoexcitation of the matrix, which leads to transfer of protons to the analyte
molecules (Hillenkamp et al., 1991); in MALDI-MS only singly charged peptide ions are
produced. Ionisation is variable with MALDI-MS and bias can be seen towards arginine
terminated peptides due to preferential ionisation of the arginine side chain (Krause et al.,
1999).
Many different matrices have been screened for their properties as useful compounds for the
ionisation of a sample for MS (Fitzgerald et al., 1993). We use α-cyano-4-hydroxycinnamic
acid, this is a crystalline matrix which can be solubilised, mixed with the sample and then
spotted onto a laser-target plate and allowed to dry before use in the solid state. Some are of
the opinion that the solid-phase matrices give bias to an analysis (Tholey and Heinzle, 2006). It
has been argued that regardless of how well combined the matrix and sample are, “hot spots”
will form when the matrix dries; these are places within the overall sample spot that provide
much more intense spectra, other areas of the spot may give much weaker spectra and so
reproducibility between analyses is called into question. For this reason liquid matrices are
sometimes considered more suitable. Liquid matrices are made by mixing the crystalline
matrix of choice with an organic solvent, such as pyridine. Due to the fact that the liquid
contains the same matrix material as in crystalline matrices the ionization of analyte is
Introduction
13
thought to occur in much the same way, however it has been reported that the homogeneity
of the spot is increased using liquid matrices, something which is beneficial for reproducibility
of data.
Figure 1| MALDI ionisation of peptides. Energy from laser excitation of the matrix induces expulsion of matrix and analyte peptides into the gas phase. Protons are transferred to the peptides and matrix ions are lost to create positively charged ions which progress into the mass analyser
Whilst MALDI ionisation is effective and has the benefit of being relatively tolerant to
contaminants in the sample, it has been observed that the response factor of a peptide can be
unpredictable with MALDI and equimolar peptides in a sample can give radically different ion
signals such that one peptide might not even be detected. Couto et al. conducted an
investigation into the effects of using different proteases to digest the sample. They found
that changes in the positioning of a basic residue within a peptide, dictated by the location of
the enzymatic cleavage, greatly altered the response of an ion in MALDI (Couto, 2011).
Introduction
14
An alternative to MALDI ionisation is Electrospray Ionisation (ESI) (Figure 2). The end result of
ESI is the same as MALDI; positively charged peptide ions are ejected into the gas phase and
directed into the mass analyser. However the way in which the ions are created is very
different and as a result ESI can produce ions with multiple positive charge states.
Figure 2| ESI ionisation of peptides. The sample is positively charged by electric current, a fine spray of charged droplets are ejected from the tip. The solvent evaporates until the Rayleigh limit is reached, whereby the droplets separate out into smaller droplets, this cycle repeats until charged ions remain, these move through the negatively charged cone into the mass analyser.
The sample, a solution of peptides, is delivered via a capillary tube to a tip from which the
sample is sprayed into the mass spectrometer. In the case of positive ionisation an electric
field, delivered to the tip, positively charges the liquid as it flows through. As the multiply
charged liquid exits the tip, Coulomb (C) electric charge forces cause droplets to form which
repel each other and disperse, creating a spray. The solvent carrying the peptides evaporates
and the charge density on the droplet increases until the “Rayleigh limit” is reached. This limit
is defined as the point where the charge on the surface of the droplet (C) reaches a density
where the repulsion between charges is equal to the surface tension of the droplet; at this
point the droplet separates out into smaller droplets. This cycle repeats for the smaller
droplets and eventually leaves peptide ions with multiple positive charges which pass through
a negatively charged sample cone and can be analysed in the mass spectrometer (Fenn et al.,
1989; Cech and Enke, 2001).
Due to the fact that ESI is compatible with liquid flow a significant proportion of MS analyses
that use ESI as their ionisation technique are preceded by a Liquid Chromatography (LC) step
Introduction
15
to reduce the complexity of the sample. This step is not part of the MS analysis but is often
used in conjunction with MS to increase the resolution of the analysis. The sample to be
analysed is taken up into an LC system (or nano-HPLC if very small volumes are being used).
Depending on the technology an autosampler can be used to inject samples from pre-defined
vial locations. The sample is then loaded onto a column; there are various columns which can
be used which separate out peptides based on different properties, one example is a reverse
phase column which separates out peptides based on their hydrophobicity. The elution from
the column is pumped through capillary to the ESI source where it can be sprayed into the
mass spectrometer. The elution time from the column becomes a factor in the MS analysis
and adds another dimension to the MS spectra; peptide ions elute into the mass spectrometer
according to their retention time (RT) so the m/z, intensity and RT of a peptide ion is
measured.
THE MASS ANALYSER
Ions are separated according to their m/z in the mass analyser. The instruments used in this
study have Time of Flight (TOF) mass analysers. The m/z value for an ion is based on the time
it takes for the ions to travel along a TOF tube of specified length. In the simplest TOF
instruments the ions enter the instrument in the gas phase and are accelerated by an electric
field. This acceleration means that ions of the same charge should have the same kinetic
energy as they enter the flight tube. After acceleration the ions travel along a linear tube,
which is free from any electric field, until they hit the detector. The time taken for this flight is
recorded and can be used to calculate the m/z of a peptide.
The longer the flight tube the greater the separation, or resolution, of the ions, therefore the
TOF tube is ideally as long as possible. The tube is generally not longer than 1-2 meters, due to
space restrictions in laboratories; however a way to increase the length of the flight without
increasing the size of the instrument is to reflect the ions back along a different trajectory
using ion mirrors (reflectron), therefore doubling the length of the flight. This increase in flight
distance increases the separation between the ions and therefore improves resolution in the
spectrum; this is termed reflectron TOF. Two instruments used in this study - the WatersTM
MALDI-TOF and the Bruker Ultraflex MALDI-TOF, both use single reflectron TOF. The WatersTM
Synapt G1 and WatersTM Synapt G2 and are also used in this study, these instruments have a
TOF system which can be used in reflectron “V” mode with a single ion reflection or in “W”
mode with three reflections to further increase the resolution.
Introduction
16
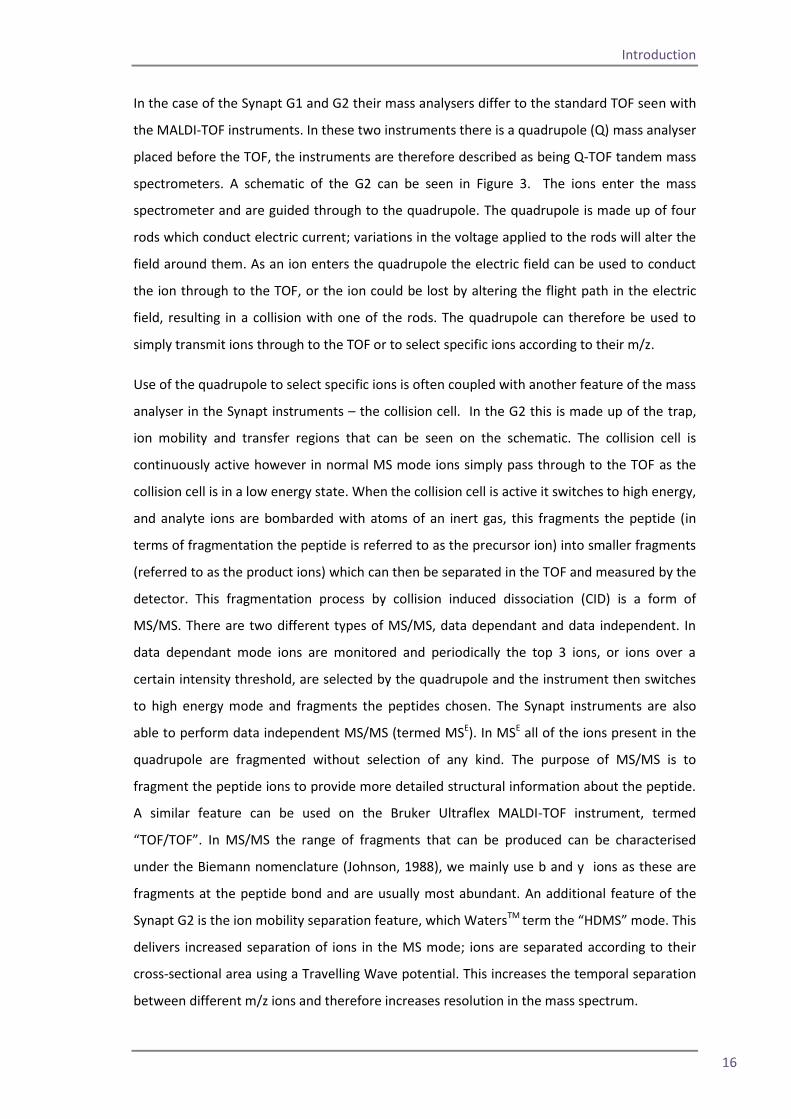
In the case of the Synapt G1 and G2 their mass analysers differ to the standard TOF seen with
the MALDI-TOF instruments. In these two instruments there is a quadrupole (Q) mass analyser
placed before the TOF, the instruments are therefore described as being Q-TOF tandem mass
spectrometers. A schematic of the G2 can be seen in Figure 3. The ions enter the mass
spectrometer and are guided through to the quadrupole. The quadrupole is made up of four
rods which conduct electric current; variations in the voltage applied to the rods will alter the
field around them. As an ion enters the quadrupole the electric field can be used to conduct
the ion through to the TOF, or the ion could be lost by altering the flight path in the electric
field, resulting in a collision with one of the rods. The quadrupole can therefore be used to
simply transmit ions through to the TOF or to select specific ions according to their m/z.
Use of the quadrupole to select specific ions is often coupled with another feature of the mass
analyser in the Synapt instruments – the collision cell. In the G2 this is made up of the trap,
ion mobility and transfer regions that can be seen on the schematic. The collision cell is
continuously active however in normal MS mode ions simply pass through to the TOF as the
collision cell is in a low energy state. When the collision cell is active it switches to high energy,
and analyte ions are bombarded with atoms of an inert gas, this fragments the peptide (in
terms of fragmentation the peptide is referred to as the precursor ion) into smaller fragments
(referred to as the product ions) which can then be separated in the TOF and measured by the
detector. This fragmentation process by collision induced dissociation (CID) is a form of
MS/MS. There are two different types of MS/MS, data dependant and data independent. In
data dependant mode ions are monitored and periodically the top 3 ions, or ions over a
certain intensity threshold, are selected by the quadrupole and the instrument then switches
to high energy mode and fragments the peptides chosen. The Synapt instruments are also
able to perform data independent MS/MS (termed MSE). In MSE all of the ions present in the
quadrupole are fragmented without selection of any kind. The purpose of MS/MS is to
fragment the peptide ions to provide more detailed structural information about the peptide.
A similar feature can be used on the Bruker Ultraflex MALDI-TOF instrument, termed
“TOF/TOF”. In MS/MS the range of fragments that can be produced can be characterised
under the Biemann nomenclature (Johnson, 1988), we mainly use b and y ions as these are
fragments at the peptide bond and are usually most abundant. An additional feature of the
Synapt G2 is the ion mobility separation feature, which WatersTM term the “HDMS” mode. This
delivers increased separation of ions in the MS mode; ions are separated according to their
cross-sectional area using a Travelling Wave potential. This increases the temporal separation
between different m/z ions and therefore increases resolution in the mass spectrum.
Introduction
17
Ion
isat
ion
Mas
s an
alys
er
De
tect
or
Figu
re3|
Sch
em
atic
of
Q-T
OF
inst
rum
en
tSy
nap
tG
2.Sc
he
mat
icfr
om
Wat
ers
TM
pub
licat
ion
s,d
etai
lof
the
mas
san
alys
er
issh
ow
nm
ade
up
of
the
qu
adru
pole
,the
colli
sio
nce
llan
dth
eTO
F.TO
Fh
as“W
”m
od
eio
nre
fle
ctio
nto
incr
eas
eth
efl
igh
tp
ath
of
ion
sfo
rb
ett
err
eso
luti
on
.MS/
MS
frag
me
nta
tio
no
ccu
rsin
the
colli
sio
nce
ll.
Co
llis
ion
ce
ll
Introduction
18
A method which utilises the selective abilities of the quadrupole and MS/MS fragmentation is
Selected Reaction Monitoring (SRM). With SRM a particular ion in selected by the user, this
ion is isolated and then fragmented and the product fragments recorded. The instrument will
have the capability to monitor a specific product ion as well as the precursor; the precursor-
product ion pair is a “transition”. The instrument used determines whether the analysis can be
termed an SRM or a pseudo-SRM. A true SRM is performed on a triple-quadrupole MS
instrument; the mass analyser in a triple-quadrupole is made up of three quadrupoles that 1)
select the precursor peptide ion to fragment 2) fragment the ion and 3) select product ions for
the detector. In the case of a Q-TOF instrument the quadrupole is used to select the precursor
ion, however once the ions are fragmented the lack of a second quadrupole means that
product ions cannot be specifically selected, so all of the product ions are monitored; this is a
“pseudo SRM”.
Multiple SRMs can be used in a single MS analysis. Multiple SRMs can be referred to as
Multiple Reaction Monitoring (MRM), although the term is less often used and SRM is
commonly used to describe MRM experiments. The benefit to SRM or MRM is that the user
selects the precursor ions to be monitored and these are programmed into the method prior
to the analysis. MRM does not use Top3 or intensity threshold criteria to select ions for
fragmentation, therefore the peptide of interest is always selected for MS/MS fragmentation.
In MS based proteomic analyses a common obstacle is the limit of detection (LOD); this is the
limit at which an ion can be detected and reliably distinguished from the background “noise”.
The LOD therefore becomes more of a challenge when analysing peptides in a complex
background (Gallien et al., 2011). SRM can help to pull the target peptide out of the
background and acquire fragmentation data on lower abundance peptides, and in this way it
can “dig deeper” into the proteome. SRM is well suited for use in quantification studies across
a large dynamic range (Picotti et al., 2009) however the method does require initial analyses,
selection of the best transitions and correction of collision energies before it can be run
(Campbell et al., 2011), this means it can be a lengthy process. Picotti et. al. (Picotti et al.,
2010) have presented a higher-throughput method for SRM where they use proteomic data
sets to select potential SRMs for target proteins and then synthesise all potential peptides
using Spot Synthesis. The potential peptides are screened using SRM based MS assays and the
most appropriate transitions are selected. Their workflow could make SRM more accessible
and applicable to large scale studies.
Introduction
19
1.4 Quantitative techniques utilising mass spectrometry
In a quantification experiment, as mentioned previously with ELISA and western blotting, the
quantification can be relative, comparing the abundance of protein(s) between different cell
states and monitoring changes in abundance under certain stimuli; or absolute, where analyte
protein(s) are quantified to the level of copies per cell. The approaches taken for relative or
absolute quantification can be classed according to whether the method is label-free, relying
on MS data processing and in some cases unlabelled internal standards, or label-mediated,
where a chemically or metabolically incorporated label is used to differentiate between
standard and analyte (Figure 4).
LABEL-FREE QUANTITATIVE STRATEGIES
Initially, label-free quantification strategies were solely focused on relative quantification
values. Techniques such as spectral counting can be used to estimate the relative abundance
of a protein (Liu et al., 2004); this approach involves counting the number of MS/MS spectra
acquired for a peptide. It was discovered that the number of spectra acquired directly
correlated to the abundance of that peptide and therefore the abundance of the parent
protein in the sample. However spectral counting can become less reliable when looking at
lower abundance proteins with fewer spectral counts (Lundgren et al., 2010). One of the more
simple relative quantification methods available is Accurate Mass Retention Time (AMRT)
(Silva et al., 2005). This method of quantification is based on the peptide ion signal intensity in
the MS spectrum; by using the accurate mass measurement and corresponding retention time
for a peptide signal, the ion intensity of the same peptide can be compared across samples
and the relative abundance of the parent protein inferred from the intensity ratios. This
technique relies on robust and reproducible sample preparation and LC-MS performance and
can therefore be subject to inaccuracies.
Similar to AMRT, other quantitative techniques have been established which also utilise the
peptide ion signal intensity or signal area. There are a number of different Area Under the
Curve (AUC) label-free methodologies which compare the signal area and use this to infer
quantification. In initial development tryptic digests of a range of concentrations of myoglobin
were analysed using MS. The concentrations of myoglobin prior to digestion ranged from
10fmol to 100pmol and it was discovered that over this range the concentration of the
myoglobin starting protein and the sum peak areas in the MS spectrum, for five selected
peptides, showed a linear correlation (r2=0.991) (Chelius and Bondarenko, 2002). In a later
study, the molar range was decreased to cover 10fmol to 1000fmol for cytochrome c digest
Introduction
20
and the target peptide peak intensities were normalized to four common internal standards,
this was found to give an improved r2=0.9978 (Bondarenko et al., 2002).
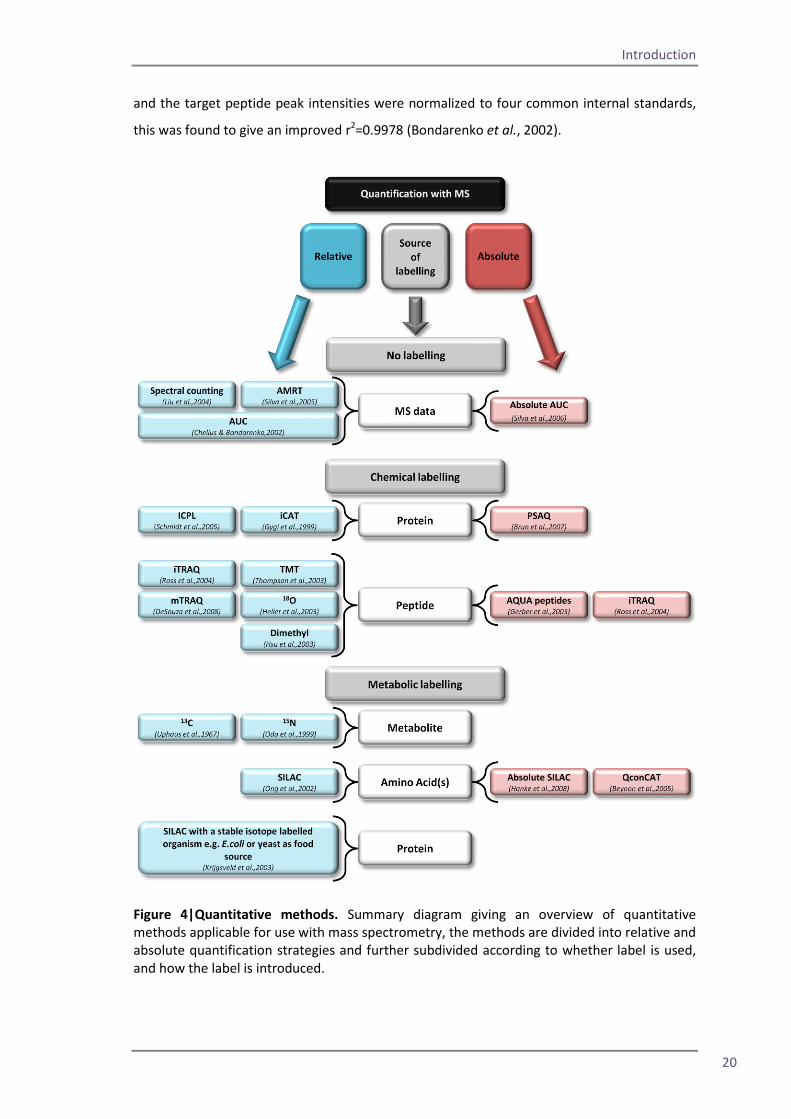
Figure 4|Quantitative methods. Summary diagram giving an overview of quantitative methods applicable for use with mass spectrometry, the methods are divided into relative and absolute quantification strategies and further subdivided according to whether label is used, and how the label is introduced.
Introduction
21
Relative quantification data can give a broad overview of the expression changes within a cell
and it is often more simple to set up a relative quantification experiment. However, whilst
relative quantification is all that is necessary for many applications, if individual proteins
within the same sample need to be compared to one another, or a more accurate view of the
scale of an abundance change and its effects is required, absolute quantification is necessary
(Bronstrup, 2004). More recently AUC label-free quantification has been developed to an
absolute quantification strategy (Silva et al., 2006). In this approach the top three most
intense tryptic peptides for the protein of interest are used. A single unlabelled standard is
also included in the assay, which can be added to the sample, in a known amount, prior to
digestion and co-digested with the analyte proteins. After the sample is analysed using MS an
average signal response for the top three peptides from the standard is taken and used to
calculate the “universal signal response factor”, which is measured in counts/mol protein. The
absolute value of each of the proteins in the sample can then be calculated by dividing the
average signal response, for the top three peptides for that protein, by the universal signal
response factor. It was also demonstrated that this method was applicable to simple and
complex samples.
Quantitative MS based proteomics, especially label-free quantification, relies heavily on the
software used to analyse the data. There is a huge variety of software available for different
applications. In this study ProteinLynx Global Server (PLGS) software from WatersTM is used,
this performs label-free quantification based on the “top3” principle and comparison to a
spiked in protein digest of known concentration acting as a standard. Another example
software is MaxQuant, which started out as software for label-mediated SILAC quantification
(Cox and Mann, 2008) but now also includes label-free quantification (Luber et al., 2010).
LABEL-MEDIATED QUANTITATIVE STRATEGIES
In general, for label-mediated quantification, stable-isotope labels are used. The benefit of
these isotopes is that they introduce a mass shift in the tagged peptide, distinguishing it from
the untagged peptides but the tagged and untagged peptides still show similar behaviour;
they have the same retention time, efficiency of ionisation and during MS/MS produce the
same ion fragments (Pan et al., 2009). They are also preferred over radioactive isotopes as
they do not require stringent safe handling procedures and do not rapidly decay. There are
many different stable isotopes available; common forms used are 13C, 15N, 2H and 18O. In order
to have clear separation between tagged and untagged peptides it is helpful to have a mass
shift of 3/4Da to reduce overlapping peaks affecting the quantification (Ong and Mann, 2005).
Introduction
22
For relative quantification with stable isotope labels, the samples are differentially labelled to
distinguish between them, they are then digested and analysed in parallel using MS. Analysis
of the standard and analyte produces pairs of peaks on a spectrum – an unlabelled lower m/z
peak and the higher m/z labelled peak. The intensity ratio between the two peaks echoes any
changes in expression of that protein between the two cell states (Gouw et al., 2010). For
absolute label-mediated quantification the same principle of comparing standard and analyte
peaks is used but an accurately quantified standard is added to give an absolute value to the
quantification.
With the standard and analyte requiring differential labelling a consideration for label-
mediated quantification is the level of error which could be introduced through the individual
treatment of the samples. Ideally they should be combined as early on as possible in the
workflow to minimise variation in treatment (Figure 5). If two cultures are differentially
labelled they can be combined prior to cell lysis giving the greatest minimisation of variance. If
this is not possible the next point to combine is prior to digestion; this still minimises variation
in digestion efficiency and errors in pipetting. A greater level of variation is introduced if the
peptides are pooled post-digestion.
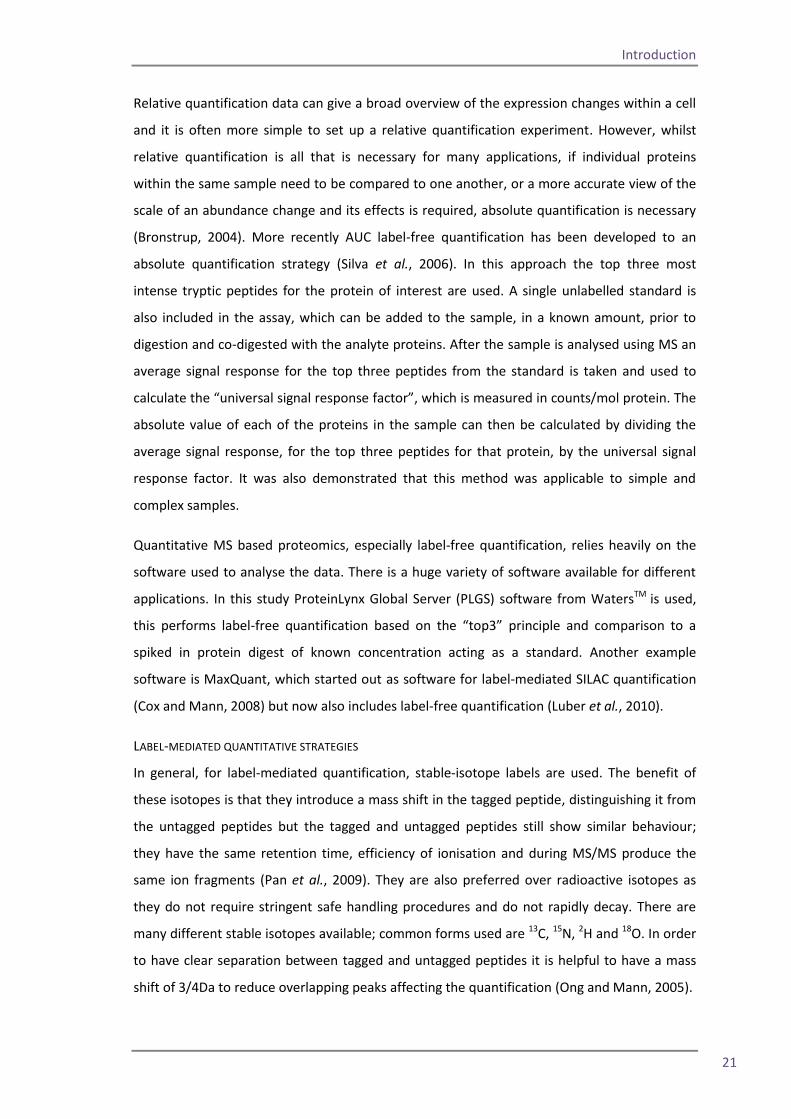
Figure 5| Stages in the quantitative workflow where samples can be combined. A and B
represent samples to be analysed, ideally A and B would be combined as early on in the
workflow as possible, prior to cell lysis. Alternatively proteins can be combined prior to
digestion or, less desirably, prior to MS analysis. The greatest level of variance is introduced if
samples are not co-analysed.
Introduction
23
Label can be introduced to the standard, or to differentially labelled samples, by chemical or
metabolic means. Chemical labelling involves tagging the target proteins prior to digestion,
the target peptides post-digestion or using a standard synthesised in a cell-free environment.
Isotope-Coded Protein Label (ICPL) is a chemical labelling method for relative quantification of
proteins (Schmidt et al., 2005). Two samples can be differentially labelled after cell lysis; the
ICPL reagent is either a deuterium containing (heavy) tag or is deuterium free (light tag). The
proteins are tagged at free amino groups and can then be combined for digestion. Signal
intensity from the light and heavy tagged peptides can be used to infer relative quantification.
Another labelling method for relative quantification is ICAT, where the protein is again
targeted for tagging, however unlike ICPL, in ICAT it is the cysteine residues that are tagged.
The tag can be deuterated to elicit an isotopically labelled reagent, and in a similar way to ICPL
two samples can be differentially labelled with the light or heavy forms of the reagent. The
samples can then be combined for digestion. The reagent is restrictive in that it only tags
cysteine containing peptides so not all of the peptides are suitable for quantitative analysis.
However the reagent contains a biotin molecule so post-digestion the tagged peptides can be
isolated from the solution using avidin. Comparison of the heavy and light peptide pairs in an
MS spectrum is used to infer relative quantification (Gygi et al., 1999). The benefit of both
ICPL and ICAT is that the proteins are tagged so co-digestion is possible, which helps to reduce
variation in the treatment of samples and increases the accuracy of quantification.
For targeting of peptides, rather than proteins, Isobaric Tags for Relative and Absolute
Quantification (iTRAQ) (Ross et al., 2004) reagents are commonly used. The tags bind free
amines at the N-terminus of the peptide and on lysine side chains. Every peptide in a digest is
labelled, meaning that every peptide can be used as a standard or basis for comparison for
relative quantification. Initially there were just four reagents however this has now increased
to eight. Each reagent could be used to tag a different sample set, for example eight different
growth conditions or disease states could be analysed and compared simultaneously. The
reagents are isobaric so they do not differ in mass, therefore when the tagged peptides are
analysed using MS there is no mass shift seen in the spectrum; however each of the four or
eight tags releases a different “reporter ion” in an MS/MS spectrum. The intensity of the
reporter ion can be used to relatively quantify the parent peptide and therefore the protein.
iTRAQ is commonly used as a relative quantification technique, however it can be made
absolutely quantitative with the use of accurately quantified, and subsequently tagged,
surrogate peptides, at least one peptide per protein in the analyte mix would need a
quantified surrogate. iTRAQ is an excellent technique to study multiple samples in parallel.
Introduction
24
The method does call for extremely careful sample preparation, there are pitfalls which can
compromise the accuracy of the data, such as the reactivity of the tags with amine groups,
meaning that amine containing buffers such as Tris and ammonium bicarbonate cannot be
used, and adding the tags to a peptide solution at low pH can cause the tags to react with
tyrosine residues (Unwin, 2010). Additionally as the tag is applied to peptides it is introduced
later in the protocol, which allows for a greater level of error due to variance between
treatment of samples. A significant number of chemical labelling techniques tag peptides and
hence they all have an increased propensity for variation in samples. However, with iTRAQ the
late introduction of the tag can also be useful in some cases where in vivo labelling of the
analyte is not possible due to the cost or scale of the labelling, for instance in the analysis of
human tissue. As a variation to iTRAQ reagents there are also mTRAQ reagents available
(Applied Biosystems, Inc., Foster City, CA) which work on a similar principle to iTRAQ but
introduce a mass-shift with the tag (DeSouza et al., 2008). There are fewer channels available
with the mTRAQ tag – just three including an “unlabelled” tag so there is less scope for
comparison between multiple cell states simultaneously. As with iTRAQ, the mTRAQ reagents
can be used for relative quantification, or absolute if a standard is used as one of the tagged
samples.
Another tagging technique is Tandem Mass Tags (TMT), which again can be used to
differentially label two samples (Thompson et al., 2003). Similarly to iTRAQ, the tags are
designed to generate a reporter ion in an MS/MS spectrum which can be used for
quantification. A benefit of the TMTs is that the reactive functionality can be altered to bind to
different groups depending on the needs of the user.
Chemical labelling does not always involve tagging with a reagent. Amongst other labelling
techniques is 18O labelling. Trypsin is used to digest the analyte protein(s) in a buffer
containing enriched 18O water, which is incorporated into the peptides as the enzyme
hydrolyses the peptide bond. Two 18O molecules are included in each peptide, one at each
terminus, which gives a 4Da mass shift (Heller et al., 2003). This method is typically used for
relative quantification, however if a standard protein of known abundance was 18O labelled
before combining the standard and analyte peptides, then absolute quantification could be
possible. The label in this method is introduced at a later stage in the protocol, so there is a
greater chance for error. However in a similar way to iTRAQ this method is widely applicable
to studies where the samples cannot be SILAC or otherwise labelled. As a final example of
chemical labelling of peptides, dimethyl labelling can be used (Hsu et al., 2003), formaldehyde
Introduction
25
is used to label the N-terminus and an amino group on lysine residues to differentially label a
set of peptides.
Rather than labelling analyte proteins with reagents, labelled standards can be synthesised for
quantification of target proteins. These standards can be produced in stable isotope labelled
form in a cell-free environment and can subsequently be accurately quantified to enable them
for use for absolute protein quantification. Protein Standard Absolute Quantification (PSAQ) is
an example of a chemically synthesised protein standard which can be used for absolute
quantification (Brun et al., 2007). The full length protein can be combined and co-digested
with the analyte protein, the resulting peptides can all be used for quantification of the target,
giving greater reliability to the method as co-digestion with the analyte minimises variation in
sample treatment. However, for each target protein a standard needs to be synthesised so
this method does not lend itself to large scale quantification. Absolute Quantification
peptides, or AQUA peptides (Gerber et al., 2003) are chemically synthesised peptides that are
stable isotope labelled and accurately quantified. They can be spiked into a sample in known
abundance before mass spectrometric analysis in order to quantify the corresponding analyte
peptide and therefore the analyte protein. Whilst quantification of the target protein is
possible from a single standard peptide, a more reliable quantification value would be
obtained from multiple peptides, in this way AQUA could be less reliable than PSAQ unless
multiple peptides were synthesised for each protein. The peptides are also combined with the
sample later on in the analysis as they do not need to be co-digested, and this has the
potential to introduce variation. Production of AQUA peptides can be expensive, especially if a
large scale study is considered. However a benefit to the chemical synthesis of the peptides is
that post-translational modifications can be added to the peptide if desired (Kettenbach et al.,
2011).
As previously mentioned, to reduce error in quantification the analyte and standard samples
should be combined as early on as possible in the protocol. In order to do this the label needs
to be introduced as early as possible and metabolic labelling in vivo rather than chemical
labelling in vitro can allow for early introduction of the label (Gouw et al., 2010). As with
chemical labelling, metabolic labelling can be performed with a number of different isotopes
and in different forms. For algae, bacteria or yeast the growth media can be supplemented
with a stable isotope such as 13C and 15N. Commonly 15N can be supplied in the form of
ammonium chloride and 13C can be supplied in the form of glucose (Uphaus et al., 1967; Oda
et al., 1999). The resulting proteins will be labelled with varying mass shifts depending on the
Introduction
26
length of the protein; this can make processing more difficult. The labelled culture can be
compared to an unlabelled culture for relative quantification; as the proteins are labelled in
vivo the cells can be combined prior to cell lysis to minimise variation.
A widely used metabolic labelling strategy is Stable Isotope Labelling by Amino Acids in Cell
Culture (SILAC). SILAC is an umbrella term which covers a wide range of techniques. Initially
SILAC defined the labelling of a cell culture with a stable isotope labelled amino acid such as
deuterated leucine (Leu-d3), a labelled culture and a non-labelled culture could be combined
and the relative protein abundances quantified using MS by comparing the intensity of
labelled and unlabelled peptide ion peaks (Ong et al., 2002). This has the benefit of being able
to compare an entire proteome from one labelled culture. Arginine and lysine are commonly
used in SILAC experiments along with trypsin as the enzyme of choice. Trypsin reliably cleaves
protein after Arg or Lys residues and so leaves peptides with a consistent single heavy amino
acid at the C-terminus of the peptide, releasing a labelled peptide which will show a
predictable m/z shift in a mass spectrum. However there are other possible amino acids and
isotopes which can be used according to the particular needs of the study. With SILAC the
label is introduced early in the workflow and so the analyte and standard can be mixed prior
to digestion, this limits variation in digestion efficiency. As an alternative method SILAC has
also been used to generate a heavy reference proteome which can then be “spiked in” to
several light analyte samples for relative quantification (Geiger et al., 2011). SILAC has recently
been used to describe the metabolic labelling of larger invertebrates such as Caenorhabditis
elegans up to mammals such as mice, additionally “absolute SILAC” has been developed.
It has become increasingly common to use labelling of larger organisms for relative
quantification (Gouw et al., 2010). As these organisms are not grown in culture the method of
introduction of the label can be more complex. In the labelling of mice a synthetic, usually
semi-synthetic, diet can be used which contains the stable isotope labelled amino acids. The
end result of labelling is typically 50% which, if taken into account in analysis and data
processing, still allows for effective quantification. For other organisms a two-step labelling
technique can be used; C.elegans has been labelled in this way. This two step technique
involves initially labelling E.coli with 15N using ammonium chloride as the 15N source (Krijgsveld
et al., 2003) or a supplemented labelled amino acid, lysine, (Fredens et al., 2011)) and
subsequently using the labelled E.coli as the food source for C. elegans. Quantification of
proteins extracted from model labelled organisms such as C. elegans is relative.
Introduction
27
For absolute quantification a SILAC labelled standard can be produced in vivo which is then
spiked in with the analyte prior to digestion (Hanke et al., 2008). The recombinantly expressed
proteins are purified and accurately quantified before co-digestion, so comparison between
the standard and analyte peptide signal intensities can be used to absolutely quantify the
target protein. This method has the advantage of absolute quantification, however it is limited
by the time and costs of producing multiple labelled protein standards.
When selecting a label-mediated quantification strategy the decision has to be made between
relative and absolute quantification. If absolute quantification is to be used the two major
classes of method use peptide or protein standards. Whilst the proteins standards offer the
benefit of co-digestion with the analyte and a greater number of quantification peptides they
can take a longer time to synthesise for each target protein and every peptide is not necessary
for quantification of the analyte. A compromise between the two could be QconCAT.
1.5 QconCAT technology
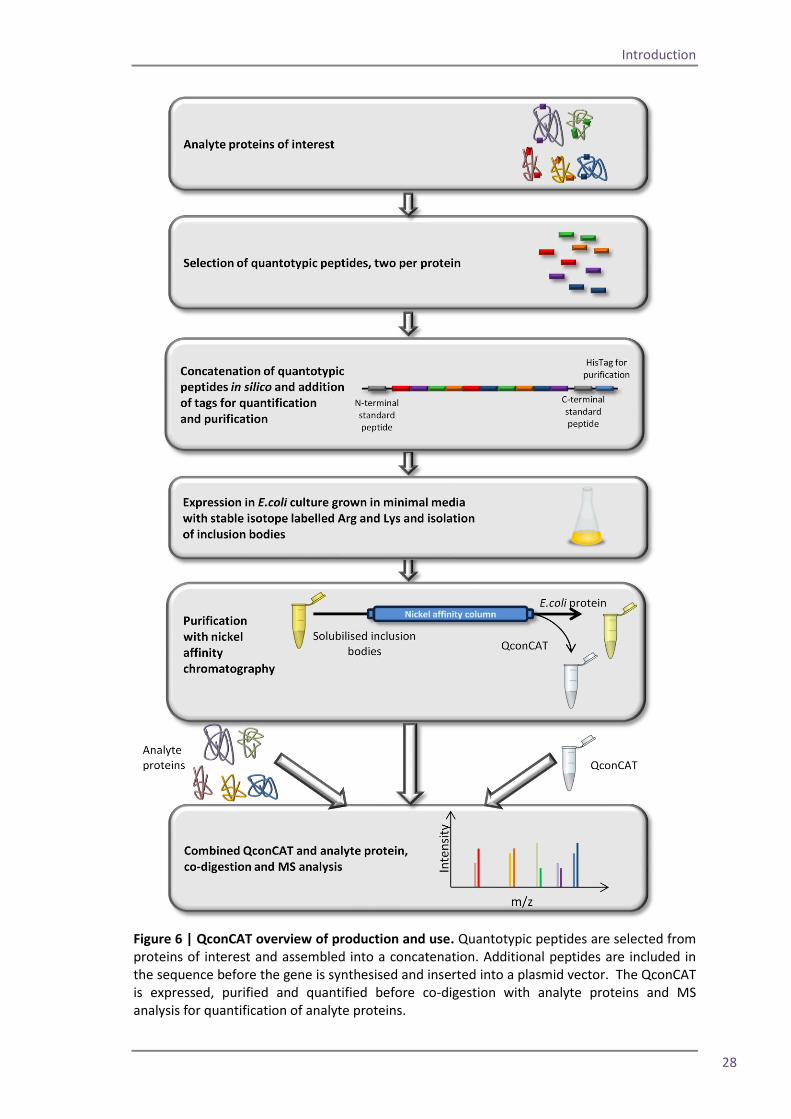
A QconCAT is a concatenation of proteotypic peptides for a set of proteins of interest. A
QconCAT is assembled as a protein and can be co-digested with the analyte to reduce
variability. The benefit over other protein standards is that tryptic peptides for multiple
proteins are included in a single QconCAT construct, so quantification can be multiplexed.
QconCAT technology utilises the principle of surrogacy, which has been discussed previously.
A QconCAT is a protein which is made up of carefully selected tryptic peptides; Figure 6 is an
overview of the QconCAT design process preparation and use. The design of the construct
occurs in silico; proteins of interest are selected and peptides from each are chosen, using a
number of different criteria. The peptides are concatenated into a protein sequence, and
certain peptides are added to the sequence for purification or quantification of the construct.
Finally a gene is designed, which codes for the entire construct and this is inserted into a
plasmid vector (Beynon et al., 2005; Pratt et al., 2006). The plasmid is inserted into E.coli and
the QconCAT protein is expressed in media containing stable isotope labelled amino acids. The
construct is purified from E.coli cell lysate using nickel affinity purification before co-digestion
with the analyte proteins and MS analysis.
Introduction
28
Figure 6 | QconCAT overview of production and use. Quantotypic peptides are selected from proteins of interest and assembled into a concatenation. Additional peptides are included in the sequence before the gene is synthesised and inserted into a plasmid vector. The QconCAT is expressed, purified and quantified before co-digestion with analyte proteins and MS analysis for quantification of analyte proteins.
Introduction
29
SELECTION OF PEPTIDES
The terms proteotypic and quantotypic (section 2.3) are regularly used to describe peptides
which are suitable, under a number of criteria, for analysis and quantification of proteins.
Computational tools have been developed to predict proteotypic peptides for a given protein,
especially the detectability of the peptide in an LC-MS/MS analysis (Mallick et al., 2007; Li et
al., 2010). Properties of the amino acid residues affect the detectability of a peptide and it has
become increasingly evident that a proteotypic peptide is not necessarily a quantotypic
peptide; specific criteria need to be met for a peptide to be suitable for use in a quantification
experiment (Brownridge et al., 2011) such as:
Charge on amino acid side chains
Hydrophobicity of amino acid side chains
Amino acid side chain length
Peptide structure
Must have a unique m/z value that does not overlap with another peptide in the
analysis
Ionisable to be able to be detected
Must be reproducibly observed
Avoid post-translational modification
Avoid methionine residues
Post translational modification are avoided due to the fact that the peptide can exist in the
modified and unmodified form in the analysis; the presence of both forms would split the
signal for that peptide and so give a bias towards a weak quantification. Similarly methionine
is avoided as it can be oxidised and again this would split the signal giving poor quality
quantification.
Digestion efficiency is extremely important in a quantification experiment; for the
quantification to be reliable all of the peptides, analyte and standard, must be released from
the parent proteins. A problem which is often seen in proteomics is “missed cleavage”, where
a digestion site, for example a tryptic cleavage site after an Arg or Lys residue, is not cleaved
or only partially cleaved. This results in incomplete release of the peptide, and if that
particular peptide is being used for quantification the value calculated with be biased.
Recently prediction tools such as CONSeQuence include information derived from a missed
cleavage predictor to avoid peptides that might not be completely cleaved (Eyers et al., 2011).
When the QconCAT method was first published in 2005 (Beynon et al., 2005), then termed
Introduction
30
“QCAT”, the construct contained a single representative “Q-peptide” for each protein which
was selected using much fewer criteria than are currently used. The QconCAT protocol has
now been developed to include at least two Q-peptides per protein for more accurate
quantification and CONSeQuence is regularly used to select appropriate quantotypic peptides.
SELECTING THE EXPRESSION STRAIN
For the last 40 years E.coli has been used as a tool in molecular biology. It lends itself well to
this task as E.coli culture has a robust and high growth rate and cultures can be grown
relatively cheaply (Baneyx, 1999; Wang et al., 2010). It is also an extremely well characterised
organism; the scientific community has accumulated a wealth of information on E.coli genes
and proteins. Although the E.coli genome was not the first to be completely sequenced, it was
one of the earliest with the complete genome sequence of K-12 published in 1997(Blattner et
al., 1997) and the complete BL21 (DE3) sequence following in 2009 (Jeong et al., 2009). There
are many different E.coli mutants available that are knockout strains for genes coding proteins
such as proteases; crucially E.coli tolerates mutations well. The BL21 (DE3) strain has been
used for many years for expression of recombinant proteins, the strain which we use for
QconCAT expression is BL21 (λDE3). This BL21 strain is deficient in both lon protease
(regulates gene expression by degradation of regulatory proteins such as transcription
regulators) and ompT protease (protease located in the outer membrane) making it a more
stable environment for recombinant proteins. The λDE3 indicates that the E.coli contains λDE3
prophage DNA, this means that the E.coli strain contains the T7 RNA polymerase gene and this
is used during recombinant protein expression.
THE T7 EXPRESSION SYSTEM
Once the QconCAT gene has been synthesised it is inserted into the pET-21a plasmid vector.
This vector is chosen for two key features; firstly the vector has a selectable marker for
ampicillin resistance, meaning that E.coli cells which successfully take up the vector
(transformed) will be resistant to ampicillin antibiotic, and growth of transformed cells on
ampicillin-containing agar plates allows selection of only the correctly transformed cells. The
exact mechanisms of transformation are not known; the use of CaCl2 and heat shock aid
transformation and it is thought that the calcium ions’ positive charge may shield the negative
charge on the DNA, or on the cell surface membrane (Watson, 2004) whilst the heat shock
may induce pores in the membrane which would allow passage of the shielded DNA molecule
into the cell. The transformation process is inefficient with only a small percentage of cells
taking up the plasmid vector. The antibiotic selection of successfully transformed cells is
Introduction
31
therefore very important. Secondly the inserted gene is placed under the control of a T7
promoter which means that expression of the gene can be controlled using the T7 expression
system.
The T7 expression system, first used by Studier and Moffatt (Studier and Moffatt, 1986), is
based on utilising the bacteriophage T7 RNA polymerase. The BL21 (λDE3) host contains the
T7 RNA polymerase gene inserted into the bacterial chromosome under the control of the lac
operon which keeps the polymerase from being transcribed under normal cell conditions. This
polymerase is highly selective for the T7 promoter, which is not usually present in an E.coli
cell. The pET21a vector, containing the T7 promoter, is transformed into the cell. After
antibiotic selection of transformed colonies, the cells are cultured and once a suitable cell
density is reached, isopropyl β-D-1-thiogalactopyranoside (IPTG) is added. The repressed
lacUV5 promoter in the lac operon prevents the T7 polymerase from being transcribed,
however IPTG is a synthetic analogue of allolactose (the natural activator for the lac operon)
and its presence within the cell switches off the lac repressor, activating the lacUV5 promoter
and allowing transcription of the T7 polymerase to occur (Lewis et al., 1996). The newly
synthesised T7 RNA polymerase recognises the T7 promoter on the plasmid vector and
transcribes the QconCAT gene linked to it.
Another method has been developed to induce expression of a recombinant protein by
autoinduction (Studier, 2005). This also uses the T7 expression system but does not require
the addition of IPTG. BL21 (DE3) cells containing a recombinant gene on a pET21a plasmid
vector are grown in autoinduction media specifically designed to use allolactose as the
inducer. The media contains lactose and a restricted amount of glucose. The glucose is
designed to sustain the culture only until it reaches a suitable density for induction. The
presence of glucose prevents T7 induction by lactose as the cells use glucose preferentially as
a carbon source. Once the glucose has been depleted the cells begin to use lactose as their
carbon source. As the cells begin to metabolise lactose the metabolite allolactose is produced.
Under normal cell conditions this would bind to the lac repressor, allowing transcription of the
genes in the lac operon and so facilitating lactose metabolism. In a BL21 (DE3) cell the
presence of allolactose removes the repression of the T7 lac promoter and so induces
expression of the T7 RNA polymerase, leading to expression of the inserted gene on the
pET21a vector. This method of induction can be extremely useful as the optical density of the
culture does not need to be monitored to induce expression so a culture can be left to induce
overnight.
Introduction
32
QUANTIFICATION WITH QCONCAT
The QconCAT construct is typically expressed in minimal media containing stable isotope
labelled arginine and lysine. The “heavy” labelled QconCAT is then purified using nickel affinity
chromatography by virtue of the hexahistidine tag and the purified protein can be quantified
using a protein assay. The QconCAT is added, in a known amount, to the analyte proteins and
co-digested with trypsin to elicit peptide pairs for quantification – a heavy peptide from the
QconCAT and a “light” peptide from the analyte. The digest is analysed using MS and the
intensity ratios between heavy and light peak pairs can be used to quantify the target
proteins. Quantification with QconCAT is applicable to all ionisation techniques and mass
spectrometers including ESI-TOF and MALDI-TOF MS (Rivers et al., 2007). Quantification
experiments using QconCAT often involve MRM assays as a more targeted approach; SRMs
are designed for each of the QconCAT transitions and its analyte counterpart.
A protein assay is commonly used to quantify the standard, however an alternative method
for quantification of the QconCAT standard has been developed that involves the use of a
quantification peptide that can be included in each QconCAT construct. Each QconCAT has the
sequence for Glufibrinopeptide B (GluFib) located after the sacrificial peptide at the N-
terminus of the construct and a variant of this peptide, known as Fib, at the C-terminus before
the HisTag. The value of GluFib and Fib is two-fold; firstly they can both be used as
quantification peptides, a known amount of unlabelled versions of each can be spiked into a
digest to quantify the labelled QconCAT and verify the quantification by virtue of each other.
The peptides are common to each QconCAT so quantification is comparable between
QconCATs. Secondly the presence of GluFib and Fib at the N and C-termini respectively allows
for verification that the full length construct is present in the digest (Brownridge et al., 2011).
An advantage of QconCATs is that the construct can be co-digested with the analyte protein,
therefore minimising variation in digestion efficiency. Additionally QconCATs are not designed
with any structural considerations and it is highly likely that the higher order structure of the
analyte proteins will be more complex than the QconCAT, so if the analyte is denatured to
allow complete digestion it is likely that the QconCAT should also be fully denatured.
The QconCAT standard can be described as a multiplexed absolute quantification standard.
The fact that standard peptides for several proteins can be produced and analysed
simultaneously is both time and cost effective and is a major advantage of this method over
other methods such as AQUA peptides as it facilitates easy multiplexing of quantification and
Introduction
33
opens the possibility of much larger scale quantification projects. Once the QconCAT plasmid
is created it can be used as many times as required without incurring great costs.
Finally the design of the QconCAT in silico means that there is huge scope for what is included
in the construct. For example, traditionally each peptide is included in the sequence once,
resulting in equimolar 1:1 ratios of each, however it is possible to include peptides a number
of times if different molar amounts are required in the analysis. This highlights the additional
properties of the QconCAT which can be exploited to act as a standard in MS to assess
instrument performance and condition. An example of this is the QCAL QconCAT (Eyers et al.,
2008); QCAL was designed to contain 22 different tryptic peptides, some included a number of
times, and peptide masses selected to cover a wide range of m/z for MALDI-TOF and ESI-MS.
The standard can be used for instrument calibration and to assess performance, it can also act
as a common standard between laboratories to facilitate better exchange and standardisation
of data.
Aims and Objectives
2. Aims and Objectives 35
Aims and Objectives
35
2. Aims and Objectives
QconCAT technology was designed to be used as a tool in proteomics for multiplexed
quantification of several target proteins. In this thesis I demonstrate how the QconCAT
methodology can be streamlined and the production process can be multiplexed, ultimately
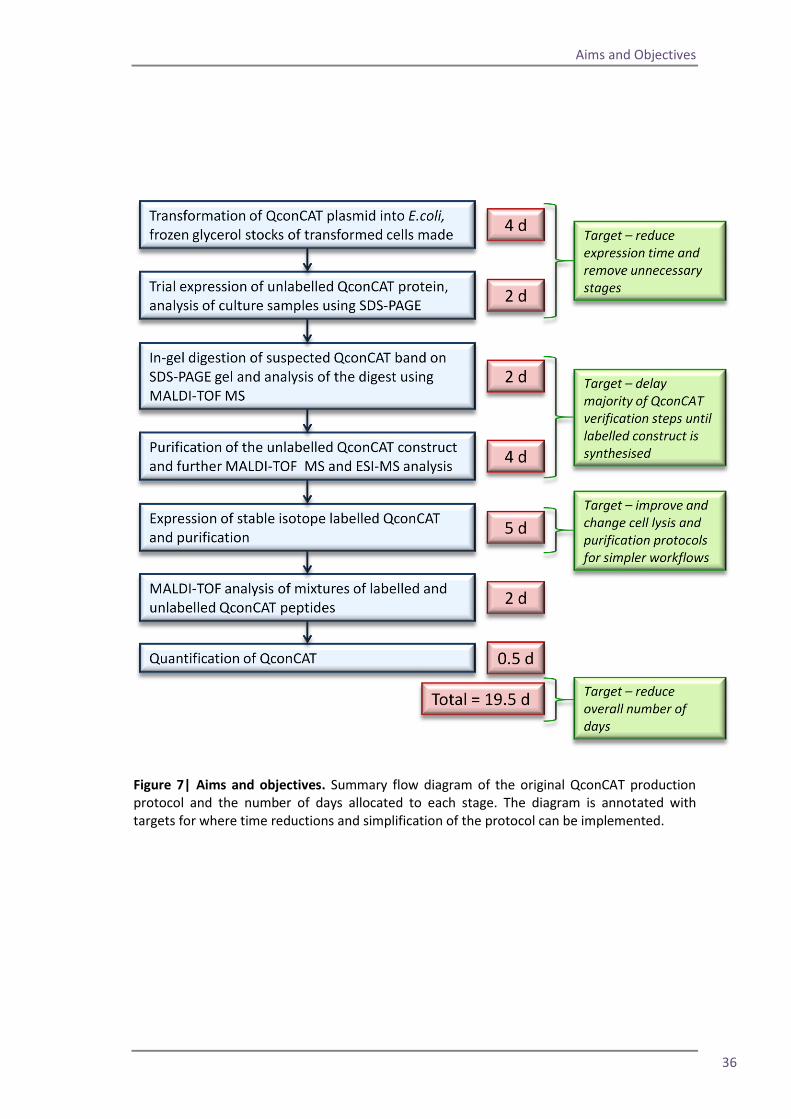
leading to a significantly shorter and simpler workflow. Figure 7 shows the overall workflow
which is taken from the protocol originally published in 2006 (Pratt et al., 2006). The target
boxes in green highlight the areas where the workflow can be developed in order to shorten
and streamline the QconCAT protocol.
My first objective was to remove unnecessary stages from the production process in order to
shorten the overall production time frame. I investigated if it was possible to remove the re-
streaking of newly transformed QconCAT colonies and to eliminate the necessity for an initial
trial induction of the QconCAT. The reproducibility of the QconCAT expression process was
assessed to gauge whether the verification of the QconCAT construct could be delayed until
after the stable isotope labelled protein was synthesised.
I investigated alternative methods of E.coli cell lysis and protein purification to establish
whether more rapid methods could be used. Additionally I sought to find methods which
would allow for multiplexing of QconCAT purification, improving the efficiency of the
production workflow.
Finally I intended to demonstrate how QconCAT constructs can be used for more than
quantification studies. With a study into 10 well characterised QconCAT proteins I considered
the possible methods that could be used for quantification of the QconCAT standards and
whether there are other potential applications for QconCATs as quality control standards.
Aims and Objectives
36
Figure 7| Aims and objectives. Summary flow diagram of the original QconCAT production protocol and the number of days allocated to each stage. The diagram is annotated with targets for where time reductions and simplification of the protocol can be implemented.
Materials and Methods
3. Materials and Methods 38 3.1 Transformation 39 3.2 Glycerol stocks 39 3.3 Expression via LB IPTG 39 3.4 Expression via minimal media IPTG 40 3.5 Expression via autoinduction – unlabelled and stable isotope
labelled cultures 40 3.6 Cell lysis using BugBuster 40 3.7 Cell lysis using sonication 40 3.8 Purification with the NiMAC column method 41 3.9 Preparation of purification fraction samples for SDS-PAGE
analysis 41 3.10 Purification with the spin column method 42 3.11 Purification with Protino Ni-TED resin 42 3.12 Solubilisation in RapiGest as an alternative to purification 43 3.13 Protein assay 43 3.14 1D SDS-PAGE gels 43 3.15 Western blotting 43 3.16 In-gel digests 44 3.17 In-solution digests 44
3.18 Preparation for MALDI-TOF analysis of digests 44
Materials and Methods
38
3. Materials and Methods
Reagents used are purchased from Sigma Aldrich, Dorset, UK including: Amino acids, both
unlabelled and stable isotope labelled [13C6]Arginine and [13C6]Lysine | Ampicillin salt | α-
10mM, 20mM or 250mM imidazole respectively (pH8.0). Up to 20ml bind buffer was used to
solubilise the inclusion bodies (prepared from a 50ml culture cell pellet) containing the
QconCAT. After 30min incubation at room temperature with agitation to solubilise the
QconCAT the solution was filtered through a 1.2μm syringe filter to remove insoluble material.
The column was prepared with ultrapure water and equilibrated with bind buffer before
loading the solubilised material onto the column (the starting material); the flow through from
loading was collected and retained for 1D SDS-PAGE analysis. The column was washed with
bind and wash buffers before eluting the QconCAT from the column with the elute buffer.
Washes and elutes were collected in 1ml fractions.
3.9 Preparation of purification fraction samples for SDS-PAGE analysis
Samples of 20μl were taken from representative column fractions; for example the flow
through, the first three 1ml fractions of the bind, the first three 1ml fractions of the wash and
all of the 1ml fractions of the elute. A volume of 10μl StrataClean resin suspension was added
to each sample along with 0.5ml water. Each sample was vortexed for one minute to allow the
resin to bind the solubilised protein in the sample. The resin was washed with water to ensure
the buffer components, especially guanidine hydrochloride, were removed. Reducing sample
buffer was then added to the resin to allow the bound proteins to be released and the
samples analysed on a 1D SDS-PAGE gel. The elution fraction(s) which contained the majority
of the QconCAT protein were selected for dialysis. The fractions were dialysed against 50mM
Materials and Methods
42
ammonium bicarbonate solution over a period of ~20hrs at 4°C. The QconCAT solution was
then removed from dialysis and stored at -20°C.
3.10 Purification with the spin column method
Buffers used for this method are similar to those used for the Ni-MAC column purification
method, however for spin columns the buffers do not contain sodium chloride and the
amounts of imidazole are slightly different; 10mM imidazole for bind buffer, 30mM imidazole
for wash and 300mM imidazole for elute (all three buffers pH8.0). Unlike the Ni-MAC column
purification, either one or two pellets of inclusion bodies (arising from one or two cell pellets,
each from 50ml of culture) can be purified at one time. Each inclusion body pellet was re-
suspended in 1ml of bind buffer. The Ni-Superflow Resin was supplied as a slurry in ethanol,
the ethanol was removed and the resin equilibrated in bind buffer before addition of the 1ml
re-suspended inclusion bodies. A further 3ml or 6ml of bind buffer was added to the resin
(depending on whether one or two inclusion body pellets are used) and the suspension was
incubated with the resin for one hour at room temperature with agitation. The resin was then
transferred to a midi spin column and the solution drawn through the resin with 200 x g
centrifugation, the flow through was retained. In the same manner, the resin was washed
using wash buffer and then the QconCAT eluted using elution buffer. The samples were
treated with StrataClean resin, analysed using SDS-PAGE and dialysed as in method 4.9.
3.11 Purification with Protino Ni-TED resin
The Protino resin can be supplied in pre-packed columns, the method here used the free resin.
A pellet of inclusion bodies (from a 50ml sonicated cell pellet) was resuspended in 10ml LEW
buffer (recipe as above) to wash the inclusion bodies, the suspension was then centrifuged
(10,000 x g 30min 4°C) and the resulting pellet was re-suspended in 2ml denaturing
solubilisation buffer (50mM NaH2PO4, 300mM NaCl, 6M Gu.HCl pH8.0), the suspension was
stirred on ice for 60 minutes. Remaining insoluble material was removed by centrifugation
(10,000 x g 30min) and the supernatant retained. Protino resin was weighed out into the
disposable column (1g) and equilibrated with denaturing solubilisation buffer before addition
of the solubilised inclusion bodies; the column drained by gravity and the flow through was
collected and retained. The column was washed with denaturing solubilisation buffer and then
the QconCAT eluted using elution buffer (50mM NaH2PO4, 300mM NaCl, 6M Gu.HCl, 250mM
imidazole pH 8.0). Method 4.9 was used to treat the fractions with StrataClean resin before
analysis with 1D SDS-PAGE and dialysis.
Materials and Methods
43
3.12 Solubilisation in RapiGest as an alternative to purification
The inclusion bodies pellet resulting from sonication in 50mM phosphate buffer was taken
and washed three times with 50mM ammonium bicarbonate. 500μl of 4mg/ml RapiGest
solution (0.4% w/v solution) was added to the final pellet, which was then re-suspended and
DTT added to the suspension (1mM final concentration). The suspension was incubated at
37°C with agitation for one hour to solubilise the QconCAT and then the insoluble material
was pelleted (17136 x g). The supernatant was removed and diluted by the addition of 1.5ml
25mM ammonium bicarbonate (25ml solution plus 1 x complete EDTA-free protease inhibitor
tablet, 1.5ml aliquot used); the resulting QconCAT solution was stored at -20°C.
3.13 Protein assay
For some purified QconCAT samples a protein assay was performed. Bovine serum albumin
(BSA) was used as a standard for the assay; concentrations of 10mg/ml, 20mg/ml, 30mg/ml,
40mg/ml and 50mg/ml of the standard were used to construct a standard curve. Appropriate
dilutions of the analyte protein solution were made so that the concentration fell in the range
of the standard curve. Coomassie PlusTM protein assay reagent was mixed 2:1 with standards
and analyte samples in duplicate. The absorbance at 620nm was measured using a Labsystems
Multiscan Ascent colourimetric analyser and by comparing the absorbance of the analyte
samples against the BSA standard curve the concentration of the analyte solution was
calculated.
3.14 1D SDS-PAGE gels
12% reducing gels and reducing SDS-sample buffer were used. BioRad Broad Range Molecular
Markers added to each gel.
3.15 Western blotting
Western blotting was used to assess the expression of a QconCAT if the QconCAT band was
not obviously present on a 1D SDS-PAGE gel. The standard method for western blot transfer of
a 1D SDS-PAGE gel was used (Towbin et al., 1979). To develop the western blot Anti-HisTag
Monoclonal Antibody was used at a concentration of 0.05μg/ml, followed by Anti-mouse and
Anti-Biotin antibodies (1 in 3000 dilution of supplied stock). In the dark room the
nitrocellulose was then incubated for one minute in the mixed SuperSignal West Pico
Materials and Methods
44
Chemiluminescent Substrate solution before addition of x-ray film for up to five minutes. The
nitrocellulose was stained using Ponceau S.
3.16 In-gel digests
1mm3 plug was removed from a band of interest on a 1D gel. This plug was then destained in a
2:1 solution of 25mM ammonium bicarbonate/acetonitrile. The plug was treated with DTT and
Iodoacetamide (IAM) before dehydration in 100% acetonitrile. 10μl of trypsin (12.5ng/μl) was
added to the dehydrated plug and incubated for 16hrs at 37°C. After this time the digest was
stopped by the addition of 1% v/v formic acid (final concentration).
3.17 In-solution digests
An appropriate amount of protein was selected and diluted to bring the volume up to 160μl.
The protein was then treated with 0.05%w/v final concentration of RapiGestTM at 80oC for
10min, 3mM final concentration DTT 60oC for 10min and 9mM final concentration IAM room
temperature for 30 minutes before addition of trypsin in a 50:1 ratio to the protein content of
the digest. The final volume of the digest is 200μl. An overnight incubation was performed at
37oC after which TFA was added to a final concentration of 0.5%(v/v), this acidification step
hydrolyses the RapiGestTM and causes it to precipitate, it can then be removed from the
solution by centrifugation leaving a clean digest ready for LC-MS analysis. During the course of
its use the in-solution digest protocol was modified slightly and these changes are detailed in
the results when used.
3.18 Preparation for MALDI-TOF analysis of digests
The sample, for analysis by MALDI-TOF, was mixed 1:1 with a 10mg/ml solution of α-cyano-4-
hydroxycinnamic acid in 50% v/v acetonitrile/0.1% v/v trifluoroacetic acid in HPLC grade water
(matrix solution). Calibrants for the instrument were also mixed in the same 1:1 ratio with
matrix. 2μl of the calibrant and of each sample were spotted onto a target.
Results and Discussion
4. Results and Discussion 46 4.1 Production of QconCAT EB1 with the original protocol 46
Section 1: modifying the QconCAT production protocol 54 4.2 Reducing expression time 54 4.3 Alterations to the cell lysis protocol 57 4.4 Alternations to the purification protocol 62
Spin column 62 Flow through study 66 RapiGest solubilisation 69 4.5 The optimised method and troubleshooting 75
Section 2: QconCAT protein as a quality control standard 77 4.6 Methods for quantification of the QconCAT standards 79 Densitometry 80 Protein assay 82 Quantification using the GluFib peptide 82 Label-free quantification 89 Summary 95 4.7 QconCATs to assess instrument performance 95
Results and Discussion
46
4. Results and Discussion
4.1 Production of QconCAT EB1 with the original protocol
The EB1 QconCAT was synthesised for Dr Emøke Bendixen and Dr Stine L. Bislev (Bislev et al.,
2012). The construct consists of 40 peptides in a stoichiometric 1:1 ratio targeted to 20
proteins which are indicators of the bovine host response to mastitis pathogens and
inflammation. A peptide map shows the 44 tryptic peptides included in the construct (Figure 8
(a)). There are two peptides targeted to each of the 20 proteins and the order of the peptides
within the construct is optimised for maximum expression. At the N-terminus of the QconCAT
there is a sacrificial peptide followed by a GluFib peptide which, as mentioned earlier, can be
used for quantification. At the C-terminus there is another quantification and verification
peptide, Fib, and finally the His-Tag sequence for purification.
EB1 was made using a slightly altered version of the original QconCAT production protocol
(Beynon et al., 2005; Pratt et al., 2006). The production process requires a time allocation of
approximately 16 days to produce a product which is highly pure, well verified and suitably
concentrated. The QconCAT plasmid was transformed into BL21 DE3 E.coli and the
transformed cells selected for by antibiotic resistance to ampicillin; the antibiotic resistance
gene in the QconCAT plasmid vector selectively allows the growth of only transformed cells on
the antibiotic-containing agar plate. In this method the transformed colonies were re-streaked
for a second overnight growth. Re-streaking of colonies ensures correct selection of a colony
containing the plasmid and allows the plates to be re-used for up to two weeks after initial
overnight growth (Brown, 1991). Using a colony from the re-streaked plate, a small LB broth
was inoculated and after another overnight growth at 37°C the turbid culture was used to
make glycerol stocks of the QconCAT-plasmid-containing cells. The turbid culture was also
used to inoculate a further LB broth for trial-expression. After induction and a suitable growth
time to allow for the QconCAT to be expressed to sufficient levels, a final culture sample was
taken and the remaining culture discarded. The samples were analysed using 1D SDS-PAGE
(Figure 8 (b)).
Results and Discussion
47
AB
20
0.0
11
6.3
66
.2
45
.0
31
.0
21
.5
14
.0
6.5
97
.4
(b)
(c)
kDa
IPTG
02
04
06
08
01
00
12
01
40
16
01
80
20
02
20
24
02
60
28
03
00
32
03
40
36
03
80
0.0
0.2
0.4
0.6
0.8
1.0
1.2
1.4
1.6
1.8
2.0
2.2
2.4
2.6
2.8
Absorbance (@600nm)
Tim
e (
min
s)
Figu
re8|
EB1
pe
pti
de
map
,E.c
oli
cult
ure
and
exp
ress
ion
of
the
Qco
nC
AT.
(a).
Tryp
tic
pep
tid
esin
Qco
nC
AT
EB1
ann
ota
ted
wit
hth
ep
rote
ins
tow
hic
hth
ep
epti
des
are
targ
ete
d.(b
).G
row
thcu
rve
for
EB1
Qco
nC
AT
trai
lin
du
ctio
ncu
ltu
re.A
rro
ws
Aan
dB
are
tim
ep
oin
tsw
here
pre
-in
duct
ion
and
post
-in
du
ctio
ncu
ltu
resa
mp
les
we
rere
mo
ved
for
SDS-
PA
GE
anal
ysis
,IP
TGar
row
ind
icat
es
140m
inti
me
po
int
ofin
du
ctio
n.(c
).1D
SDS-
PA
GE,
cell
sam
ple
sfo
rth
ege
llys
edin
wat
er
toa
volu
me
wh
ich
resu
lts
inth
eco
nce
ntr
atio
nof
cell
con
tent
sbe
ing
con
sist
en
tfo
ral
lsa
mp
les.
Arr
ow
ind
icat
es
the
pre
sen
ceo
fa
new
ban
din
the
post
-in
du
ctio
nla
ne,
susp
ect
ed
tob
eth
ee
xpre
ssed
Qco
nC
AT.
(a)
A
B
Results and Discussion
48
Post-induction with IPTG a new protein band at ~56kDa is seen on the SDS-PAGE gel that was
not visible pre-induction (Figure 8 (b)). This is the approximate mass for the QconCAT and the
size of the band indicates a large amount of expressed product; over-expression is regularly
seen with QconCATs. To verify the product was EB1, two 1mm3 spots were cut from the
suspected QconCAT band and in-gel digestion performed. A sample of the digest was then
mixed in a ratio of 1:1 with a solution of α-cyano-4-hydroxycinnamic acid matrix and analysed
using MALDI-TOF MS (Figure 9).
Results and Discussion
49
30
13
60
.6
11
13
52
.7
800
1000
1200
1400
1600
1800
2000
2200
0
50
100
% intensity
m/z
22
13
71
.7
39 8
18.4
25
86
0.4
12
95
8.6
18 9
67.5
10
98
0.6 8
10
08
.5
40
10
30
.624
10
60
.5
41
10
97
.519
11
68
.65 12
10.6
23
1193
.5
38
12
73
.6
26
13
24
.77 1
36
1.7
14
28
14
17
.7
1380
.7
43
14
41
.6
4 14
76.6 3
7
1514
.62 1
57
0.6
9 1
59
3.8
34
16
59
.7
35
1702
.8
27
18
10
.8
42
&3
2
1827
.81
82
8.9
29
18
82
.8
20-
21
18
96
.8
33
1952
.9
3 1
96
6.9
17-1
8 2
13
6.1
36 &
15
16
16
.81
61
8.9
(a)
(b)
13
1904
.9
44
14
09
.6
Figu
re9|
In-g
el
dig
est
ion
of
Qco
nC
AT
EB1.
(a).
MA
LDI-
TOF
spe
ctru
mre
sult
ing
fro
min
-ge
ldig
est
ofQ
con
CA
TEB
1ex
pre
ssio
nb
and
(un
labe
lled
cultu
re).
Sign
ific
ant
pe
aks
exp
lain
edw
ith
lab
elo
fpe
pti
den
um
be
ran
dm
/zva
lue
,ap
art
fro
mtw
ope
aks
(125
6.56
and
1856
.8)
wh
ere
the
mas
sco
uld
be
attr
ibut
edto
am
od
ific
atio
no
fa
Qco
nC
AT
pept
ide.
(b).
Pep
tide
map
show
sin
gree
nth
ep
epti
des
seen
inth
eM
ALD
I-TO
Fsp
ect
rum
.Th
eye
llow
pep
tide
sap
pear
toge
the
ras
am
isse
dcl
eav
age
but
are
no
tid
en
tifi
ed
ind
ivid
ual
ly.
Results and Discussion
50
The MALDI-TOF mass spectrum for the EB1 in-gel digest is complex and m/z values for all but
three tryptic peptides are seen (Figure 9). It is expected that not all of the peptides will be
seen in a MALDI-TOF spectrum, especially those at a lower m/z due to interference from
matrix ion peaks. The high proportion of coverage of the QconCAT illustrated in the peptide
map, coupled with the presence of peptides from the entire length of the sequence, confirm
that the correct full length product has been made. The m/z for a missed cleavage between
T20 and T21 has been identified; this suggests that digestion of that peptide bond was not
complete. The sequence covering the missed cleavage site is:
T20 T21
SETACHPLGKDQPTIDK
|----| Missed cleave site
Aspartic acid (D) is an acidic amino acid residue and the presence of this residue in the P1’
location (first amino acid after the basic lysine cleavage site) could affect the cleavage of the
peptide bond leading to incomplete digestion (Brownridge et al., 2011).
No other missed cleave m/z values are seen however missed cleaves could be too large to
appear in the mass range analysed in this MALDI spectrum. As a digest to show the presence
of the full length QconCAT the data is sufficient but complete digestion of the QconCAT
cannot be shown.
Once the correct QconCAT product was confirmed the stable isotope labelled QconCAT was
made. An LB broth was again inoculated with a single colony. The turbid culture was used to
inoculate a second starter culture of 10ml minimal media broth, this broth contains no amino
acids; minimal media with [13C6]arg and [13C6]lys amino acids is inoculated using this second
starter culture. The amino acids contained in the minimal media are incorporated into any
new protein the E.coli cells synthesise, this includes the QconCAT. Expression of the QconCAT
was induced and the culture harvested after the suitable growth time. Expression of the
QconCAT is indicated with an arrow to the QconCAT band (Figure 10 (a)).
The culture was harvested into cell pellets resulting from 50ml of culture each. Because the
culture produces more than is usually required in quantification studies only one cell pellet is
processed at a time. For QconCAT EB1 the cells were lysed using BugBuster, which is a
detergent reagent which acts to disrupt the cell membrane causing a release of the cell
contents. Insoluble inclusion bodies (IBs) were recovered by centrifugation and SDS-PAGE was
used to verify the presence of the QconCAT in the IBs. The IBs were then solubilised in a buffer
Results and Discussion
51
containing guanidine hydrochloride to denature the protein, and purified using the Ni-MAC
purification protocol.
Figure 10| EB1 heavy isotope labelling and NiMAC purification. (a). Expression of the QconCAT indicated by the black arrow. (b). Starting material of solubilised IBs, the flow through, binding (B) washes (W) and elutions (E) from the column all sampled and analysed using SDS-PAGE. QconCAT band in E1-E6 is the majority or sole band present.
NiMAC Purification of the QconCAT elicits a highly pure product; this can be seen from the
SDS-PAGE analysis (Figure 10 (b)). The QconCAT band is either the sole band in the elution
fraction (E1, 3, 4, 5, 6) or the major band occupying the majority of the lane (E2). The elution
buffer contains high levels of sodium chloride, guanidine hydrochloride and imidazole
therefore dialysis is required to exchange the buffer to one more suitable for protein storage
and compatible with MS analysis; the buffer usually used is 50mM ammonium bicarbonate. In
the case of QconCATs that contain cysteines in their sequence there is a risk of di-sulphide
linkages forming and causing the QconCAT to fold and precipitate. QconCAT EB1 contains
seven cysteines which are shown in the QconCAT sequence below (orange). To prevent
precipitation, DTT (a strong reducing agent) was added to the dialysis buffer to a final
concentration of 1mM in order to reduce any disulphide bridges that might occur. A protein
assay was performed on the dialysed QconCAT and the concentration calculated to be
The EB1 sequence follows the typical example set out in the introduction. Each peptide is
indicated below the sequence. Q1 is the sacrificial peptide, Q2 the GluFib peptide (in purple)
Q3-42 are the quantification peptides, Q43 is Fib (in purple) and Q44 is the hexahistidine tag
(in blue) The location of the arginine and lysine residues, which denote the cleavage site for
each peptide, are indicated with arginine in red and lysine in green.
The final verification step for the QconCAT is to establish that it is fully labelled. An in-solution
digest was performed on the purified QconCAT and analysed using MALDI-TOF MS (Figure 11).
Results and Discussion
53
1000
1200
1400
1600
1800
2000
0
50
100
% intensity
m/z
EB
1 in-s
olu
tio
n d
ige
st unla
blle
d
EB
1 in-s
olu
tio
n d
ige
st la
be
lled
37
1
51
4.6
9 1
59
3.8
15
1
61
8.9
(a)
(b)
2 1
57
0.6
Figu
re11
|La
be
lle
dan
du
nla
belle
dEB
1Q
con
CA
Tsp
ect
ra.(
a).P
air
of
MA
LDI-
TOF
spe
ctra
ofst
able
isot
ope
lab
elle
dQ
con
CAT
EB1
in-s
olu
tio
nd
ige
stsh
own
inb
lack
,o
verl
ayin
gsp
ect
rum
ofu
nla
be
lled
EB1
in-s
olu
tio
nd
iges
tsh
own
inre
d.P
eak
ssh
owa
mas
ssh
ift
up
the
m/z
scal
efo
rth
est
able
iso
tope
lab
elle
dQ
con
CAT.
This
shif
tap
pe
ars
acro
ssth
ee
nti
rem
/zra
nge
.(b
).Zo
om
ed
ino
nse
ctio
no
fth
esp
ect
rum
sho
win
gth
e+
6Da
mas
ssh
ift
for5
EB1
tryp
tic
pe
pti
de
s.
1500
1520
1540
1560
1580
1600
1620
1640
0
25
50
75
100
Intensity (%)
m/z
Results and Discussion
54
In Figure 11 the +6Da mass shift for each QconCAT peptide is clearly visible compared against
the spectrum for the light QconCAT. The intensities for the peptides do not exactly match
between heavy and light forms however there is good correlation and some level of error is
expected due to inherent errors in pipetting and variability in MALDI ionisation. The increased
mass for each peptide across the entire mass range shows that the QconCAT has been
successfully labelled and indicates full labelling. The QconCAT is therefore suitable for use in
quantification studies.
Section 1: modifying the QconCAT production protocol
In order to produce QconCAT EB1 a number of set protocols were used, these successfully
resulted in the required standard and were originally chosen for a number of reasons; cost
effectiveness, ease of use, most effective results or equipment available. However depending
on the number of QconCATs required and the time scale being worked to, the process could
be considered lengthy and it does not easily lend itself to multiplexing. Many of the methods
used can be changed, and during the course of my work with QconCATs I have made
developments to the protocols in order to reduce time and cost of production.
The QconCATs used during the rest of this study all pertain to the LOLA COPY project which is
a BBSRC funded project aiming to quantify over 4000 proteins in the S.cerevisiae proteome,
using QconCAT as the quantification strategy. QconCATs associated with this project are
referred to as “COPYCATs” and are numbered in order of design date. The abbreviation “CC” is
used for COPYCAT followed by a three digit number and the majority of further QconCATs will
be referred to in this way.
4.2 Reducing expression time
The simplest step to consider removing from the protocol was re-streaking the transformed
E.coli colonies before inoculation of an LB broth. In some cases it possible that a gene coding a
recombinant protein can be excised from the pET 21a plasmid, the E.coli retains the plasmid
so retains the additional properties, essentially the ampicillin resistance the plasmid confers,
however the coding sequence for the protein is lost. If this occurs the E.coli colony will still
grow on selective ampicillin agar plates, however expression of the recombinant protein from
that colony is not possible. When a colony is re-streaked the morphology of the resulting
colonies can be studied and a colony selected that has a typical morphology. In this way the
probability of selecting a colony containing the full recombinant protein gene is increased.
Results and Discussion
55
However for QconCAT transformation the colony morphology from the first plating is regularly
seen to be uniform which indicates universal uptake of the plasmid and retention of the
QconCAT gene, therefore the re-streaking step was removed and inoculation with a freshly
transformed colony seemed to have no detrimental effect on the culture. Removing this step
reduces the production time by 1 day.
The QconCAT is usually expressed in unlabelled form initially to check for expression and to
verify that the correct product is being synthesised. After production of a large number of
QconCATs it became clear that expression was consistently successful (Figure 12), for each of
these QconCATs we observed expression of the correct protein construct. We saw no
evidence for an incorrect, truncated or otherwise altered QconCAT being synthesised and this
indicated that verification of the QconCAT product was not necessary for the continuation to
stable isotope labelling. The production protocol was altered to eliminate the initial unlabelled
expression and MALDI-TOF verification of the QconCAT; transformed colonies were instead
taken on to immediate expression in minimal media with stable isotope labelled arginine and
lysine. This “straight to heavy” approach removes at least six days from the production time.
In ~85% of cases this approach is highly successful, however in ~15% of cases a QconCAT
construct has failed to express. In these situations the heavy amino acids used in the culture
are wasted, however the infrequency of this occurrence means that the benefits of removing
a number of days from production time outweigh the negatives.
Reduced expression time -6d and removed verification -6d
Results and Discussion
56
044
-+
049
-+
045
-+
047
-+
048
-+
051
-+
052
-+
053
-+
056
-+
058
-+
060
-+
054
-+
059
-+
06
1-
+
00
2-
+02
2-
+04
1-
+00
1-
+04
2-
+04
3-
+02
1-
+
Figu
re12
|C
on
sist
en
tsu
cce
ssfu
lexp
ress
ion
of
Qco
nC
ATs
.Dat
ain
this
figu
reu
sed
inB
row
nri
dge
et.
al.2
011.
Seri
es
of
SDS-
PAG
Ege
lim
ages
of
pre
(-)
and
po
st(+
)in
du
ctio
nti
me
po
ints
amp
les
for
21Q
con
CA
Ts.Q
con
CA
Tb
and
sin
dic
ate
dw
ith
anar
row
.
Results and Discussion
57
4.3 Alterations to the cell lysis protocol
E.coli cells expressing EB1 QconCAT were lysed using BugBuster, a method which had been
used a number of times in our lab successfully and which worked well for EB1. However with
three QconCATs – CC001, CC002 and CC003 this method failed. CC001-003 expressed well in
stable isotope labelled form (Figure 13 (a)), the cells were lysed using BugBuster, the inclusion
body pellets solubilised and purified with nickel-affinity chromatography NiMAC cartridge.
SDS-PAGE analysis of the fractions eluted from the Ni-MAC cartridge revealed a number of
contaminant bands present in the elution lanes, in addition to the QconCAT band (Figure 13
(b)). The SDS-PAGE gel for CC001 was selected and in-gel digestion was performed on the
contaminant bands to establish the nature of the contaminants. Two potential sources were
considered, either fragmentation of the QconCAT had produced these bands, or inefficient
purification could have left E.coli proteins from the inclusion bodies in the eluate. The in-gel
digests was analysed using MALDI-TOF MS and the results, although giving low coverage of
the QconCAT, clearly indicated that the bands had resulted from QconCAT fragments rather
than E.coli proteins (Figure 13 (c)).
Next, the stage at which the QconCAT fragmented needed to be identified; the likely points
could have been either immediately, as the QconCAT was expressed, during cell lysis, or
during purification. An anti-Histag western blot was performed on the end-time-point samples
from culture. This would show whether any fragments containing the HisTag were present
during production and therefore whether the QconCAT was being fragmented immediately
after synthesis. The western blot (Figure 14 (a)) shows a single his-tagged band for each time
point sample; this shows a strong chance that the QconCAT was not fragmented in the intact
cell. There is a possibility that the QconCAT had fragmented but that the fragments had lost
their HisTag and so were not visible via western blot, but as the in-gel digests showed peptides
which all came from the HisTag end of the QconCAT this is less likely.
Results and Discussion
58
Figure 13| Expression and purification of CC001-003. (a). SDS-PAGE, pre and post induction time point samples, whole cell lysate from E.coli culture, QconCAT band is seen in the post-induction lane for each indicated by a black arrow. (b). SDS-PAGE showing the starting material and eluted lanes 1 and 2 from purification of the expressed QconCAT, large number of bands present in the elution lanes in addition to the desired QconCAT band. (c). Peptide maps shows the coverage of QconCAT CC001 from the in-gel digest of the highlighted bands.
Results and Discussion
59
Figure 14| Western blots tracking the fragmentation of CC001-003. (a). Whole cell lysate end time-point samples from unlabelled (light) and labelled (heavy) culture. QconCAT band visible, very small or no fragment bands seen. (b). Sonicated inclusion bodies and soluble fraction, very small or no fragment bands seen.. (c). Soluble fraction and inclusion bodies blot with and without Benzonase Nuclease (+/-B). (d). NiMAC purification of CC001 inclusion bodies. Starting material contains the QconCAT band and additional bands, E1 and E2 contain QconCAT the elution as the sole band.
It was observed that some of the bands in the elute lanes of the purification gels can also be
seen in the starting material, for example with CC003 as indicated on the gel image by ret dots
(Figure 13 (b)). This suggests that the QconCAT was already fragmented before it was loaded
on to the column. This left two possibilities – either the QconCATs were fragmenting during
Results and Discussion
60
cell lysis or fragmenting during solubilisation of the inclusion bodies. To test if the
fragmentation was occurring during cell lysis the method of lysis was changed to sonication.
After sonication, the soluble fraction and the insoluble pelleted material were analysed using
SDS-PAGE and western blot performed to look for HisTag bands. In the western blot (Figure 14
(b)) some QconCAT is visible in the soluble fraction but the majority is in the insoluble pelleted
material. Although there is clear overloading of QconCAT material there are no signs of
fragmentation. It therefore looked likely that the source of the fragmentation was during
BugBusting.
There should not be any enzymes in the BugBuster solution, BugBuster is reported to disrupt
cell membranes without damaging proteins (Novagen® product information) and it is a
reagent which has been used successfully in our lab for quite some time therefore it was
considered that the source of the fragmentation could be added during BugBusting.
Benzonase nuclease is added during BugBusting and it was considered that this might be a
source of proteases which could cause the fragmentation. This hypothesis was tested with
COPYCAT CC002. A cell pellet was resuspended in phosphate buffer for sonication, the
suspension was sonicated using the standard protocol and then two samples of this material
were taken – to one sample buffer containing Benzonase nuclease was added, to the other
just sample buffer was added. This was allowed to incubate for a short time before
centrifuging to pellet the insoluble material. The supernatant was decanted and samples of
the pellet and supernatant were analysed using western blot. Figure 14 (c) shows that the
Benzonase nuclease appeared to have no fragmentation effects.
The source of the fragmentation was still unknown, contaminants in that particular batch of
BugBuster could have introduced proteases to the solution, however the alteration of lysis
method solved the fragmentation problem. A comparison was drawn between sonication and
BugBuster (Table 1).
Results and Discussion
61
Criteria BugBuster Sonication
Time per sample 76m
2m resuspension
22m solubilisation
1m transfer
20m centrifugation
5m resuspension
5m incubation
1min vortex
20min centrifugation
19m
1m resuspension
10m sonication
8m centrifugation
Suitability for multiplexing
Centrifugation, solubilisation and
incubation steps can be
multiplexed
Centrifugation step can be
multiplexed
Time increase for multiple
9m per sample 10m per sample
Time for typical 8 samples
139m 89m
Table 1| Comparison between BugBuster and sonication methods of cell lysis
Sonication takes less time than BugBusting whether processing a single QconCAT or 8
QconCATs in parallel. The change of cell lysis method reduced production time, making it
possible for cell lysis and purification protocols to be easily completed in one day. The
insoluble inclusion body material of each QconCAT CC001-003, resulting from sonication, was
taken on to nickel affinity purification and the eluted QconCAT contained no fragment bands
(Figure 12 (d)). Sonication was adopted as the standard cell lysis protocol.
Reduced cell lysis time up to -½d
Results and Discussion
62
4.4 Alterations to the purification protocol
SPIN COLUMN
Purification of the QconCAT from the whole-cell lysate is achieved by nickel affinity
chromatography using the HisTag, which is included in each construct. The standard
purification method used for EB1 was Ni-MAC cartridge. The cartridges come ready prepared,
containing nickel immobilised on resin, 1ml of which is packed into a column. Solubilised
QconCAT is loaded onto the column at a rate of about 0.5ml/min, the column is washed and
then the QconCAT eluted off. This method produces a pure product but is time consuming and
difficult to multiplex without the use of a peristaltic pump or simultaneous delivery method.
For this reason other methods were considered. The first of these was spin column
purification using resin from Generon. This method uses the same principles as Ni-MAC
purification, where immobilised Ni2+ ions bind to HisTagged QconCAT and the pure QconCAT is
eluted after washing of the resin. In the case of spin columns the resin is packed into a column
within a centrifuge tube and rather than pumping the liquid through the column at a set flow
rate, the column of resin is centrifuged to bring the liquid through the resin. This method of
flow means that a number of columns can have QconCAT applied at any one time and all
centrifuged simultaneously, thereby multiplexing the purification process.
In order to refine the method, I varied and monitored the volume of resin used, the amount of
IBs used and the volume of binding buffer in which the IBs were added to the resin. The
results of varying these three factors are shown in Figure 15. For the first purification trial (gel
(a)) one IB pellet of CC001 (arising from the sonication of a cell pellet from 50ml of culture,
which should contain ~7.5 x 10¹⁰ cells) was solubilised in 4ml of bind buffer and incubated with
1ml of resin. The reported binding capacity of the resin is up to 15mg/ml resin depending of
the protein. The protein assay of the starting material (shown in Table 2 in Figure 15) gave the
total protein content of the 4ml solubilised IBs to be 3.4mg, it would be expected that the IBs
do not contain just the QconCAT protein, therefore the actual amount of QconCAT would be
less than 3.4mg, however as the majority protein in the solution (see starting material (SM)
band to see the overwhelming presence of the QconCAT) 3.4mg is given as an estimate. As
this amount of protein is less than the reported binding capacity of the resin it was presumed
that 1ml resin should be more than adequate to bind all of the QconCAT. The results showed
that some QconCAT had not bound to the column and had come through in the flow through
but it seemed from the gel that the majority of the QconCAT was present in fractions E1 and
E2. However, the values from the protein assay, in the table, do not reflect the gel; the assay
Results and Discussion
63
indicates 30% of the QconCAT was recovered, therefore a large amount either did not bind to
the column and was washed off, or still remained on the resin. A sample of the resin was
analysed using SDS-PAGE by washing the resin with water before adding reducing sample
buffer and loading approximately 10μl of beads onto the gel; this analysis did not reveal any
protein bands removed from the beads (results not shown). It was therefore likely that a
significant proportion of the QconCAT protein did not bind to the resin in the first instance
and was washed off the column in the flow through.
We have found that, although the amount of QconCAT produced varies between constructs,
on average a 200ml labelled culture (~3 x 10¹¹ cells) provides a minimum of 1.5mg protein,
which is ~25nmol (based on average molecular weight of 60,000Da). Each culture therefore
provides enough material for ~1000 quantification studies if 20-30pmol of QconCAT is used in
each study. The loss of QconCAT during the purification method is therefore not necessarily a
problem, a compromise can be drawn to use a method which is lossy but rapidly generates
enough useable material for the required studies.
Results and Discussion
64
Figure 15| SDS-PAGE of fractions from purifications using spin columns. (a). Purification of QconCAT CC001, 1 IB pellet added to 1ml resin in a 4ml volume. (b). Purification of QconCAT CC002, 1 IB pellet added to 0.5ml resin in a 4ml volume. (c). Purification of QconCAT CC002 1 IB pellet added to 0.25ml resin in a 0.5ml volume Table 2| Protein assay results Comparing the recovery from the different conditions of purification. The largest recovery comes from purification A. (d). Purification of QconCAT CC003, 2 IB pellets added to 2ml resin in a 5ml volume. (e). Purification of QconCAT CC001, 2 IB pellets added to 2ml resin in a 5ml volume.
It was possible that the ratio between the starting material volume and the amount of resin
was not optimal for complete binding; two more purification conditions were screened, one
with half the amount of resin with the same volume of QconCAT (Figure 15 gel (b)) and the
other with a quarter the amount of resin in a quarter volume of QconCAT (Figure 15 gel (c)). In
gel (b) there is a large amount of QconCAT seen in the flow through lane, the protein assay
also reports that much less QconCAT is recovered – 12%. In (c) again a large amount of
QconCAT is seen in the flow through. Additionally there is also QconCAT seen in the washes,
and a number of additional bands in the elute lanes. Although the protein assay shows the
FT W1 W2 E1 E2
(d) – CC003
Purification Starting material total amount Dialysed material total amount Percentage of QconCAT material recovered
amount of recovered QconCAT is not as low as in (b) (17.5% recovered) it is still lower than the
recovery for (a). Lowering the volume of resin used was therefore concluded to be ineffective.
The next investigation was based on the hypothesis that the concentration of the QconCAT in
the starting material was not optimal for complete binding. For (d) and (e) two inclusion body
pellets were used, with 2ml of resin in a volume of 5ml. For CC003, Gel (d), 14.5nmol of
material was recovered. When the conditions were repeated for CC001 there was good
recovery, however the elution contained a number of additional proteins shown by bands
seen in the elute lanes on the gel. Moreover, when 1mM DTT was added to the buffer during
dialysis of CC001 the QconCAT solution turned gradually brown over a period of ~2hr
(previous QconCAT solutions had been uncoloured). This occurred for a number of different
QconCATs under the same purification conditions, the image below(Figure 16) shows an
example of the QconCAT solution after DTT addition:
Figure 16 | Brown QconCAT solution post-dialysis in 50mM ammonium bicarbonate with 1mM DTT
It is likely that the brown solution was an indication that the nickel in the affinity purification
was leaching off the column. Other purification methods had been suggested and the spin
column purification method was abandoned in favour of alternative methods where this
discolouration was not observed.
It was observed that the intensity of the protein bands on the purification gels do not
necessarily reflect the quantities stated in the protein assay; this is likely due to the use of
StrataClean resin. The fractions eluted from the affinity purification column contain imidazole
and guanidine hydrochloride, which need to be removed before running a sample of the
fraction on a gel. In order to do this StrataClean resin is used to bind the protein in the sample
and the resin is then washed to remove unwanted chemicals before loading the resin onto a
gel. Variations in the binding capacity of the resin, the amount of sample loaded onto the
resin in a set volume, the ability of the sample buffer to remove the protein from the resin and
the number of beads that are able to be loaded onto the gel all affect the final amount of
protein seen and could account for the disparity between the two assays.
Results and Discussion
66
FLOW THROUGH STUDY
During the purification process it was noted than QconCAT protein is invariably seen in
analyses of the buffer which flows off the column during loading of the QconCAT (known as
the “flow through”). The binding capacity of NiMAC column resin was reported to be variable
depending on the protein being bound, with an upper limit of 30mg/ml. The presence of
QconCAT in the flow through could be attributed to:
1. The resin being fully saturated therefore unable to bind all of the QconCAT
2. The resin not being incubated with the QconCAT for a long enough period of time
3. The resin not being incubated with the QconCAT in sufficient volume of buffer to
allow complete mixing
4. The QconCAT may have lost the HisTag and therefore be unable to bind to the resin
To investigate which of these was correct a small study was undertaken. QconCAT CC050 was
selected at random for this study. Three cell pellets of CC050, each produced from 50ml of
culture, were used. The pellets were resuspended and sonicated individually. After sonication
the three suspensions were combined and mixed well before removal of 3 x 2ml volumes (the
rest of the solution was retained but not used), the three 2ml volumes were therefore
identical. They were centrifuged for 8min 6000 x g to pellet the inclusion bodies in each; the
pellets were washed once in 25mM AmBic and were then solubilised and purified using
NiMAC cartridge, each pellet taken through a different method.
Method 1: Standard purification; the QconCAT was loaded onto the column followed by bind
buffer, wash buffer and finally elute buffer passed through the column, the QconCAT was
eluted and retained. Samples of each fraction were analysed by SDS-PAGE.
Method 2: Re-applying the flow through; the QconCAT was applied to the column and the
flow through collected as usual (FT 1 sample). The flow through was then immediately passed
through the column a second time and the flow through was collected again (FT2 sample) –
flow through 2 was collected in small fractions with a sample of each fraction removed for
SDS-PAGE analysis, this was to allow for monitoring of the elution profile of the QconCAT if
any remained in FT2. Bind, wash and elute buffers were passed through the column, the
QconCAT was eluted and samples analysed by SDS-PAGE.
Method 3: Two sequential purifications; the specifications for the NiMAC cartridges
recommend only purifying one protein per column but that the column is useable for multiple
rounds of purification of that protein, the column can be washed and stored in buffer at 4˚C to
Results and Discussion
67
be used up to 10 times. For this method the QconCAT was loaded onto the column, flow
through 1 was collected and the purification proceeds according to the standard protocol, the
QconCAT was eluted off the column, the column was then washed in storage buffer, water
and then bind buffer to re-equilibrate the column. Flow through 1 from the first round of
purification was then re-applied to the column; the resin had been washed so should be able
to bind any QconCAT present in the flow through 1. Samples were again collected in fractions
from flow through 2, the purification was then completed according to the usual protocol and
samples analysed by SDS-PAGE.
The results of the study are seen in Figure 17. For gel (c) the QconCAT band can be seen in the
flow through as expected. In gel (d), where the flow through was immediately re-applied to
the column, there is a slight reduction of QconCAT material between FT1 and FT2 but not
significant, there is still a QconCAT band in FT2. In gel (e) QconCAT material can be seen in the
FT1. This material was reapplied to the column after elution and washing. FT2 (gel (f)) still
shows some material is not binding to the column however QconCAT bands can be seen in E1,
E2,E3 and E4 lanes, showing that QconCAT has bound to the column from FT1. The protein
assay results for the purifications do not seem to reflect the gels. In the 3ml recovered after
each purification 1-3, from method 1 0.39mg was recovered, for method 2 0.082mg was
recovered and for method 3 0.36mg was recovered in the first round and 0.18mg in the
second round giving a total of 0.53mg. There is an obvious anomalous result for purification
with method 2. The amount of material recovered is much lower than the other purifications
with no obvious reason as to why this would be; the QconCAT is visible in the elution lanes
and the eluted fractions were all handled and dialysed in the same way for each purification;
this result cannot be used in concluding the results of the study. The results of purification
method 3 show that the QconCAT which comes through in the flow through can be re-bound
to the column and the total amount of protein recovered is greater than with a single
purification round. Tt can therefore be concluded that the QconCAT has not lost the HisTag,
and that this cannot be the reason why the full amount of QconCAT does not bind to the
column. It can be speculated that the likely cause for the QconCAT in the flow through is that
the resin is saturated under the current conditions. However, the sampling through the flow
though 2 for methods 2 and 3 (gels (a) and (b)) showed that the QconCAT elutes into the flow
though continuously rather than saturating the column and then running off, therefore it
could be speculated that the binding conditions are also affecting the amount of QconCAT
which binds the column. A sure solution to acquire more material, as shown by this study, is to
use two rounds of purification.
Results and Discussion
68
MM
SMFT
1FT
2B
1B
2B
3W
1W
2W
3E1
E2E3
E4E5
MM
SMFT
B1
B2
B3
W1
W2
W3
E1E2
E3E4
E5E6
MM
SMFT
1B
1B
2B
3W
1W
2W
3E1
E2E3
E4E5
E6
MM
12
34
56
78
91
01
11
21
3
Ke
y:
SM –
star
tin
g m
ate
rial
CW
–co
lum
n w
ash
FT –
flo
w t
hro
ugh
B1
-3 –
Bin
d f
ract
ion
sW
1-3
–W
ash
fra
ctio
ns
E1-6
–El
ute
fra
ctio
ns
Figu
re17
|Fl
ow
thro
ugh
stu
dy
SDS-
PA
GE
gels
.M
eth
od1.
The
stan
dar
dp
roto
col
and
resu
lts
inge
l(c
).M
eth
od
2.Th
eim
me
dia
tere
-app
licat
ion
of
the
flow
thro
ugh
(FT)
,ge
l(a
)sh
owin
gsa
mp
ling
thro
ugh
the
flo
wth
rou
gh,
resu
lts
inge
l(d
)M
eth
od
3.D
ual
rou
nds
of
pu
rifi
cati
on
with
reap
plie
dfl
owth
rou
gh.
Ge
l(b
)sh
ow
ing
sam
plin
gth
rou
ghth
efl
ow
thro
ugh
,re
sult
sin
gels
(e)a
nd
(f).
Co
lum
n w
ash
ed in
sto
rag
e b
uff
er a
nd
bin
d
buff
er t
o re
-eq
uili
bra
te
So
lub
ilise
d Q
con
CA
T lo
ad
ed o
nto
co
lum
n
Flo
w t
hro
ugh
1 re
app
lied
to
the
colu
mn
Flo
w t
hro
ug
h 2
co
lle
cte
d i
n s
ma
ll f
ract
ion
s to
sa
mp
le t
he
du
rati
on
of
the
lo
ad
ing
Flo
w t
hro
ug
h 1
, bin
d,
wa
sh a
nd
elu
te b
uff
ers
ap
plie
d t
o th
e co
lum
n
Elu
ted
Qco
nC
AT
reta
ined
an
d s
am
ple
s
anal
ysed
So
lub
ilise
d Q
con
CA
T lo
ad
ed o
nto
co
lum
n
Flo
w t
hro
ug
h c
olle
cted
, bin
d w
ash
an
d e
lute
bu
ffer
s ap
plie
d t
o th
e co
lum
n
Flo
w t
hro
ugh
2 c
olle
cted
in s
mal
l fra
ctio
ns
to
sam
ple
the
du
rati
on
of
the
load
ing
So
lub
ilise
d Q
con
CA
T lo
ad
ed
on
to c
olu
mn
Bin
d, w
ash
an
d e
lute
bu
ffe
rs a
pp
lie
d t
o t
he
co
lum
n
Flo
w t
hro
ug
h 1
co
llect
ed
an
d im
me
dia
tely
rea
pp
lied
to
th
e c
olu
mn
Elu
ted
Qco
nC
AT
re
tain
ed
an
d s
am
ple
s
an
aly
sed
Bin
d, w
ash
an
d e
lute
bu
ffe
rs a
pp
lie
d t
o t
he
colu
mn
Elu
ted
Qco
nC
AT
ret
ain
ed a
nd
sa
mp
les
anal
ysed
MM
12
34
56
78
91
01
11
21
3
MM
FT2
B1
B2
B3
W1
W2
W3
E1E2
E3E4
E5E6
CW
Me
tho
d 1
Me
tho
d 2
Me
tho
d 3
(a)
(b)
(c)
(d)
(e)
(f)
Results and Discussion
69
RAPIGEST SOLUBILISATION
The results from the flow-through study suggest that further optimisation of the purification
method would lead to more complete recovery of the QconCAT. Purification is already a
relatively time-consuming process and in a high-throughput workflow could be a significant
rate limiting factor. Whilst the amount of QconCAT recovered is usually adequate for the
quantification studies we perform, depending on the study and the type of analysis more
QconCAT may be required and a “lossy” method could be costly. Further optimisation of
purification would be time-consuming and possibly add further time to the protocol. For this
reason other options were considered. It was observed that in the starting material for a
purification the overwhelming majority protein is QconCAT. The starting material is simply
solubilised IBs, therefore QconCAT is the majority protein in the IBs. Given this fact a possible
alternative to purification was therefore to try using the un-purified IBs; with the QconCAT
being the majority protein the other proteins present would be diluted to a level where they
would become insignificant during use. Additionally the presence of the two internal
quantification peptides means that pure protein is not required for the accurate quantification
of the standard.
For the first trial the IBs of CC001 were washed in 50mM AmBic three times before solubilising
in 6M guanidine hydrochloride and 1mM DTT; this is the same concentration of guanidine
hydrochloride as used in the Bind Buffer for purification. Solubilisation took place over five
hours with the solution agitated on an end-over-end mixer, before centrifuging to pellet the
insoluble material, dialysing it against 50mM AmBic and analysing the soluble fraction via SDS-
PAGE. A comparison was drawn between a sample of Ni-MAC purified CC001 and the washed
CC001 (Figure 18 (a)). There are contaminant bands present in the lane for washed CC001,
however the QconCAT protein is the majority band. Whilst each contaminant band
individually is significantly weaker than the CC001 band it was considered the other methods
of solubilisation might increase the concentration of CC001 in solution and so increase the
percentage relative to other contaminant proteins.
Guanidine hydrochloride was used for the initial trial to solubilise the QconCAT as it is used in
the purification buffers to denature the QconCAT protein to solubilise it. Other solutions to
solubilise the QconCAT were considered, one of which was RapiGest solution. RapiGest is a
standard component of our digest protocols. It is a detergent which is used to disrupt the
structure of the proteins in the digest, allowing trypsin access to the entire length of the
protein to ensure complete digestion. As it disrupts the structure of proteins it was considered
Results and Discussion
70
that RapiGest could help to solubilise the QconCAT, additionally as it is part of our standard
digest protocol the RapiGest would not need to be dialysed out of the solution prior to use of
the QconCAT. An IB pellet of CC001 was sonicated and for ease of use, to give better washing
and for further investigation, the 2.5ml of sonicated material was split between two 2ml tubes
before centrifuging. The soluble fraction was removed (SF1) and a sample retained. The two IB
pellets were then washed three times in 50mM AmBic, samples taken of each soluble fraction
(SF2-4). Finally the two pellets were solubilised in RapiGest – one pellet was solubilised in
250μl of 0.4% RapiGest solution and the other solubilised in 250μl of weaker 0.1% solution.
Each pellet was left for 30 minutes to solubilise, the insoluble material centrifuged and the
soluble fraction removed and retained. The gel image (Figure 18 (b)) shows the more
concentrated RapiGest method results in a greater amount of QconCAT in solution and this
was decided as the best method for solubilisation. The final gel (Figure 18 (c)) shows that if the
0.4% solubilised QconCAT is diluted to a level which is normally seen for an average protein on
a gel, no other protein bands are visible.
For storage the solubilised material was diluted by the addition of 750μl of 25mM AmBic
containing protease inhibitors before aliquotting and storage at -20˚C. On thawing, some
aliquots of different QconCATs developed a precipitate. To prevent this from occurring in
further solubilisations 1mM DTT was added to the RapiGest during solubilisation. Finally,
during the digest protocol the digest is heated to 80˚C after addition of the RapiGest, this level
of heat is not suitable for the QconCAT solubilisation but gentle warming to 37˚C for 1 hour
was added to the protocol to increase the efficiency of the RapiGest solubilisation.
Results and Discussion
71
Figure 18| RapiGest solubilisation development. (a). Comparison of washed and purified CC001 material. (b). Different concentrations of RapiGest solution used to solubilise IB material, with 0.4% being most effective. (c). Diluted RapiGest solubilised CC001 shows a single QconCAT band.
To verify that the QconCAT was the majority protein in the solubilised material and also that
any additional proteins present in the QconCAT solution would not interfere with using the
QconCAT, two further investigations were performed. First, dilutions of the solubilised
QconCAT were analysed by SDS-PAGE and densitometry performed on the protein bands to
analyse the percentage content of each major band in the soluble fraction. The results show
that the solubilised QconCAT occupies 69-80% of the lane on the gel, with an average of ~75%.
In Figure 18, gel (c) shows that increasing dilutions of the QconCAT solution eventually lead to
a lane where only the CC001 band is visible (1 in 100 dilution). This shows that, whilst the
Results and Discussion
72
contamination from E.coli proteins cannot be removed, the solution can be diluted to an
extent where the contaminants are not significant. In a typical digest the QconCAT is diluted
~1 in 35; at a 1 in 20 dilution contaminant bands are still visible and although the QconCAT is
diluted more than this for analysis there was therefore a concern that, even though the
QconCAT was the majority protein in the solubilised material, the lack of purification would
mean the introduction of other proteins into a digest and could affect the MS data and
quantification. To check this, one aliquot of purified CC001 and one aliquot of non-purified
RapiGest solubilised CC001 were digested separately. RapiGest is part of our usual digest
protocol so was used with the purified CC001 for digestion, the key difference between the
two CC001 samples is that one is purified and one is solubilised. The digests were analysed
using LC-MS/MS and the results were compared against an E.coli protein database, the
protein hits for each can be seen in the tables below.
Accession Description mW (Da) Coverage (%)
B1X9B6 Small heat shock protein ibpB 16083 27.46
B1X9B7 Small heat shock protein ibpA 15764 18.97
B1XEK3 Methylmalonyl CoA decarboxylase biotin independent 29153 4.59
B1XBY2 Elongation factor Tu 43286 19.54
B1X6E8 30S ribosomal protein S4 23454 17.47
Table 3| RapiGest solubilised CC001, protein hits from the E.coli database
Accession Description mW (Da) Coverage (%)
B1XEK3 Methylmalonyl CoA decarboxylase biotin independent 29153 4.59
B1X6I9 Elongation factor Tu 43256 15.98
Table 4| Purified CC001, protein hits from the E.coli database
The protein hits found, as expected, are some of the most abundant proteins in E.coli
(Ishihama et al., 2008). The fact that two E.coli proteins were found in the purified QconCAT
digests (Table 4) indicates that whichever method is used for the preparation of IBs,
contaminant proteins cannot be completely removed from the QconCAT solution. The small
increase of protein hits from two, in the purified, to five in the RapiGest solubilised
preparation (Table 3) suggest that there is not a great level of purity lost in simply solubilising
the QconCAT.
Results and Discussion
73
RapiGest solubilisation is only effective if the QconCAT is over-expressed to an extent that the
ratio between QconCAT protein and contaminant proteins is high. The majority of QconCATs
are over-expressed, however some are not expressed to the levels which are required and
these still need to be purified. The QconCAT is not quantified until after solubilisation or
purification, so protein content cannot be easily assessed, and therefore cannot be used as a
deciding factor for how the QconCAT is prepared for use. As a deciding rule the E.coli protein
band indicated by the arrow (Figure 19), an E.coli protein that is present in every expression
culture whole cell lysate, is compared to the QconCAT band (protein identified by Dr Amy
Claydon as outer membrane protein F, PhD thesis “Approaches to understanding the dynamic
proteome”, September 2009). If the QconCAT band is as strong as, or stronger, than the E.coli
protein band then the QconCAT is RapiGest solubilised; if the band is weaker than the E.coli
band then the QconCAT is purified.
Figure 19 | QconCAT selection for purification or RapiGest solubilisation . Whole cell lysate samples from expression cultures, the red dot indicates the expression band. QconCATs CC058 and CC100 were RapiGest solubilised, CC101 and CC102 were purified.
Reduced purification time -1d and enabled multiplexing therefore reducing purification time
further depending on the number of QconCATs being processed
There is an optimal QconCAT production workflow for the majority of “well behaved”
QconCATs, easily multiplexed and high throughput which involves the use of all of the
protocol improvements I have set out so far in this thesis. There are also troubleshooting and
alternative methods for QconCATs which show atypical behaviour. The overall flow diagram
for the optimised methods can be seen in Figure 20.
Results and Discussion
74
Pelle
t
–+
SME
–+
Ad
dit
ion
al
3 d
ays
Ad
dit
ion
al 1
d
ay fo
r p
uri
fica
tio
n
–+
high
leve
l exp
ress
ion
–+
?
low
leve
l exp
ress
ion
no t
angi
ble
expr
essi
on
–+
X
Solu
bilis
ed
Puri
fied
Qco
nC
AT
pla
smid
tr
ansf
orm
ed
in
to B
L21
E.
coli,
pe
pti
de
e
xpre
sse
d w
ith
[1
3C
6]a
rg a
nd
[1
3C
6]l
ys
Re
cove
r in
clu
sio
n
bo
die
s, s
olu
bili
se in
R
apig
est
TM
surf
acta
nt
Re
cove
r in
clu
sio
n
bo
die
s, p
uri
fy u
sin
g N
i-M
AC
car
trid
ge
An
ti-H
is₆
we
ste
rn
blo
t/d
iffe
ren
t e
xpre
ssio
n m
eth
od
s
Re
cove
r in
clu
sio
n
bo
die
s, p
uri
fy u
sin
g N
i-M
AC
car
trid
ge
Qco
nC
AT
de
sign
, de
no
vo g
en
e
syn
the
sis
and
cl
on
e in
to
pET
21
a
Dis
card
Mu
ltip
le
Qco
nC
ATs
in
less
than
7
day
s
Re
de
sign
69
%
9% 22%
3% 19
%
S ME
pu
rifi
cati
on
we
ste
rn b
lots
pu
rifi
cati
on
XQ
con
CA
T d
ige
st, a
bso
lute
q
uan
tifi
cati
on
o
f tar
get
pro
tein
s
Figu
re20
|Th
eo
vera
llQ
con
CA
Tp
rod
uct
ion
wo
rkfl
ow
.Fo
llow
ing
the
ide
alp
rod
uct
ion
pro
toco
lin
gre
en
and
mod
ifie
dp
roto
cols
inye
llow
and
red
for
pro
ble
mQ
con
CA
Ts
Results and Discussion
75
4.5 The optimised method and troubleshooting
In Figure 20, the ideal optimised method is shown. The green top line represents the ideal
workflow where the QconCAT expresses well and the inclusion bodies can be solubilised in a
RapiGest solution for use. This happens in ~70% of cases. In ~10% of cases the QconCAT
expresses to a lower level and needs to be purified, occasionally with western blot verification
prior to purification to verify expression has occurred, this is shown in yellow. In ~20% of cases
the QconCAT fails to express and needs to be redesigned, this is shown in red (data from COPY
project COPYCATs).
So in the majority of cases the optimised, high throughput method works well. However there
have been QconCATs where the protein did not express well, or did not express at all, and
occasionally although the QconCAT expresses, it is more difficult to solubilise. In these cases
troubleshooting protocols need to be used. The mostly commonly used tool when
troubleshooting QconCATs, specifically very low expression of the QconCAT protein, is
western blotting. Each QconCAT is designed with a HisTag at the C- terminus for purification
and this tag can also be used to identify the presence of the QconCAT with a western blot; an
anti-HisTag antibody is used along with a chemiluminescent substrate, x-ray film is used to
develop the blot and the presence of the QconCAT is indicated by a black band.
Less common is where a QconCAT does not express well in a certain type of media. QconCAT
Ribo4 was one of four QconCATs, designed for a study into yeast ribosomal proteins, which I
expressed. Ribo4 showed low levels of expression in LB media (Figure 21 (a)), even with
elevated levels of IPTG. To try to improve expression two other culture conditions were tried;
culture in autoinducing media and IPTG induction in minimal media with light amino acids
(Figure 21 (b)). The SDS-PAGE analysis of time points from these cultures show that in the
minimal media and autoinduction media Ribo4 seems to express to improved levels. As
minimal media is used for expression of the stable isotope labelled protein a heavy culture
was then attempted. The heavy Ribo4 protein was expressed to adequate levels and was
purified to yield a clean product (Figure 21 (c)).
Some QconCATs do fail to express entirely. The exact cause for this is unknown. A possibility is
that the QconCAT produced could be toxic to the E.coli cells in some way, however this might
be indicated by a lack of culture growth and this is not usually observed; it may be more likely
that the QconCAT is not being synthesised. The usual solution in these cases is to change the
Results and Discussion
76
order of the peptides in the QconCAT gene and order a new construct, re-expression is then
attempted.
Figure 21 | Ribo4 QconCAT expression in different media. (a). Expression in LB with 2mM IPTG induction. Time point samples T0-T7 assessed. Low level expression seen faintly band in T4 and T5. (b). Minimal media and autoinducing media with improved QconCAT expression. (c). After stable isotope labelled culture Ribo4 is successfully purified.
T0 T1
T2 -induced T3 T4 T5 T6 T7 T0 T1 T2 T3
T4 -inducedT5 T6
End time pointT7
Auto-pre
Auto-post
Minimal media Autoinduction
E2E1 E3 E4 E6E5
LB 2mM IPTG
(a) (b)
(c)
Results and Discussion
77
Section 2: QconCAT protein as a quality control standard
The design of a QconCAT is inevitably selective. The peptides included in the construct are
carefully chosen using the criteria previously discussed; one of these criteria is how well the
peptide will behave during the mass spectral analysis. This means that each QconCAT that is
produced is not only a quantification standard, it is also a protein consisting entirely of
peptides designed to behave predictably in a mass spectrum. It was therefore considered that
these proteins could be used for more than protein quantification; they could also be used to
assess instrument performance under a number of criteria including quantitative
performance. This idea is not new, as previously discussed Eyers et al. (Eyers et al., 2008)
designed their own QconCAT to use as a MS standard, however the approach taken here was
different to QCAL in that the focus was to explore a different aspect of instrument
performance - the ability of the instrument to detect and quantify peptides over a large
dynamic range in a more complex sample than a single protein. Sigma-Aldrich® have also
made a Universal Proteomics Standard (UPS1) which is an equimolar mix of 48 human
proteins and a Proteomics Dynamic Range Standard (UPS2) which is a dynamic range mix of
the same 48 human proteins ranging from 500amol to 50pmol in concentration; both
formulations are designed to assess chromatographic and instrument performance. The
purpose of this study was to assess whether QconCATs could be used in a similar way to the
UPS1 and 2 standards with the addition of assessing quantitative performance and the benefit
of the flexibility that comes from a “designer” set of proteins where the peptides are as well
characterised as the protein itself.
Ten COPYCATs were selected to cover a dynamic range of 0.5fmol on column up to 0.5pmol
on column with 8 concentration points between. Each of these was known to express well, no
other selection criteria were used. The COPYCATs selected were 001, 002, 042, 043, 045, 052,
053, 058, 059 and 060. For this study each COPYCAT was expressed in unlabelled form; as the
COPYCATs were not going to be used for quantification it was not necessary to distinguish
them from an analyte. The time point samples for each COPYCAT culture before (-) and after
(+) addition of IPTG show variable levels of expression for the 10, the expression bands,
indicated with a green dot, are visible for each to indicate successful expression (Figure 22
(a)). A cell pellet from each COPYCAT culture was then purified using NiMAC cartridge and the
purified material was analysed in a 1 in 2 dilution using SDS-PAGE to verify no contaminant
bands could be seen (Figure 22 (b)).
Results and Discussion
78
Figure 22| Expression and purification of 10 unlabelled COPYCATs. (a). SDS-PAGE of pre (-) and post (+) induction samples for COPYCAT expression in LB media. (b). The diluted purified material for each COPYCAT with a clean band for each, arrows indicate which band pertains to which COPYCAT.
In order to use the COPYCATs effectively they first needed to be accurately quantified. The
first study using these 10 QconCATs was to assess the variability in quantification of the
QconCATs using various methods.
- + - + - + - + - +
001 002 042 043 053045 052 058 059 060
- + - + - + + - +
1 in 2 dilution of purified material
200.0
116.3
66.2
45.0
31.0
21.0
14.06.5
97.4
kDa
-
(b)
(a)
Results and Discussion
79
4.6 Methods for quantification of the QconCAT standards
The accuracy of quantification using a standard is largely dependent on how well the standard
itself is quantified. It is therefore extremely important in quantitative proteomics to select the
most appropriate method for quantification of the standard and to be sure that this
quantification is reliable. With respect to the study of 10 COPYCATs, to get the proteins into a
dynamic range each COPYCAT needs to be accurately quantified. There are a number of
different ways to quantify a standard and I investigated the use of a few of these.
The methods used for quantification:
Method Merits Demerits
Densitometry Whole protein quantification Visual check for contaminants
possible
Reliant on staining of a different protein to act as a standard, variation in dye binding behaviour could bias results
Protein assay Whole protein quantification Reliant on staining of a different protein to act as a standard, variation in dye binding behaviour could bias results
Quantification via the GluFib peptide on the QconCAT, using MALDI-TOF-MS
Standard and analyte target peptide are almost identical, increasing accuracy of the quantification
Sample and analyte are combined early on in the workflow, decreasing the possibility of error introduced during sample preparation
Digestion required which may introduce error if incomplete
Comparison of a single peptide to a standard, needs to be a quantotypic peptide
MALDI-bias towards Arg containing peptides
Single QconCAT protein quantified in each analysis
Quantification via the GluFib peptide, using ESI-QTOF-MS
Standard and analyte target peptide are almost identical, increasing accuracy of the quantification
Sample and analyte are combined early on in the workflow, decreasing the possibility of error introduced during sample preparation
Digestion required which may introduce error if incomplete
Comparison of a single peptide to a standard, needs to be a quantotypic peptide
Single QconCAT protein quantified in each analysis
Label-free quantification, using ESI-QTOF-MS
Rapid quantification of multiple standards simultaneously from MS data processing
Multiple proteins can be quantified in a single analysis
Digestion required which may introduce error if incomplete
Comparison of top3 peptides from the analyte to the top3 standard peptides from an entirely different protein
Table 5| Merits and demerits of five different quantification methods for the QconCAT standard
Results and Discussion
80
These methods for quantification differ in the target; for the protein assay and densitometry it
is the entire protein which is being used in the assay. In the case of quantification using GluFib
it is a single target peptide within the digested COPYCAT, and for label-free a selected number
of “top” intensity peptides are used, in this case the top three. In these methods, except for
label-free, the COPYCAT is quantified by comparison with a standard which is present in a
known amount.
DENSITOMETRY
For the densitometry, bovine serum albumin (BSA) was used as the standard for
quantification. Several SDS-PAGE gels were run to include a range of dilutions of BSA in order
to obtain the best quantification for each COPYCAT. A BSA standard graph was drawn for each
gel and the equation for the best-fit line was only applied to COPYCATs from the same gel. The
densitometry gels can be seen in Figure 23 along with their corresponding BSA-standard plots.
The value for the absorbance of each band is given as a “volume”, for the BSA standard this
volume can be equated back to the amount of protein loaded on to that lane of the gel by
plotting the corresponding values in a graph; this results in the BSA standard plots seen with
the line of best-fit being used to calculate the quantification of the analyte COPYCATs. The
amount of COPYCAT, in ng, on the gel was calculated. For CC001 a number of different
dilutions were run to assess the consistency of the readings; an average ng on gel value for
CC001 was therefore calculated. It should be noted that for CC002 the band was stronger
than the highest amount of BSA for that gel, however the value was still included as the line-of
best fit gave a good Pearson's r value of 0.96 and an adjusted R2 value of 0.89 (values from
OriginLab programme 8.5) and it was decided that the error introduced by extrapolating from
the line would not be significant. The results can be seen in Figure 26.
Results and Discussion
81
Ge
l 1
BSA 3570
BSA 2250
BSA 1500
BSA 750
BSA 375
001 1in2
001 1in5
001 1in7.5
001 1in10
001 undil
Ge
l 2
002 1in2
042
052
053
BSA 1500
BSA 750
BSA 375
Ge
l 3
045
058
059
BSA 3570
BSA 2250
BSA 1500
BSA 375
Ge
l 4
043
060
BSA 2250
BSA 1500
BSA 750
BSA 375
001 1in2
Figu
re23
|D
en
sito
me
try
qu
anti
fica
tion
s.Th
efo
ur
gels
use
dfo
rq
uan
tifi
cati
on
ofth
e10
ligh
tC
OP
YCA
Ts,w
ith
the
irco
rre
spo
nd
ing
BSA
stan
dar
dp
lots
and
arro
win
dic
atin
gth
eva
lue
sta
ken
fro
mth
egr
aph
sfo
rq
uan
tifi
cati
on
oft
he
CO
PYC
ATs
.
0500
1000
1500
2000
2500
3000
3500
4000
0
200000
400000
600000
800000
1000000
1200000
Volume
BS
A n
g o
n g
el
Gel 1 B
SA
sta
ndard
gra
ph
Lin
ear
line o
f best
fit
0250
500
750
1000
1250
1500
0
100000
200000
300000
400000
500000
Gel 2 B
SA
sta
nd
ard
gra
ph
Lin
ear
line
of
be
st fit
Volume
BS
A n
g o
n g
el
0500
1000
1500
2000
2500
3000
3500
4000
0
100000
200000
300000
400000
500000
600000
700000
800000
Ge
l 3
BS
A s
tan
da
rd g
rap
h
Lin
ea
r lin
e o
f b
est fit
Volume
BS
A n
g o
n g
el
0250
500
750
1000
1250
1500
0
50000
100000
150000
200000
250000
300000
Gel 4 B
SA
sta
ndard
gra
ph
Lin
ear
line o
f best
fit
Volume
BS
A n
g o
n g
el
1 in
2
1 in
5
1 in
7.5
1 in
10
05
2
04
2
05
3
05
9
04
50
58
04
3
06
0
Results and Discussion
82
PROTEIN ASSAY
The protein assay was performed, as explained in the materials and methods section, on each
COPYCAT immediately prior to digestion to minimise error. The protein assay relies on a very
similar principle to densitometry, it is performed on the intact protein and the absorbance of a
BSA standard, stained with Coomassie PlusTM protein assay reagent, is compared to the
absorbance of a COPYCAT sample (Figure 26).
A recent application note released by Amersham Biosciences (Application Note #6
ImageMaster® VDS 80-6383-43) highlighted a key point to consider in the reliability of
densitometry. The optical density of a Coomassie stained protein band on a gel was plotted
against the concentration of that protein in the band, for two different proteins – Aldolase
and GPDH. Their results indicate that the slope of the line of best fit for these two proteins
was markedly different. This calls into question the reliability of a densitometry assay if the
BSA standard used has a different slope of optical density/protein concentration to the
analyte protein. A similar principle can also be considered concerning the reliability of the
protein assay. The Coomassie dye used for protein assays is known to bind only selected
amino acids at specific sites, if the number of these sites is not the same for the standard and
analyte protein it stands to reason that the staining of the proteins will be different. Congdon
et. al. showed that different proteins stained with Coomassie in a protein assay had different
absorbances (Congdon et al., 1993) and this calls into question the reliability of the
quantification from a protein assay.
QUANTIFICATION USING THE GLUFIB PEPTIDE
For quantification using the GluFib peptide, with either MALDI-TOF or Q-TOF MS, digests of
each COPYCAT were used. Ordinarily in our lab unlabelled (light) GluFib is used, in a known
amount, to quantify a labelled (heavy) QconCAT. In this case the COPYCAT is light, therefore it
needs to be quantified with heavy GluFib. Accurately quantified heavy GluFib peptide was not
available as a stand-alone reagent, therefore the quantification needed to involve two steps.
First heavy CC002 was made and quantified using light GluFib. The heavy CC002 was then used
as a source of heavy GluFib, in a known amount, to quantify the light COPYCATs.
Each light COPYCAT was digested individually, the heavy CC002 was digested under two
different conditions – one with light GluFib spiked into the digest mix (“heavy with” (HW)) and
one without light GluFib in the digest (“heavy only” (HO)). The two heavy digests were
performed in order to assess whether the quantification was affected by the stage at which
the GluFib was added to the analysis; with the HW digest the GluFib is already present and the
Results and Discussion
83
sample can be directly analysed with MS to quantify the COPYCAT, with HO the GluFib needs
to be spiked into the digest after digestion is complete, prior to MS analysis. This later stage of
introduction could introduce more variance to the quantification.
There is also a second aspect when considering which heavy digest to use – with HO the only
GluFib present in the digest is heavy, therefore when the heavy is spiked in with a light
COPYCAT for quantification there can be a direct comparison drawn between the heavy and
light GluFib peaks. However with HW there is already light GluFib present in the digest, it is at
a known amount so the quantification of the light COPYCAT can be adjusted accordingly but
the presence of this extra GluFib could affect the quantification accuracy.
The two heavy digests were analysed individually; HO was first spiked with a known amount of
GluFib for quantification. Each light COPYCAT digest was quantified twice, once with HO and
once with HW using MALDI-TOF MS and ESI-Q-TOF MS, an average of the resulting light
COPYCAT quantification values was taken as the HO and HW were found to give very similar
quantifications. The quantification was performed using MassLynx software to give an extract
ion chromatogram for the GluFib peaks. To first quantify the heavy CC002 digests the peak
areas for the light and heavy GluFib in the samples were calculated and the resulting values
compared in a ratio which was then used to calculate the fmol of heavy GluFib in the sample
from the known amount of light GluFib. Once the amount of heavy GluFib was known this was
used to quantify the 10 light COPYCATs. So that the quantification values can all be compared
against the protein assay and densitometry, where the amount of COPYCAT in the original
undigested aliquot is quantified, the GluFib quantifications were then calculated back to give a
final value for pmol/μl concentration of COPYCAT in the original aliquot. The resulting
quantifications can be seen in Figure 26.
At this stage of the assessment the methods were compared to judge how well they
correlated. Figure 24 shows the alignment between the different quantification methods so
far.
Results and Discussion
84
Figu
re24
|C
om
par
iso
ns
be
twee
nth
eq
uan
tifi
cati
on
valu
es
wit
hd
iffe
ren
tm
eth
od
s.Th
eo
utp
ut
quan
tifi
cati
on
valu
es
for
fou
rd
iffe
ren
tq
uan
tifi
cati
on
me
tho
dsar
ep
lott
ed
agai
nst
on
e-a
no
the
r.Th
elin
eo
fbe
stfi
tin
red
and
the
95%
con
fid
en
celim
its
ingr
ey.
02
46
810
12
14
16
18
20
02468
10
12
14
16
18
20
Protein assay
Densitom
etr
y
02
46
810
12
14
16
18
20
02468
10
12
14
16
18
20
ESI-Q-TOF average
Densitom
etr
y
02
46
810
12
14
16
18
20
02468
10
12
14
16
18
20
MALDI-TOF average
Densitom
etr
y
02
46
810
12
14
16
18
20
02468
10
12
14
16
18
20
ES-Q-TOF average
Pro
tein
assay
02
46
810
12
14
16
18
20
02468
10
12
14
16
18
20
MALDi-TOF average
Pro
tein
assay
02
46
810
12
14
16
18
20
02468
10
12
14
16
18
20
MALDI-TOF average
ES
I-Q
-TO
F a
vera
ge
Results and Discussion
85
Visually the MALDI-TOF and ESI-Q-TOF quantifications correlate better than the others with
the data points distributed close to the lines of best fit. This is to be expected as the only
difference here is the instrumentation, the method of quantification is still the same. Table 6
below shows the Pearson’s-r values from each graph:
Y Axis pmol/ul value X Axis pmol/ul value Pearson's r
Protein assay Densitometry 0.82528
ESI-Q-TOF average Densitometry 0.73251
MALDI-TOF average Densitometry 0.59659
ESI-Q-TOF average Protein assay 0.75239
MALDI-TOF average Protein assay 0.62927
MALDI-TOF average ESI-Q-TOF average 0.96214
Table 6| Pearson’s r values for comparisons between quantification method results
Looking at the values above there seems to be good correlation between the densitometry
and the protein assay quantification values, this again is to be expected as both methods use a
similar principle of measuring the staining of the intact protein and comparing it to a standard
to acquire the quantification value. There is worsening correlation between the two MS GluFib
based quantifications and the intact protein quantifications, with the worst correlation
between MALDI-TOF and Densitometry. However the degree of correlation is still no
indication as to which method provides the most accurate quantification.
The MS quantifications are only accurate if the GluFib quantification peptide is released from
the COPYCAT entirely. If there is a miss-cleavage either side of the GluFib peptide then a
reduced level of peptide will be available for quantification and this will bias the results. To
assess this a time course digest was performed on three COPYCATs (all used in the 10 light
study) these three COPYCATs are stable isotope labelled to facilitate the use of unlabelled
GluFib to monitor the release of the heavy GluFib peptide from the COPYCAT.
The three COPYCATs chosen for the time-course were CC042, CC053 and CC060. Two digest
conditions were set up for each, the first contained the COPYCAT plus 107.5fmol/ul
concentration light GluFib and a yeast background. The second contained the same amount of
COPYCAT and GluFib but no yeast. The two conditions were chosen to see if the complex yeast
background affected the digestion efficiency. The digests were reduced with DTT and blocked
with IAM before adding the trypsin. Time points were taken at 1 min, 2 min 5 min, 10 min, 15
min, 30min, 60min, 120min, 240min and a final overnight time point. For each time point a
Results and Discussion
86
10μl sample was pipetted into 10μl of TFA, 1% final concentration, and placed on ice to stop
digestion. The light GluFib is already present in each sample as it was added in the digest mix,
meaning that the amount of light GluFib is constant for each sample. The time points were
analysed using LC-ESI-Q-TOF MS. The peak areas for the heavy and light GluFib were extracted
for each time point in each digest and the ratio between the two values calculated.
Plots of the changing ratios over time reveal that the QconCATs have very different digestion
profiles (Figure 25). Additionally for each COPYCAT the behaviour is different dependant on
whether the digest is performed in a yeast background. For CC042 the digestions profiles are
very similar with or without the background however digestion does seem to be slightly faster
without the yeast present. In the sequence context there is an acidic residue in the P1’
location which could affect digestion and lead to a miss-cleave at that site however it does not
seem to have affected digestion in this case. Neither of the two other sequence contexts for
053 and 060 indicate a problematic digestion site. The difference between digestion efficiency
in the two conditions is most apparent for CC053 where digestion with the yeast background
is significantly slower than without. However both digests do eventually reach the same end
point. For CC060 we see a very rapid release of the GluFib peptide without the background
and again a slower release with yeast present. For this plot the two digests do not reach the
same ratio end point. The final ratio for the yeast-background digest is higher. Looking at the
curve of the lines for CC060 the digest without yeast plateaus after approximately 120min and
the ratio at the plateau is lower than the highest ratio achieved by the background digest at
240min. This might suggest that although the digest with yeast background is slower, more
GluFib is released compared to the non-yeast digest. The difference in digestion profiles
cannot be explained through the sequence context of the GluFib peptide. It is possible that
another peptide released from the QconCAT is inhibiting the performance of the trypsin but
there is no clear reason why this would affect the digest in yeast background more than
without the background (CC053).
For CC042 the ratio of heavy CC/light standard reached 12, for CC052 and CC060 the
maximum ratios seen were 4 and 4.5 respectively (Figure 25). The difference in maximum
ratio seen can be explained by the fact that CC042 was prepared differently to CC052 and
CC060 prior to digestion. CC042 was prepared for digestion using NiMAC purification whereas
CC053 and CC060 were RapiGest solubilised, the difference in the two preparation methods
will result in differing concentrations of prepared COPYCAT solution; the COPYCATs were not
diluted prior to the time course digestion so the starting concentration of each COPYCAT will
Results and Discussion
87
have varied. The same concentration of light GluFib was used for all digests however, meaning
that the concentration of heavy COPYCAT, and therefore heavy GluFib, varied in relation to
the light GluFib for each COPYCAT and this explains the differences seen in the final H/L ratios.
In addition to the time course digests I also looked for missed cleavages around the GluFib
peptide for each COPYCAT. I did this in two ways, I looked for any missed cleaves that were
picked up in PLGS and I also viewed extracted ion chromatograms to look for the m/z for the
sequence of the first sacrificial peptide coupled to GluFib - MAGREGVNDNEEGFFSAR. I could
not find clear evidence of any missed cleaves in any of my 10 light COPYCAT digests from
either method.
Results and Discussion
88
Figu
re25
|Ti
me
cou
rse
dige
stp
lots
for
thre
eC
OPY
CA
Tsm
oni
tori
ng
Glu
Fib
rele
ase
.Th
eti
me
cou
rse
dig
ests
cond
uct
ed
onth
ree
COP
YCA
Ts,
CO
PYC
ATs
dig
este
din
div
idu
ally
and
wit
ha
yeas
tb
ackg
roun
d,t
ime
po
ints
rem
ove
dan
dd
iges
tio
nst
oppe
dw
ithac
idif
icat
ion
wit
hTF
A(1
%).
Sam
ple
sw
ere
anal
yse
du
sin
gLC
-ESI
-Q-T
OF
MS
,th
ep
eak
are
asfo
rh
eav
yan
dlig
ht
Glu
Fib
we
rem
eas
ure
dan
da
rati
ob
etw
een
the
two
calc
ula
ted
.Th
ech
angi
ng
rati
ois
plo
tte
dag
ain
stti
me
.Ea
chp
lot
rep
rese
nts
aQ
con
CA
Tw
ith
curv
es
trac
kin
gth
ere
leas
eof
Glu
Fib
ina
dig
est
wit
ha
yeas
tb
ackg
rou
nd
(bla
cklin
e)an
dw
ith
out
aye
ast
bac
kgro
und
(red
).Th
ese
qu
en
ceco
nte
xto
fth
eG
luFi
bp
ep
tid
ein
eac
hC
OP
YCA
Tis
see
nb
elo
wth
ep
lot.
CC
04
2C
C0
53
CC
06
0
Seq
uen
ce c
on
text
: EGVNDNEEGFFSAR|ESQGIDVEYLTQLLDNWSTGPYK
Sequ
ence
con
text
: EGVNDNEEGFFSAR|AFQGLGIAFVLPNVLGIIGNIYVGGTFR
Sequ
ence
con
text
: EGVNDNEEGFFSAR|VIPSIVQDYFNLVPLNFNNNDFLNK
Glu
Fib
Glu
Fib
Glu
Fib
060
120
180
240
02468
10
12
14
Ratio of Heavy CC/Light standard
Tim
e (
min
)
Ratio H
/L 0
42 y
east
Ratio H
/L 0
42 n
o y
east
060
120
180
240
0.0
0.5
1.0
1.5
2.0
2.5
3.0
3.5
4.0
4.5
5.0
Ratio of Heavy CC/Light standard
Tim
e (
min
)
Ratio H
/L C
C053 y
east
Ratio H
/L C
C053 n
o y
east
060
120
180
240
0.0
0.5
1.0
1.5
2.0
2.5
3.0
3.5
4.0
4.5
5.0
Ratio of Heavy CC/Light standard
Tim
e (
min
)
Ratio H
/L C
C060 y
east
Ratio H
/L C
C060 n
o y
east
Results and Discussion
89
LABEL-FREE QUANTIFICATION
The final method used for trial quantification of the COPYCATs was label-free quantification.
For this it was decided that samples of each COPYCAT digest would be run at the same
concentration. In order to do this it first needed to be decided which previous quantification
value to use to calculate the dilutions required for each COPYCAT digest. As label-free
quantification is an MS based approach it was decided that the other MS based quantification
values would be most appropriate to use as a basis for dilutions. An average was taken of all
of the GluFib quantification values (ESI-Q-TOF and MALDI-TOF MS data); these values were
used to calculate dilutions for each COPYCAT digest. The samples were analysed using ESI-Q-
TOF (Synapt G1), samples of each digest were run twice – once individually and once in a ratio
of 1:1:1:1:1:1:1:1:1:1 mix with each other. The digests were diluted to 500fmol/μl
concentration, the 10 COPYCATs were mixed equally and then an equal volume of 50fmol/μl
Phosphorylase B (PhosB) was added as the standard. Sample (2μl) was injected onto the
column to give, what should be, 50fmol of each COPYCAT on column and 50fmol of PhosB.
Each COPYCAT digest was also diluted further to give 50fmol/μl concentration of each
individually and, after mixing 1:1 with 50fmol/μl PhosB, 2μl was injected of each onto the
column. The data was processed using the label-free quantification method in PLGS. The
values given for fmol on column from the label-free quantification were calculated back to
give a final value of pmol/ul in the original undigested COPYCAT aliquot (Figure 26).
Results and Discussion
90
Figure 26 | Quantification values for the 10 COPYCATs. (a). The quantification values obtained for pmol/μl in original aliquot of each QconCAT, using 8 different methods, plotted as a column chart showing each individually. (b). The mean pmol/μl value for each QconCAT taking an average of the 8 different quantification methods, error bars showing the standard error for each mean.
The error bars for the average quantification values, for CC001 and CC002 particularly, reflect
the variability in quantification values for the COPYCATs (Figure 26 (b)). This was expected
given the range of values seen in Figure 26 (a). The label free quantification values tend to give
higher pmol/μl concentrations than other methods (Figure 26 (a)). It can also be seen that the
label free quantification when the COPYCATs are run individually gives a higher value than
when the COPYCATs are analysed in a 1:1 mix. The reason for this difference was investigated
and it was observed that the peptides selected as the top3 for quantification were not the
same for the individual and the mix. This might suggest that the peptides ionise differently
depending on the digest background, however further study and an increased number of
technical replicates is necessary to analyse this further. As explained previously PLGS uses the
“top3” rule to quantify proteins based on a comparison between the intensity of the top three
peptides for a standard of known amount and the top 3 intensities for the analyte peptide.
This method of quantification was developed using naturally occurring proteins as the analyte
proteins. One explanation for the unusual quantification values given by the label-free analysis
could be that the QconCAT peptides do not show the “normal” behaviour seen in naturally
occurring proteins. These 10 COPYCATs were picked for this study because they are well
characterised proteins containing specifically selected peptides, chosen by virtue of their
reliable behaviour in a mass spectrometer. It could be that in selecting well behaved peptides
for these proteins we have unconsciously increased the intensity of the “top3”, giving bias to
the quantification.
Given the above theory a brief comparison between the amino acid composition of the
S.cerevisiae proteome and the amino acid composition of our current set of COPYCATs was
performed (Figure 27). Some amino acids such as Leucine and Threonine are equally
represented in the yeast and COPYCAT proteins, however there are several amino acids where
there is a difference between the two protein groups. The greatest difference calculated was
for methionine where there was an 86.97% drop in occurrence in the COPYCAT proteins
compared to the yeast proteome. The average difference between the percentage occurrence
of an amino acid in the yeast proteome and the percentage occurrence of an amino acid in a
COPYCAT is 20%. This difference could be significant and could contribute to why label-free
quantification of QconCATs may not be suitable.
Results and Discussion
92
Figu
re27
|A
min
oac
idco
mp
osi
tio
nan
alys
is.
The
com
par
ison
bet
we
enth
eam
ino
acid
com
po
siti
ono
fth
eye
ast
pro
teom
ean
do
fa
colle
ctio
no
fC
OP
YCA
Ts.
Ave
rage
dif
fere
nce
rep
ort
ed
as20
%.
Tryptophan, Trp, W
Cysteine, Cys, C
Methionine, Met, M
Histidine, His, H
Tyrosine, Tyr, Y
Glutamine, Gln, Q
Arginine, Arg, R
Proline, Pro, P
Phenylalanine, Phe, F
Glycine, Gly, G
Alanine, Ala, A
Valine, Val, V
Aspartic acid, Asp, D
Threonine, Thr, T
Asparagine, Asn, N
Glutamic acid, Glu, E
Isoleucine, Ile, I
Lysine, Lys, K
Serine, Ser, S
Leucine, Leu, L
0123456789
10
Percentage occurence (%)
Am
ino
acid
Ye
ast
CO
PY
CA
T
Results and Discussion
93
The difference in average amino acid composition of COPYCATs compared to naturally
occurring S.cerevisiae proteins could mean that the ionisation of COPYCAT peptides does not
follow the same pattern as naturally occurring proteins, this could affect the reliability of label
free quantification. The intensities of the top3 peptides chosen for the 10 light COPYCAT label
free quantifications were compared to the intensities of the top3 peptides selected for label
free quantification of 10 abundant S.cerevisiae proteins. The COPYCAT intensity values were
taken from PLGS processing for the mix of COPYCATs; the mix was chosen as the S.cerevisiae
for comparison was analysed in a complex background so the more complex sample was
compared. The S.cerevisiae intensity values are taken from PLGS processing of a label free
analysis of a S.cerevisiae whole cell lysate digest sample; the proteins listed as the 10 most
abundant were selected. Two comparisons were made; first individual peptide intensities for
the top 1, 2, and 3 were plotted for COPYCAT and S.cerevisiae, and secondly the average
intensity for each of the top3 peptides for COPYCAT and S.cerevisiae were plotted for
comparison (Figure 28). Comparing the top3 intensity distributions for each protein, the
spread of curves in graphs (a) and (b) indicate that peptide ionisation behaviour varies greatly
from protein to protein; variation appears to be present for both COPYCAT and S.cerevisiae
proteins. The graph (c) suggests that for peptides 2 and 3 the percentage intensity is lower for
COPYCAT proteins than for S.cerevisiae proteins. This does suggest a difference in behaviour
between the COPYCAT proteins and the naturally occurring S.cerevisiae proteins, however this
was not as originally anticipated. The label free quantification values for the COPYCATs were
higher than the other quantification methods, in the majority of cases (Figure 26 (a)), and so it
was suggested that the intensities of the top3 peptides chosen may be higher, on average,
than for naturally occurring proteins. The results here show the converse and therefore do not
explain the higher label free quantification values for the COPYCATs.
An absorbance assay (A280nm) was considered for quantification of the QconCAT proteins,
however the accuracy of the assay can vary widely depending on the accuracy of the
estimated molar absorption coefficient for the protein (Pace et al., 1995), which varies
depending on the number of aromatic residues and cysteines, in the sequence. The amino
acid composition analysis revealed that the composition of QconCATs is very different from
the yeast proteome, and specifically the aromatic residues tryptophan and tyrosine, are
present in significantly lower amounts in the COPYCATs compared to the yeast proteome
(39.68% and 11.26% differences respectively). This is likely to affect the accuracy of the assay
and for this reason it was not used.
Results and Discussion
94
Figu
re28
|La
be
lfre
ese
lect
ed
pe
pti
dein
ten
siti
es
com
par
iso
nfo
rC
OP
YC
AT
and
S.ce
revi
sia
e.(a
)an
d(b
)to
p3
pep
tid
esin
tens
itie
s(t
op3
plo
tte
das
pep
tid
era
nk
1,2
and
3)fo
re
ach
ind
ivid
ual
pro
tein
fro
mth
eC
OP
YCA
Tan
dS.
cere
visi
ae
pro
tein
grou
ps.
(c)
com
par
ison
betw
een
the
ave
rage
pep
tide
inte
nsit
yfo
rth
eto
p3
for
CO
PYC
AT
and
S.ce
revi
sia
e.
12
3
0
10
20
30
40
50
60
70
80
90
100
label free quantification peptide intensity
pe
ptid
e r
ank
CO
PY
CA
T a
vera
ge
Ye
ast a
ve
rage
0.0
0
10
.00
20
.00
30
.00
40
.00
50
.00
60
.00
70
.00
80
.00
90
.00
10
0.0
0
12
3
Percentage intensity relative to most intense peptide (%)
Pe
pti
de
ran
k
CC
00
1 m
ix
CC
00
2 m
ix
CC
04
2 m
ix
CC
04
3 m
ix
CC
04
5 m
ix
CC
05
2 m
ix
CC
05
3 m
ix
CC
05
8 m
ix
CC
05
9 m
ix
CC
06
0 m
ix
(a) C
OP
YC
AT
(c)
0.0
0
10
.00
20
.00
30
.00
40
.00
50
.00
60
.00
70
.00
80
.00
90
.00
10
0.0
0
12
3
Percentage intensity relative to most intense peptide (%)
Pe
pti
de
ran
k
P0
03
59
P0
05
49
P0
05
60
P0
09
24
P0
09
25
P0
09
42
P0
09
50
P0
71
70
P1
45
40
P2
93
11
(b) S
.cer
evis
iae
Results and Discussion
95
SUMMARY
This work highlights the dependence of quantification on the method chosen for
quantification of the standards. The wide range of values obtained here presents a common
problem of deciding which method is the most accurate to give a reliable figure. Densitometry
gives a visual result, contaminant proteins are immediately visible from the SDS-PAGE analysis
giving more certainty to the fact that just the target protein is quantified; however the
possible variation in staining makes the method unreliable. Protein assay works on a similar
principle to densitometry and has the added disadvantage of not being able to assess any
contaminants during the assay. With the previously mentioned potential for inaccuracy with
label free quantification, in my opinion, quantification of the QconCAT using the GluFib
peptide is the most reliable. GluFib has two major advantages over other methods. The first is
that, like densitometry, contaminant proteins cannot interfere with the analysis as only GluFib
heavy and light peptides are targeted. The second advantage is that, unlike any other method,
the standard used to quantify the QconCAT resembles the QconCAT GluFib as closely as
possible; a direct comparison is drawn between the heavy and light counterparts, there is no
potential for differential behaviour due to the fact that, except for the m/z, the peptides
behave identically in a mass spectrometer. I consider this similarity between standard and
analyte to be of key importance to the accuracy of quantification. Amino acid analysis has
been suggested as the gold standard for quantification of protein and this method could be
used to compare to the other quantification methods and assess which aligns best with the
amino acid analysis values.
4.7 QconCATs to assess instrument performance
Ideally to assess instrument performance the 10 COPYCATs would be combined in a dynamic
range and this mixture used to assess instrument performance both in detection and
quantification. The unexpected issue highlighted by the difficulty in standard quantification
presents a problem in selecting a reliable quantification method. If the quantification of each
COPYCAT is unreliable, we cannot be certain that the COPYCATs are in the correct ratio to
create the dynamic range. We could take an average of the values and then simply take it on
face value that the COPYCATs are present at the given amounts. MS performance could then
be assessed by the ability to detect each COPYCAT to a suitable level of coverage. Hitting a
certain level of coverage for each COPYCAT could be used as a quality control measure and
comparisons could be drawn between the coverage obtained on different instruments to
Results and Discussion
96
assess instrument-to-instrument or lab-to-lab consistency. However a quality control tool that
assesses quantitative as well as qualitative performance would be much more useful given the
current trend in proteomics towards quantitative studies.
There are a number of potential studies that could be conducted further to this work. A
particular study I would have liked to have looked at would have been to assess whether the
outcomes of the quantification studies would have been the same had naturally occurring
proteins been used rather than the artificial QconCAT proteins. Recombinant proteins could
be synthesised with two additional peptides – a HisTag for purification and peptide for
quantification. They could therefore be purified and quantified in much the same way as the
COPYCATs. However, in contrast to COPYCATs, the rest of the protein would be the same as
the naturally occurring protein so may perform better with label-free quantification, this may
mean that quantitative as well as qualitative MS performance parameters could be assessed
on the instrument.
Conclusions
5. Conclusions 98
Conclusions
98
5. Conclusions
The primary aim of this work was to shorten the QconCAT production process in terms of the
number of days taken for QconCAT production, and also to streamline the production process
making it simpler and applicable to multiplexing. The overall aim was to make it a more time
efficient and accessible technology. I have discussed the processes which led to changes in the
protocol, and how they have been implemented. The flow diagram in Figure 29 recapitulates
the Figure 7 for the Aims and objectives section and summarises the areas where the protocol
has been altered.
I first addressed the cell culture and expression section of the protocol and reduced
production time by removing the re-streaking of E.coli colonies on agar plates; this reduced
the protocol by 1d. Secondly by eliminating the trial unlabelled culture the protocol was
shortened, expressing the QconCAT in a “straight-to-heavy” approach reduced the production
time by 5d. The reason for the straight to heavy approach was that we have never seen
evidence for an incorrect QconCAT being synthesised, QconCATs are produced reliably and
consistently as shown in this thesis. Repeated expression of QconCATs has lead to a greater
understanding of the behaviour of these proteins; wide variability in expression levels has
been observed and this impacts on the further processing of the protein. The consistent
expression of the correct QconCAT construct lead to removal of the verification step,
verification of the QconCAT is now delayed until after the final labelled QconCAT is produced.
Removal of the early verification step reduced the production time by 6d.
I set out to investigate alternative methods of E.coli cell lysis and protein purification and to
establish whether more rapid methods were available. The use of sonication rather than
BugBusting for cell lysis has removed 0.5d from the protocol. Sonication also allows for
multiple cell pellets to be sonicated in a short period of time therefore facilitating multiplexing
of this step in the protocol. Alternative methods of QconCAT protein purification were
investigated and ultimately the purification of the QconCAT protein was eliminated for
adequately expressing QconCATs, replaced by simple solubilisation. RapiGest solubilisation is
now used in place of purification; the unpurified inclusion bodies are quickly solubilised in a
reagent which is compatible with protein digestion and mass spectrometric analysis.
Removing the purification step reduces the production time scale by 1d. RapiGest
solubilisation is also easily multiplexed. Overall the improvements to the QconCAT production
protocol has reduced the time scale for preparation of the protein by 13.5d. The actual time
Conclusions
99
gains are greater than this as the improved protocol facilitates multiplexing, routinely 8
QconCATs are synthesised in parallel.
The final study of 10 QconCATs highlighted the difficulty in quantifying a standard. There were
a number of different methods used for quantification; each method produced significantly
different values. Every quantification method had merits and demerits and there is a
significant difficulty in selecting the “correct” value in order to proceed. It was discussed that
GluFib peptide based quantification may be the more reliable quantification method but that
amino acid analysis should be considered for a gold standard quantification value. A potential
further study was outlined to assess the behaviour of naturally occurring proteins in the same
workflow.
The QconCAT production protocol has been adapted for use as a high throughput, multiplexed
technique applicable to large scale quantification studies. However the applications of
QconCATs reach beyond label-mediated quantification and this aspect of their use has yet to
be fully explored.
Conclusions
100
Figu
re29
|C
on
clu
sio
ns.
Ech
oin
gth
efi
gure
inth
eA
ims
and
Obj
ect
ive
s,th
eo
rigi
nal
Qco
nC
AT
pro
duct
ion
pro
toco
lis
sho
wn
wit
hth
en
um
be
ro
fd
ays
for
eac
hst
ep.
The
stag
es
wh
ere
day
sh
ave
be
en
rem
ove
dfr
om
the
pro
toco
lare
hig
hlig
hte
din
gre
en
and
the
ne
wti
me
-du
rati
on
forQ
con
CA
Tp
rod
uct
ion
isn
ow
6d.
Tota
l = 1
9.5
d
Tran
sfor
mat
ion
of Q
conC
AT
plas
mid
into
E.c
oli,
froz
en g
lyce
rol
stoc
ks o
f tra
nsfo
rmed
cel
ls m
ade
4 d
Tria
l exp
ress
ion
of u
nlab
elle
d Q
conC
AT
prot
ein,
ana
lysi
s of
cu
ltur
e sa
mpl
es u
sing
SD
S-P
AG
E 2
d
In-g
el d
iges
tion
of s
uspe
cted
Q
conC
AT
band
on
SDS
-PA
GE
gel
and
anal
ysis
of t
he d
iges
t us
ing
MA
LDI-
TOF
MS
2 d
Puri
fica
tion
of t
he u
nlab
elle
d Q
conC
AT
cons
truc
t an
d fu
rthe
r M
ALD
I-TO
F M
S an
d ES
I-M
S an
alys
is
4 d
Expr
essi
on o
f st
able
isot
ope
labe
lled
Qco
nCA
T an
d pu
rifi
cati
on
5 d
MA
LDI-
TOF
anal
ysis
of m
ixtu
res
of
labe
lled
and
unl
abel
led
Qco
nCA
T pe
ptid
es
2 d
Qua
ntif
icat
ion
of Q
conC
AT
0.5
d
Tran
sfor
mat
ion
of Q
conC
AT
plas
mid
into
E.
coli,
froz
en g
lyce
rol s
tock
s of
tr
ansf
orm
ed c
ells
mad
e
2 d
Expr
essi
on o
f Q
conC
AT
in m
inim
al m
edia
w
ith
stab
le is
otop
e la
belle
d a
min
o ac
ids
2 d
Soni
cati
on o
f cel
l pel
lets
and
Rap
iGes
t so
lubi
lisat
ion
of in
clus
ion
bodi
es1
d
Dig
esti
on o
f Qco
nCA
T, v
erifi
cati
on a
nd
quan
tific
atio
n pe
rfor
med
dur
ing
quan
tific
atio
n ex
peri
men
t
1 d
Rem
ove
d r
e-st
rea
k st
ep a
nd
el
imin
ate
d t
he
tria
l u
nla
bel
led
cu
ltu
re
-6d
Qco
nC
AT
no
w n
ot
veri
fied
u
nti
l aft
er t
he
lab
elle
d
con
stru
ct i
s m
ad
e
-6d
Son
ica
tio
n n
ow
use
d a
s m
eth
od
fo
r ce
ll ly
sis
an
d
Ra
piG
est
solu
bili
sati
on
use
d
in p
lace
of
pu
rifi
cati
on
-1.5
d
Targ
et a
chie
ved
, re
du
ced
nu
mb
er o
f
da
ys fo
r p
rod
uct
ion
to
6d
incl
ud
ing
M
ALD
I ver
ific
ati
on
Pre
vio
us
Qco
nCA
T p
rod
uct
ion
pro
toco
lT
ime-
red
uce
d Q
con
CA
T p
rod
uct
ion
pro
toco
l
References
6. References 102
References
102
6. References
Amersham Biosciences Application Note #6 ImageMaster® VDS (80-6383-43) Anderson, L. and J. Seilhamer (1997). "A comparison of selected mRNA and protein
abundances in human liver." Electrophoresis 18(3-4): 533-7. Baneyx, F. (1999). "Recombinant protein expression in Escherichia coli." Curr Opin Biotechnol
10(5): 411-21. Beynon, R. J., M. K. Doherty, J. M. Pratt and S. J. Gaskell (2005). "Multiplexed absolute
quantification in proteomics using artificial QCAT proteins of concatenated signature peptides." Nat Methods 2(8): 587-9.
Bislev, S. L., U. Kusebauch, M. C. Codrea, R. J. Beynon, V. M. Harman, C. M. Rontved, R. Aebersold, R. L. Moritz and E. Bendixen (2012). "Quantotypic Properties of QconCAT Peptides Targeting Bovine Host Response to Streptococcus uberis." J Proteome Res 11(3): 1832-43.
Blattner, F. R., G. Plunkett, 3rd, C. A. Bloch, N. T. Perna, V. Burland, M. Riley, J. Collado-Vides, J. D. Glasner, C. K. Rode, G. F. Mayhew, J. Gregor, N. W. Davis, H. A. Kirkpatrick, M. A. Goeden, D. J. Rose, B. Mau and Y. Shao (1997). "The complete genome sequence of Escherichia coli K-12." Science 277(5331): 1453-62.
Bondarenko, P. V., D. Chelius and T. A. Shaler (2002). "Identification and relative quantitation of protein mixtures by enzymatic digestion followed by capillary reversed-phase liquid chromatography-tandem mass spectrometry." Anal Chem 74(18): 4741-9.
Bronstrup, M. (2004). "Absolute quantification strategies in proteomics based on mass spectrometry." Expert Rev Proteomics 1(4): 503-12.
Brown, T. A. (1991). "Essential Molecular Biology: A Practical Approach Volume I." Brownridge, P., S. W. Holman, S. J. Gaskell, C. M. Grant, V. M. Harman, S. J. Hubbard, K.
Lanthaler, C. Lawless, R. O'Cualain, P. Sims, R. Watkins and R. J. Beynon (2011). "Global absolute quantification of a proteome: Challenges in the deployment of a QconCAT strategy." Proteomics 11(15): 2957-70.
Brun, V., A. Dupuis, A. Adrait, M. Marcellin, D. Thomas, M. Court, F. Vandenesch and J. Garin (2007). "Isotope-labeled protein standards: toward absolute quantitative proteomics." Mol Cell Proteomics 6(12): 2139-49.
Campbell, J., T. Rezai, A. Prakash, B. Krastins, L. Dayon, M. Ward, S. Robinson and M. Lopez (2011). "Evaluation of absolute peptide quantitation strategies using selected reaction monitoring." Proteomics 11(6): 1148-52.
Cech, N. B. and C. G. Enke (2001). "Practical implications of some recent studies in electrospray ionization fundamentals." Mass Spectrom Rev 20(6): 362-87.
Chelius, D. and P. V. Bondarenko (2002). "Quantitative profiling of proteins in complex mixtures using liquid chromatography and mass spectrometry." J Proteome Res 1(4): 317-23.
Congdon, R. W., G. W. Muth and A. G. Splittgerber (1993). "The binding interaction of Coomassie blue with proteins." Anal Biochem 213(2): 407-13.
Couto, N. B., Jill. Gaskell, Simon J. (2011). "Matrix-assisted laser desorption/ionisation mass spectrometric response factors of peptides generated using different proteolytic enzymes." Journal of Mass Soectrometry 46: 1233-1240.
Cox, J. and M. Mann (2008). "MaxQuant enables high peptide identification rates, individualized p.p.b.-range mass accuracies and proteome-wide protein quantification." Nat Biotechnol 26(12): 1367-72.
DeSouza, L. V., A. M. Taylor, W. Li, M. S. Minkoff, A. D. Romaschin, T. J. Colgan and K. W. Siu (2008). "Multiple reaction monitoring of mTRAQ-labeled peptides enables absolute quantification of endogenous levels of a potential cancer marker in cancerous and normal endometrial tissues." J Proteome Res 7(8): 3525-34.
References
103
Engvall, E. and P. Perlmann (1971). "Enzyme-linked immunosorbent assay (ELISA). Quantitative assay of immunoglobulin G." Immunochemistry 8(9): 871-4.
Eyers, C. E., C. Lawless, D. C. Wedge, K. W. Lau, S. J. Gaskell and S. J. Hubbard (2011). "CONSeQuence: prediction of reference peptides for absolute quantitative proteomics using consensus machine learning approaches." Mol Cell Proteomics 10(11): M110 003384.
Eyers, C. E., D. M. Simpson, S. C. Wong, R. J. Beynon and S. J. Gaskell (2008). "QCAL--a novel standard for assessing instrument conditions for proteome analysis." J Am Soc Mass Spectrom 19(9): 1275-80.
Fenn, J. B., M. Mann, C. K. Meng, S. F. Wong and C. M. Whitehouse (1989). "Electrospray ionization for mass spectrometry of large biomolecules." Science 246(4926): 64-71.
Fitzgerald, M. C., G. R. Parr and L. M. Smith (1993). "Basic matrices for the matrix-assisted laser desorption/ionization mass spectrometry of proteins and oligonucleotides." Anal Chem 65(22): 3204-11.
Fredens, J., K. Engholm-Keller, A. Giessing, D. Pultz, M. R. Larsen, P. Hojrup, J. Moller-Jensen and N. J. Faergeman (2011). "Quantitative proteomics by amino acid labeling in C. elegans." Nat Methods 8(10): 845-7.
Gallien, S., E. Duriez and B. Domon (2011). "Selected reaction monitoring applied to proteomics." J Mass Spectrom 46(3): 298-312.
Geiger, T., J. R. Wisniewski, J. Cox, S. Zanivan, M. Kruger, Y. Ishihama and M. Mann (2011). "Use of stable isotope labeling by amino acids in cell culture as a spike-in standard in quantitative proteomics." Nat Protoc 6(2): 147-57.
Gerber, S. A., J. Rush, O. Stemman, M. W. Kirschner and S. P. Gygi (2003). "Absolute quantification of proteins and phosphoproteins from cell lysates by tandem MS." Proc Natl Acad Sci U S A 100(12): 6940-5.
Ghaemmaghami, S., W. K. Huh, K. Bower, R. W. Howson, A. Belle, N. Dephoure, E. K. O'Shea and J. S. Weissman (2003). "Global analysis of protein expression in yeast." Nature 425(6959): 737-41.
Gouw, J. W., J. Krijgsveld and A. J. Heck (2010). "Quantitative proteomics by metabolic labeling of model organisms." Mol Cell Proteomics 9(1): 11-24.
Gygi, S. P., B. Rist, S. A. Gerber, F. Turecek, M. H. Gelb and R. Aebersold (1999). "Quantitative analysis of complex protein mixtures using isotope-coded affinity tags." Nat Biotechnol 17(10): 994-9.
Gygi, S. P., Y. Rochon, B. R. Franza and R. Aebersold (1999). "Correlation between protein and mRNA abundance in yeast." Mol Cell Biol 19(3): 1720-30.
Hanke, S., H. Besir, D. Oesterhelt and M. Mann (2008). "Absolute SILAC for accurate quantitation of proteins in complex mixtures down to the attomole level." J Proteome Res 7(3): 1118-30.
Heller, M., H. Mattou, C. Menzel and X. Yao (2003). "Trypsin catalyzed 16O-to-18O exchange for comparative proteomics: tandem mass spectrometry comparison using MALDI-TOF, ESI-QTOF, and ESI-ion trap mass spectrometers." J Am Soc Mass Spectrom 14(7): 704-18.
Hillenkamp, F., M. Karas, R. C. Beavis and B. T. Chait (1991). "Matrix-assisted laser desorption/ionization mass spectrometry of biopolymers." Anal Chem 63(24): 1193A-1203A.
Hsu, J. L., S. Y. Huang, N. H. Chow and S. H. Chen (2003). "Stable-isotope dimethyl labeling for quantitative proteomics." Anal Chem 75(24): 6843-52.
Ishihama, Y., T. Schmidt, J. Rappsilber, M. Mann, F. U. Hartl, M. J. Kerner and D. Frishman (2008). "Protein abundance profiling of the Escherichia coli cytosol." BMC Genomics 9: 102.
References
104
Jeong, H., V. Barbe, C. H. Lee, D. Vallenet, D. S. Yu, S. H. Choi, A. Couloux, S. W. Lee, S. H. Yoon, L. Cattolico, C. G. Hur, H. S. Park, B. Segurens, S. C. Kim, T. K. Oh, R. E. Lenski, F. W. Studier, P. Daegelen and J. F. Kim (2009). "Genome sequences of Escherichia coli B strains REL606 and BL21(DE3)." J Mol Biol 394(4): 644-52.
Johnson, R. S. M., Stephen A. Biemann, Klaus (1988). "Collision-induced fragmentation of (M+H)+ ions of peptides. Side chain specific sequence ions." International Journal of Mass Spectrometry and Ion Processes 86: 137-154.
Karas, M. and F. Hillenkamp (1988). "Laser desorption ionization of proteins with molecular masses exceeding 10,000 daltons." Anal Chem 60(20): 2299-301.
Kettenbach, A. N., J. Rush and S. A. Gerber (2011). "Absolute quantification of protein and post-translational modification abundance with stable isotope-labeled synthetic peptides." Nat Protoc 6(2): 175-86.
Krause, E., H. Wenschuh and P. R. Jungblut (1999). "The dominance of arginine-containing peptides in MALDI-derived tryptic mass fingerprints of proteins." Anal Chem 71(19): 4160-5.
Krijgsveld, J., R. F. Ketting, T. Mahmoudi, J. Johansen, M. Artal-Sanz, C. P. Verrijzer, R. H. Plasterk and A. J. Heck (2003). "Metabolic labeling of C. elegans and D. melanogaster for quantitative proteomics." Nat Biotechnol 21(8): 927-31.
Lewis, M., G. Chang, N. C. Horton, M. A. Kercher, H. C. Pace, M. A. Schumacher, R. G. Brennan and P. Lu (1996). "Crystal structure of the lactose operon repressor and its complexes with DNA and inducer." Science 271(5253): 1247-54.
Li, Y. F., R. J. Arnold, H. Tang and P. Radivojac (2010). "The importance of peptide detectability for protein identification, quantification, and experiment design in MS/MS proteomics." J Proteome Res 9(12): 6288-97.
Liu, H., R. G. Sadygov and J. R. Yates, 3rd (2004). "A model for random sampling and estimation of relative protein abundance in shotgun proteomics." Anal Chem 76(14): 4193-201.
Luber, C. A., J. Cox, H. Lauterbach, B. Fancke, M. Selbach, J. Tschopp, S. Akira, M. Wiegand, H. Hochrein, M. O'Keeffe and M. Mann (2010). "Quantitative proteomics reveals subset-specific viral recognition in dendritic cells." Immunity 32(2): 279-89.
Lundgren, D. H., S. I. Hwang, L. Wu and D. K. Han (2010). "Role of spectral counting in quantitative proteomics." Expert Rev Proteomics 7(1): 39-53.
Mallick, P., M. Schirle, S. S. Chen, M. R. Flory, H. Lee, D. Martin, J. Ranish, B. Raught, R. Schmitt, T. Werner, B. Kuster and R. Aebersold (2007). "Computational prediction of proteotypic peptides for quantitative proteomics." Nat Biotechnol 25(1): 125-31.
Mandel, M. and A. Higa (1970). "Calcium-dependent bacteriophage DNA infection." J Mol Biol 53(1): 159-62.
Oda, Y., K. Huang, F. R. Cross, D. Cowburn and B. T. Chait (1999). "Accurate quantitation of protein expression and site-specific phosphorylation." Proc Natl Acad Sci U S A 96(12): 6591-6.
Ong, S. E., B. Blagoev, I. Kratchmarova, D. B. Kristensen, H. Steen, A. Pandey and M. Mann (2002). "Stable isotope labeling by amino acids in cell culture, SILAC, as a simple and accurate approach to expression proteomics." Mol Cell Proteomics 1(5): 376-86.
Ong, S. E. and M. Mann (2005). "Mass spectrometry-based proteomics turns quantitative." Nat Chem Biol 1(5): 252-62.
Pace, C. N., F. Vajdos, L. Fee, G. Grimsley and T. Gray (1995). "How to measure and predict the molar absorption coefficient of a protein." Protein Sci 4(11): 2411-23.
Pan, S., R. Aebersold, R. Chen, J. Rush, D. R. Goodlett, M. W. McIntosh, J. Zhang and T. A. Brentnall (2009). "Mass spectrometry based targeted protein quantification: methods and applications." J Proteome Res 8(2): 787-97.
References
105
Picotti, P., B. Bodenmiller, L. N. Mueller, B. Domon and R. Aebersold (2009). "Full dynamic range proteome analysis of S. cerevisiae by targeted proteomics." Cell 138(4): 795-806.
Picotti, P., O. Rinner, R. Stallmach, F. Dautel, T. Farrah, B. Domon, H. Wenschuh and R. Aebersold (2010). "High-throughput generation of selected reaction-monitoring assays for proteins and proteomes." Nat Methods 7(1): 43-6.
Pratt, J. M., D. M. Simpson, M. K. Doherty, J. Rivers, S. J. Gaskell and R. J. Beynon (2006). "Multiplexed absolute quantification for proteomics using concatenated signature peptides encoded by QconCAT genes." Nat Protoc 1(2): 1029-43.
Rigaut, G., A. Shevchenko, B. Rutz, M. Wilm, M. Mann and B. Seraphin (1999). "A generic protein purification method for protein complex characterization and proteome exploration." Nat Biotechnol 17(10): 1030-2.
Rivers, J., D. M. Simpson, D. H. Robertson, S. J. Gaskell and R. J. Beynon (2007). "Absolute multiplexed quantitative analysis of protein expression during muscle development using QconCAT." Mol Cell Proteomics 6(8): 1416-27.
Ross, P. L., Y. N. Huang, J. N. Marchese, B. Williamson, K. Parker, S. Hattan, N. Khainovski, S. Pillai, S. Dey, S. Daniels, S. Purkayastha, P. Juhasz, S. Martin, M. Bartlet-Jones, F. He, A. Jacobson and D. J. Pappin (2004). "Multiplexed protein quantitation in Saccharomyces cerevisiae using amine-reactive isobaric tagging reagents." Mol Cell Proteomics 3(12): 1154-69.
Schmidt, A., J. Kellermann and F. Lottspeich (2005). "A novel strategy for quantitative proteomics using isotope-coded protein labels." Proteomics 5(1): 4-15.
Silva, J. C., R. Denny, C. A. Dorschel, M. Gorenstein, I. J. Kass, G. Z. Li, T. McKenna, M. J. Nold, K. Richardson, P. Young and S. Geromanos (2005). "Quantitative proteomic analysis by accurate mass retention time pairs." Anal Chem 77(7): 2187-200.
Silva, J. C., M. V. Gorenstein, G. Z. Li, J. P. Vissers and S. J. Geromanos (2006). "Absolute quantification of proteins by LCMSE: a virtue of parallel MS acquisition." Mol Cell Proteomics 5(1): 144-56.
Studier, F. W. (2005). "Protein production by auto-induction in high density shaking cultures." Protein Expr Purif 41(1): 207-34.
Studier, F. W. and B. A. Moffatt (1986). "Use of bacteriophage T7 RNA polymerase to direct selective high-level expression of cloned genes." J Mol Biol 189(1): 113-30.
Tholey, A. and E. Heinzle (2006). "Ionic (liquid) matrices for matrix-assisted laser desorption/ionization mass spectrometry-applications and perspectives." Anal Bioanal Chem 386(1): 24-37.
Thompson, A., J. Schafer, K. Kuhn, S. Kienle, J. Schwarz, G. Schmidt, T. Neumann, R. Johnstone, A. K. Mohammed and C. Hamon (2003). "Tandem mass tags: a novel quantification strategy for comparative analysis of complex protein mixtures by MS/MS." Anal Chem 75(8): 1895-904.
Towbin, H., T. Staehelin and J. Gordon (1979). "Electrophoretic transfer of proteins from polyacrylamide gels to nitrocellulose sheets: procedure and some applications." Proc Natl Acad Sci U S A 76(9): 4350-4.
Uhlen, M., E. Bjorling, C. Agaton, C. A. Szigyarto, B. Amini, E. Andersen, A. C. Andersson, P. Angelidou, A. Asplund, C. Asplund, L. Berglund, K. Bergstrom, H. Brumer, D. Cerjan, M. Ekstrom, A. Elobeid, C. Eriksson, L. Fagerberg, R. Falk, J. Fall, M. Forsberg, M. G. Bjorklund, K. Gumbel, A. Halimi, I. Hallin, C. Hamsten, M. Hansson, M. Hedhammar, G. Hercules, C. Kampf, K. Larsson, M. Lindskog, W. Lodewyckx, J. Lund, J. Lundeberg, K. Magnusson, E. Malm, P. Nilsson, J. Odling, P. Oksvold, I. Olsson, E. Oster, J. Ottosson, L. Paavilainen, A. Persson, R. Rimini, J. Rockberg, M. Runeson, A. Sivertsson, A. Skollermo, J. Steen, M. Stenvall, F. Sterky, S. Stromberg, M. Sundberg, H. Tegel, S. Tourle, E. Wahlund, A. Walden, J. Wan, H. Wernerus, J. Westberg, K. Wester, U. Wrethagen, L. L.
References
106
Xu, S. Hober and F. Ponten (2005). "A human protein atlas for normal and cancer tissues based on antibody proteomics." Mol Cell Proteomics 4(12): 1920-32.
Uhlen, M., B. Nilsson, B. Guss, M. Lindberg, S. Gatenbeck and L. Philipson (1983). "Gene fusion vectors based on the gene for staphylococcal protein A." Gene 23(3): 369-78.
Unwin, R. D. (2010). "Quantification of proteins by iTRAQ." Methods Mol Biol 658: 205-15. Uphaus, R. A., E. Flaumenhaft and J. J. Katz (1967). "A living organism of unusual isotopic
composition. Sequential and cumulative replacement of stable isotopes in Chlorella vulgaris." Biochim Biophys Acta 141(3): 625-32.
Vogel, C., G. M. Silva and E. M. Marcotte (2011). "Protein Expression Regulation under Oxidative Stress." Mol Cell Proteomics 10(12): M111 009217.
Wang, P., L. Robert, J. Pelletier, W. L. Dang, F. Taddei, A. Wright and S. Jun (2010). "Robust growth of Escherichia coli." Curr Biol 20(12): 1099-103.
Watson, B., Bell, Gann, Levine, Losick (2004). "Molecular Biology of the Gene, Fifth Edition." Wilkins, M. R., C. Pasquali, R. D. Appel, K. Ou, O. Golaz, J. C. Sanchez, J. X. Yan, A. A. Gooley, G.
Hughes, I. Humphery-Smith, K. L. Williams and D. F. Hochstrasser (1996). "From proteins to proteomes: large scale protein identification by two-dimensional electrophoresis and amino acid analysis." Biotechnology (N Y) 14(1): 61-5.
Wilkins, M. R., J. C. Sanchez, A. A. Gooley, R. D. Appel, I. Humphery-Smith, D. F. Hochstrasser and K. L. Williams (1996). "Progress with proteome projects: why all proteins expressed by a genome should be identified and how to do it." Biotechnol Genet Eng Rev 13: 19-50.
Yoon, S. H., M. J. Han, S. Y. Lee, K. J. Jeong and J. S. Yoo (2003). "Combined transcriptome and proteome analysis of Escherichia coli during high cell density culture." Biotechnol Bioeng 81(7): 753-67.
Publications
7. Publications containing work from this thesis 107
Publications
108
7. Publications containing work from this thesis
Philip J. Brownridge, Victoria M. Harman, Deborah M. Simpson, and Robert J. Beynon
(2012) ‘Absolute Multiplexed Protein Quantification Using QconCAT technology’
Methods in Molecular Biology - Quantitative Methods in Proteomics, 893(3), 267-293