Page 1
QFI Core Spring 2014 Solutions Page 1
QFI Core Model Solutions
Spring 2014
1. Learning Objectives: 1. The candidate will understand the fundamentals of mathematics and economics
underlying quantitative methods in finance and investments.
Learning Outcomes:
(1a) Understand and apply concepts of probability and statistics important in
mathematical finance.
(1b) Understand the importance of the no-arbitrage condition in assert pricing.
(1c) Apply the concept of martingale in asset pricing.
Sources:
Neftci, Chapter 2
Commentary on Question:
This question examines the candidates’ fundamental understanding of important concepts
of arbitrage, risk-neutral probabilities and arbitrage free pricing of derivatives within a
one-period setting. The question in general is straightforward so that many candidates
performed exceptionally well. However, some candidates arrived at the correct answers
but forgot to fill in important details in the calculations.
Solution:
(a) Determine the range of 𝑎 so that there is no arbitrage opportunity.
Commentary on Question:
This part of the question expects candidates to apply direct intuition to determine
the condition for no-arbitrage. Instead, some candidates calculate the range using
the representation of the arbitrage theorem which would have taken longer time
to arrive at the same result.
An ‘arbitrage opportunity’ exists with investments that yield non-negative profits
with either no current net commitment or a negative net commitment today.
Condition 𝑎/𝑆(0) < 1.05 < 150/𝑆(0) ensures no arbitrage opportunities.
Since S (0) = 100, a < 105 < 150
Page 2
QFI Core Spring 2014 Solutions Page 2
1. Continued
Alternatively, one can also reach the same conclusion by solving the range of a
using the following representation:
[1100
] = [1.05 1.05a 150
] [ψ1ψ2]
ψ1 𝑎𝑛𝑑 ψ2 need to exist and be positive to ensure no arbitrage opportunity.
(b) Calculate the state prices in this market.
Commentary on Question
This part involves setting up the equations and solving them, which was
straightforward.
We have the following no-arbitrage representation:
[1100
] = [1.05 1.0580 150
] [ψ1ψ2]
where 𝜓1 and 𝜓2 are the state prices.
This yields us the following 2 equations:
ψ1 + ψ2 = 1/1.05
0.8ψ1 + 1.5ψ2 = 1
This gives us
ψ1 =1.5 − 1.05
1.05 ∗ 0.7= 0.6122
and
ψ2 =1.05 − 0.8
1.05 ∗ 0.7= 0.3401
(c) Interpret these state prices.
Commentary on Question:
Candidates should specify the return on each state, i.e. one unit in state 1 and
nothing in state 2, to demonstrate full understanding. Most candidates missed
specifying the zero return on the other state.
ψ1 is the price you are willing to pay today for a unit of account in state 1 and
nothing in state 2.
ψ2 is the price you are willing to pay today for a unit of account in state 2 and
nothing in state 1.
Page 3
QFI Core Spring 2014 Solutions Page 3
1. Continued
(d) Calculate the risk-neutral probabilities of stock price movements in this market.
Commentary on Question:
Several candidates did well on this part and indeed, many candidates also
identified a straightforward solution to this part of the question by taking the
answers from part (b) for 𝜓1 𝑎𝑛𝑑 𝜓2 and solving for 𝑃𝑖 by 𝑃𝑖 (1+r) = 𝜓𝑖.
If 𝑞 denotes the risk-neutral probability of the stock price being down, we solve
for:
100 = 𝑞 (80
1.05) + (1 − 𝑞) (
150
1.05)
The value of the stock today is equal to the expected value of the discounted price
process (also called the martingale property).
This yields us 𝑞 =45
70= 0.64 and 1 − 𝑞 = 0.36.
(e) Calculate the price of a straddle with payoff equal to (1) 100S , which expires at
the end of the period, using the risk-neutral probabilities.
Commentary on Question:
Some candidates lacked the understanding of the correct payoff to use in a given
state. This led to mislabeling of the probability of the direction (i.e. up or down)
of the stock price and resulted in an incorrect price of the straddle.
At the end of the period, the values of the derivatives are |80 − 100| = 20 and
|150 − 100| = 50, respectively, in states 𝜓1 and 𝜓2.
The risk neutral price of this derivative is therefore
𝑃 = 𝑞 ∗ (20
1.05) + (1 − 𝑞) ∗ (
50
1.05) = 29.25
(f) Confirm the value in (e) using the state prices calculated in (b).
Commentary on Question:
This part guided candidates to obtain the price of a straddle using an alternative
method; candidates who solved part (b) and part (e) correctly, obviously did this
part correctly.
According to the no-arbitrage theorem, this should exactly equal to
𝑃 = 20 𝜓1 + 50 𝜓2 = 20(0.6122) + 50(0.3401) = 29.25 which confirms the value we got in (e).
Page 4
QFI Core Spring 2014 Solutions Page 4
2. Learning Objectives: 1. The candidate will understand the fundamentals of mathematics and economics
underlying quantitative methods in finance and investments
Learning Outcomes:
(1a) Understand and apply concepts of probability and statistics important in
mathematical finance.
Sources:
Neftci, Chapters 2, 5, 8
Commentary on Question:
The main purpose of this question is to give the candidates a prelude on the theoretical
importance of the Binominal lattice as it can be used to approximate a log-normal
process, eventually linked to the geometric Brownian motion. This approximation
provides the theoretical underpinnings of justifying the use of the Binomial lattice to
simulate path processes for geometric Brownian motion. Such simulation is widely used
in practice.
The key concepts are understanding the Bernoulli distribution leading to Binomial when
you sum several of them, and the Normal approximation to the Binomial based on the
Central Limit Theorem.
The performance has been surprisingly with wide variation. Candidates either got it or
didn’t, hence we saw candidates at both extremes. The ones in the middle were able to
demonstrate some understanding particularly of Binomial and Normal, but failed to
provide the parameter values of the distributions.
Solution:
(a) Show that the price at time 𝑇 will be:
0
2exp
n
T
X nS S T T
n
, where nX is the total number of up jumps.
Commentary on Question:
Many could identify the up and down jumps in the binomial lattice but were
unable to generalize the projected stock price for longer periods. Still others
could not complete the demonstration because of missing to identify how the time
intervals were broken down using ∆𝑡 = 𝑇/𝑛.
If the share price makes 𝑋𝑛 “up jumps,” then there must be 𝑛 − 𝑋𝑛 “down
jumps.”
Its value therefore at time 𝑇 is
𝑆𝑇 = 𝑆0 × 𝑢𝑋𝑛 × 𝑑𝑛−𝑋𝑛
Using the expressions given for 𝑢 and 𝑑, we have
Page 5
QFI Core Spring 2014 Solutions Page 5
2. Continued
𝑆𝑇 = 𝑆0 × 𝑒(𝜇 ∆𝑡+ 𝜎 √∆𝑡)𝑋𝑛 × 𝑒(𝜇 ∆𝑡− 𝜎 √∆𝑡)(𝑛−𝑋𝑛)
𝑆𝑇 = 𝑆0 × exp[𝑛𝜇 ∆𝑡 + (2𝑋𝑛 − 𝑛)𝜎 √∆𝑡 ]
Using the fact that ∆𝑡 = 𝑇/𝑛, we get the desired result:
𝑆𝑇 = 𝑆0 × exp [𝜇𝑇 + 𝜎 √∆𝑡 (2𝑋𝑛 − 𝑛
√𝑛)]
(b) Specify the distribution of nX and state how this distribution can be
approximated when 𝑛 is large, assuming the share price will be equally likely to
increase or decrease.
Commentary on Question:
While several could identify the Binomial, many were unable to correctly identify
the parameters. Surprisingly though was to find several candidates not knowing
the Normal approximation of the Binomial or using the concept of Central Limit
Theorem to identify the limiting distribution.
Since there are 𝑛 independent price movements, each equally likely to go up or
down,
then 𝑋𝑛 has a Binomial distribution with parameters 𝑛 and 1/2.
If 𝑛 is large enough, this can be approximated by a Normal distribution with the
same mean and variance. That is 𝑋𝑛~𝑁 (1
2𝑛,1
4 𝑛)
This is also a result of the Central Limit Theorem.
(c) Determine the distribution of 0
TS
S when 𝑛 approaches infinity, using part (b).
Commentary on Question:
Again, here if they were able to identify the Normal distribution in part (b),
candidates got this with less difficulty. However, some standardization of the
Normal distribution is necessary to arrive at the correct answer. Some candidates
could not recognize such property of the Normal distribution.
Using the result in (b), we then know that when 𝑛 is large, by the Central Limit
Theorem, 𝑋𝑛 − (𝑛/2)
√𝑛/4= 2𝑋𝑛 − 𝑛
√𝑛~ 𝑁(0,1)
is Standard Normal.
Page 6
QFI Core Spring 2014 Solutions Page 6
2. Continued
From (a), if we take logarithm of both sides, we get
log𝑆𝑇𝑆0= 𝜇𝑇 + 𝜎 √𝑇 (
2𝑋𝑛 − 𝑛
√𝑛)
Therefore as lim𝑛→∞
log𝑆𝑇
𝑆0= 𝜇𝑇 + 𝜎√𝑇𝑍, where Z is standard normal random
variable.
Thus, we see that (it is important to specify the mean and variance)
log𝑆𝑇𝑆0~ 𝑁 (𝜇𝑇, 𝜎2 𝑇)
Comment: Candidate could express this in words: where log𝑆𝑇
𝑆0 has a Normal
distribution with mean 𝜇𝑇 and variance 𝜎2 𝑇.
Thus, we deduce that 𝑆𝑇
𝑆0 has a log-normal distribution with parameters 𝜇𝑇 and
𝜎2 𝑇.
Page 7
QFI Core Spring 2014 Solutions Page 7
3. Learning Objectives: 2. The candidate will understand how to apply the fundamental theory underlying
the standard models for pricing financial derivatives. The candidate will
understand the implications for option pricing when markets do not satisfy the
common assumptions used in option pricing theory such as market completeness,
bounded variation, perfect liquidity, etc.
Learning Outcomes:
(2j) Demonstrate understanding of interest rate models.
(2k) Understand the concept of calibration and describe the issues related to
calibration.
Sources:
Nefci, Salih: An Introduction to the Mathematics of Financial Derivatives Ch. 18
Wilmott, Paul: Wilmott Introduces Quantitative Finance, Ch. 17
Commentary on Question:
Commentary listed underneath question component
Solution:
(a) Define the technique of calibration as it relates to one-factor interest rate models
and explain why the Ho & Lee model facilitates calibration.
Commentary on Question:
Candidates generally did well on this question, but many candidates overlooked
answering why the Ho-Lee model structure facilitates calibration.
Calibration, or yield curve fitting, requires that one or more of the parameters in
the model be allowed to depend on time. This functional dependence on time is
then carefully chosen to make an output of the model, the price of a zero-coupon
bond, exactly matching its observed market price.
The drift parameter of the Ho & Lee model, η(t), is time-dependent and thus the
model can be calibrated.
(b) State an argument for and an argument against calibration.
Commentary on Question:
Candidates generally performed well on this question. The quality of answers
could have been improved by further explaining why it is important to match to
market prices and conversely why parameter instability may be an issue.
Page 8
QFI Core Spring 2014 Solutions Page 8
3. Continued
For:
In the process of hedging, a calibrated model will output bond prices that match
current market prices of the hedge instruments being purchased. This provides a
consistent basis for hedging and trading the assets and liabilities.
Against:
In practice, a calibrated model has been shown to be inconsistent after the date of
the calibration and will need to be frequently re-calibrated. This may also indicate
that the model form does not fully capture the complexities of the yield curve.
(c) Show that 0t tr r at cW
Commentary on Question:
This was a straightforward question that many candidates answered easily.
Integrate with respect to t and apply the t= 0 conditions, noting that W0 = 0
Gives rt = r0 + at + c Wt;
(d) Derive a formula for the arbitrage-free price B(0, T) of a default-free zero-coupon
bond, as a function of 0 , , ,r a c and T. Hint: 2 3
0 /6( )
T
tcW d tc TE e e
Commentary on Question:
This question was answered well by candidates who knew how to setup the price
equation for B(0,T) as the expected value. Common mistakes were in algebra and
signs, which were penalized commensurate with candidate’s demonstration of
understanding. Candidates should definitely be careful in their derivations under
exam conditions.
𝐵(0, 𝑇) = 𝐸 [𝑒−∫ 𝑟𝑡𝑑𝑡𝑇0 ]
𝐵(0, 𝑇) = [𝑒−𝑟0𝑇−𝑎𝑇2
2 ] 𝐸 [𝑒∫ −𝑐𝑊𝑡𝑑𝑡𝑇0 ]
From the hint the expectation simplifies, yielding the following:
𝐵(0, 𝑇) = 𝑒−𝑟0𝑇−𝑎𝑇2
2+𝑐2𝑇3
6
(e) Derive a formula for the continuously compounded forward rate
F(0, T, U) , where 0U T , as a function of 0 , , , ,r a c T and U.
Page 9
QFI Core Spring 2014 Solutions Page 9
3. Continued
Commentary on Question:
Some candidates applied the wrong starting formula for the forward rate – note
that this was provided on the formula sheet. Candidates should be alert that this
question made use of the prior section answer.
It is important for candidates to clearly show their work in order to receive full
credit. Candidates who fully derived and simplified their answers scored higher
as these were higher quality answers.
𝐹(0, 𝑇, 𝑈) =log𝐵(0, 𝑇) − log𝐵(0, 𝑈)
𝑈 − 𝑇
Since logB(0,T) = −𝑟0𝑇 −𝑎𝑇2
2+𝑐2𝑇3
6
F(0,T,U) becomes
𝐹(0, 𝑇, 𝑈) =𝑟0(𝑈 − 𝑇) +
𝑎(𝑈2 − 𝑇2)2 −
𝑐2(𝑈3 − 𝑇3)6
𝑈 − 𝑇
By factoring this simplifies to
𝐹(0, 𝑇, 𝑈) = 𝑟0 +𝑎(𝑈 + 𝑇)
2−𝑐2(𝑈2 + 𝑈𝑇 + 𝑇2)
6
(f) Derive a formula for the instantaneous forward rate (0, )f T as a function of
0 , , ,r a c and T.
Commentary on Question:
Two solutions were possible here, and both approaches were commonly used
although one was simpler. Candidates that answered the prior sections well
generally did well on this part.
Two solutions: just substitute U=T in F(0,T,U) and simplify to obtain 𝑟0 + 𝑎𝑇 −𝑐2𝑇2
2 which is the simpler approach or alternatively candidates could differentiate
–logB(0,T) with respect to T and simplify to obtain the same result.
Page 10
QFI Core Spring 2014 Solutions Page 10
4. Learning Objectives: 1. The candidate will understand the fundamentals of mathematics and economics
underlying quantitative methods in finance and investments.
Learning Outcomes:
(1a) Understand and apply concepts of probability and statistics important in
mathematical finance.
(1d) Understand Ito integral and stochastic differential equations.
(1e) Understand and apply Ito’s Lemma.
Sources:
Nefci, Salih: An Introduction to the Mathematics of Financial Derivatives Chapters 8, 10,
and 11
Wilmott, Paul: Wilmott Introduces Quantitative Finance, Ch. 16
Commentary on Question:
Commentary listed underneath question component.
Solution:
(a) Name the key characteristic of the above CIR process and interpret each of its
parameters , ,a b and .
Commentary on Question:
Candidates generally answered this question well. Note that some candidates
answered that the CIR only produces positive interest rates – which is not
technically true as it is dependent on the parameter calibration.
Key characteristic of process
mean reverting process;
Parameter 𝑎 > 0 controls the average length of excursions away from the long-
run trend
Parameter 𝑏 represents the long-run mean
Parameter 𝜎 represents the long-run volatility
(b) State the condition(s) on the parameters , ,a b and so that the spot rate stays
positive.
Commentary on Question:
Few candidates answered this question well. Note that it is possible to derive the
condition from first principles but it was not necessary to do that to achieve full
marks for this question.
Page 11
QFI Core Spring 2014 Solutions Page 11
4. Continued
Condition: 𝑎𝑏 > 𝜎2/2
(c) Derive a stochastic differential equation satisfied by tY using Ito’s Lemma.
Commentary on Question:
This question required a straightforward application of Ito’s lemma, which most
candidates were familiar with. The most common error was in algebra, which
candidates should be careful of. Candidates showing their work and steps
(defining the components of Ito’s lemma and their results) were generally
considered to have higher quality answers and it was easier to award partial
credits.
From Ito’s Lemma: 𝑑𝑌 = 𝜕𝑌
𝜕𝑋 𝑑𝑋𝑡 +
𝜕𝑌
𝜕𝑡 𝑑𝑡 +
1
2 (𝜎√𝑋)2
𝜕2𝑌
𝜕𝑋2 𝑑𝑡
Since 𝜕𝑌
𝜕𝑋= 2𝑋𝑡 ,
𝜕𝑌
𝜕𝑡= 0,
𝜕2𝑌
𝜕𝑋2= 2, we have
𝑑𝑌 = 2𝑋𝑡 𝑑𝑋𝑡 + 0 + 𝜎2𝑋𝑡 𝑑𝑡
= 2𝑋𝑡 [𝑎(𝑏 − 𝑋𝑡) 𝑑𝑡 + 𝜎√𝑋𝑡 𝑑𝐵𝑡 ] + 𝜎2𝑋𝑡 𝑑𝑡
= [ (2𝑎𝑏 + 𝜎2 )𝑋𝑡 – 2𝑎 𝑋𝑡2 ]𝑑𝑡 + 2 𝜎 𝑋𝑡
32 𝑑𝐵𝑡
(d) Verify that 1( )m t satisfies the following differential equation:
11
( )( )
dm ta b m t
dt
Commentary on Question:
This question had a relatively straightforward answer if the candidates had the
appropriate setup. It is very important to explain the steps and show all work. In
particular, where a term cancels out or has an expected value of zero, it is
important to state the reason rather than simply working through to get to the
final answer, as we considered a documented, well laid out answer to be of higher
quality.
dm1(t)
dt =
d
dt E[Xt]
= 𝐸[𝑑
𝑑𝑡𝑋𝑡]
= 𝑎 𝐸[𝑏 − 𝑋𝑡 ] = 𝑎(𝑏 − 𝑚1(𝑡)).
The 3rd equality above follows from the given SDE and the fact that the
increments of Brownian motion have expectation equal to zero.
Page 12
QFI Core Spring 2014 Solutions Page 12
4. Continued
(e) Show that 1( ) ( ) atm t b c b e for all 0.t
Commentary on Question:
Candidates that did well on this question generally started from the answer in d)
(which was given in the question) and derived the final form requested.
Starting from the answer in d): 𝑑𝑚1(𝑡)
𝑑𝑡= 𝑎(𝑏 − 𝑚1 (𝑡))
𝑑(𝑏−𝑚1(𝑡))
𝑑𝑡= −𝑎(𝑏 − 𝑚1 (𝑡))
𝑑
𝑑𝑡𝑙𝑛(𝑏 − 𝑚1(𝑡)) = −𝑎,
𝑙𝑛(𝑏 − 𝑚1(𝑡)) = 𝑙𝑛(𝑏 − 𝑚1(0)) − 𝑎 𝑡.
Since 𝑚1(0) = 𝑐, it follows that
𝑚1(𝑡) = 𝑏 + (𝑐 − 𝑏)𝑒−𝑎𝑡.
An alternative proof is to show that the function 𝑚1(𝑡) = 𝑏 + (𝑐 − 𝑏)𝑒−𝑎𝑡 satisfies
the PDE in (d), and
the initial condition 𝑚1(0) = 𝑐.
(f) Verify that 2 ( )m t satisfies the following differential equation:
221 2
( )2 ( ) 2 ( )
dm tab m t a m t
dt
Commentary on Question:
Candidates who answered the prior questions generally did well, although many
candidates did not attempt these later parts after being stopped by the prior parts.
This question made use of the answer to part c).
Many candidates simply wrote that the expected value of Brownian motion
increments was zero without any explanation – we considered questions with
documented work steps to be of higher quality.
𝑑𝑚2(𝑡)
𝑑𝑡 =
𝑑
𝑑𝑡 𝐸[𝑌𝑡]
= (2𝑎𝑏 + 𝜎2)𝐸[𝑋𝑡] – 2𝑎 𝐸[𝑋𝑡2] + 0
= (2𝑎𝑏 + 𝜎2) 𝑚1(𝑡)– 2𝑎 𝑚2(𝑡).
Page 13
QFI Core Spring 2014 Solutions Page 13
4. Continued
The 2rd equality above follows from the SDE derived in (c) and the fact that the
increments of Brownian motion have 0 mean.
(g) Show 2
0lim2
t t
bVar X X c
a
assuming 2 ( )
lim 0.t
dm t
dt
Commentary on Question:
High quality answers generally showed the steps and answers for each
component of the calculation. We noted that many candidates did not attempt this
question if they did not complete the prior sections – candidates should note that
partial credits were easily available for this part of the question even though it
was the final part of a long question.
Since 𝑙𝑖𝑚𝑡→∞
𝑑 𝑚2(𝑡)
𝑑𝑡= 0, taking limits on the equation in (f) we have
0 = (2𝑎𝑏 + 𝜎2) 𝑙𝑖𝑚𝑡→∞
𝑚1(𝑡) – 2𝑎 𝑙𝑖𝑚𝑡→∞
𝑚2(𝑡).
It follows that
𝑙𝑖𝑚𝑡→∞
𝑚2(𝑡) = (𝑏 + 𝜎2
2𝑎) 𝑙𝑖𝑚𝑡→∞
𝑚1(𝑡).
Note that 𝑙𝑖𝑚𝑡→∞
𝑚1(𝑡) = 𝑏 from (e), we have
𝑙𝑖𝑚𝑡→∞
𝑚2(𝑡) = (𝑏 + 𝜎2
2𝑎)𝑏.
Since 𝑉𝑎𝑟[𝑋𝑡|𝑋0 = 𝑐] = 𝑚2(𝑡) − 𝑚1(𝑡)2, we have
lim𝑡→∞
𝑉𝑎𝑟[𝑋𝑡|𝑋0 = 𝑐] = (𝑏 + 𝜎2
2𝑎) 𝑏 − 𝑏2 =
𝑏𝜎2
2𝑎
Page 14
QFI Core Spring 2014 Solutions Page 14
5. Learning Objectives: 2. The candidate will understand how to apply the fundamental theory underlying
the standard models for pricing financial derivatives. The candidate will
understand the implications for option pricing when markets do not satisfy the
common assumptions used in option pricing theory such as market completeness,
bounded variation, perfect liquidity, etc.
Learning Outcomes:
(2g) Identify limitations of the Black-Scholes pricing formula.
(2l) Understand the HJM model and the HJM no-arbitrage condition.
Sources:
Neftci An introduction to the Mathematics of Financial Derivatives, Second Edition Ch.
16, 18, and 19
Commentary on Question: The question is testing the understanding of interest rate
derivatives and their pricing. It is also testing whether candidates understand arbitrage
by solving a problem. Finally, it is addressing the practicality of the HJM and Classical
approaches to pricing.
Solution:
(a) Describe the terms of the following interest rate derivatives.
(i) Cap
(ii) Forward Rate Agreements
(iii) Interest Rate Swaps
Commentary on Question: Majority of candidates didn’t distinguish cap and
caplet. They missed the definition that the cap is the portfolio of the caplet. With
respect to the swap, many didn’t describe it as the portfolio of FRA’s or series of
exchanges. Many candidates missed the description of the payoffs of FRA.
(i) Cap is a collection of interest rate options, which has a payoff N*max(rl-
rc,0)*t where rl is floating rate (LIBOR rate), rc is capped rate. It’s for the
compensation of rising LIBOR interest rate. N is notional, t= term.
(ii) FRA is a contract between 2 parties for the reference forward interest rate.
The buyer will pay the difference if the reference rate is greater than
agreed rate and will receive if the reference rate is less than the agreed
rate. Payoff = abs[N*(fl-fa)*t], N is notional, t= term, fl=reference forward
rate, fa = contract agreed rate.
Page 15
QFI Core Spring 2014 Solutions Page 15
5. Continued
(iii) IRS is a contract between 2 parties to exchange cash flows from fixed and
floating interest rates for specified notional and terms. It is a series of
FRA’s.
(b) Explain shortfalls of the Black-Scholes assumptions when applied to interest rate
derivatives.
Commentary on Question: Some candidates described the shortfall of the equity
option model itself without referencing to the interest rate option. They missed the
early exercise feature and that interest rates are not assets. Good answer was
also seen by describing the impossibility of the payoff replication by dynamic
hedging in the B/S model.
The risk free interest rate r is kept constant in B/S, whereas the very reason for
interest rate derivatives is predicated on fluctuations in r.
Volatility is assumed to be constant in B/S; whereas the volatility of a bond
has to vary over time to maturity.
B/S assumes option are European-style; the early exercise provisions of
American-style options complicate matters
The underlying security used in B/S is a stock, which is an asset, whereas
interest rates are not assets.
The underlying security in B/S is a non-dividend paying stock; whereas bonds
may make coupons.
(c)
(i) Calculate the continuously compounded implied forward interest rate of
the FRA.
(ii) Describe the arbitrage opportunities if the continuously compounded risk-
free spot rate will be constant at 2.42% per annum for the next three years.
Commentary on Question: Question (i) was straightforward in the term
structure arbitrage assumption. For question (ii), many candidates described the
arbitrage profit realized in time 3. But in the notion of arbitrage, it should be time
zero cash flow profit.
(i) F(t,T,U) = [logB(t,T) – logB(t,U) ] / [U – T],
F(t,3,13) = [logB(t,3) – logB(t,13) ] / [13 – 3]
=[log0.95 – log0.73 ] / [10] = 2.63%
Page 16
QFI Core Spring 2014 Solutions Page 16
5. Continued
(ii) An arbitrage opportunity exists because B(t,3) > exp(-2.42%*3) = 0.93,
hence an investor can sell B(t,3) for 0.95 and invest at rate r=2.42%. At
the end of three years, the investor will owe 1 on the short bond but will
receive 1 on the investment at r. The cash flows at time 3 offset, but at
time t the investor makes 0.95 – 0.93 = 0.02.
(d) Contrast the Classical and HJM approaches to calculating the arbitrage-free prices
of bonds.
Commentary on Question: Many candidates described the models by
distinguishing Markov vs. non-Markov perspective. We gave them a credit for this
as well. Most candidates listed at least half of the points.
(i) Classical Approach:
It relies on spot rates at future time t
B(t,T) = E[𝑒−∫ 𝑟𝑠𝑑𝑠𝑇𝑡 ] w.r.t. risk-neutral probability P.
Requires a model for short rates and modeling the drift of the spot rate
and calibration to observed volatilities
(ii) HJM Approach:
Relies on the instantaneous forward rates observable at time t
B(t,T) = 𝑒−∫ 𝐹(𝑡,𝑠)𝑑𝑠𝑇𝑡
No spot rate modeling, but volatilities still need to be calibrated
HJM can be regarded as a true extension of the Black-Scholes
methodology to the fixed income sector
Page 17
QFI Core Spring 2014 Solutions Page 17
6. Learning Objectives: 1. The candidate will understand the fundamentals of mathematics and economics
underlying quantitative methods in finance and investments.
2. The candidate will understand how to apply the fundamental theory underlying
the standard models for pricing financial derivatives. The candidate will
understand the implications for option pricing when markets do not satisfy the
common assumptions used in option pricing theory such as market completeness,
bounded variation, perfect liquidity, etc.
Learning Outcomes:
(1e) Understand and apply Ito’s Lemma.
(2c) Demonstrate understanding of the differences and implications of real-world
versus risk-neutral probability measures.
(2f) Understand and apply Black Scholes Merton PDE (partial differential equation).
(2g) Identify limitations of the Black-Scholes pricing formula.
(2h) Describe and explain some approaches for relaxing the assumptions used in the
Black-Scholes formula.
Sources:
Nefci, Salih: An Introduction to the Mathematics of Financial Derivatives Chapters 3, 10,
and 13
Wilmott, Paul: Wilmott Introduces Quantitative Finance, Ch. 6
Commentary on Question:
The questions test whether the candidates could apply the fundamental theorem on which
Black Scholes formula is based, for different type of derivatives than plain vanilla
European option. It requires basic knowledge of Brownian motion and Ito’s lemma and
the related probability distributions that determine the asset returns at the contract
termination in sequence. Some candidates followed from basic to application in this
sequence, but many could not go through to the end.
Solution:
(a) Compare and contrast real and risk-neutral random walk.
Commentary on Question: Many candidates missed the description of sharing
volatility for real world and risk neutral world. Some candidates gave an
advanced answer contrasting probability measures for the two worlds.
Page 18
QFI Core Spring 2014 Solutions Page 18
6. Continued
Real random walk
Real refers to the actual random walk as seen, as realized.
It has a certain volatility σ and a certain drift rate μ.
Risk-neutral random walk
Both the real and the risk-neutral random asset paths have the same volatility;
difference is in the drift rates.
drift rate is the same as the risk-free interest rate r
(b) Derive, by applying Ito’s Lemma, the process that log S follows.
Commentary on Question: Many candidates missed the derivative with respect
to time being zero, but most got the right result.
Let S be the spot price of a certain stock at time t and let G = G(s, t) = log S.
Calculate
𝜕𝐺
𝜕𝑆 =
1
𝑆, 𝜕𝐺
𝜕𝑡= 0, and
𝜕2𝐺
𝜕𝑆2 = −
1
𝑆2.
Since 𝑑𝑆 = 𝜇𝑆𝑑𝑡 + 𝜎𝑆 𝑑𝐵, by Ito’s Lemma
𝑑𝐺 = 𝜕𝐺
𝜕𝑆𝑑𝑆+ 𝜕𝐺
𝜕𝑡𝑑𝑡+ 1
2(𝜎𝑆)2
𝜕2𝐺
𝜕𝑆2 𝑑𝑡
= 1
𝑆(𝜇𝑆𝑑𝑡 + 𝜎𝑆 𝑑𝐵)+0+ 1
2𝜎2𝑆2(− 1
𝑆2)𝑑𝑡
= (𝜇 −12𝜎2)𝑑𝑡 + 𝜎 𝑑𝐵.
(c)
Show that
24 ( )
8
( , ) ( ),
r T t
v t S e S t
0 t T
satisfies the Black-Scholes partial differential equation.
Commentary on Question:
The question tests the capability of the mathematical derivation by asking
candidates to apply fundamental theory. Some candidates miss-applied to
stochastic differential equation (Brownian motion). Many candidates gave right
answers. Many candidates missed describing the terminal payoff by replacing t
with T.
Page 19
QFI Core Spring 2014 Solutions Page 19
6. Continued
Recall that Black-Scholes PDE
𝜕𝑓
𝜕𝑡+ 𝑟𝑆
𝜕𝑓
𝜕𝑆+ 1
2σ2S2
𝜕2𝑓
𝜕𝑆2 = 𝑟𝑓.
Calculate 𝜕𝜈
𝜕𝑡=
4𝑟+𝜎2
8𝜈
𝜕𝜈
𝜕𝑆= 𝑒
(−(4𝑟+𝜎2)(𝑇−𝑡)
8)(1
2𝑆−
1
2) =1
2𝑆𝜈
𝜕2𝜈
𝜕𝑆2= 𝑒
(−(4𝑟+𝜎2)(𝑇−𝑡)
8)(−
1
4𝑆−
3
2) = − 1
4𝑆2𝜈
Substitute into the Black Scholes equation, its left hand side equals
4𝑟+𝜎2
8𝜈 + 𝑟𝑆 (
1
2𝑆𝜈) +
1
2𝜎2𝑆2(− 1
4𝑆2𝜈) = (
4𝑟+𝜎2
8+𝑟
2−1
8𝜎2) 𝜈 = 𝑟𝜈.
Thus 𝜈 satisfies the Black-Scholes PDE.
Describe the derivative whose value is given by ( , ).v t S
The payoff of a derivative at maturity T equals the value of the derivative at
𝑡 = 𝑇 (the boundary condition).
Since 𝜈(𝑇, 𝑆) = √𝑆𝑇, we conclude that the derivative whose value is given by
𝜈(𝑡, 𝑆) is the derivative paying √𝑆 at maturity.
(d) Show that for any time t, 0 £ t <T , the value of the equity option equals
e-r (T- t ) N
lnK
S(t)- r -
1
2s 2
æ
èç
ö
ø÷(T - t)
s T - t
æ
è
çççç
ö
ø
÷÷÷÷
where N( ) is the cumulative standard normal distribution.
Commentary on Question:
Some candidates utilized Black Scholes formula for put option without deriving it
in canonical way, meaning direct application of lognormal probability
distribution. Pre-understanding of digital option would make candidates avoid the
fundamental derivation of the payoff formula.
Page 20
QFI Core Spring 2014 Solutions Page 20
6. Continued
Under risk-neutral valuation, 𝑙𝑜𝑔 𝑆(𝑇) is normally distributed with
mean 𝜇 = 𝑙𝑜𝑔 𝑆(𝑡) + (𝑟 −𝜎2
2) (𝑇 – 𝑡)
variance 𝜔2 = 𝜎2 (𝑇 – 𝑡)
The event that 𝑆 ≤ 𝐾 is equivalent to that of log𝑆−𝜇
𝜔≤
log𝐾−𝜇
𝜔 and thus its
probability is given by
𝑃𝑟( 𝑆(𝑇) ≤ 𝐾) = 𝑃𝑟 ( log𝑆−𝜇
𝜔≤
log𝐾−𝜇
𝜔)
= 𝑁 (log𝐾−𝜇
𝜔).
That is, the value of the option at time 𝑇 is given by
𝑁(log𝐾−𝑙𝑜𝑔 𝑆(𝑡)− (𝑟−
𝜎2
2) (𝑇 – 𝑡)
𝜎√𝑇−𝑡).
Since the discount factor is given by 𝑒−𝑟(𝑇−𝑡) we find that the value of option
at time 𝑡 equals
𝑒−𝑟(𝑇−𝑡)𝑁(log
𝐾
𝑆(𝑡)− (𝑟−
𝜎2
2) (𝑇 – 𝑡)
𝜎√𝑇−𝑡).
Page 21
QFI Core Spring 2014 Solutions Page 21
7. Learning Objectives:
1. The candidate will understand the fundamentals of mathematics and economics
underlying quantitative methods in finance and investments.
Learning Outcomes:
(1g) Demonstrate an understanding of the mathematical considerations for analyzing
financial time series
(1h) Understand and apply various techniques for analyzing conditional
heteroscedastic models including ARCH and GARCH.
Sources:
Analysis of Financial Time Series, third edition, Tasy Chapter 3.5 – 3.8
Commentary on Question:
This question examines thorough understanding of volatility models. Many candidates
were ill prepared for this question. Part (a) and (b) were stating facts from the text; part
(c) and (d) involved computations but they were little more than book work.
Solution:
(a) Describe the main disadvantage of GARCH(1,1) model.
Commentary on Question:
This part guides candidates toward the motivation behind the development of
EGARCH model.
The GARCH(1,1) model has the following form:
𝑎𝑡 = 𝜎𝑡𝜖𝑡, 𝜎𝑡2 = 𝛼0 + 𝛼1𝑎𝑡−1
2 + 𝛽1𝜎𝑡−12
The main disadvantage of GARCH model is that it does not allow asymmetric
effects between positive and negative gains.
Since 𝑎𝑡 = 𝜎𝑡𝜖𝑡, a value of -2 or +2 will have same magnitude of change in 𝑎𝑡, in
practice, you would observe that impact of negative shocks are much higher than
positive shocks
(b) Describe how EGARCH(1,1) addresses shortcomings in GARCH(1,1) model.
Commentary on Question:
The main advantage of EGARCH(1,1) is the asymmetrical responses to positive
and negative at-1. Note that all the necessary formulas were given in the formula
package.
EGARCH(1,1) model
𝑔(𝜖𝑡) = {(𝜃 + 𝛾)𝜖𝑡 − 𝛾𝐸(|𝜖𝑡|) 𝑖𝑓 𝜖𝑡 ≥ 0(𝜃 − 𝛾)𝜖𝑡 − 𝛾𝐸(|𝜖𝑡|) 𝑖𝑓 𝜖𝑡 < 0
For the standard Gaussian random variable 𝐸(|𝜖𝑡|) = √(2/𝜋)
𝑎𝑡 = 𝜎𝑡𝜖𝑡, (1 − 𝛼𝐵) ln(𝜎𝑡2) = (1 − 𝛼)𝛼0 + 𝑔(𝜖𝑡−1)
Page 22
QFI Core Spring 2014 Solutions Page 22
7. Continued
Consider a simple model with order (1,1):
With
𝛼∗ = (1 − 𝛼)𝛼0 −√(2/𝜋)𝛾
(1 − 𝛼𝐵)ln (𝜎𝑡2) = {
𝛼∗ + (𝜃 + 𝛾)𝜖𝑡 𝑖𝑓 𝜖𝑡 ≥ 0
𝛼∗ + (𝛾 − 𝜃)𝜖𝑡 𝑖𝑓 𝜖𝑡 < 0
The conditional variance evolves in a non-linear manner
𝜎𝑡2 = 𝜎𝑡−1
2𝛼 exp (𝛼∗)
{
𝑒𝑥𝑝((𝛾 + 𝜃)
𝑎𝑡−1𝜎𝑡−1
) 𝑖𝑓 𝑎𝑡−1 ≥ 0
𝑒𝑥𝑝 (−(𝛾 − 𝜃)𝑎𝑡−1𝜎𝑡−1
) 𝑖𝑓 𝑎𝑡−1 < 0
coefficient ((𝛾 + 𝜃) and (𝛾 − 𝜃) show the asymmetry in response to positive and
negative values of 𝑎𝑡.
(c) Compute the impact of a negative shock of size 2 standard deviations compared to
the impact of a positive shock of size 2 standard deviations.
Commentary on Question:
The calculation mimics that of the text section 3.8.3
γ = 0.2856, θ = -0.0825 (these are given)
ratio exp( − (𝛾 − 𝜃) ∗ −2) 𝑎𝑛𝑑 exp( (𝛾 + 𝜃) ∗ 2) =
(EXP(-(0.2856-(-0.0825))*-2))/(EXP((0.2856+-0.0825)*2))=1.39
Effect of negative shocks are 39% higher than positive shocks
(d) Compute three step ahead volatility forecast for the fitted model in (c), given that
the forecast origin 600t and 2 3
600(1) 5.05*10 and 2 3
600(2) 5.098*10 .
Commentary on Question:
This part could be difficult; an unprepared candidate would spend more time on
the computation. Candidates who were familiar with the predictions using this
model and used the formula (which is given in the formula package) would know
the short-cut approach.
Using the information provided in parts c) and d) and knowledge of
EGARCH(1,1), one could use the following formula:
�̂�ℎ2(𝑗) = �̂�ℎ
2𝛼1(𝑗 − 1) exp(𝜔) [e(𝜃+𝛾)2
2 Φ(𝜃 + 𝛾) + e(𝜃−𝛾)2
2 Φ(𝛾 − 𝜃)]
𝜔 = (1 − 𝛼1)𝛼0 − 𝛾√2
𝜋
Page 23
QFI Core Spring 2014 Solutions Page 23
7. Continued
However, it is very time consuming to use this formula to make the prediction.
Instead, we can use a simplified version:
�̂�ℎ2(𝑗) = �̂�ℎ
2𝛼1(𝑗 − 1)𝐴, where A is independent of j, to make the prediction.
Based on the first two observations and given α1, we can solve A and make the
third prediction.
α1 = 0.95, A=(5.098*10^(-3))/((5.05*10^(-3))^(.95))=.7749488
Third prediction = (5.098*10^(-3))^(.95)*.7749488=5.144023*10^(-3)
Page 24
QFI Core Spring 2014 Solutions Page 24
8. Learning Objectives: 4. The candidate will understand and identify a variety of fixed instruments
available for portfolio management. This section deals with fixed income
securities. As the name implies the cash flow is often predictable, however there
are various risks that affect cash flows of these instruments. In general candidates
should be able to identify cash flow patterns and the factors affecting cash flows
for commonly available fixed income securities. Candidates should also be
comfortable using various interest rate risk quantification measures in the
valuation and managing of investment portfolios.
Learning Outcomes:
(4b) Demonstrate an understanding of par yield curves, spot curves, and forward
curves and their relationship to traded security prices.
(4e) Describe the cash flow of various corporate bonds considering underlying risks
such as interest rate, credit and event risks.
Sources:
Managing Investment Portfolios: A Dynamic Process, Maginn & Tuttle, 3rd Edition (Ch.
6, Fixed Income Portfolio Management)
Agency Mortgage Backed Securities, Fabozzi Handbook, Ch. 25
Commentary on Question:
Commentary listed underneath question component.
Solution:
(a) Evaluate the appropriateness of using each of the following three hedging
instruments to mitigate one or more of the three risks:
(i) A binary credit put option with the credit event specified as a credit rating
downgrade.
(ii) A credit spread call option where the underlying is the level of the credit
spread.
(iii) A credit spread forward, with the credit derivative dealer firm taking the
position that the credit spread will decrease.
Page 25
QFI Core Spring 2014 Solutions Page 25
8. Continued
Commentary on Question:
The question asks to evaluate if the given solution is appropriate for each of the
bond issuer. Many candidates mentioned only one solution that is appropriate for
only one of the issuers but did not evaluate the appropriateness for other issuers.
For example, many candidates wrote a binary credit put option is good for Bond
Issuer X but did not state if binary credit put option is good for Bond Issuer Y and
Z.
(i) A binary credit put option can be used to hedge rating downgrade by Bond
Issuer X.
The binary credit put option can also be used to cover the risk of credit
default by bond Issuer Y because usually a credit default triggers a
downgrade.
The binary credit put option value will increase as credit spread widens,
pricing in a higher possibility of rating downgrade. But because widening
spread does not necessarily leads to a rating downgrade, this instrument is
not a good choice to hedge credit risk faced by Bond Issuer Z.
(ii) It is appropriate to use a credit spread call option to cover the risk of an
increased credit spread for Bond Issuer Z.
It is also appropriate to use a credit spread call option to hedge a rating
downgrade faced by Bond Issuer X because a rating downgrade typically
leads to a widened credit spread
It is also appropriate to use a credit spread call option to hedge a default
by Bond Issuer Y because a default typically leads to a widened credit
spread.
(iii) It is appropriate to enter into the opposite side of this forward contract to
hedge the risk of an increased credit spread for Bond Issuer Z.
It is appropriate to enter the forward contract to hedge a rating downgrade
by Bond Issuer X, because a downgrade will normally lead to credit
spread to widen, and to hedge a default by Bond Issuer Y, because a
default will typically lead to credit spread to increase.
(b) Estimate the zero-spread of this corporate bond.
Commentary on Question:
Many candidates successfully derived the 75 basis points but did not provide an
appropriate explanation and hence did not get full points for this part.
Page 26
QFI Core Spring 2014 Solutions Page 26
8. Continued
The zero spread is the constant spread added to the zero curve so as to equate the
net present value of cash flows to the current market price.
The cash flow table shows the same cash flow patterns as the corporate bond we
are evaluating.
If we add up the present values of the cash flows given under a spread of 75 basis
points, we have a total value of $106.05, which is fairly close to the current
market ask price $106. Thus, the zero spread for the corporate bond is 75 basis
points.
(c) Assess whether this bond is cheap or rich. Justify your answer.
Commentary on Question:
Similar to Part (b), some candidates knew that OAS should be used to evaluate
the price of the bond but did not define OAS. Thus they did not earn full credit.
Many candidates got the same conclusion that the price was rich but the reason
given was invalid. For instance, some candidates used the zero spread instead of
OAS to evaluate the price of the bond. No points were given in this situation.
OAS represents the expected spread over Treasury yield curve after accounting
for the embedded call or put options. Because the bond is a callable bond, option
adjusted spread is the best choice for assessing whether the bond is rich or cheap.
The bond is rated as BBB (S&P rating), hence we compare it to an option-free
BBB bond. The nominal spread between an option-free BBB corporate bond and
the benchmark (a Treasury bond with similar maturity) is 60 basis points, which is
wider than the OAS of this bond, which is 55 basis points.
Since the callable option is primarily beneficial to the bond issuer, the bond
holders should be compensated for this with a wider spread relative to an option
free BBB bond, which implies a fair spread should be wider than 60 basis points,
not narrower than 60 basis points. Therefore the bond is overpriced (or rich).
Page 27
QFI Core Spring 2014 Solutions Page 27
9. Learning Objectives: 4. The candidate will understand and identify a variety of fixed instruments
available for portfolio management. This section deals with fixed income
securities. As the name implies the cash flow is often predictable, however there
are various risks that affect cash flows of these instruments. In general candidates
should be able to identify the cash flow pattern and the factors affecting cash flow
for commonly available fixed income securities. Candidates should also be
comfortable using various interest rate risk quantification measures in the
valuation and managing of investment portfolios.
Learning Outcomes:
(4e) Describe the cash flow of various corporate bonds considering underlying risks
such as interest rate, credit and event risks.
(4g) Demonstrate understanding of cash flow pattern and underlying drivers and risks
of mortgage-backed securities and collateralized mortgage obligations.
(4h) Construct and manage portfolios of fixed income securities using the following
broad categories:
(i) Managing funds against a target return
(ii) Managing funds against liabilities.
Sources:
An Overview of Mortgages and Mortgage Market, Fabozzi Handbook, Ch. 24
Corporate Bonds, Fabozzi Handbook, Ch. 12
Commentary on Question:
Many candidates did well on question (a) by listing possible reasons for supporting the
increase of PSA and question (b) by giving advantages and disadvantages of using MBS
to support payout annuity liability. Many candidates did not do well on question (c) and
(d) mainly due to being unfamiliar with the concepts of make-whole call and sinking-
fund.
Solution:
(a) Critique your CIO’s reasoning for higher PSA percentage.
Commentary on Question:
Most candidates did well on this question.
The following reasons will speed up the prepayment, potentially supporting the
use of a 200 PSA model rather than a 100 PSA model. The solution list is not an
exhaustive list though and partial credits are given for reasonable reasons
provided
Page 28
QFI Core Spring 2014 Solutions Page 28
9. Continued
(i) Increased prepayments and/or partial prepayments (curtailments);
(ii) Increased refinancing activities (due to lower rates);
(iii) Other factors like the economic conditions, (economy picks up; house
prices going up; increasing house turnovers and speculations) increasing
job mobility across geographies; increased default if conditions are bad,
etc
(b) Describe advantages and disadvantages of having MBS to back the payout
annuity liability.
Commentary on Question:
Most candidates did relatively well on this question.
Advantages:
Higher Yield;
Can help match interest rate duration;
Can help match asset/liability cash flows.
Disadvantages:
Prepayment risk may increase reinvestment risk;
Higher prepayment may associate low interest rate;
Negative Convexity (due to pre-payment risk).
(c) Describe the corresponding provision.
A make-whole call price is calculated as the present value of the bond’s
remaining cash flows subject to a floor price equal to par value. The discount rate
used to determine the present value is the yield on a comparable-maturity
Treasury security plus a contractually specified make-whole call premium.
The make-whole call price is essentially a floating call price that moves inversely
with the level of interest rates.
Sinking fund provision: fund is applied periodically to redemption of bonds
before maturity.
(d) Identify one advantage and one disadvantage to the bondholders.
Make-whole call:
Advantage to bondholders: The issuer will not exercise the call to buy back the
bond merely because its borrowing rates have declined, removing reinvestment
risk for the bondholders in a declining rate environment.
Page 29
QFI Core Spring 2014 Solutions Page 29
9. Continued
Disadvantage to bondholders: relatively higher cost for the additional protection
of bond being called back earlier than scheduled.
Sinking fund provision:
Advantage to bondholders: default risk is reduced due to orderly redemption
before maturity.
Disadvantage to bondholders: bond may be called at the sinking-fund call price
when rates are lower than rates at issue.
(e) Describe advantages and disadvantages of having bonds with make whole call
provisions to back the payout annuity liability.
Commentary on Question:
Advantage:
Bond with Make whole provision has little reinvestment risk.
Help maintain hedged asset duration and reduce need the convexity hedge.
Disadvantage:
Lower yield.
Harder to maintain portfolio yield matching to the required liability yield.
Page 30
QFI Core Spring 2014 Solutions Page 30
10. Learning Objectives: 4. The candidate will understand and identify a variety of fixed instruments
available for portfolio management. This section deals with fixed income
securities. As the name implies the cash flow is often predictable, however there
are various risks that affect cash flows of these instruments. In general candidates
should be able to identify the cash flow pattern and the factors affecting cash flow
for commonly available fixed income securities. Candidates should also be
comfortable using various interest rate risk quantification measures in the
valuation and managing of investment portfolios.
Learning Outcomes:
(4d) Evaluate features of municipal bonds and the role of rating agencies in pricing
them.
Sources:
Fabozzi, Frank The Handbook of Fixed Income Securities 8th Edition Chapters 11,17 and
18
Commentary on Question:
This question tested candidates understanding on 1) the role that rating agencies play in
evaluating municipal bonds, 2) how municipal bond insurance works and who will
benefit most from municipal bond insurance, and 3) features of municipal bonds.
Most candidates had troubles with c(ii) when they were asked to compare municipal
bond with the same rating, maturity and yield, but one sold at par and another sold at
discount and choose one that was suitable for Mary. Most candidates thought the
municipal bond sold at discount was better for Mary because it was cheaper or Mary
should be indifferent between the two because rating and yield were the same.
Solution:
(a) Describe each:
(i) The role that rating agencies play in evaluating municipal bonds.
(ii) How large institutional investors determine the creditworthiness of
municipal bonds.
(i)
Perform the credit analysis and publish their conclusions in the form of
ratings
Identify the credit risk factors
Describe the final conditions of the issuers
Page 31
QFI Core Spring 2014 Solutions Page 31
10. Continued
(ii)
Use the ratings of the commercial rating agencies as starting points
Rely on their own in-house municipal credit analysts for determining
the creditworthiness of municipal bonds.
(b) Critique whether a well-known, high credit quality municipal bond can benefit
from using municipal bond insurance.
Commentary on Question:
The question tested whether candidates understand the purpose of municipal bond
insurance, which is to reduce credit risk by insuring the payment of debt service
to the bondholder.
No, it will not benefit from using municipal bond insurance because it has
high creditworthiness and can be easily market.
Lower-quality bonds, bonds issued by smaller governmental units not widely
known, bonds with a complex and difficult-to-understand security structure,
and bonds issued by infrequent local government borrowers who do not have
a general market following among investors will benefit from municipal bond
insurance.
Municipal bond insurance is used to reduce credit risk within a portfolio by
insuring the payment of debt service to the bondholder. Insurance company
agrees to pay debt service that is not paid by the bond issuer.
(c) Evaluate for each of the following two pairs of bonds separately, which bond is
more suitable to Mary given her investment goal.
(i) 5-Year AA corporate bond with a yield of 5% or 5-Year AA municipal
bond with a yield of 3.50%.
(ii) 5-Year AA municipal bond selling at par with a yield-to-maturity of 4% or
5-Year AA municipal bond selling below par with a yield-to-maturity of
4%.
Commentary on Question:
For part ii, most candidates did not understand that there is capital gains tax for
municipal bond selling below par, which is key for the right answer .
(i)
Prefer the 5-Year AA corporate bond because the taxable yield on the
corporate bond is higher.
Equivalent taxable yield on the muni = tax-exempt yield/(1-tax rate)
= 3.5/(1-.25) = 4.67%, which is less than 5%.
Page 32
QFI Core Spring 2014 Solutions Page 32
10. Continued
(ii)
Mary will prefer the 5-Year AA municipal bond selling at par.
Only the coupon interest is exempted from federal income taxes.
Still need to pay capital gains tax for municipal bond selling below
par.
Hence, return on municipal bond selling below par is less than that
selling at par.
Page 33
QFI Core Spring 2014 Solutions Page 33
11. Learning Objectives: 2. The candidate will understand how to apply the fundamental theory underlying
the standard models for pricing financial derivatives. The candidate will
understand the implications for option pricing when markets do not satisfy the
common assumptions used in option pricing theory such as market completeness,
bounded variation, perfect liquidity, etc.
3. The candidate will understand how to evaluate situations associated with
derivatives and hedging activities.
Learning Outcomes:
(2a) Demonstrate understanding of option pricing techniques and theory for equity and
interest rate derivatives.
(2g) Identify limitations of the Black-Scholes pricing formula.
(3a) Compare and contrast various kinds of volatility (e.g., actual, realized, implied,
forward, etc.).
(3b) Compare and contrast various approaches for setting volatility assumptions in
hedging.
(3c) Understand the different approaches to hedging.
(3d) Understand how to delta hedge and the interplay between hedging assumptions
and hedging outcomes.
Sources:
QFIC-102-13: Current Issues: Options - What Does An Option Pricing Model Tell Us
About Option Prices?
QFIC-103-13: How to Use the Holes in Black-Scholes
Paul Wilmott Introduces Quantitative Finance Chapters 8 and 10
Commentary on Question:
Commentary listed underneath question component.
Solution:
(a) List factors that can drive the market price away from the Black-Scholes model
price.
Commentary on Question:
Majority of the candidates were able to identify one or more limitation of BS
framework.
Page 34
QFI Core Spring 2014 Solutions Page 34
11. Continued
The market price of option is based on the demand and supply of the option.
Stock’s volatility is known, and doesn’t change over the life of the option.
Stock price changes smoothly
The short-term interest rates never changes.
Anyone can borrow or lend as much as he wants at a single rate.
An investor who sells the stock or the option short will have the ability to use of
all the proceeds.
There are no trading costs for either the stock or the option.
An investor’s trades do not affect the taxes he pays.
The stock pays no dividends.
An investor can exercise the option only at expiration.
There are no takeovers or other events that can end the option’s life early.
Margin treatment of different securities.
Delivery features of option contracts.
Constraints on margin purchases and short sales of the stock.
Interaction between options and related futures contracts.
(b)
(i) Compare and contrast delta hedging using estimated volatility with delta
hedging using implied volatility.
(ii) Recommend the appropriate choice for your situation
Commentary on Question:
Majority of candidates were able to identify the pros and cons associated with
hedging with estimated and implied vol
Delta hedging with estimated volatility
Volatility needs to be estimated
Volatility can be estimated using a simple model or more complex time series
model
Time series volatility models are mark to models and simple estimates are mark to
market
Using estimated volatility imples not concerned with the day-to-day fluctuations
in the market.
Delta hedging with implied volatility
Only need to be on the right side of the trade to profit. Don’t know how much
money you will make, only know it is positive
Implied volatility is observable
If one is concerned with the day to day fluctuations in the mark to market profit
and loss, then use implied volatility / no fluctuations
Page 35
QFI Core Spring 2014 Solutions Page 35
11. Continued
In this situation one should hedge using the implied volatility. The reason is that
the bank is publicly traded on New York Stock Exchange therefore daily
fluctuation is a concern.
(c) Calculate, based on your recommendation in (b), the number of at-the-money call
options you need to buy long or sell short to neutralize delta for the portfolio.
Commentary on Question:
This question contained an error. Instead of asking for number of call options, it
meant to ask for number of underlying stocks. Many candidates were confused by
the question. Full credit was given to candidates who wrote to sell 75 ATM calls.
Full credit was also given to candidates who answered the question as it was
intended.
Using implied volatility = 20%, calculate the call option delta = 0.5757
Option portfolio delta = 75 * 0.5757 = 43.18; therefore, company has to sell 43.18
stocks.
(d) Calculate your expectation of the one-day mark-to-market profit or loss, if
hedging with implied volatility, based on your estimated volatility.
Commentary on Question:
Majority of the candidates identified the correct formula.
One day mark-to-market profit is 0.5*(actual volatility^2 – implied volatility^2) *
S^2 * Gamma (i) *dt
Gamma(i) = 0.018049 (using implied volatility)
Actual volatility = 0.3
Implied volatility = 0.20
dt=1/250
calculate the gain for one option = 00.018049.5*(0.3^2-
0.20^2)*100^2*0.018049/250 = 0.018049
there are 75 options = 0.018049*75 = 1.35366as one day MTM profit.
Page 36
QFI Core Spring 2014 Solutions Page 36
12. Learning Objectives: 5. The candidate will understand the variety of equity investments and strategies
available for portfolio management.
Learning Outcomes:
(5a) Explain the nature and role of equity investments within portfolios that may
include other asset clauses.
(5b) Demonstrate an understanding of the basic concepts surrounding passive, active,
and semi-active (enhanced index) equity investing, including managing
exposures.
(5c) Explain the basic active equity selection strategies including value, growth, and
combination approaches.
(5d) Demonstrate an understanding of equity indices and their construction, including
distinguishing among the weighting schemes and their biases.
(5e) Identify methods for establishing passive exposure to an equity market.
Sources:
Managing Investment Portfolios, Chapter 7 Managing Equity Portfolios
Commentary on Question:
Commentary listed underneath question component.
Solution:
(a)
(i) Compare value, growth and market-oriented investing styles.
(ii) List advantages and disadvantages of each of the three options that the
client was asking about.
Commentary on Question:
Many candidates did not do well on question (ii) because they listed the
advantages and disadvantages between the investing styles (value, growth, and
market-oriented) rather than providing the client an opinion on the advantages
and disadvantages of the three different manager hire options.
(i) Comparison of investing styles:
Value investors look for stocks that are cheap compared to their earnings
or assets, while growth stocks are concerned with earnings.
Value investors make several arguments to support buying such stocks.
Companies’ earnings tend to revert to the mean
Page 37
QFI Core Spring 2014 Solutions Page 37
12. Continued
Investors overpay for glamour stocks (those stocks with high growth
prospects), while ignoring those with lower growth
The main risk for value style is misinterpreting the stock’s cheapness.
There may be a valid economic reason for it, which the investor does not
understand.
Higher earnings variability will occur for value style, because value style
investors are willing to hold companies with cyclical earnings, believing
their earnings will revert to the mean
The three sub-styles in value are low price-to-earnings (P/E), contrarian
(buying low P/E stocks in depressed sectors), and yield (buying sticks with
high dividend yield and prospects to continue paying it).
Growth style investors assume that if the company continues to grow
earnings per share (EPS), then their price will go up.
The major risk for growth style is that forecasted growth in EPS does not
materialize, and the price-to-earnings multiple falls.
The sub-styles in growth are: consistent growth and earnings momentum
Market oriented investors (also called blend or core) investors do no
restrict to value or growth investing.
The valuation metric of market-oriented portfolio resemble that of the
broad market index; this is not the case for value or growth style.
(ii) The advantages and disadvantages of each of the three options:
Option 1: Hire a single manager in either a growth or value style, but
not both
Advantages
Can express conviction of the investor
Potential for strong gains if style is in favor
Disadvantages
Tracking error relative to benchmark
This option may underperform if style not in favor
Page 38
QFI Core Spring 2014 Solutions Page 38
12. Continued
Option 2: Hire two managers, one in each style
Advantages
Lower tracking error relative to benchmark
A barbell approach of combining expertise of two managers
Disadvantages
Higher fees
Outperformance must come from security selection alone
Option 3: Hire one manager in market-oriented style
Advantages
Simplest way to invest consistently with benchmark
Disadvantages
Need to ensure that the manager adds value consistently, not just generate
index-like returns
(b)
(i) Explain how investing styles can be evaluated using holdings based style
analysis.
(ii) Evaluate the investment style of your client’s portfolio.
Commentary on Question:
The overall candidates’ performance was satisfactory.
(i) Holding based style analysis can be used to evaluate the following:
Low price-to-earnings (P/E) and price-to-book (P/B) ratios indicate value
style.
High forecasted earnings per share (EPS) growth andP/E and P/B ratios
can also indicate growth styles. In addition, growth portfolios will have
low dividend yields because growing companies typically reinvest their
earnings.
Industry sector weightings can indicate value or growth style based on the
growth in those industries.
(ii) An evaluation of the client’s portfolio finds that almost all the signs point
toward a value style approach.
The client is buying companies with smaller market caps than the
benchmark average. This indicates a value investor approach because
Page 39
QFI Core Spring 2014 Solutions Page 39
12. Continued
small companies are more likely to trade at a discount due to liquidity
concerns
The client’s portfolio has a lower P/E and P/B ratios than the market and a
higher dividend yield, all of which indicate a value style.
The client has high weightings of mature low growth industries (material
and utilities), further indicating a value approach.
The client has a high weighting of consumer discretionary, which is more
of a growth industry. However, it is a cyclical industry and sensitive to the
economy. This attracts value investors who buy companies after periods of
falling earnings, expecting that the return of company earnings will mean
revert.
(c) Recommend which manager A or B should be selected.
Commentary on Question:
Many candidates correctly recommended Manager A, after calculating the
information ratio of both managers. However, not many candidates provided a
description of the fundamental law of active management, which is needed to
receive full credit for the question.
The Grinold and Kahn's Fundamental Law of Active Management can be used to
evaluate and select the investment manager. According to the law, information
ratio is approximately equal to information coefficient multiplied by the square
root of the investment discipline’s breadth.
Information coefficient is what you know about a given investment.
Breadth is defined as the number of independent active investment decisions
made each year.
Information Ratio (IR) = Information Coefficient (IC) * (breadth ^0.5)
Manager A: IR = 0.04 * [(400)^0.5] = 0.80
Manager B: IR = 0.03 * [(500)^0.5] = 0.67
Because Manager A has a higher information ratio, Manager A should be selected
and proposed to client.
(d) Describe the advantages and disadvantages of passive investing using exchange
traded funds, conventional indexed mutual funds and indexed institutional
portfolios.
Page 40
QFI Core Spring 2014 Solutions Page 40
12. Continued
Commentary on Question:
The overall candidates’ performance was satisfactory. Full credit for this
question is possible even if all points in the solution below are not mentioned.
Indexed Institutional Funds (IIFs):
Advantages
Have very low cost (because they manage assets for a single investor or a
small number of institutional investors.
Disadvantages
This option is not available to small investors.
Conventional Indexed Mutual Funds (CIMFs):
Advantages
Lower index license fee
This option is available to small investors.
Disadvantages
Higher shareholder accounting expenses (they need to keep track of each
customer’s share of the fund assets)
Less transparent (can only trade within the fund once a day)
Exchange Trade Funds (EFTs):
Advantages
No shareholder accounting expenses (because customers buy their shares in
the market)
More tax efficient (less likely to make a taxable gains distribution)
More transparent (trade in market anytime)
Better liquidity than CIMFs
Available to small investors.
Disadvantages
Higher index license fee than CIMFs
Users pay transaction costs includes commissions
(e)
(i) Characterize the structure of the above portfolio of managers.
(ii) Evaluate whether the portfolio of managers is expected to meet the
investment objectives.
Commentary on Question:
Candidates did relatively well on both parts of this question.
Page 41
QFI Core Spring 2014 Solutions Page 41
12. Continued
(i) The portfolio of managers represents a core-satellite portfolio. An indexed
investment (Manager A) represents more than half of the portfolio’s value
and functions as a core. Actively managed portfolios (Manager B, C, D)
represent the satellite portfolios surrounding the core.
(ii) To determine if the portfolio of managers meets the investments objective,
we need to calculate the expected alpha, tracking risk, and information
ratio.
Expected alpha
= (8/11)*(0%) + (1/11)*(2%) + 1/11*(3%) + (1/11)*(4%)
= 0.82%
Tracking risk
=[(8/11)^2*(0%)^2+(1/11)^2*(4%)^2+(1/11)^2*(6%)^2+(1/11)^2*(8%)^
2]^0.5
= 0.98%, which satisfies the client’s objective of no more than 1% per
year.
Information ratio = (expected alpha) / (tracking risk)
= 0.82% / 0.98% = 0.84, which satisfies the client’s objective of at least
0.60.
The portfolio meets both the information ratio and tracking risk
requirements of the investment mandate.
Page 42
QFI Core Spring 2014 Solutions Page 42
13. Learning Objectives: 6. The candidate will understand how to develop an investment policy including
governance for institutional investors and financial intermediaries.
Learning Outcomes:
(6c) Determine how a client’s objectives, needs and constraints affect investment
strategy and portfolio construction. Include capital, funding objectives, risk
appetite, and risk-return trade off, tax, accounting considerations and constraints
such as regulators, rating agencies, and liquidity.
(6d) Incorporate financial and non-financial risks into an investment policy, including
currency, credit, spread, liquidity, interest rate, equity, insurance product,
operational, legal and political risks.
Sources:
Maginn. Tuttle. Et al Managing Investment Portfolios. A dynamic process. Chapter 3.
Listerman and GSAM. Modern Investment Management equilibrium approach Chapter
10
V-C194-12 Revisiting the Role of Insurance Company ALM within a Risk Management
Framework
Commentary on Question:
Commentary listed underneath question component.
Solution:
(a) Develop a suitable investment policy for this fund. List and briefly describe all
elements.
Commentary on Question:
There are 7 elements to be listed with a brief explanation. For risk objectives,
return objectives and liquidity requirements, there is no unique solution so any
reasonable answer, with correct and complete justification would have earned
full points. The unique circumstances should correspond to the specifically
described objectives of the coop.
Risk Objectives:
Plan can’t rely on additional contributions, the fund is fully funded at inception
and outflows are defined, thus capital preservation is key here and the risk
appetite is moderate.
Page 43
QFI Core Spring 2014 Solutions Page 43
13. Continued
Return objectives:
Covering the planned outflows: thus 10% is required to keep the fund intact;
anything between 8% and 10% may be sufficient, but not without touching the
fund.
Liquidity requirements:
Defined outflows, so there is a need to be prepared for regular cash flows, but
don’t expect to liquidate large portions of the investment at any time.
Liquidity is not a big concern.
Time horizon:
20 years
Unique circumstances:
This coop has some ecological orientation, thus some investments in non-
renewable source of energy or possibly polluting industry are to be avoided.
Other SRI issues may be raised
Tax concern:
As long as they are not-for-profit, none. So can invest in otherwise taxable
investment. On the flip side, tax deductible investments are not attractive to
them.
Legal and regulatory factors: no specific regulation.
(b) Calculate:
(i) the rate to use in modeling the fund’s liability, and
(ii) the present value of this liability.
Commentary on Question:
The candidate is expected to recognize that the rate calculated is as of beginning-
of-year and thus calculate the present value of cashflows accordingly
RL - RF= (RBRf ) + t
Where
Rf = 3.00%
= DL/DA = 12.15/13.40
RB = 4.50%
t = 0 , cashflows are known and certain
RL = 3% + (12.15/13.4)x(4.50%-3%) + 0% = 4.36%
Lt =$50,000 ä40 :2.18% = 1,354,470
2.18% = 4.36%/2, n =40 => 20 years x 2 payments of $50,000 each
Page 44
QFI Core Spring 2014 Solutions Page 44
13. Continued
(c) Calculate the minimum investment in equities needed to prevent the surplus from
shrinking.
Commentary on Question:
Stating the formula and showing the calculation is required to earn full points.
Proportion of equities =
B(Lt/At) -1 ) + (Lt/At){Rf(1-)}
e -
= DL/DA = 12.15/13.40 = .9067
At = $1,000,000
Lt =$50,000 ä40 :2.18% = 1,354,470
2.328% = 4.655%/2, n =40 => 20 years x 2 payments of $50,000 each
Rf = 3.00%
B = 4.50%
e = 7%
(Lt/At) = 1.432275
= 4.50%x (.9067x1.35447 - 1 )+(1.35447x(3%x(1-.9067)))
( 7% - 4.5% )
= 0.5638
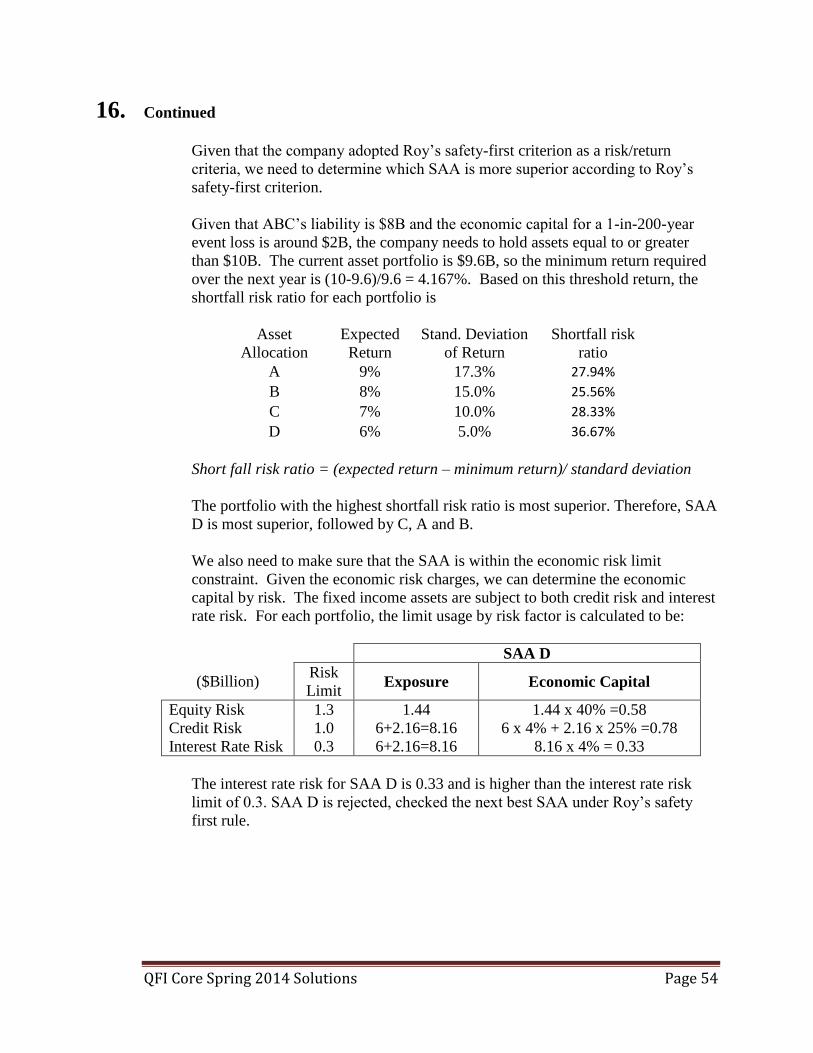
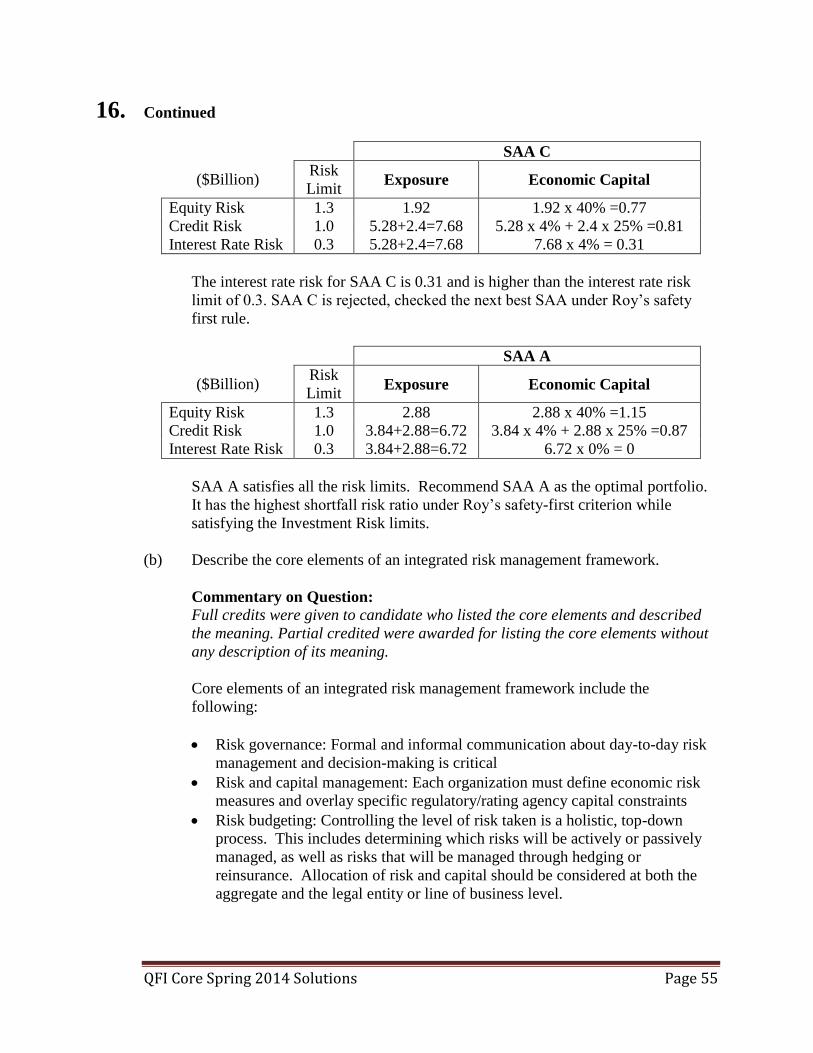
(d) Calculate the investment in equities that minimizes the surplus risk.
Proportion of equities =
= (1 - x Lt/At)(2
b - be)
(2e+
2b - 2be)
= DL/DA = 12.15/13.40
At = 1,000,000$
Lt =$50,000 ä40 :2.18% = 1,354,470
2.18% = 4.36%/2, n =40 => 20 years x 2 payments of $40,000 each
= (1 – (12.15/13.40)x(1,354,470/1,000,000)x(10%**2 – 0.55x10%x25%)
(10%**2 + 25%**2 – 2*0.55x10%x25%)
= 0.019
Page 45
QFI Core Spring 2014 Solutions Page 45
14. Learning Objectives: 6. The candidate will understand how to develop an investment policy including
governance for institutional investors and financial intermediaries.
7. The candidate will understand the theory and techniques of portfolio asset
allocation.
Learning Outcomes:
(6c) Determine how a client’s objectives, needs and constraints affect investment
strategy and portfolio construction. Include capital, funding objectives, risk
appetite, and risk-return trade off, tax, accounting considerations and constraints
such as regulators, rating agencies, and liquidity.
(7b) Propose and critique asset allocation strategies.
Sources:
(B) Litterman and GSAM, Modern Investment Management equilibrium approach
Chapter 10
Commentary on Question:
The performance of candidates on this question was below expectations even though the
question was not very difficult. It comes from a single study note, and refers to basic
concepts (Sharp ratio, RACS, DB). It must be noted also that the answers from the
candidates were relatively short while more elaborate answers were expected.
For example, the following concepts were almost not developed by the candidates: the
intermediate consumption aspect of a pension plan, the need to cover liabilities linked to
the dynamic environment for RACS (better suited than the Sharp ratio); the use of the
correlation matrix and to the discussion of the best strategy for an
underfunded/overfunded pension plan.
Solution:
(a) Describe two shortcomings of using the Sharpe ratio as a risk-return measure.
Commentary on Question:
The answer comes from page 112 of the study note, and is easy to identify as a
basic concept.
The Sharpe ratio is not a good risk-return metric for the pension in the long
run because it does not incorporate the liability stream;
The Sharpe ratio is not a good risk-return metric because it only considers a
one-period model where the clients do not require intermediate consumption
on top of final wealth protection.
Page 46
QFI Core Spring 2014 Solutions Page 46
14. Continued
(b) Assess the appropriateness of using the RACS relative to the Sharpe ratio for the
pension fund’s asset allocation strategy.
Commentary on Question:
Some concepts not well answered include: the RACS as a measure of the surplus
risk/return trade-off; DB need to look more at surplus risk rather than the
volatility of assets or liability in isolation; and the intermediate consumption.
Here, much of the argumentation is presented in many different places in the text.
The risk-adjusted change in surplus is a generalized form of the Sharpe ratio
formula that measures the surplus risk/return trade-off. That is, RACS
measures the change in surplus return in exchange for surplus risk. (Another
way to say this is that RACS evaluates investments relative to liabilities while
the conventional Sharpe ratio measures investments relative to cash);
A defined benefit pension plan has liabilities, which leads to the Sharpe ratio
being flawed as a risk-return metric as the Sharpe ratio caters to an asset-
only/asset-driven approach;
A DB plan should look more at surplus risk rather than just risk of volatility of
its asset or liability stream in isolation. The RACS metric considers surplus
risk rather than just asset risk;
Finally, a pension plan should incorporate optimizing asset return for
intermediate consumption, not just for a one-period that optimizes final
wealth. This more appropriately mimics pension plan risk management which
wants to make sure it is able to pay off its liabilities in every period/more than
just one period. The Sharpe ratio is only a theoretically well-founded concept
for a one-period model, while the RACS can be calibrated to work in a
dynamic environment.
(c) Assess the appropriateness of using the following assets to support the pension
fund:
(i) Long term bonds
(ii) Equities – both Domestic and Global
Commentary on Question:
Very few have made the observation that we should first have assets to hedge the
liabilities and then purchase assets to maximize the Sharpe ratio. Note that the
question is asking for (i) bonds and (ii) equities separately. There is no reference
to assets backing the liabilities and the surplus assets. Many candidates indicated
that allocation to long term bonds is generally appropriate for better ALM, but
most did not discuss the equities in the context of remaining assets. Some said
that equities had the highest Sharpe ratio; higher returns; and that global equity
Page 47
QFI Core Spring 2014 Solutions Page 47
14. Continued
was preferable. Almost no one referred to the negative impact of a large global
equity allocation due to the lower correlation to the liability index.
The strategy for an overfunded plan should be to allocate assets to a point that
it perfectly hedges liability risk, then allocate the remaining assets to purchase
assets that maximize the Sharpe ratio of these assets;
In order to hedge the assets against liabilities by duration-matching, long term
bonds is the appropriate means of mimicking liability cash flow streams;
The remaining assets are to be used to maximize the Sharpe ratio. The table
shows that the equity asset classes are highest in terms of Sharpe ratio. We
would select Global equities in this case as it has the higher Sharpe ratio.
However, we should note that the ability of the overall portfolio to hedge
liability risk may be diminished at large equity allocations due to the lower
correlation that the global equity class has relative to the liability index.
(d) Assess how the appropriate allocation between bonds and equities will change if
the plan is underfunded.
Commentary on Question:
The main suggestion was to invest more in equities because they have a better
return. There was mostly no reference to the RACS metric. Some candidates
suggested domestic equities with or without justification as to the correlation with
the liability index.
The strategy for an underfunded plan should weigh more towards equities
rather than long term bonds as the more underfunded a plan is, the more
attractive equity appears relative to fixed income as the RACS metric is
strictly increasing vs. equity allocation;
Underfunded plans cannot eliminate or lower the risk of not being able to fund
liabilities by the usual immunization/duration-matching approach, so the
correlation of the type of equity asset class with liabilities is crucial. Since US
(Domestic) equities are more correlated with liabilities than global equities
(0.18 vs. 0.15), the underfunded plan should lean towards investing in US
equities.
(e) Critique the following statements:
(i) “Whereas the Sharpe ratio evaluates investments relative to cash, the
RACS evaluates them relative to surplus.”
(ii) “Considering the duration and size of our pension liabilities, we should be
concerned about the duration of bonds we purchase from a liquidity
standpoint.”
Page 48
QFI Core Spring 2014 Solutions Page 48
14. Continued
Commentary on Question:
We have seen a lot of combinations of true-false-correct explanation-incorrect
explanation. Both sentences come directly from the study note, p. 114 for the first
part (i) and p. 125 for the second part (ii).
Whereas the first part of the first statement is correct, the second one is not
(although this metric may be related to the surplus risk).
With respect to the second statement some candidates stated incorrectly that it is
not a liquidity problem, but they should have known that active trading in long-
duration bonds is often challenging.
(i) False. “Whereas the Sharpe ratio evaluates investments relative to cash,
the RACS evaluates them relative to liabilities.’’
(ii) True. “Large pension plans with long duration liabilities will often find it
impracticable to invest heavily in long-duration bonds, since the relatively
low liquidity of these bonds impedes active trading.”
Page 49
QFI Core Spring 2014 Solutions Page 49
15. Learning Objectives: 7. The candidate will understand the theory and techniques of portfolio asset
allocation
Learning Outcomes:
(7a) Explain the impact of asset allocation, relative to various investor goals and
constraints.
(7b) Propose and critique asset allocation strategies.
Sources:
Maginn, Tuttle, et al Managing Investment Portfolios, a dynamic process, Chapter 5
Commentary on Question:
Commentary listed underneath question component.
Solution:
(a) List and briefly describe the criteria for effectively specifying asset classes.
Commentary on Question:
Partial credits were given for bullet points and partial credits for additional
explanation. Most candidates did well on this section.
Assets within an asset class should be relatively homogeneous
Assets within an asset class should have similar attributes
Asset classes should be mutually exclusive
Asset classes should not overlap
Asset classes should be diversifying
Asset classes should not have extremely high correlations with other asset
classes or with a linear combination on the other assets classes
The asset classes as a group should make up a preponderance of world
investable wealth Asset classes should cover a majority of markets open to investment world
wide
The asset class should have the capacity to absorb a significant fraction of the
investor’s portfolio without seriously affecting the portfolio’s liquidity
This allows investors to reset or rebalance to a strategic asset allocation
without moving asset-class prices or incurring high transaction costs
(b) Identify which two of the portfolios in your intern’s optimization table may not be
corner portfolios.
Page 50
QFI Core Spring 2014 Solutions Page 50
15. Continued
Commentary on Question:
Full credits were given for identifying portfolio 5 & 6 and partial credits for
candidates who were on the right track (e.g. said portfolio 6 cannot be the corner
portfolio, if portfolio 5 is). Many candidates had difficulty with this question.
Portfolios 5 or 6 may not be corner portfolios.
Adjacent corner portfolios define a segment of the minimum-variance frontier
within which (1) portfolios hold identical assets and (2) the rate of change of asset
weights in moving from one portfolio to another is constant. As the minimum-
variance frontier passes through a corner portfolio, an asset weight either changes
from zero to positive or from positive to zero. The global minimum variance
portfolio is included as a corner portfolio irrespective of its asset weights.
Portfolios 5 and 6 are adjacent and both contain the same non-zero asset class
categories. Therefore, they cannot both be corner portfolios because no asset
weight either changes from zero to positive or from positive to zero when moving
from 5 to 6 or from 6 to 5.
Portfolios 7 and 8 also both contain the same non-zero asset class categories, but
8 is the GMV portfolio, which is corner
(c) Calculate the asset-class weights in an efficient portfolio with an expected return
of 9.00%. Assume that the entries in the optimization table are correct.
Commentary on Question:
Most candidates did well on this section.
First, we identify the adjacent corner portfolios as corner Portfolio 2 (with a 9.4%
expected return) and corner Portfolio 3 (with an 8.8% expected return). From the
corner portfolio theorem, it follows that
9.0 = 9.4w + 8.8(1-w)
We find that w = 0.333 and (1-w) = 0.667. The detailed arithmetic follows:
Weight of US Equities 0.333(48.3%) + 0.667(37.5%) = 41.1%
Weight of Intermediate Bonds 0.333(0.00%) + 0.667(0.00%) = 0.00%
Weight of Long-Term Bonds 0.333(0.00%) + 0.667(0.00%) = 0.00%
Weight of International Bonds 0.333(0.00%) + 0.667(14.5%) = 9.7%
Weight of Real Estate 0.333(51.7%) + 0.667(48.0%) = 49.2%
(d) List and describe any special strategic asset allocation considerations for a bank.
Page 51
QFI Core Spring 2014 Solutions Page 51
15. Continued
Commentary on Question:
Candidates did fairly well on this section.
A bank’s security portfolio plays an important role in
Managing the balance sheet’s overall interest rate risk
Most important
Dictates an ALM approach
Managing liquidity
Bank’s loans and leases are generally not very liquid
Banks security portfolio plays a balancing role in providing a ready source of
liquidity
Producing income
Managing credit risk
Bank’s loans and leases are may carry credit risk
Banks security portfolio plays a balancing role in offsetting loan-portfolio
credit risk
Because regulators usually view banks as quasi-public trust funds, they
typically face detailed regulatory restrictions on maximum holdings of asset
types, often states as a percentage of capital.
The risk of assets affects banks’ costs through the operation of risk-based
capital rules.
(e) Explain how strategic asset allocation helps to manage systemic risk exposure
Commentary on Question:
Some candidates reasonably assumed that this question should have referred to
“systematic” risk rather than “systemic” risk. Credits were given to candidates
who put down anything appropriate that related to “systemic” risk as well as to
candidates who addressed “systematic” risk.
Strategic asset allocation fulfills an important role as a discipline for aligning
a portfolio’s risk profile with the investor’s objectives.
Systemic risk is rewarded (investors expect compensation for bearing risk
they cannot diversify away).
In the long run, a diversified portfolio’s mean returns are reliably related to its
systematic risk exposures.
Measuring portfolio risk begins with an evaluation of the systematic risk in
the portfolio (systematic risk usually accounts for most of a portfolio’s change
in value in the long run).
Groups of assets of the same type should predictably reflect exposures to a
certain set of systematic factors.
Page 52
QFI Core Spring 2014 Solutions Page 52
15. Continued
The strategic asset allocation specifies the investor’s desired exposures to
systematic risk.
Adopting and implementing a strategic asset allocation is an effective way to
exercise control over systematic risk exposures.
(f) Explain the relative importance of asset allocation versus other investment
decisions.
Commentary on Question:
Although there are a few studies that had different conclusions on the importance
of strategic asset allocation, most candidates only included the conclusion of the
study showing the asset allocation is the most important element to achieve the
investment goals.
Various research papers have investigated this question. The findings show the
asset allocation importance is quite high relative to other factors.
Studies examining the fraction of the variation in returns over time
attributable to asset allocation, based on regression analysis, showed that asset
allocation explained a majority of the variation in returns. These studies
showed that timing and security selection explained a very small portion of
returns.
Other studies looked at asset allocation importance in explaining the cross-
sectional variation of returns (i.e. the proportion of the variation among funds’
performance explained by funds’ different asset allocations). These studies
found that asset allocation explained a significant, but not a majority of the
cross-section variation of returns. The remaining variation was explained by
asset class timing, style within asset classes, security selection, and fees.
Another study explored asset allocation versus security selection in term of
the hypothetical potential to affect terminal wealth. They concluded that
active security selection lead to greater potential dispersion in final wealth
than did varying asset allocation.
Sidestepping strategic asset allocation finds no support in the empirical or
normative literature.
Page 53
QFI Core Spring 2014 Solutions Page 53
16. Learning Objectives: 3. The candidate will understand how to evaluate situations associated with
derivatives and hedging activities.
7. The candidate will understand the theory and techniques of portfolio asset
allocation.
Learning Outcomes:
(3a) Compare and contrast various kinds of volatility (e.g., actual, realized, implied,
forward, etc.).
(3b) Compare and contrast various approaches for setting volatility assumptions in
hedging.
(3d) Understand how to delta hedge and the interplay between hedging assumptions
and hedging outcomes.
(7a) Explain the impact of asset allocation, relative to various investor goals and
constraints.
(7b) Propose and critique asset allocation strategies.
(7d) Incorporate risk management principles in investment policy and strategy,
including asset allocation.
Sources:
Maginn, Tuttle, et al Managing Investment Portfolios, a dynamic process, Chapter 5
Litterman and GSAM, Modern Investment Management equilibrium approach, Chapter
10
QFIC-107-13, Revisiting the Role of Insurance Company ALM within a Risk
Management Framework
Commentary on Question:
Commentary listed underneath question component.
Solution:
(a) Recommend one of the four strategic asset allocations.
Commentary on Question:
Majority of the candidates were able to identify the shortfall risk ratio formula,
but many did not correctly compute the minimum required return used in the
formula. Some candidates did not consider the investment risk limits when
recommending the optimal SAA.
Page 54
QFI Core Spring 2014 Solutions Page 54
16. Continued
Given that the company adopted Roy’s safety-first criterion as a risk/return
criteria, we need to determine which SAA is more superior according to Roy’s
safety-first criterion.
Given that ABC’s liability is $8B and the economic capital for a 1-in-200-year
event loss is around $2B, the company needs to hold assets equal to or greater
than $10B. The current asset portfolio is $9.6B, so the minimum return required
over the next year is (10-9.6)/9.6 = 4.167%. Based on this threshold return, the
shortfall risk ratio for each portfolio is
Asset
Allocation
Expected
Return
Stand. Deviation
of Return
Shortfall risk
ratio
A 9% 17.3% 27.94%
B 8% 15.0% 25.56%
C 7% 10.0% 28.33%
D 6% 5.0% 36.67%
Short fall risk ratio = (expected return – minimum return)/ standard deviation
The portfolio with the highest shortfall risk ratio is most superior. Therefore, SAA
D is most superior, followed by C, A and B.
We also need to make sure that the SAA is within the economic risk limit
constraint. Given the economic risk charges, we can determine the economic
capital by risk. The fixed income assets are subject to both credit risk and interest
rate risk. For each portfolio, the limit usage by risk factor is calculated to be:
SAA D
($Billion) Risk
Limit Exposure Economic Capital
Equity Risk 1.3 1.44 1.44 x 40% =0.58
Credit Risk 1.0 6+2.16=8.16 6 x 4% + 2.16 x 25% =0.78
Interest Rate Risk 0.3 6+2.16=8.16 8.16 x 4% = 0.33
The interest rate risk for SAA D is 0.33 and is higher than the interest rate risk
limit of 0.3. SAA D is rejected, checked the next best SAA under Roy’s safety
first rule.
Page 55
QFI Core Spring 2014 Solutions Page 55
16. Continued
SAA C
($Billion) Risk
Limit Exposure Economic Capital
Equity Risk 1.3 1.92 1.92 x 40% =0.77
Credit Risk 1.0 5.28+2.4=7.68 5.28 x 4% + 2.4 x 25% =0.81
Interest Rate Risk 0.3 5.28+2.4=7.68 7.68 x 4% = 0.31
The interest rate risk for SAA C is 0.31 and is higher than the interest rate risk
limit of 0.3. SAA C is rejected, checked the next best SAA under Roy’s safety
first rule.
SAA A
($Billion) Risk
Limit Exposure Economic Capital
Equity Risk 1.3 2.88 2.88 x 40% =1.15
Credit Risk 1.0 3.84+2.88=6.72 3.84 x 4% + 2.88 x 25% =0.87
Interest Rate Risk 0.3 3.84+2.88=6.72 6.72 x 0% = 0
SAA A satisfies all the risk limits. Recommend SAA A as the optimal portfolio.
It has the highest shortfall risk ratio under Roy’s safety-first criterion while
satisfying the Investment Risk limits.
(b) Describe the core elements of an integrated risk management framework.
Commentary on Question:
Full credits were given to candidate who listed the core elements and described
the meaning. Partial credited were awarded for listing the core elements without
any description of its meaning.
Core elements of an integrated risk management framework include the
following:
Risk governance: Formal and informal communication about day-to-day risk
management and decision-making is critical
Risk and capital management: Each organization must define economic risk
measures and overlay specific regulatory/rating agency capital constraints
Risk budgeting: Controlling the level of risk taken is a holistic, top-down
process. This includes determining which risks will be actively or passively
managed, as well as risks that will be managed through hedging or
reinsurance. Allocation of risk and capital should be considered at both the
aggregate and the legal entity or line of business level.
Page 56
QFI Core Spring 2014 Solutions Page 56
16. Continued
Liquidity risk management: Liquidity needs should be defined both at the
aggregate level as well as by each line of business, implicitly “charging” lines
of business with higher liquidity needs.
ALM and SAA: Define risk and capital ensures, allocated risk budget and
defined liquidity constraints are all inputs to determine ALM constraints and
overall SAA.
Risk reporting: Regular and routine monitoring of risks includes sensitivity,
stress tests, multiple measures of risks and contingency planning. Risk
reporting needs to be a living, nimble process that feeds back into the risk
governance.