IEEE TRANSACTIONS ON COMPUTER-AIDED DESIGN OF INTEGRATED CIRCUITS AND SYSTEMS, VOL. 37, NO. 6, JUNE 2018 1211 QIG: Quantifying the Importance and Interaction of GPGPU Architecture Parameters Zhibin Yu, Member, IEEE, Jing Wang, Lieven Eeckhout, Senior Member, IEEE, and Chengzhong Xu, Fellow, IEEE Abstract—Graphic processing units (GPUs) are widely used for general-purpose computing—so-called GPGPU computing. GPUs feature a large number of architecture parameters, result- ing in a huge design space. To quickly explore this design space and identify the optimum architecture for a group of widely used computing kernels, it is critical to know how important each parameter is and how strongly these parameters interact with each other. This paper proposes an ensemble-learning-based approach, called quantifying the importance and interaction of Gpgpu architecture parameters (QIG), to quantify the impor- tance of architecture parameters and their interactions with respect to performance. QIG employs a stochastic gradient boosted regression tree to construct performance models using performance data from a random set of GPU architectures. Leveraging these models, QIG observes the impact of each archi- tecture parameter on performance, and calculates its importance and interaction intensity with other parameters. Using 25 widely used GPGPU kernels, we demonstrate that QIG accurately ranks the importance and interaction of GPU architecture parame- ters while the previously proposed Plackett–Burman design does not. Moreover, we show that QIG leads to a substantially more accurate performance model compared to prior work, including Starchart and approaches using artificial neural networks and supported vector machines: average error of 4.2% for QIG versus 23+% for prior work. Finally, QIG reveals a number of interest- ing insights for GPU architectures running GPGPU workloads. Index Terms—Architecture, design space exploration, modeling, performance evaluation. I. I NTRODUCTION G RAPHIC processing units (GPUs) deliver massive com- putational power by employing many cores to run Manuscript received October 25, 2016; revised January 23, 2017; accepted April 5, 2017. Date of publication April 25, 2017; date of current ver- sion May 18, 2018. This work was supported in part by the National Key Research and Development Program under Grant 2016YFB1000204, in part by the Major Scientific and Technological Project of Guangdong Province under Grant 2014B010115003, in part by the Shenzhen Technology Research Project under Grant JSGG20160510154636747, in part by the Shenzhen Peacock Project under Grant KQCX20140521115045448, and in part by the Outstanding Technical Talent Program of CAS, and National Natural Science Foundation of China under Grant 61672511. This paper was recommended by Associate Editor S. Pasricha. (Corresponding author: Jing Wang.) Z. Yu and C. Xu are with the Cloud Computing Center, Shenzhen Institutes of Advanced Technology, Chinese Academy of Science, Shenzhen 518055, China (e-mail: [email protected]; [email protected]). J. Wang is with Capital Normal University, Beijing 100048, China (e-mail: [email protected]). L. Eeckhout is with Ghent University, 9052 Ghent, Belgium (e-mail: [email protected]). Color versions of one or more of the figures in this paper are available online at http://ieeexplore.ieee.org. Digital Object Identifier 10.1109/TCAD.2017.2698026 hundreds of thousands of concurrent threads. Programming models, such as CUDA [1], ATI Stream Technology [2], and OpenCL [3] enable leveraging powerful graphics hard- ware to perform general-purpose computing, so-called GPGPU computing. As a sharply increasing number of emerging work- loads, such as deep learning and big data analytics start to run on GPUs, quickly devising an optimized GPU architecture for a set of widely used GPGPU kernels is desirable. A GPU architecture has up to several hundreds of design parameters, resulting in a huge design space. To further com- plicate matters, these parameters interact with each another in various complex ways. As a result, quickly designing an opti- mized GPU architecture for a given set of kernels is extremely challenging. Fortunately, the architecture parameters of GPUs are generally not equally important to performance, and nei- ther are the interaction intensities between them. This offers an opportunity to accelerate the GPU architecture design process by only focusing on the important architecture parameters and their dominant interactions. In other words, knowing the key architecture parameters and interactions avoids wasting design effort and time on suboptimal parts of the design space. Quantifying the importance and interaction intensity of GPU architecture parameters is quite challenging. Architectural sim- ulation, while trivial to use, is not a viable solution, simply because it is too slow. Doing a number of parameter sweeps to understand parameter importance and interactions easily results in a huge number of simulations with each simula- tion taking a long time to complete. This easily results in unbearably long simulation times. Analytical and predictive modeling can significantly speed up this process, replacing slow simulation with fast prediction. Recent work in analyt- ical modeling [4]–[6], as well as statistical reasoning [7]–[9] and machine learning [10] has made significant progress toward predicting GPU performance. Unfortunately, they are not accurate enough and do not readily identify the impor- tant parameters and interactions to accelerate design space exploration. In this paper, we propose a novel approach, called quan- tifying the importance and interaction of Gpgpu architecture parameters (QIG), using stochastic gradient boosted regres- sion trees (SGBRTs) [11] to quantify the importance and interaction intensity of GPU architecture parameters with respect to performance. SGBRT builds an ensemble model, i.e., it builds multiple empirical models which it then com- bines to form an overall model. SGBRT involves a training phase in which performance numbers need to be collected for 0278-0070 c 2017 IEEE. Personal use is permitted, but republication/redistribution requires IEEE permission. See http://www.ieee.org/publications_standards/publications/rights/index.html for more information.
Transcript
IEEE TRANSACTIONS ON COMPUTER-AIDED DESIGN OF INTEGRATED CIRCUITS AND SYSTEMS, VOL. 37, NO. 6, JUNE 2018 1211
QIG: Quantifying the Importance and Interactionof GPGPU Architecture Parameters
Abstract—Graphic processing units (GPUs) are widely usedfor general-purpose computing—so-called GPGPU computing.GPUs feature a large number of architecture parameters, result-ing in a huge design space. To quickly explore this design spaceand identify the optimum architecture for a group of widelyused computing kernels, it is critical to know how importanteach parameter is and how strongly these parameters interactwith each other. This paper proposes an ensemble-learning-basedapproach, called quantifying the importance and interaction ofGpgpu architecture parameters (QIG), to quantify the impor-tance of architecture parameters and their interactions withrespect to performance. QIG employs a stochastic gradientboosted regression tree to construct performance models usingperformance data from a random set of GPU architectures.Leveraging these models, QIG observes the impact of each archi-tecture parameter on performance, and calculates its importanceand interaction intensity with other parameters. Using 25 widelyused GPGPU kernels, we demonstrate that QIG accurately ranksthe importance and interaction of GPU architecture parame-ters while the previously proposed Plackett–Burman design doesnot. Moreover, we show that QIG leads to a substantially moreaccurate performance model compared to prior work, includingStarchart and approaches using artificial neural networks andsupported vector machines: average error of 4.2% for QIG versus23+% for prior work. Finally, QIG reveals a number of interest-ing insights for GPU architectures running GPGPU workloads.
Index Terms—Architecture, design space exploration,modeling, performance evaluation.
I. INTRODUCTION
GRAPHIC processing units (GPUs) deliver massive com-putational power by employing many cores to run
Manuscript received October 25, 2016; revised January 23, 2017; acceptedApril 5, 2017. Date of publication April 25, 2017; date of current ver-sion May 18, 2018. This work was supported in part by the National KeyResearch and Development Program under Grant 2016YFB1000204, in partby the Major Scientific and Technological Project of Guangdong Provinceunder Grant 2014B010115003, in part by the Shenzhen Technology ResearchProject under Grant JSGG20160510154636747, in part by the ShenzhenPeacock Project under Grant KQCX20140521115045448, and in part by theOutstanding Technical Talent Program of CAS, and National Natural ScienceFoundation of China under Grant 61672511. This paper was recommendedby Associate Editor S. Pasricha. (Corresponding author: Jing Wang.)
Z. Yu and C. Xu are with the Cloud Computing Center, Shenzhen Institutesof Advanced Technology, Chinese Academy of Science, Shenzhen 518055,China (e-mail: [email protected]; [email protected]).
J. Wang is with Capital Normal University, Beijing 100048, China (e-mail:[email protected]).
L. Eeckhout is with Ghent University, 9052 Ghent, Belgium (e-mail:[email protected]).
Color versions of one or more of the figures in this paper are availableonline at http://ieeexplore.ieee.org.
Digital Object Identifier 10.1109/TCAD.2017.2698026
hundreds of thousands of concurrent threads. Programmingmodels, such as CUDA [1], ATI Stream Technology [2],and OpenCL [3] enable leveraging powerful graphics hard-ware to perform general-purpose computing, so-called GPGPUcomputing. As a sharply increasing number of emerging work-loads, such as deep learning and big data analytics start to runon GPUs, quickly devising an optimized GPU architecture fora set of widely used GPGPU kernels is desirable.
A GPU architecture has up to several hundreds of designparameters, resulting in a huge design space. To further com-plicate matters, these parameters interact with each another invarious complex ways. As a result, quickly designing an opti-mized GPU architecture for a given set of kernels is extremelychallenging. Fortunately, the architecture parameters of GPUsare generally not equally important to performance, and nei-ther are the interaction intensities between them. This offers anopportunity to accelerate the GPU architecture design processby only focusing on the important architecture parameters andtheir dominant interactions. In other words, knowing the keyarchitecture parameters and interactions avoids wasting designeffort and time on suboptimal parts of the design space.
Quantifying the importance and interaction intensity of GPUarchitecture parameters is quite challenging. Architectural sim-ulation, while trivial to use, is not a viable solution, simplybecause it is too slow. Doing a number of parameter sweepsto understand parameter importance and interactions easilyresults in a huge number of simulations with each simula-tion taking a long time to complete. This easily results inunbearably long simulation times. Analytical and predictivemodeling can significantly speed up this process, replacingslow simulation with fast prediction. Recent work in analyt-ical modeling [4]–[6], as well as statistical reasoning [7]–[9]and machine learning [10] has made significant progresstoward predicting GPU performance. Unfortunately, they arenot accurate enough and do not readily identify the impor-tant parameters and interactions to accelerate design spaceexploration.
In this paper, we propose a novel approach, called quan-tifying the importance and interaction of Gpgpu architectureparameters (QIG), using stochastic gradient boosted regres-sion trees (SGBRTs) [11] to quantify the importance andinteraction intensity of GPU architecture parameters withrespect to performance. SGBRT builds an ensemble model,i.e., it builds multiple empirical models which it then com-bines to form an overall model. SGBRT involves a trainingphase in which performance numbers need to be collected for
1212 IEEE TRANSACTIONS ON COMPUTER-AIDED DESIGN OF INTEGRATED CIRCUITS AND SYSTEMS, VOL. 37, NO. 6, JUNE 2018
a range of GPU architecture configurations running GPGPUkernels of interest; SGBRT then builds an empirical modelusing the training data. QIG builds on top of SGBRT andcomputes the importance for each architecture parameter andall of their pairwise interactions.
QIG has several advantages over existing statistical rea-soning and machine learning-based approaches. First, QIGdoes not build a single (complex) performance model as priorwork in GPU performance modeling does. Instead, it combinesmany simple models to form an ensemble model. This leads toa more accurate overall model while requiring far fewer train-ing examples. Second, QIG quantifies the importance of GPUarchitecture parameters and their interactions, which none ofthe prior work in GPU performance modeling provides andwhich is of critical importance for architects to efficientlyexplore the design space. Third, QIG not only accurately pre-dicts performance but also reveals interesting insights basedon the importance of and the interactions among architectureparameters, which helps architects understand and optimizeGPU performance.
We apply QIG to a set of 25 GPGPU benchmarks andfind that different benchmarks are sensitive to different GPUarchitecture parameters. The (by far) most dominant GPUarchitecture parameters are core frequency and the maximumnumber of thread blocks per core. Several benchmarks aresensitive to other architecture parameters, such as L1 datacache size and interconnect frequency. Moreover, we find that8 out of 25 benchmarks are predominantly sensitive to a singlepairwise parameter interaction; the other 18 benchmarks aresensitive to two to five pairwise parameter interactions. Thisreinforces the observation that the GPU architecture space iscomplex and requires efficient techniques to identify importantparameters and interactions to efficiently cull the large designspace toward the optimal design.
Prior work in CPU design space exploration proposed thePlackett–Burman (PB) design of experiment to identify impor-tant architectural parameters and their interactions [12]. PB islimited though to quantifying select pairwise interactions, i.e.,it does not systematically explore all possible pairwise inter-actions, in contrast to QIG. Moreover, we find PB to yieldmisleading results in some cases, as we show in this paper.
In summary, this paper makes the following contributions.1) We use ensemble learning, in particular SGBRT, to
construct accurate GPU performance models.2) We propose QIG to quantify the importance of GPU
architecture parameters and their pairwise interactions.3) We employ 25 GPGPU kernels to evaluate QIG and
compare its accuracy against prior work. QIG is shownto be substantially more accurate (average error of 4.2%)compared to Starchart [8] and artificial neural network(ANN)/supported vector machine (SVM)-based mod-els with an average error around 23+% for the sameof training data. Moreover, QIG accurately identifiesthe important GPU architecture parameters and pairwiseinteractions, while the PB design approach does not.
4) Using QIG, we reveal three interesting insights: a)GPGPU performance is dominated by only a hand-ful architectural parameters; b) although a number of
benchmarks are sensitive to a single pairwise parameterinteraction, many more benchmarks are sensitive to sev-eral pairwise parameter interactions; and c) the strongestinteractions may not necessarily take place between the(two) most important architecture parameters.
The rest of this paper is organized as follows. Section IIpresents background in ensemble learning, and provides adescription of SGBRT. Section III describes how we leverageSGBRT to build performance models and quantify the impor-tance of GPU architecture parameters and their interactions.Section IV depicts our experimental methodology. Section Vprovides results and analysis. Section VII describes relatedwork, and Section VIII concludes this paper.
II. BACKGROUND
We first describe ensemble modeling, and then describe itstwo essential components (regression trees and boosting).
A. Ensemble Model
Statistical reasoning approaches, such as linear regressionassume a parametric model and infer the model parametersusing a set of training data (so-called parametric models). Incontrast, machine learning techniques, such as ANNs do notemploy a parametric model but instead infer a nonparametricdata model to relate the independent and dependent variables(so-called nonparametric models). Both statistical reasoningand machine learning build a single model from the train-ing data set. These techniques generally yield very accuratemodels but may require a lot of training data to do so.
Ensemble models have been proposed to increase theprediction accuracy across a wide range of data sets by com-bining many single models. The key intuition is that it istypically easier to build accurate models by combining manysimple models than to build a single sophisticated highlyaccurate model. However, how to combine models signifi-cantly affects the accuracy of the final model as well as theefficiency of the model building process. A number of combi-nation techniques have been proposed, including bagging [13],stacking [14], and model averaging [15]. Because there are noinvalid GPU architecture parameter values (noise) in this paperand because boosting [16] generally produces more accurateresults than other combination techniques in the absence ofnoise [17], we employ boosting in this paper.
B. Regression Tree
The ensemble model used in QIG uses regression trees forconstructing the “simple” models. A regression tree partitionsthe parameter space (e.g., the GPU architecture design space)into rectangles, as shown in Fig. 1. In the first step, the wholedesign space is divided into two parts according to split pointsp1 for architecture parameter pv1. (Note that a design spacecan be divided into more than two parts if two or more splitpoints are used per architecture parameter.) The left part isfurther split into two subrectangles based on split point sp2for architecture parameter pv2; the right part is split accordingto split point sp4 for architecture parameter pv4; etc. Thisprocedure is performed recursively until a stop criterion is met.
YU et al.: QIG: QUANTIFYING IMPORTANCE AND INTERACTION OF GPGPU ARCHITECTURE PARAMETERS 1213
Fig. 1. Illustration of how regression trees work: “pv” represents a GPUarchitecture parameter; “sp” refers to a split point.
Fig. 2. Illustration of how boosting combines multiple regression trees intoa single overarching performance model.
The smallest rectangles are called the leaves of the tree. Forexample, the two rectangles represented by leaf 6 and leaf 7are two leaves generated by split point sp6 for parameter pv6.
The split points are chosen such that the data values ineach group are most similar. For example, the data values inrectangle leaf 6 are more similar to each other than to thedata values in leaf 7; in other words, architecture parameterpv6 and its split point sp6 are chosen, such as to maxi-mize the similarity within each subrectangle. Regression treesuse the mean performance within a leaf rectangle to predictperformance for all designs in that rectangle, e.g., meanperformance across all training examples in leaf 6 is usedas the performance prediction for all designs that end up inleaf 6 during model evaluation. The regression tree is builtsuch that the prediction error is minimized. In other words, ateach step during the model building process are the architec-ture parameter and its corresponding split point selected, suchas to maximize similarity within each subrectangle, therebymaximizing accuracy.
C. Boosting
Boosting combines multiple regression trees into an ensem-ble model, see Fig. 2. In the first step, a regression tree isgrown under a given tree complexity or tree size (the num-ber of nodes in the tree) to minimize its prediction error,e.g., instructions per second (IPS) prediction error in the con-text of the GPU design space. In the second step, a differentregression tree is grown to reflect the variation in GPGPUperformance that is not reflected by the first tree. Subsequently,an initial ensemble model is created by combining the first tworegression trees: α1T1 +α2T2, with T1 and T2 the performance
Fig. 3. QIG workflow.
predictions by the two regression trees, respectively, and α1and α2 the respective coefficients. This procedure is performedrecursively, i.e., more regression trees are added to the ensem-ble model, until a specific criterion, such as a target accuracyof 90% is met.
As depicted, boosting is a sequential process in which theoriginal model remains unchanged at each step. Moreover,the performance variation needed to explain gradually reducesas the ensemble model construction proceeds and the modelbecomes more accurate. Randomness is typically introducedinto a boosted model to improve accuracy and speed, andto mitigate over-fitting [11]. Therefore, the ensemble learn-ing technique used in this paper also includes a stochasticcomponent, which leads to the overall model being SGBRT.
The overall model produced by SGBRT can be thought ofas a linear combination of regression trees, as follows:
IPS = α1T1 · · · + αiTi + · · · + αnTn (1)
with n the number of regression trees in the model, Ti theperformance predicted by the ith regression tree model, and αi
the contribution of Ti to the model. Two parameters are crucialfor SGBRT construction. The first one is the learning rate αi,which we assume to be constant in this paper. The second istree complexity or tree size which controls the maximum levelof interaction between GPU architecture parameters that canbe considered. We will elaborate on the determination of thesetwo SGBRT parameters in the next section.
III. QIG
We now describe how we leverage SGBRT in QIG to quan-tify the importance of GPU architecture parameters and theirinteractions.
1214 IEEE TRANSACTIONS ON COMPUTER-AIDED DESIGN OF INTEGRATED CIRCUITS AND SYSTEMS, VOL. 37, NO. 6, JUNE 2018
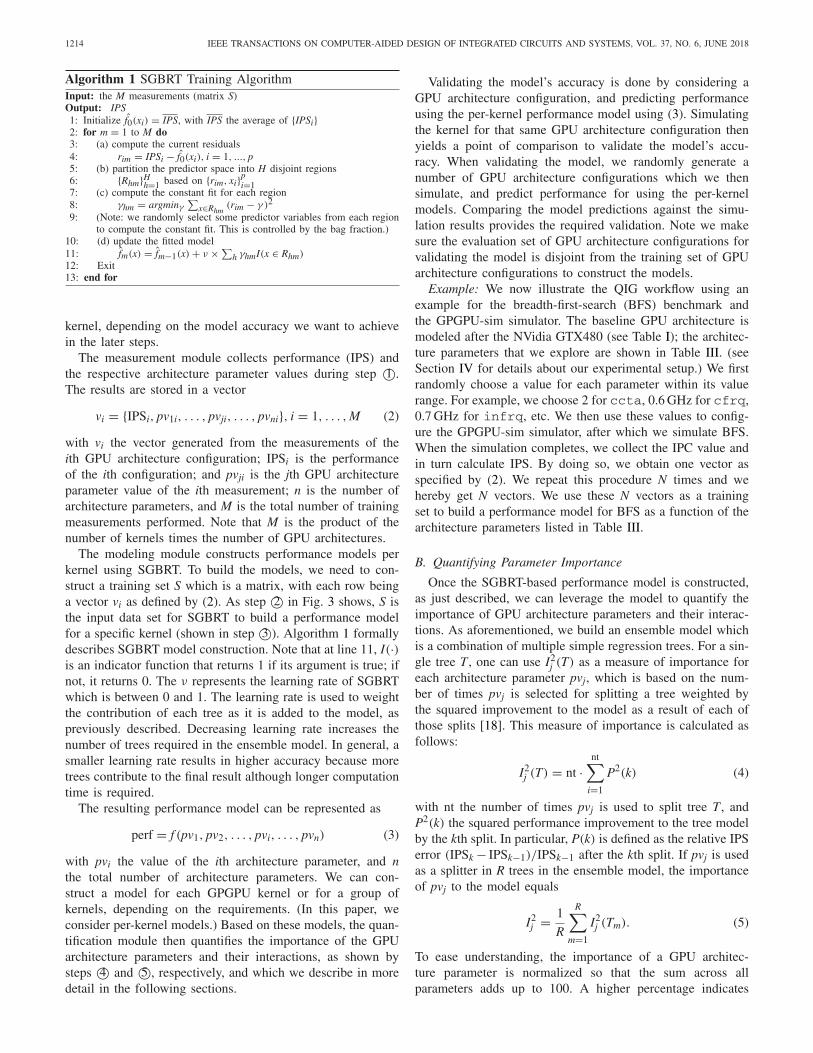
Algorithm 1 SGBRT Training AlgorithmInput: the M measurements (matrix S)Output: IPS1: Initialize f̂0(xi) = IPS, with IPS the average of {IPSi}2: for m = 1 to M do3: (a) compute the current residuals4: rim = IPSi − f̂0(xi), i = 1, ..., p5: (b) partition the predictor space into H disjoint regions6: {Rhm}H
h=1 based on {rim, xi}pi=1
7: (c) compute the constant fit for each region8: γhm = argminγ
∑x∈Rhm
(rim − γ )2
9: (Note: we randomly select some predictor variables from each regionto compute the constant fit. This is controlled by the bag fraction.)
vi = {IPSi, pv1i, . . . , pvji, . . . , pvni}, i = 1, . . . , M (2)
with vi the vector generated from the measurements of theith GPU architecture configuration; IPSi is the performanceof the ith configuration; and pvji is the jth GPU architectureparameter value of the ith measurement; n is the number ofarchitecture parameters, and M is the total number of trainingmeasurements performed. Note that M is the product of thenumber of kernels times the number of GPU architectures.
Validating the model’s accuracy is done by considering aGPU architecture configuration, and predicting performanceusing the per-kernel performance model using (3). Simulatingthe kernel for that same GPU architecture configuration thenyields a point of comparison to validate the model’s accu-racy. When validating the model, we randomly generate anumber of GPU architecture configurations which we thensimulate, and predict performance for using the per-kernelmodels. Comparing the model predictions against the simu-lation results provides the required validation. Note we makesure the evaluation set of GPU architecture configurations forvalidating the model is disjoint from the training set of GPUarchitecture configurations to construct the models.
Example: We now illustrate the QIG workflow using anexample for the breadth-first-search (BFS) benchmark andthe GPGPU-sim simulator. The baseline GPU architecture ismodeled after the NVidia GTX480 (see Table I); the architec-ture parameters that we explore are shown in Table III. (seeSection IV for details about our experimental setup.) We firstrandomly choose a value for each parameter within its valuerange. For example, we choose 2 for ccta, 0.6 GHz for cfrq,0.7 GHz for infrq, etc. We then use these values to config-ure the GPGPU-sim simulator, after which we simulate BFS.When the simulation completes, we collect the IPC value andin turn calculate IPS. By doing so, we obtain one vector asspecified by (2). We repeat this procedure N times and wehereby get N vectors. We use these N vectors as a trainingset to build a performance model for BFS as a function of thearchitecture parameters listed in Table III.
B. Quantifying Parameter Importance
Once the SGBRT-based performance model is constructed,as just described, we can leverage the model to quantify theimportance of GPU architecture parameters and their interac-tions. As aforementioned, we build an ensemble model whichis a combination of multiple simple regression trees. For a sin-gle tree T , one can use I2
j (T) as a measure of importance foreach architecture parameter pvj, which is based on the num-ber of times pvj is selected for splitting a tree weighted bythe squared improvement to the model as a result of each ofthose splits [18]. This measure of importance is calculated asfollows:
I2j (T) = nt ·
nt∑
i=1
P2(k) (4)
with nt the number of times pvj is used to split tree T , andP2(k) the squared performance improvement to the tree modelby the kth split. In particular, P(k) is defined as the relative IPSerror (IPSk − IPSk−1)/IPSk−1 after the kth split. If pvj is usedas a splitter in R trees in the ensemble model, the importanceof pvj to the model equals
I2j = 1
R
R∑
m=1
I2j (Tm). (5)
To ease understanding, the importance of a GPU architec-ture parameter is normalized so that the sum across allparameters adds up to 100. A higher percentage indicates
YU et al.: QIG: QUANTIFYING IMPORTANCE AND INTERACTION OF GPGPU ARCHITECTURE PARAMETERS 1215
stronger influence of the corresponding architecture parameteron performance.
C. Quantifying Parameter Interactions
While tree complexity or tree size determines the maximumlevel of interaction between architectural parameters that canbe studied in the ensemble model, no metric is readily avail-able to quantify how strongly a pair of architectural parametersinteracts with each other. To address this issue, we construct alinear regression model per pair of architecture parameters andconsider the residual variance of the model as an indicationfor interaction intensity. The intuition is that if two archi-tecture parameters are orthogonal (i.e., they do not interact),the residual variance will be small because the linear modelwill be able to accurately predict the combined effect of bothparameters. If on the other hand, the architecture parametersinteract substantially, this will be reflected in the residual vari-ance being significantly larger than zero, because the linearmodel is unable to accurately capture the combined effect ofthe parameter pair. The linear regression model is trained foreach pair of architectural parameters while setting the valuesof all other parameters to their respective means. This processis repeated for each possible parameter pair. The residual vari-ance or interaction intensity for a particular parameter pair iscomputed as
v =n∑
i=1
(pi − p)2 (6)
with pi the performance predicted by the linear regressionmodel, p the observed performance, and n the number of pre-dictions. Zero indicates that there is no interaction betweentwo architecture parameters, and a higher value indicates astronger interaction.
Because interaction intensity as just defined does notdirectly show its importance among all possible pairs, wetherefore normalize against the other pairs. This is done asfollows:
Ii =(
vi∑n
j=1 vj
)
× 100% (7)
with Ii the importance of the ith parameter-pair interactionand vi the ith parameter-pair interaction intensity. As such,we can tell how much more/less important a parameter pair iscompared to another parameter pair, which reflects the relativeinteraction intensity of parameter pairs.
IV. EXPERIMENTAL SETUP
In this section, we describe the simulator, benchmarks, GPUarchitecture design space, real hardware platforms, and toolsused to evaluate QIG.
A. Simulator and Benchmarks
We employ a cycle-level GPGPU simulator, GPGPU-simv3.2 [19] to validate the efficacy of QIG. The baseline GPUarchitecture is modeled after NVIDIA’s GTX480; the keyarchitecture parameters are listed in Table I. Note that wehave to resort to simulation as it is impossible to explore
TABLE IBASELINE GPU ARCHITECTURE CONFIGURATION INITIALIZED IN
GPGPU-SIM. SM—STREAMING MULTIPROCESSOR
TABLE IIEXPERIMENTED BENCHMARKS
the GPU design space on real hardware. The experimentedGPGPU benchmarks are taken from the three most popularCUDA benchmark suites, CUDA SDK [20], Rodinia [21],and Parboil [22], along with a number of benchmarks takenfrom recent papers, see Table II. We select these benchmarksbecause they cover a wide range of application domains:encryption (AES), finance (BS), scientific computing (FWT,MM, MT, LPS, LIB, SP), graph processing (BFS, NE),artificial intelligence [back propagation (BP)]. We observe sig-nificant diversity in the performance characteristics at the GPUarchitecture level across this diverse set of benchmarks.
B. GPU Architecture Parameters
We consider a GPU design space in which we vary 15architecture parameters, each with 5 or 6 different values, see
1216 IEEE TRANSACTIONS ON COMPUTER-AIDED DESIGN OF INTEGRATED CIRCUITS AND SYSTEMS, VOL. 37, NO. 6, JUNE 2018
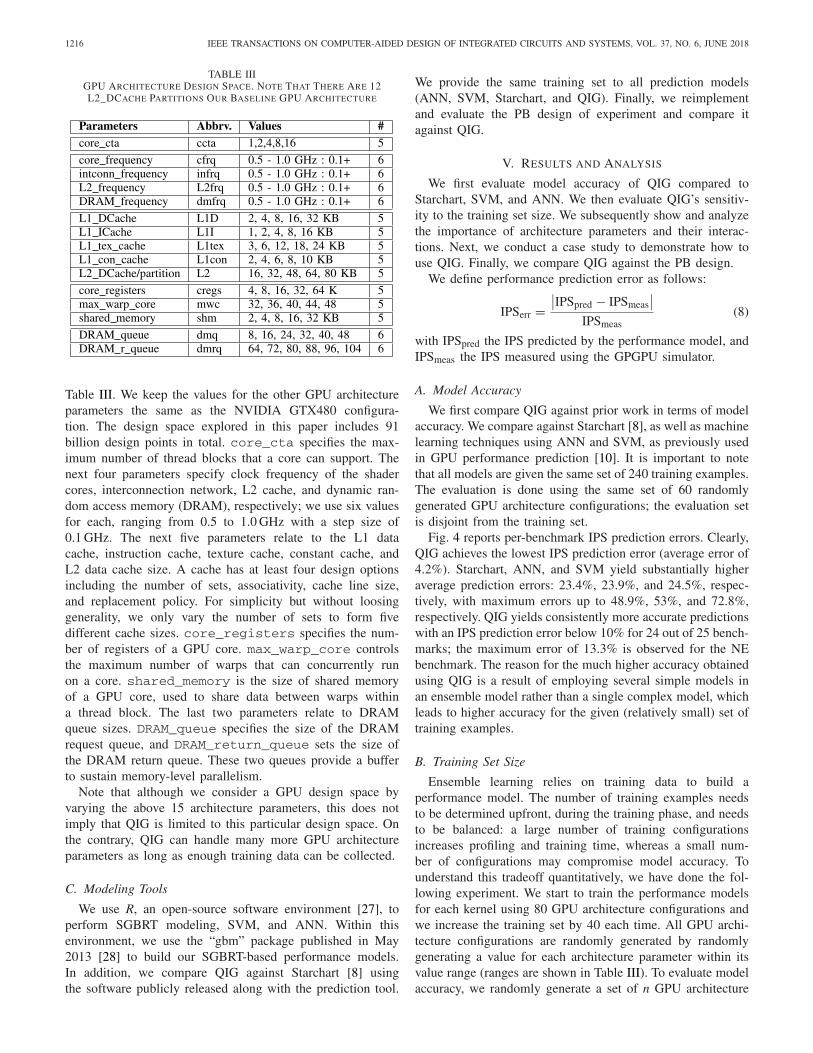
TABLE IIIGPU ARCHITECTURE DESIGN SPACE. NOTE THAT THERE ARE 12L2_DCACHE PARTITIONS OUR BASELINE GPU ARCHITECTURE
Table III. We keep the values for the other GPU architectureparameters the same as the NVIDIA GTX480 configura-tion. The design space explored in this paper includes 91billion design points in total. core_cta specifies the max-imum number of thread blocks that a core can support. Thenext four parameters specify clock frequency of the shadercores, interconnection network, L2 cache, and dynamic ran-dom access memory (DRAM), respectively; we use six valuesfor each, ranging from 0.5 to 1.0 GHz with a step size of0.1 GHz. The next five parameters relate to the L1 datacache, instruction cache, texture cache, constant cache, andL2 data cache size. A cache has at least four design optionsincluding the number of sets, associativity, cache line size,and replacement policy. For simplicity but without loosinggenerality, we only vary the number of sets to form fivedifferent cache sizes. core_registers specifies the num-ber of registers of a GPU core. max_warp_core controlsthe maximum number of warps that can concurrently runon a core. shared_memory is the size of shared memoryof a GPU core, used to share data between warps withina thread block. The last two parameters relate to DRAMqueue sizes. DRAM_queue specifies the size of the DRAMrequest queue, and DRAM_return_queue sets the size ofthe DRAM return queue. These two queues provide a bufferto sustain memory-level parallelism.
Note that although we consider a GPU design space byvarying the above 15 architecture parameters, this does notimply that QIG is limited to this particular design space. Onthe contrary, QIG can handle many more GPU architectureparameters as long as enough training data can be collected.
C. Modeling Tools
We use R, an open-source software environment [27], toperform SGBRT modeling, SVM, and ANN. Within thisenvironment, we use the “gbm” package published in May2013 [28] to build our SGBRT-based performance models.In addition, we compare QIG against Starchart [8] usingthe software publicly released along with the prediction tool.
We provide the same training set to all prediction models(ANN, SVM, Starchart, and QIG). Finally, we reimplementand evaluate the PB design of experiment and compare itagainst QIG.
V. RESULTS AND ANALYSIS
We first evaluate model accuracy of QIG compared toStarchart, SVM, and ANN. We then evaluate QIG’s sensitiv-ity to the training set size. We subsequently show and analyzethe importance of architecture parameters and their interac-tions. Next, we conduct a case study to demonstrate how touse QIG. Finally, we compare QIG against the PB design.
We define performance prediction error as follows:
IPSerr =∣∣IPSpred − IPSmeas
∣∣
IPSmeas(8)
with IPSpred the IPS predicted by the performance model, andIPSmeas the IPS measured using the GPGPU simulator.
A. Model Accuracy
We first compare QIG against prior work in terms of modelaccuracy. We compare against Starchart [8], as well as machinelearning techniques using ANN and SVM, as previously usedin GPU performance prediction [10]. It is important to notethat all models are given the same set of 240 training examples.The evaluation is done using the same set of 60 randomlygenerated GPU architecture configurations; the evaluation setis disjoint from the training set.
Fig. 4 reports per-benchmark IPS prediction errors. Clearly,QIG achieves the lowest IPS prediction error (average error of4.2%). Starchart, ANN, and SVM yield substantially higheraverage prediction errors: 23.4%, 23.9%, and 24.5%, respec-tively, with maximum errors up to 48.9%, 53%, and 72.8%,respectively. QIG yields consistently more accurate predictionswith an IPS prediction error below 10% for 24 out of 25 bench-marks; the maximum error of 13.3% is observed for the NEbenchmark. The reason for the much higher accuracy obtainedusing QIG is a result of employing several simple models inan ensemble model rather than a single complex model, whichleads to higher accuracy for the given (relatively small) set oftraining examples.
B. Training Set Size
Ensemble learning relies on training data to build aperformance model. The number of training examples needsto be determined upfront, during the training phase, and needsto be balanced: a large number of training configurationsincreases profiling and training time, whereas a small num-ber of configurations may compromise model accuracy. Tounderstand this tradeoff quantitatively, we have done the fol-lowing experiment. We start to train the performance modelsfor each kernel using 80 GPU architecture configurations andwe increase the training set by 40 each time. All GPU archi-tecture configurations are randomly generated by randomlygenerating a value for each architecture parameter within itsvalue range (ranges are shown in Table III). To evaluate modelaccuracy, we randomly generate a set of n GPU architecture
YU et al.: QIG: QUANTIFYING IMPORTANCE AND INTERACTION OF GPGPU ARCHITECTURE PARAMETERS 1217
Fig. 4. Model accuracy for QIG compared to Starchart, ANN, and SVM.
Fig. 5. Maximum, minimum, and average IPS prediction error as a functionof training set size.
configurations that is disjoint from the set of training exam-ples; n is a quarter of the number of the corresponding trainingexamples.
Fig. 5 quantifies how accuracy is affected by the num-ber of training examples; we show the maximum, minimum,and average IPS prediction error across the 25 experimentedGPGPU kernels. As expected, prediction error decreases withan increasing number of training examples. We find theperformance model’s accuracy to converge once given at least160 training examples. When given more than 160 trainingexamples, model accuracy continues to improve, albeit at aslower rate. In the remainder of this paper we consider 240training examples, which yields an average error of 4.2% andmaximum error of 13.3%.
Building an ensemble performance model incurs modesttime overhead. Simulation time, i.e., collecting performancenumbers for the 240 training examples, takes four days on ourexperimental platform. We run simulations in parallel on fourservers, with each server an 8-core hyper-threaded processor;we run 16 simulations in parallel per server, or 64 simula-tions in parallel in total. Once the profiling data is collected,building the performance model takes only 1–2 s.
C. Parameter Importance
We now quantify parameter importance for the experi-mented benchmarks. Fig. 6 shows the importance of each
experimented GPU architecture parameter for each bench-mark. There are a number of interesting observations to bemade here.
Observation 1 (There Are Few Dominant GPU ArchitectureParameters): Although we consider fifteen GPU architectureparameters, only six of them show up as being the mostimportant parameter across all the experimented benchmarks:number of thread blocks per core, L1 constant cache size,L1 data cache size, shared memory size, core frequency,and interconnect frequency. The other nine parameters neverappear as the most important one. The two parameters that aremost important across all benchmarks are core_frequency(most important parameter for 10 out of 25 benchmarks) andcore_cta (most important parameter for 11 benchmarks).This indicates that very few GPU architecture parametershave a major impact on performance across the broad setof workloads; a slightly larger group of parameters havea major impact for at least one workload; and the major-ity of parameters does not have a major impact on anyworkload.
Observation 2 (There Is a Rank Order in ParameterImportance): Fig. 7 quantifies what we just qualitativelyobserved: it shows (cumulative) parameter importance. Thisgraph reconfirms our observation that core_frequencyand core_cta are the most important architecture param-eter with respect to GPGPU performance, with a relativeimportance of 20.7% and 16.2%, respectively. This observationreveals at least three insights: 1) increasing clock frequencyand/or the amount of parallelism within a core is generallyvery effective to improve GPGPU performance; 2) among thefrequency components, apart from core frequency, increas-ing frequency of the interconnection network and DRAMwill improve performance more than increasing L2 cachefrequency; and 3) among the caches, shared memory, andcore registers, changing the size of L1 data cache impactsperformance more than the other storage units. This rank orderin parameter importance may help GPU architects to focustheir design optimizations.
Observation 3 (GPGPU Parallelism Varies Widely): If theimportance of core_frequency is much higher (>40%)compared to the importance of core_cta (<5%) for a givenkernel, we observe the average IPS across different GPUarchitectures to be less than 50 giga IPS (GIPS), which isvery small for GPGPU workloads, see also Fig. 8. Example
1218 IEEE TRANSACTIONS ON COMPUTER-AIDED DESIGN OF INTEGRATED CIRCUITS AND SYSTEMS, VOL. 37, NO. 6, JUNE 2018
Fig. 6. Importance quantification rank of the experimented GPU architecture parameters for all experimented GPU benchmarks.
Fig. 7. Average importance of GPU architecture parameters across all thebenchmarks.
benchmarks are CL, HS, MUM, NQU, and PF. The com-mon feature for these kernels is that most of the work isdone by only a few threads even when a larger number ofthreads are launched, indicating that it is difficult to effec-tively parallelize these kernels. In other words, these GPGPUkernels are unable to efficiently leverage the GPU paral-lel computing resources as they expose limited thread-levelparallelism.
On the other hand, an importance of core_cta higher than10% indicates that the respective benchmark exposes moreparallelism. This is the case for all the other 20 benchmarks.Note though high levels of thread-level parallelism is not asufficient reason for high GPGPU performance, see for exam-ple BFS, LIB, NE, and SLA which show relatively modestperformance according to Fig. 8. This is due to memory inten-sity (e.g., DRAM frequency is relatively important for BFSand LIB), poor data locality (L1 D-cache size is relatively
important for NE), and interconnection network performance(interconnect frequency is relatively important for SLA).
D. Parameter Interactions
We now quantify and analyze pairwise interactionsbetween GPU architecture parameters. Fig. 9(a) shows thatcore_frequency and core_cta interact most stronglyamong all pairwise interactions for the BFS benchmark.Changing these two parameters at the same time affectsperformance more than changing only one of them at a time.On the other hand, we can definitely ignore the interactionsbetween the other parameters because their interaction intensi-ties are extremely weak. Across our experimented benchmarks,a number of other benchmarks also show a single domi-nant pairwise interaction, including BFS, BN, BP, CP, LIB,MUM, NE, and SLA. It is interesting to note that the mostimportant pairwise interaction varies across benchmarks, asshown in the upper part of Table IV. Although parameter paircore_frequency and core_cta is the most importantone for most benchmarks, this is not the case for MUM andNE. The most important interaction occurs between DRAMfrequency and interconnect frequency for MUM; and betweenL1 D-cache and the maximum number of thread blocks percore for NE.
It is interesting to note that the most important pairwiseinteraction does not necessarily occur between the two mostimportant parameters, which is different from CPU architec-tures [29]. This is the case for MUM. The most importantparameters are interconnect frequency and L1 D-cache size,see Fig. 6, however, the most important interaction occursbetween interconnect frequency and DRAM frequency. Notethough that DRAM frequency is the third most importantparameter—some reverse ordering may happen.
As noted above, only 8 out of 25 benchmarks exhibit asingle dominant pairwise interaction. The other 17 bench-marks exhibit two or more dominant pairwise interactions.
YU et al.: QIG: QUANTIFYING IMPORTANCE AND INTERACTION OF GPGPU ARCHITECTURE PARAMETERS 1219
Fig. 8. Maximum, minimum, and average per-benchmark performance (measured in IPS) across the range of GPU architectures in our design space.
(a) (b)
(c) (d)
Fig. 9. Example benchmarks showing (a) one, (b) two, (c) three, and (d) fourdominant pairwise interactions.
We define a pairwise interaction to be dominant if its impor-tance is larger than 10%. Fig. 9(b) shows HY as an examplebenchmark with two dominant pairwise interactions; Fig. 9(c)and (d) shows SAD and LP with three and four dominantpairwise interactions, respectively. Across the experimentedbenchmarks, AES, FWT, HS, HY, MT, NQU, and STO havetwo dominant pairwise interactions; 64H, CL, KM, MM, PF,and SAD have three; BS, LPS, and SP have four; SS has five.The top most important pairwise interaction per benchmark islisted in Table IV.
GPU architects can leverage this information to more effi-ciently explore the design space. Interactions indicate to thearchitect that changing one parameter may have limited impacton overall performance as long as the other parameter is keptconstant. In other words, the architect needs to consider explor-ing the effect of simultaneously changing both parameters tosee the largest effect on overall performance. Without the anal-ysis provided by QIG, the architect would not know whichinteractions to consider, and may therefore need to exploreand consider parameter sweeps for all possible parameterinteractions, which is obviously infeasible. QIG on the otherhand identifies the dominant parameter interactions, whichis invaluable for the architect to focus on a few parameterinteractions, greatly simplifying the design space exploration.
TABLE IVSTRONGEST PAIRWISE INTERACTIONS FOR OUR
EXPERIMENTED BENCHMARKS
E. Case Study
We illustrate this further using a case study for the BPbenchmark. BP is a machine-learning algorithm that trains theweights of connected nodes in a layered neural network. BPis widely used because it is a common algorithm in a vari-ety of areas, such as face recognition, medication, and deeplearning, and therefore it may be worth optimizing the GPUarchitecture for this particular workload.
The two most important GPU architecture parametersfor BP are core_cta and core_frequency. Changingthe value of core_cta from 1 to 8 while keeping allother GPU architecture parameters unchanged to their defaultvalue, increases performance from 123 GIPS to 408 GIPS.Changing core_frequency from 0.5 GHz to 1 GHz,again while keeping all other parameters constant to theirdefault value, increases performance from 258 GIPS to487 GIPS. However, changing both parameters at the sametime improves performance up to 571 GIPS, which is a
1220 IEEE TRANSACTIONS ON COMPUTER-AIDED DESIGN OF INTEGRATED CIRCUITS AND SYSTEMS, VOL. 37, NO. 6, JUNE 2018
Fig. 10. Rank correlation coefficient between the ranking obtained using QIG and PB versus a simulation reference—higher is better.
significant improvement (17%–40%) over optimizing only asingle parameter. More importantly, this case study illustratesthat QIG can assist the GPU architect to identify the mostimportant architecture parameters and interactions and accel-erate the design process by having the architect focus on thefew most important parameters and interactions.
F. Validation and Comparison Against PB
We now validate whether QIG is indeed able to identifythe most important GPU architecture parameters. The mod-els underlying to QIG, while accurate, do not provide perfectaccuracy, hence some validation is needed. This is done asfollows. QIG provides a parameter importance rank per bench-mark. We pick the most important parameter according toQIG and run a simulation when changing this one parame-ter between its maximum and minimum value, while keepingthe other parameters unchanged to their default value. Wecompute the performance delta between the maximum andminimum value. This is done for all parameters in the rank-ing. We then compute the rank correlation coefficient betweenthe QIG ranking and the ranking obtained through simula-tions. A rank correlation coefficient close to one indicatesthat QIG is indeed able to accurately rank the architectureparameters.
This is verified in Fig. 10 which reports this rank cor-relation coefficient. The rank correlation coefficient exceeds0.9 for 21 out of 25 benchmarks. The lowest rank cor-relation coefficient is observed for HY (0.66); the reasonis that this benchmark consists of seven kernels which areinterdependent, and which QIG does not take into account.The average rank correlation coefficient across all benchmarksequals 0.93. In other words, QIG is indeed able to accu-rately rank and identify the most important GPU architectureparameters.
The PB design of experiment [30], previously proposed forCPU design space exploration [12], is not as accurate as QIG,with an average rank correlation coefficient of 0.76. For somebenchmarks the rank correlation coefficient is as low as 0.16(PF), and for a handful benchmarks we observe a rank cor-relation coefficient around 0.5. This indicates that PB can bemisleading, which may lead the architect to waste valuabletime and effort in exploring uninteresting areas of the designspace.
TABLE VGPU CARDS CONSIDERED IN THE HARDWARE VALIDATION SETUP
VI. HARDWARE VALIDATION
So far, we considered a simulation-based validation of theproposed model. This setup was instigated by the purpose ofthe model, which is to guide GPU architects at early stagesduring the design cycle. In this section, we validate the modelon real hardware. Because we are unable to consider manyhardware configurations for training and evaluating the model,we consider a different setup in which we consider manybenchmarks for a single GPU architecture. Instead of buildinga performance model to predict performance across differentGPU architectures for a single benchmark, we now considera power model to predict power consumtpion across differ-ent benchmarks for a single GPU architecture. In addition tovalidating QIG on real hardware, this case study also illus-trates QIG’s versatility, as we now use the QIG methodologyto predict power rather than performance, and we do so acrossbenchmarks rather than across architectures.
A. Experimental Setup
We consider four NVIDIA GPU cards including GTX 480,580, 680 and 780, see Table V. These four cards cover twoGPU architectures, namely Fermi (GTX 480 and 580) andKepler (GTX 680 and 780). GPU cards with the same archi-tecture differ from each other in the number of cores and clockfrequency. [A core refers to a streaming multiprocessor (SM)in Fermi, and an SMX in Kepler.] In particular, GTX 480 has15 cores, with each core running at 700 MHz frequency. WhileGTX 580 has 16 cores and each core runs at 825 MHz.
YU et al.: QIG: QUANTIFYING IMPORTANCE AND INTERACTION OF GPGPU ARCHITECTURE PARAMETERS 1221
TABLE VIGPU HARDWARE PERFORMANCE COUNTERS
We track hardware performance counters using CUPTI [31].Hardware performance counters vary across GPU architec-tures. Table VI lists performance counters that are commonacross the four architectures.
GPU power is measured as follows. All four GPU cardshave two sources of power supply: 1) a PCIe slot 12 V powersupply and 2) an ATX 12 V power supply. Both power sourceshave to be counted to accurately measure GPU power con-sumption. The PCIe power supply contributes over 40% ofthe total GPU power consumption for the GTX 480, but onlyless than 10% for the other three cards. We measure instan-taneous current and voltage to compute power of each source(PCIe and ATX power supply). We sense the current draw bymeasuring the voltage drop across a current sensing resistor.The current sensing resistors are inserted in a PCIe riser cardfor measuring PCIe power and ATX power supply lines formeasuring ATX power. This setup allows us to easily switchthe target GPU for measuring its power. We use an NI DAQwhich is a general-purpose data acquisition card to samplevoltage and current at a rate of 2 million samples per second.
We consider the 25 benchmarks listed in Table II. To obtainsufficient training examples, we launch each benchmark withfive different thread counts: n the default thread count, as wellas 2n, 4n, 8n, and 16n. This yields 125 benchmark runs in total.We next choose 100 of these as training examples to build apower consumption model for that GPU card, and we employthe remaining 25 items as the testing examples to evaluate theaccuracy of the model. We use an equation similar to (8) tocalculate the model error for each GPU card.
B. Results
Fig. 11 shows the average power prediction errors for QIGacross different benchmarks for the four GPU cards. Ourmodels are fairly accurate for the GTX 480, 580, and 780with average prediction errors of 6.9%, 5.4%, and 8.9%,respectively. However, the error appears to be higher for theGTX 680—an average error of 18.8%. We believe the rea-son is that GTX 680 is the first-generation product of theKepler architecture which employs very aggressive poweroptimizations, substantially reducing its power consumption
Fig. 11. Average power prediction error of QIG for the four GPU cards.
Fig. 12. Importance rank of performance counters on real hardware withrespect to power consumption.
over GTX 580. This, in its turn, leads to wide variationsin power consumption across the different benchmarks. (Forexample, the performance and power usage of GTX 680 hadto be capped to prevent overly demanding synthetic bench-marks from damaging GPU cards [32].) In the GTX 780,NVIDIA developed GPU Boost, which continuously monitorsand adjusts the clock speed and voltage level, leading to lessvariation in power consumption across different workloads.This leads to a lower prediction error.
Fig. 12 quantifies parameter importance for the varioushardware performance counters with respect to power con-sumption. The iss_slotu performance counter appears to bethe most important factor. This can be understood intuitivelyas the utilization of issue slots is a measure for the amountof activity within a core, and hence it has a high impact ondynamic power consumption. Interestingly, QIG reveals thatthe wp_laun performance counter is not important to powerconsumption. This suggests that the number of warps launcheddoes not indicate high activity in the core.
Fig. 13 quantifies the important pairwise interactions.Interestingly, the most important parameter iss_slotu and theeighth most important parameter L1_gloadm interact the moststrongly. This can be explained by the observation that L1cache global load misses incur long latencies, which signif-icantly affects issue slot utilization and logic activity. Thisalso aligns with our observation for the simulation-basedexperiments: the most important pairwise interaction does not
1222 IEEE TRANSACTIONS ON COMPUTER-AIDED DESIGN OF INTEGRATED CIRCUITS AND SYSTEMS, VOL. 37, NO. 6, JUNE 2018
Fig. 13. Interaction intensity rank of performance counters on real hardwarewith respect to power consumption.
necessarily occur between the two most important architec-tural parameters. Interestingly, the most important parameterinteraction is consistent across all four GPU cards.
VII. RELATED WORK
There exists an extensive body of prior work in empiricalperformance modeling for CPUs. Joseph et al. [33] buildedlinear regression models from simulation data that relatemicroarchitectural parameters and their mutual interactions tooverall processor performance. In their follow-on work [34]they explore nonlinear regression modeling. Similarly,Lee and Brooks [35] proposed regression models for bothperformance and energy using splines. They leveragespline-based regression modeling to build multiprocessorperformance models [36] and explore the huge design space ofadaptive processors [37]. Ïpek et al. [38] and Dubach et al. [39]builded performance models using artificial neural networks.Lee et al. [40] compared spline-based regression modelingagainst artificial neural networks and conclude that bothapproaches are equally accurate; regression modeling pro-vides better statistical understanding, while neural networksoffer greater automation. Vaswani et al. [41] incorporated theinteraction between the compiler and the architecture, andbuild empirical application-specific performance models thatcapture the effect of compiler optimization flags and microar-chitecture parameters. Ould-Ahmed-Vall et al. [42] buildedtree-based empirical models: the model chooses a path at eachnode in the tree and finds a linear regression model in theleaves. None of these prior works target predicting parame-ter importance and their interactions; nor did these works useensemble learning.
Yi et al. [12] used the PB design of experiment to identifythe most important architecture parameters in the CPU designspace. Our results show that, at least for the GPU design space,PB is not as accurate as QIG. Moreover, PB quantifies theimportance of select pairwise interactions only, by construc-tion; QIG on the other hand analyzes all possible pairwiseinteractions.
A number of empirical models have been proposed forGPUs as well. Stargazer [7] and Starchart [8], [9] use a
statistical tree-based partitioning approach to automaticallyexplore the workload optimization space to auto-tune GPGPUapplications. Wu et al. [10] employed artificial neural networksto estimate performance and power of GPU architectures. Ourresults show that the performance models constructed by QIGare more accurate than the machine learning models proposedin these prior works. Moreover, these prior works do not rankarchitecture parameters based on importance and interactionintensity, which is of critical importance for efficient designspace exploration.
In addition, principal component analysis (PCA) has beenwidely used to characterize CPU [43] and GPU architectureperformance characteristics [44]. PCA transforms the possiblycorrelated architectural parameters into uncorrelated variables,called principal components, which are linear combination ofthe original parameters. The first component captures the high-est variance in the data set, followed by the second, and soforth. PCA provides useful insight by analyzing the domi-nating architecture parameters in the most dominant principalcomponents. Unfortunately, PCA does not readily identifythe most important architectural parameters and interactions;QIG on the other hand provides this information by design.Moreover, PCA assumes that the data follows a Gaussian dis-tribution which may require nontrivial preprocessing if the datais non-Gaussian distributed.
All the above studies explore the design space at the archi-tecture level. Several studies explore cross-layer design spaces.In particular, Sarma and Dutt [45] employed a statisticalreasoning technique, namely response surfaces, to constructperformance models while exploring the architecture designspace along with device-level parameters. Response surfaces,unlike QIG, do not readily identify the important variables andtheir interactions in the design space. Exploring cross-layerdesign spaces using QIG is subject for future work.
VIII. CONCLUSION
In this paper, we propose QIG, an ensemble-learning-basedapproach to quantify the importance of GPU architectureparameters and their interactions. We show that QIG outper-forms prior work in the area by a significant margin: QIG’saverage prediction error is as low as 4.2% for a 15-D GPUarchitecture design space whereas prior work, such as Starchartand ANN/SVM-based approaches yield an average error of23+% on average, for the same (relatively small) training setconsisting of 240 examples.
We leverage QIG to identify the most important architec-ture parameters and interactions, which is critical for a GPUarchitect to efficiently and effectively explore the design spacetoward the optimum design. We find the PB design of exper-iment, previously proposed to rank parameter importance, toyield misleading parameter rankings for a number of work-loads in our setup; its accuracy in ranking parameters equals76% on average. QIG on the other hand ranks parameterswith 93% accuracy. Moreover, PB can only rank select pair-wise parameter interactions, whereas QIG ranks all pairwiseinteractions, which yields a more accurate and complete viewof the design space.
YU et al.: QIG: QUANTIFYING IMPORTANCE AND INTERACTION OF GPGPU ARCHITECTURE PARAMETERS 1223
QIG provides a number of interesting insights regardingthe GPU design space. GPGPU performance is predominantlydetermined by a handful architecture parameters includingcore frequency and the maximum number of thread blocksper core. Some workloads are sensitive to other architec-ture parameters, such as L1 data cache size and interconnectfrequency. Although some workloads are sensitive to a sin-gle predominant pairwise parameter interaction, the majorityof workloads are sensitive to several (and up to a handful)pairwise parameter interactions, which reinforces the observa-tion that GPU design space is complex and therefore requiresefficient techniques, such as QIG to efficiently explore thedesign space and not waste valuable architect effort and timein uninteresting parts of the design space.
ACKNOWLEDGMENT
The authors are grateful to J. Leng and V. J. Reddi forsharing the power measurement data. The authors would alsolike to thank the anonymous reviewers for their valuablecomments.
REFERENCES
[1] CUDA Programming Guide, Version 3.0, NVIDIA Corp., Santa Clara,CA, USA, 2010.
[2] ATI Stream Technology, Advanced Micro Devices, Sunnyvale, CA, USA,2011. [Online]. Available: http://www.amd.com/stream
[4] S. Hong and H. Kim, “An analytical model for a GPU architec-ture with memory-level and thread-level parallelism awareness,” inProc. Int. Symp. Comput. Archit. (ISCA), Austin, TX, USA, Jun. 2009,pp. 152–163.
[5] J. W. Sim, A. Dasgupta, H. Kim, and R. Vuduc, “A performance analysisframework for identifying potential benefits in GPGPU applications,” inProc. 17th ACM SIGPLAN Symp. Principles Pract. Parallel Program.,New Orleans, LA, USA, Feb. 2012, pp. 11–22.
[6] S. Hong and H. Kim, “An integrated GPU power and performancemodel,” in Proc. ISCA, St-Malo, France, Jun. 2010, pp. 280–289.
[7] W. Jia, K. A. Shaw, and M. Martonosi, “Stargazer: Automatedregression-based GPU design space exploration,” in Proc. IEEE ISPASS,New Brunswick, NJ, USA, Apr. 2012, pp. 2–13.
[8] W. Jia, K. A. Shaw, and M. Martonosi, “Starchart: Hardware andsoftware optimization using recursive partitioning regression trees,”in Proc. 22nd Int. Conf. Parallel Archit. Compilation Tech. (PACT),Sep. 2013, pp. 257–267.
[9] W. Jia, K. A. Shaw, and M. Martonosi, “GPU performance and powertuning using regression trees,” ACM Trans. Archit. Code Optim., vol. 12,no. 2, p. 13, May 2015.
[10] G. Wu, J. L. Greathouse, A. Lyashevsky, N. Jayasena, and D. Chiou,“GPGPU performance and power estimation using machine learning,”in Proc. Int. Symp. High Perform. Comput. Archit. (HPCA), Feb. 2015,pp. 564–576.
[11] J. H. Friedman, “Stochastic gradient boosting,” Comput. Stat. DataAnal., vol. 38, no. 4, pp. 367–378, Feb. 2002.
[12] J. J. Yi, D. J. Lilja, and D. M. Hawkins, “A statistically rigorous approachfor improving simulation methodology,” in Proc. 9th Int. Symp. HighPerform. Comput. Archit. (HPCA), Feb. 2003, pp. 281–291.
[13] L. Breiman, “Bagging predictors,” Mach. Learn., vol. 24, no. 2,pp. 123–140, Aug. 1996.
[15] J. A. Hoeting, D. Madigan, A. E. Raftery, and C. T. Volinsky, “Bayesianmodel averaging: A tutorial,” Stat. Sci., vol. 14, no. 4, pp. 382–417,Nov. 1999.
[16] Y. Freund and R. E. Schapire, “A decision-theoretic generalization ofon-line learning and an application to boosting,” J. Comput. Syst. Sci.,vol. 55, no. 1, pp. 119–139, Aug. 1997.
[17] T. G. Dietterich, “An experimental comparison of three methods forconstructing ensembles of decision trees: Bagging, boosting, and ran-domization,” Mach. Learn., vol. 13, no. 1, pp. 1–22, Mar. 1999.
[18] J. H. Friedman and J. J. Meulman, “Multiple additive regressiontrees with application in epidemiology,” Stat. Med., vol. 22, no. 9,pp. 1365–1381, May 2003.
[19] A. Bakhoda, G. L. Yuan, W. W. Fung, H. Wong, and T. M. Aamodt,“Analyzing CUDA workloads using a detailed GPU simulator,” in Proc.IEEE Int. Symp. Perform. Anal. Syst. Softw. (ISPASS), Boston, MA,USA, 2009, pp. 163–174.
[20] The NVIDIA CUDA SDK Code Samples, NVIDIA Corp., Santa Clara,CA, USA, 2013.
[21] S. Che et al., “Rodinia: A benchmark suite for heterogeneous com-puting,” in Proc. IEEE Int. Symp. Workload Characterization, 2009,pp. 44–54.
[22] I. Group. (2007). The Parboil Benchmark Suite. [Online]. Available:http://impact.crhc.illions.edu/parbiol.php
[23] L. Žaloudek, L. Sekanina, and V. Šimek, “GPU accelerators for evolv-able cellular automata,” in Proc. IEEE Comput. World Future Comput.Service Comput. Cogn. Adapt. Content Pattens, Nov. 2009, pp. 533–537.
[24] M. Giles and S. Xiaoke. Notes on Using theNVIDIA 8800 GTX Graphics Card. [Online]. Available:https://people.maths.ox.ac.uk/gilesm/codes/libor_old/report.pdf
[25] M. Giles. Jacobi Iteration for a Laplace Discretisation on a 3DStructured Grid. [Online]. Available: https://people.maths.ox.ac.uk/gilesm/codes/laplace3d/laplace3d.pdf
[26] V. Garcia, E. Debreuve, and M. Barlaud, “Fast k nearest neighborsearch using GPU,” in Proc. IEEE CVPR Workshop Comput. Vis. GPU,Jun. 2008, pp. 1–6.
[27] R. Development Team. (2013). R Language Definition. [Online].Available: http://cran.r-project.org/doc/manual/R-lang.pdf
[28] Cran. R Project. (May 2013). gbm. [Online]. Available:http://cran.r-project.org/web/packages/gbm/gbm.pdf
[29] J. J. Yi, D. J. Lilja, and D. M. Hawkins, “A statistically rigorousapproach for improving simulation methodology,” in Proc. IEEE Int.Symp. High Perform. Comput. Archit. (HPCA), Anaheim, CA, USA,Feb. 2003, pp. 281–291.
[30] R. L. Plackett and J. P. Burman, “The design of optimum multifactorialexperiments,” Biometrika, vol. 33, no. 4, pp. 305–325, 1946.
[31] CUDA Tookit Documentation, NVIDIA Corp., Santa Clara, CA, USA,2008.
[32] Introducing The GeForce GTX780, NVIDIA Corp., Santa Clara, CA,USA, 2013.
[33] P. J. Joseph, K. Vaswani, and M. J. Thazhuthaveetil, “Construction anduse of linear regression models for processor performance analysis,” inProc. 12th Int. Symp. High Perform. Comput. Archit. (HPCA), Austin,TX, USA, Feb. 2006, pp. 99–108.
[34] P. J. Joseph, K. Vaswani, and M. J. Thazhuthaveetil, “A predictiveperformance model for superscalar processors,” in Proc. 39th Annu.IEEE/ACM Int. Symp. Microarchit. (MICRO), Dec. 2006, pp. 161–170.
[35] B. C. Lee and D. M. Brooks, “Accurate and efficient regression modelingfor microarchitectural performance and power prediction,” in Proc. 12thInt. Conf. Archit. Support Program. Lang. Oper. Syst. (ASPLOS), SanJose, CA, USA, Oct. 2006, pp. 185–194.
[36] B. C. Lee, J. Collins, H. Wang, and D. Brooks, “CPR: Composableperformance regression for scalable multiprocessor models,” inProc. 41st Annu. IEEE/ACM Int. Symp. Microarchit. (MICRO),Nov. 2008, pp. 270–281.
[37] B. C. Lee and D. M. Brooks, “Efficiency trends and limits from compre-hensive microarchitectural adaptivity,” in Proc. 13th Int. Conf. Archit.Support Program. Lang. Oper. Syst. (ASPLOS), Seattle, WA, USA,Mar. 2008, pp. 36–47.
[38] E. Ïpek, S. A. McKee, R. Caruana, B. R. de Supinski, andM. Schulz, “Efficiently exploring architectural design spaces via predic-tive modeling,” in Proc. 12th Int. Conf. Archit. Support Program. Lang.Oper. Syst. (ASPLOS), San Jose, CA, USA, Oct. 2006, pp. 195–206.
[39] C. Dubach, T. M. Jones, and M. F. P. O’Boyle, “Microarchitecturaldesign space exploration using an architecture-centric approach,” inProc. IEEE/ACM Annu. Int. Symp. Microarchit. (MICRO), Dec. 2007,pp. 262–271.
[40] B. Lee et al., “Methods of inference and learning for performancemodeling of parallel applications,” in Proc. 12th ACM SIGPLAN Symp.Principles Pract. Parallel Program. (PPOPP), San Jose, CA, USA,Mar. 2007, pp. 249–258.
1224 IEEE TRANSACTIONS ON COMPUTER-AIDED DESIGN OF INTEGRATED CIRCUITS AND SYSTEMS, VOL. 37, NO. 6, JUNE 2018
[41] K. Vaswani, M. J. Thazhuthaveetil, Y. N. Srikant, and P. J. Joseph,“Microarchitecture sensitive empirical models for compiler optimiza-tions,” in Proc. Int. Symp. Code Gener. Optim. (CGO), San Jose, CA,USA, Mar. 2007, pp. 131–143.
[42] E. Ould-Ahmed-Vall, J. Woodlee, C. Yount, K. A. Doshi, andS. Abraham, “Using model trees for computer architecture performanceanalysis of software applications,” in Proc. IEEE Int. Symp. Perform.Anal. Syst. Softw. (ISPASS), Apr. 2007, pp. 116–125.
[43] L. Eeckhout, H. Vandierendonck, and K. D. Bosschere, “Quantifyingthe impact of input data sets on program behavior and its applications,”J. Inst. Level Parallelism, vol. 5, no. 2, pp. 1–33, 2003.
[44] N. Goswami, R. Shankar, M. Joshi, and T. Li, “Exploring GPGPUworkloads: Characterization methodology, analysis and microarchitec-ture evaluation implications,” in Proc. IEEE Int. Symp. WorkloadCharacterization (IISWC), 2010, pp. 1–10.
[45] S. Sarma and N. Dutt, “Cross-layer exploration of heterogeneousmulticore processor configurations,” in Proc. 28th Int. Conf. VLSI Design14th Int. Conf. Embedded Syst., Bengaluru, India, 2015, pp. 147–152.
Zhibin Yu (M’07) received the Ph.D. degree incomputer science from the Huazhong University ofScience and Technology (HUST), Wuhan, China,in 2008.
He is currently a Professor with the ShenzhenInstitutes of Advanced Technology, ChineseAcademy of Science, Shenzhen, China. His currentresearch interests include computer architecture,workload characterization and generation, GPGPUarchitecture, and big data processing.
Dr. Yu was a recipient of the OutstandingTechnical Talent Program of Chinese Academy of Science in 2014, the“Peacock Talent” Program of Shenzhen City in 2013, the First Award inTeaching Contest of HUST Young Lectures in 2005, and the Second Awardin Teaching Quality Assessment of HUST in 2003. He serves for ISCA2013, MICRO 2014, ISCA 2015, and HPCA 2015. He is a member of ACM.
Jing Wang received the Ph.D. degree from PekingUniversity, Beijing, China, in 2011.
From 2011 to 2013, she was a Post-DoctoralFellow with the Department of ComputerScience, Peking University. She is currentlyan Assistant Professor with the Electrical andComputer Engineering Department, Capital NormalUniversity, Beijing. Her current research interestsinclude computer architecture, energy-efficientcomputing, high-performance computing, andhardware reliability and variability.
Lieven Eeckhout (SM’02) received the Ph.D.degree from Ghent University, Ghent, Belgium, in2002.
He is a Professor with Ghent University. Hepublished a Morgan and Claypool synthesis lec-ture monograph in 2010 on performance evalua-tion methods. His current research interests includecomputer architecture with a specific emphasis onperformance evaluation methodologies and dynamicresource management.
Dr. Eeckhout was a recipient of the two IEEEMicro Top Pick Awards and a Best Paper Award at ISPASS 2013. He wasthe Program Chair for HPCA 2015, CGO 2013, and ISPASS 2009. He cur-rently acts as the Editor-in-Chief of IEEE MICRO, and as Associate Editorfor the IEEE TRANSACTIONS ON COMPUTERS and ACM Transactions onArchitecture and Code Optimization
Chengzhong Xu (F’95) received the Ph.D. degreefrom the University of Hong Kong, Hong Kong, in1993.
He is currently the Director with the Instituteof Advanced Computing and Data Engineering,Shenzhen Institute of Advanced Technology,Chinese Academy of Science, Beijing, China.His current research interests include parallel anddistributed systems, and cloud computing.
Dr. Xu was a recipient of the OutstandingOverseas Scholar Award of NSFC. He serves on a
number of journal editorial boards, including the IEEE TRANSACTIONS ON
COMPUTERS, the IEEE TRANSACTIONS ON PARALLEL AND DISTRIBUTED
SYSTEMS, the IEEE TRANSACTIONS ON CLOUD COMPUTING, the Journalof Parallel and Distributed Computing, and China Science InformationSciences.