124
Certain Magnesia Carbon Bricks From China and Mexico Investigation Nos. 701-TA-468 and 731-TA-1166-1167 (Preliminary) Publication 4100 September 2009 Washington, DC 20436
Certain Magnesia Carbon BricksFrom China and Mexico
Investigation Nos. 701-TA-468 and 731-TA-1166-1167(Preliminary)
Publication 4100 September 2009
Washington, DC 20436
U.S. International Trade Commission
COMMISSIONERS
Shara L. Aranoff, ChairmanDaniel R. Pearson, Vice Chairman
Deanna Tanner OkunCharlotte R. Lane
Irving A. WilliamsonDean A. Pinkert
Robert A. RogowskyDirector of Operations
Staff assigned
Elizabeth Haines, InvestigatorVincent DeSapio, Industry Analyst
Michelle Koscielski, Industry AnalystJames Fetzer, EconomistCharles Yost, Accountant
Michael Haldenstein, AttorneySteven Hudgens, Statistician
Keysha Martinez, Intern
James McClure, Supervisor Investigator
Address all communications toSecretary to the Commission
United States International Trade CommissionWashington, DC 20436

U.S. International Trade CommissionWashington, DC 20436
www.usitc.gov
Certain Magnesia Carbon BricksFrom China and Mexico
Investigation Nos. 701-TA-468 and 731-TA-1166-1167(Preliminary)
Publication 4100 September 2009


i
TABLE OF CONTENTS
Page
Determination . . . . . . . . . . . . . . . . . . . . . . . . . . . . . . . . . . . . . . . . . . . . . . . . . . . . . . . . . . . . . . . . . . 1Views of the Commission . . . . . . . . . . . . . . . . . . . . . . . . . . . . . . . . . . . . . . . . . . . . . . . . . . . . . . . . . 3Separate and dissenting views of Chairman Shara L. Aranoff, Vice Chairman Daniel R. Pearson, and Commissioner Deanna Tanner Okun . . . . . . . . . . . . . . . . . . . . . . . . . . . . . . . 23Part I: Introduction . . . . . . . . . . . . . . . . . . . . . . . . . . . . . . . . . . . . . . . . . . . . . . . . . . . . . . . . . . . . I-1
Background . . . . . . . . . . . . . . . . . . . . . . . . . . . . . . . . . . . . . . . . . . . . . . . . . . . . . . . . . . . . . . . . . . I-1Statutory criteria and organization of the report . . . . . . . . . . . . . . . . . . . . . . . . . . . . . . . . . . . . . . I-1
Statutory criteria . . . . . . . . . . . . . . . . . . . . . . . . . . . . . . . . . . . . . . . . . . . . . . . . . . . . . . . . . . . I-1Organization of the report . . . . . . . . . . . . . . . . . . . . . . . . . . . . . . . . . . . . . . . . . . . . . . . . . . . . I-2
U.S. market summary . . . . . . . . . . . . . . . . . . . . . . . . . . . . . . . . . . . . . . . . . . . . . . . . . . . . . . . . . . I-2Summary data and data sources . . . . . . . . . . . . . . . . . . . . . . . . . . . . . . . . . . . . . . . . . . . . . . . . . . I-3Previous and related Title VII investigations . . . . . . . . . . . . . . . . . . . . . . . . . . . . . . . . . . . . . . . . I-3Nature and extent of alleged subsidies and sales at LTFV . . . . . . . . . . . . . . . . . . . . . . . . . . . . . . I-3
Alleged subsidies . . . . . . . . . . . . . . . . . . . . . . . . . . . . . . . . . . . . . . . . . . . . . . . . . . . . . . . . . . . I-3Alleged sales at LTFV . . . . . . . . . . . . . . . . . . . . . . . . . . . . . . . . . . . . . . . . . . . . . . . . . . . . . . . I-4
The subject merchandise . . . . . . . . . . . . . . . . . . . . . . . . . . . . . . . . . . . . . . . . . . . . . . . . . . . . . . . . I-4Commerce’s scope . . . . . . . . . . . . . . . . . . . . . . . . . . . . . . . . . . . . . . . . . . . . . . . . . . . . . . . . . . I-4Tariff treatment . . . . . . . . . . . . . . . . . . . . . . . . . . . . . . . . . . . . . . . . . . . . . . . . . . . . . . . . . . . . I-4
The product . . . . . . . . . . . . . . . . . . . . . . . . . . . . . . . . . . . . . . . . . . . . . . . . . . . . . . . . . . . . . . . . . . I-6Description and applications . . . . . . . . . . . . . . . . . . . . . . . . . . . . . . . . . . . . . . . . . . . . . . . . . . I-6Manufacturing processes . . . . . . . . . . . . . . . . . . . . . . . . . . . . . . . . . . . . . . . . . . . . . . . . . . . . . I-9
Domestic like product issues . . . . . . . . . . . . . . . . . . . . . . . . . . . . . . . . . . . . . . . . . . . . . . . . . . . . I-11
Part II: Conditions of competition in the U.S. market . . . . . . . . . . . . . . . . . . . . . . . . . . . . . . . . II-1U.S. market characteristics . . . . . . . . . . . . . . . . . . . . . . . . . . . . . . . . . . . . . . . . . . . . . . . . . . . . . . II-1Channels of distribution . . . . . . . . . . . . . . . . . . . . . . . . . . . . . . . . . . . . . . . . . . . . . . . . . . . . . . . . II-1Supply and demand considerations . . . . . . . . . . . . . . . . . . . . . . . . . . . . . . . . . . . . . . . . . . . . . . . . II-1
Supply . . . . . . . . . . . . . . . . . . . . . . . . . . . . . . . . . . . . . . . . . . . . . . . . . . . . . . . . . . . . . . . . . . . II-1Demand . . . . . . . . . . . . . . . . . . . . . . . . . . . . . . . . . . . . . . . . . . . . . . . . . . . . . . . . . . . . . . . . . . II-4
Substitutability issues . . . . . . . . . . . . . . . . . . . . . . . . . . . . . . . . . . . . . . . . . . . . . . . . . . . . . . . . . . II-6Factors affecting purchasing decisions . . . . . . . . . . . . . . . . . . . . . . . . . . . . . . . . . . . . . . . . . . II-6Comparison of the U.S. produced and imported MCB . . . . . . . . . . . . . . . . . . . . . . . . . . . . . . II-7
Part III: U.S. producers’ production, shipments, and employment . . . . . . . . . . . . . . . . . . . . . . III-1U.S. producers . . . . . . . . . . . . . . . . . . . . . . . . . . . . . . . . . . . . . . . . . . . . . . . . . . . . . . . . . . . . . . . III-1U.S. capacity, production, and capacity utilization . . . . . . . . . . . . . . . . . . . . . . . . . . . . . . . . . . . III-2U.S. producers’ shipments . . . . . . . . . . . . . . . . . . . . . . . . . . . . . . . . . . . . . . . . . . . . . . . . . . . . . . III-2U.S. producers’ inventories . . . . . . . . . . . . . . . . . . . . . . . . . . . . . . . . . . . . . . . . . . . . . . . . . . . . . III-4U.S. producers’ imports and purchases . . . . . . . . . . . . . . . . . . . . . . . . . . . . . . . . . . . . . . . . . . . . . III-4U.S. employment, wages, and productivity . . . . . . . . . . . . . . . . . . . . . . . . . . . . . . . . . . . . . . . . . III-5

ii
TABLE OF CONTENTS
Page
Part IV: U.S. imports, apparent consumption, and market shares . . . . . . . . . . . . . . . . . . . . . . IV-1U.S. importers . . . . . . . . . . . . . . . . . . . . . . . . . . . . . . . . . . . . . . . . . . . . . . . . . . . . . . . . . . . . . . . . IV-1U.S. imports . . . . . . . . . . . . . . . . . . . . . . . . . . . . . . . . . . . . . . . . . . . . . . . . . . . . . . . . . . . . . . . . . IV-1Cumulation considerations . . . . . . . . . . . . . . . . . . . . . . . . . . . . . . . . . . . . . . . . . . . . . . . . . . . . . . IV-4Negligibility . . . . . . . . . . . . . . . . . . . . . . . . . . . . . . . . . . . . . . . . . . . . . . . . . . . . . . . . . . . . . . . . . IV-4Apparent U.S. consumption . . . . . . . . . . . . . . . . . . . . . . . . . . . . . . . . . . . . . . . . . . . . . . . . . . . . . IV-5U.S. market shares . . . . . . . . . . . . . . . . . . . . . . . . . . . . . . . . . . . . . . . . . . . . . . . . . . . . . . . . . . . . IV-5Ratio of imports to U.S. production . . . . . . . . . . . . . . . . . . . . . . . . . . . . . . . . . . . . . . . . . . . . . . . IV-7
Part V: Pricing and related information . . . . . . . . . . . . . . . . . . . . . . . . . . . . . . . . . . . . . . . . . . . . V-1Factors affecting prices . . . . . . . . . . . . . . . . . . . . . . . . . . . . . . . . . . . . . . . . . . . . . . . . . . . . . . . . . V-1
Raw material costs . . . . . . . . . . . . . . . . . . . . . . . . . . . . . . . . . . . . . . . . . . . . . . . . . . . . . . . . . . V-1U.S. inland transportation costs . . . . . . . . . . . . . . . . . . . . . . . . . . . . . . . . . . . . . . . . . . . . . . . . V-1
Pricing practices . . . . . . . . . . . . . . . . . . . . . . . . . . . . . . . . . . . . . . . . . . . . . . . . . . . . . . . . . . . . . . V-1Pricing methods . . . . . . . . . . . . . . . . . . . . . . . . . . . . . . . . . . . . . . . . . . . . . . . . . . . . . . . . . . . . V-1Lead times . . . . . . . . . . . . . . . . . . . . . . . . . . . . . . . . . . . . . . . . . . . . . . . . . . . . . . . . . . . . . . . . V-2Sales terms and discounts . . . . . . . . . . . . . . . . . . . . . . . . . . . . . . . . . . . . . . . . . . . . . . . . . . . . V-2
Price data . . . . . . . . . . . . . . . . . . . . . . . . . . . . . . . . . . . . . . . . . . . . . . . . . . . . . . . . . . . . . . . . . . . V-2Price trends . . . . . . . . . . . . . . . . . . . . . . . . . . . . . . . . . . . . . . . . . . . . . . . . . . . . . . . . . . . . . . . V-3Price comparisons . . . . . . . . . . . . . . . . . . . . . . . . . . . . . . . . . . . . . . . . . . . . . . . . . . . . . . . . . . V-5
Lost sales and lost revenues . . . . . . . . . . . . . . . . . . . . . . . . . . . . . . . . . . . . . . . . . . . . . . . . . . . . . V-6
Part VI: Financial experience of U.S. producers . . . . . . . . . . . . . . . . . . . . . . . . . . . . . . . . . . . . . VI-1Background . . . . . . . . . . . . . . . . . . . . . . . . . . . . . . . . . . . . . . . . . . . . . . . . . . . . . . . . . . . . . . . . . . VI-1Operations on MCB . . . . . . . . . . . . . . . . . . . . . . . . . . . . . . . . . . . . . . . . . . . . . . . . . . . . . . . . . . . VI-1Capital expenditures and research and development expenses . . . . . . . . . . . . . . . . . . . . . . . . . . . VI-4Assets and return on investment . . . . . . . . . . . . . . . . . . . . . . . . . . . . . . . . . . . . . . . . . . . . . . . . . . VI-4Capital and investment . . . . . . . . . . . . . . . . . . . . . . . . . . . . . . . . . . . . . . . . . . . . . . . . . . . . . . . . . VI-5
Actual negative effects . . . . . . . . . . . . . . . . . . . . . . . . . . . . . . . . . . . . . . . . . . . . . . . . . . . . . . VI-5Anticipated negative effects . . . . . . . . . . . . . . . . . . . . . . . . . . . . . . . . . . . . . . . . . . . . . . . . . . VI-5
Part VII: Threat considerations and information on nonsubject countries . . . . . . . . . . . . . . . VII-1The industry in China . . . . . . . . . . . . . . . . . . . . . . . . . . . . . . . . . . . . . . . . . . . . . . . . . . . . . . . . . . VII-2The industry in Mexico . . . . . . . . . . . . . . . . . . . . . . . . . . . . . . . . . . . . . . . . . . . . . . . . . . . . . . . . . VII-4U.S. importers’ inventories of MCB . . . . . . . . . . . . . . . . . . . . . . . . . . . . . . . . . . . . . . . . . . . . . . . VII-5U.S. importer’s current orders . . . . . . . . . . . . . . . . . . . . . . . . . . . . . . . . . . . . . . . . . . . . . . . . . . . VII-5Antidumping and countervailing duty investigations in third-country markets . . . . . . . . . . . . . . VII-5Information on producers in nonsubject countries . . . . . . . . . . . . . . . . . . . . . . . . . . . . . . . . . . . . VII-5
iii
TABLE OF CONTENTS
Page
AppendixesA. Federal Register notices . . . . . . . . . . . . . . . . . . . . . . . . . . . . . . . . . . . . . . . . . . . . . . . . . . . . . . . . A-1B. Conference witnesses . . . . . . . . . . . . . . . . . . . . . . . . . . . . . . . . . . . . . . . . . . . . . . . . . . . . . . . . . . B-1C. Summary data . . . . . . . . . . . . . . . . . . . . . . . . . . . . . . . . . . . . . . . . . . . . . . . . . . . . . . . . . . . . . . . . C-1
Note.–Information that would reveal confidential operations of individual concerns may not bepublished and therefore has been deleted from this report. Such deletions are indicated byasterisks.


1 The record is defined in sec. 207.2(f) of the Commission’s Rules of Practice and Procedure (19 CFR § 207.2(f)). 2 Commissioner Charlotte R. Lane, Commissioner Irving A. Williamson, and Commissioner Dean A. Pinkertdetermine that there is a reasonable indication that an industry in the United States is materially injured by reason ofimports of certain magnesia carbon bricks from China and Mexico. 3 Chairman Shara L. Aranoff, Vice Chairman Daniel R. Pearson, and Commissioner Deanna Tanner Okundetermine that there is a reasonable indication that an industry in the United States is threatened with material injuryby reason of imports of certain magnesia carbon bricks from China and determine that there is no reasonableindication that an industry in the United States is materially injured or threatened with material injury, or that theestablishment of an industry in the United States is materially retarded, by reason of imports from Mexico of certainmagnesia carbon bricks.
UNITED STATES INTERNATIONAL TRADE COMMISSION
Investigation Nos. 701-TA-468 and 731-TA-1166-1167 (Preliminary)
CERTAIN MAGNESIA CARBON BRICKS FROM CHINA AND MEXICO
DETERMINATIONS
On the basis of the record1 developed in the subject investigations, the United States InternationalTrade Commission (Commission) determines, pursuant to sections 703(a) and 733(a) of the Tariff Act of1930 (19 U.S.C. § 1671b(a) and 19 U.S.C. § 1673b(a)) (the Act), that there is a reasonable indication thatan industry in the United States is materially injured,2 or threatened with material injury3 by reason ofimports from China and Mexico of certain magnesia carbon bricks, provided for in subheadings6902.10.10, 6902.10.50, 6815.91.00, and 6815.99.00 of the Harmonized Tariff Schedule of the UnitedStates, that are alleged to be sold in the United States at less than fair value (LTFV) and subsidized by theGovernment of China.
COMMENCEMENT OF FINAL PHASE INVESTIGATION
Pursuant to section 207.18 of the Commission’s rules, the Commission also gives notice of thecommencement of the final phase of its investigations. The Commission will issue a final phase notice ofscheduling, which will be published in the Federal Register as provided in section 207.21 of theCommission’s rules, upon notice from the Department of Commerce (Commerce) of affirmativepreliminary determinations in these investigations under sections 703(b) and 733(b) of the Act, or, if thepreliminary determinations are negative, upon notice of affirmative final determinations in thoseinvestigations under sections 705(a) and 735(a) of the Act. Parties that filed entries of appearance in thepreliminary phase of the investigations need not enter a separate appearance for the final phase of theinvestigations. Industrial users, and, if the merchandise under investigation is sold at the retail level,representative consumer organizations have the right to appear as parties in Commission antidumping andcountervailing duty investigations. The Secretary will prepare a public service list containing the namesand addresses of all persons, or their representatives, who are parties to the investigations.
BACKGROUND
On July 29, 2009, a petition was filed with the Commission and Commerce by Resco ProductsInc., Pittsburgh, PA, alleging that an industry in the United States is materially injured or threatened withmaterial injury by reason of subsidized imports of certain magnesia carbon bricks from China and LTFVimports of certain magnesia carbon bricks from China and Mexico. Accordingly, effective July 29, 2009,
2
the Commission instituted countervailing duty investigation No. 701-TA-468 (Preliminary) andantidumping duty investigation Nos. 731-TA-1166-1167 (Preliminary). Notice of the institution of theCommission’s investigations and of a public conference to be held in connection therewith was given byposting copies of the notice in the Office of the Secretary, U.S. International Trade Commission,Washington, DC, and by publishing the notice in the Federal Register of August 10, 2009 (74 FR 39969). The conference was held in Washington, DC, on August 19, 2009, and all persons who requested theopportunity were permitted to appear in person or by counsel.

1 Commissioner Charlotte R. Lane, Commissioner Irving A. Williamson, and Commissioner Dean A. Pinkertdetermine that there is a reasonable indication that a domestic industry is materially injured by reason of subjectimports of MCBs from China and Mexico. 2 Chairman Shara L. Aranoff, Vice Chairman Daniel R. Pearson, and Commissioner Deanna Tanner Okundetermine that there is a reasonable indication that an industry in the United States is threatened with material injuryby reason of subject imports from China and that there is no reasonable indication that an industry in the UnitedStates is materially injured or threatened with material injury by reason of subject imports from Mexico. They jointhe Commission opinion through Section VI(B), except as noted herein. See Separate and Dissenting Views ofChairman Shara L. Aranoff, Vice Chairman Daniel R. Pearson, and Commissioner Deanna Tanner Okun. 3 19 U.S.C. §§ 1671b(a), 1673b(a) (2000); see also American Lamb Co. v. United States, 785 F.2d 994, 1001-04(Fed. Cir. 1986); Aristech Chem. Corp. v. United States, 20 CIT 353, 354-55 (1996). No party argued that theestablishment of an industry is materially retarded by reason of the allegedly unfairly traded imports. 4 American Lamb Co., 785 F.2d at 1001; see also Texas Crushed Stone Co. v. United States, 35 F.3d 1535, 1543(Fed. Cir. 1994).
3
VIEWS OF THE COMMISSION
Based on the record in the preliminary phase of these investigations, we find that there is areasonable indication that an industry in the United States is materially injured1 or threatened withmaterial injury2 by reason of imports of magnesia carbon bricks (“MCBs”) from China that are allegedlysold in the United States at less than fair value and subsidized by the Government of China and imports ofMCBs from Mexico that are allegedly sold in the United States at less than fair value.
I. THE LEGAL STANDARD FOR PRELIMINARY DETERMINATIONS
The legal standard for preliminary antidumping and countervailing duty determinations requiresthe Commission to determine, based upon the information available at the time of the preliminarydetermination, whether there is a reasonable indication that a domestic industry is materially injured orthreatened with material injury, or that the establishment of an industry is materially retarded, by reasonof the allegedly unfairly traded imports.3 In applying this standard, the Commission weighs the evidencebefore it and determines whether “(1) the record as a whole contains clear and convincing evidence thatthere is no material injury or threat of such injury; and (2) no likelihood exists that contrary evidence willarise in a final investigation.”4
II. BACKGROUND
The antidumping and countervailing duty petitions in these investigations were filed on July 29,2009, by Resco Products, Inc. (“Resco”). Two Chinese producers, Yingkou Bayuquan Refractories Co.,Ltd. and RHI Refractories Liaoning Co., Ltd., and one Mexican producer, RHI-Refmex S.A. de C.V.,entered appearances as respondents. Three importers, S & S Intersource LLC, Vesuvius USACorporation, and Veitsch-Radex America, Inc. also entered appearances as respondents.
Resco filed a postconference brief, and Vesuvius USA Corporation and Yingkou BayuquanRefractories Co., Ltd. (collectively, the “Vesuvius Respondents”) filed a joint postconference brief. RHIRefractories Liaoning Co., Ltd., RHI-Refmex S.A. de C.V., and Veitsch-Radex America, Inc.(collectively, the “RHI Respondents”) also filed a joint postconference brief. Representatives of Rescoand importers Fedmet Resources and S & S Intersource appeared at the staff conference.

5 Confidential Staff Report (“CR”), INV-GG-076 (Sept. 8, 2009), as amended by INV-GG-077, at VI-1; PublicStaff Report (“PR”) at VI-1. Resco, ANH Refractories, Inc. (“ANH”), and LWB Refractories (“LWB”) allresponded to the questionnaires. Id. 6 CR at VI-1; PR at 1. 7 CR at IV-3, PR at IV-1. 8 CR/PR at IV-1. 9 CR at VII-3, PR at VII-1. 10 CR at VII-5, PR at VII-4. 11 19 U.S.C. § 1677(4)(A). 12 19 U.S.C. § 1677(4)(A). 13 19 U.S.C. § 1677(10). 14 See, e.g., Cleo, Inc. v. United States, 501 F.3d 1291, 1299 (Fed. Cir. 2007); NEC Corp. v. Department ofCommerce, 36 F. Supp. 2d 380, 383 (Ct. Int’l Trade 1998); Nippon Steel Corp. v. United States, 19 CIT 450, 455(1995); Torrington Co. v. United States, 747 F. Supp. 744, 749 n.3 (Ct. Int’l Trade 1990), aff’d, 938 F.2d 1278 (Fed.Cir. 1991) (“every like product determination ‘must be made on the particular record at issue’ and the ‘unique factsof each case’”). The Commission generally considers a number of factors including the following: (1) physicalcharacteristics and uses; (2) interchangeability; (3) channels of distribution; (4) customer and producer perceptionsof the products; (5) common manufacturing facilities, production processes, and production employees; and, whereappropriate, (6) price. See Nippon, 19 CIT at 455 n.4; Timken Co. v. United States, 913 F. Supp. 580, 584 (Ct. Int’lTrade 1996). 15 See, e.g., S. Rep. No. 96-249 at 90-91 (1979).
4
There are four firms currently producing MCBs in the United States; three responded toCommission questionnaires with usable data.5 The questionnaire responses cover more than *** percentof domestic production and shipments of MCBs during 2008.6 The Commission has relied onquestionnaire responses rather than official import statistics because the official statistics are derived from“basket” categories that include imports other than the subject merchandise.7 Questionnaire responseswere received from 16 importers representing 80 percent of total U.S. imports from China and virtuallyall imports from Mexico.8 The Commission received usable foreign producer questionnaire responsesfrom seven Chinese producers, estimated to account for approximately *** percent of Chinese exports ofMCBs to the United States during the period examined.9 The Commission also received a completedquestionnaire from the only Mexican producer of the subject product, RHI-Refmex S.A.10
III. DOMESTIC LIKE PRODUCT
A. In General
In determining whether an industry in the United States is materially injured or threatened withmaterial injury by reason of imports of the subject merchandise, the Commission first defines the“domestic like product” and the “industry.”11 Section 771(4)(A) of the Tariff Act of 1930, as amended(“the Tariff Act”), defines the relevant domestic industry as the “producers as a whole of a domestic likeproduct, or those producers whose collective output of a domestic like product constitutes a majorproportion of the total domestic production of the product.”12 In turn, the Tariff Act defines “domesticlike product” as “a product which is like, or in the absence of like, most similar in characteristics and useswith, the article subject to an investigation ... .”13
The decision regarding the appropriate domestic like product(s) in an investigation is a factualdetermination, and the Commission has applied the statutory standard of “like” or “most similar incharacteristics and uses” on a case-by-case basis.14 No single factor is dispositive, and the Commissionmay consider other factors it deems relevant based on the facts of a particular investigation.15 TheCommission looks for clear dividing lines among possible like products and disregards minor
16 Nippon, 19 CIT at 455; Torrington, 747 F. Supp. at 748-49; see also S. Rep. No. 96-249 at 90-91 (1979)(Congress has indicated that the like product standard should not be interpreted in “such a narrow fashion as topermit minor differences in physical characteristics or uses to lead to the conclusion that the product and article arenot ‘like’ each other, nor should the definition of ‘like product’ be interpreted in such a fashion as to preventconsideration of an industry adversely affected by the imports under consideration.”). 17 See, e.g., USEC, Inc. v. United States, 34 Fed. Appx. 725, 730 (Fed. Cir. 2002) (“The ITC may not modify theclass or kind of imported merchandise examined by Commerce.”); Algoma Steel Corp. v. United States, 688 F.Supp. 639, 644 (Ct. Int’l Trade 1988), aff’d, 865 F.3d 240 (Fed. Cir.), cert. denied, 492 U.S. 919 (1989). 18 Hosiden Corp. v. Advanced Display Mfrs., 85 F.3d 1561, 1568 (Fed. Cir. 1996) (the Commission may find asingle like product corresponding to several different classes or kinds defined by Commerce); Cleo, 501 F.3d at 1298n.1 (“Commerce’s {scope} finding does not control the Commission’s {like product} determination.”); Torrington,747 F. Supp. at 748-52 (affirming the Commission’s determination defining six like products in investigations whereCommerce found five classes or kinds). 19 See, e.g., Acciai Speciali Terni S.p.A. v. United States, 118 F. Supp. 2d 1298, 1304-05 (Ct. Int’l Trade 2000);Nippon, 19 CIT at 455; Asociacion Colombiana de Exportadores de Flores v. United States, 693 F. Supp. 1165,1169 n.5 (Ct. Int’l Trade 1988); Citrosuco Paulista, S.A. v. United States, 704 F. Supp. 1075, 1087-88 (Ct. Int’lTrade 1988). 20 CR at I-5, PR at I-4. Notices of Initiation, 74 Fed. Reg. 42852, 42858 (Aug. 25, 2009). The subjectmerchandise is provided for under subheadings 6902.10.10., 6902.10.50., 6815.91.00., and 6815.99.00 of theHarmonized Tariff Schedules of the United States (HTS). 21 CR at I-7, PR at I-6.
5
variations.16 Although the Commission must accept the U.S. Department of Commerce (“Commerce”) determination as to the scope of the imported merchandise that is subsidized or sold at less than fairvalue,17 the Commission determines what domestic product is like the imported articles Commerce hasidentified.18 The Commission must base its domestic like product determination on the record in theseinvestigations. The Commission is not bound by prior determinations, even those pertaining to the sameimported products, but may draw upon previous determinations in addressing pertinent domestic likeproduct issues.19
B. Product Description and Analysis
In its notices of initiation, Commerce defined the imported merchandise within the scope of theseinvestigations as follows:
certain chemically bonded (resin or pitch), magnesia carbon bricks with a magnesiacomponent of at least 70 percent magnesia (“MgO”) by weight, regardless of the sourceof raw materials for the MgO, with carbon levels ranging from trace amounts to 30percent by weight, regardless of enhancements, (for example, magnesia carbon bricks canbe enhanced with coating, grinding, tar impregnation or coking, high temperature heattreatments, anti-slip treatments or metal casing) and regardless of whether or notanti-oxidants are present (for example, antioxidants can be added to the mix from traceamounts to 15 percent by weight as various metals, metal alloys, and metal carbides).20
MCBs are refractory products that are made from a combination of magnesia and carbon. Refractoryproducts maintain their strength at high temperatures because they are made from specialized materials. Accordingly, they are used to provide thermal and corrosion resistance in operations involving hightemperatures and harsh operating conditions, such as in the production of iron and steel.21 The scope ofthe investigations includes only chemically bonded MCBs in which the magnesia content is at least 70percent and the carbon content ranges up to 30 percent.
22 CR at I-7, PR at I-6. 23 Transcript of Staff Conference of August 19, 2009 (“Tr”) (Copp) at 24. 24 Petitioner’s Postconference Brief (Pet. Br.) at Exhibit 8. 25 Tr. at 55 (Brown). 26 Pet. Br. at 4. 27 Petition at 10. 28 CR at I-7, PR at I-6. 29 CR at I-7, PR at I-6. 30 CR at I-7, PR at I-6. 31 RHI Respondents’ Br. at 3. 32 CR/PR at II-1 and Table II-1. 33 Tr. at 47-48, 62-63 (Mazard, Copp). For instance, fired bricks require very high temperature count anddolomite bricks must be immediately packaged because they decompose when exposed to the atmosphere. Id. 34 Tr. at 47 (Mazard).
6
MCBs are used to line lower sidewalls, upper sidewalls, slag lines, and roofs of ladles and ladlemetallurgy furnaces involved in steel production and refining, where MCBs come in contact with bothmolten steel and molten slag.22 Ladles used in steel production are by far the largest application forMCBs, followed by electric arc furnaces.23 MCBs are also used to line basic oxygen furnaces inintegrated steel mills and electric arc furnaces in non-integrated steel mills.24 MCBs are consumed in thesteelmaking process and need to be replaced every 4 to 12 days, depending upon the application.25
Petitioner Resco argues for a single like product that would be coterminous with Commerce’sscope of investigation.26 It maintains that other types of refractory bricks are not interchangeable withMCBs. According to Resco, refractory bricks have specific formulations that result in unique chemicaland physical characteristics, and each is used for particular applications based upon these characteristics.27
No other party objects to defining the domestic like product as coterminous with the scope ofsubject merchandise and to not expanding the like product to include other refractory products such asfired magnesite, fired bauxite, magnesia dolomite, and magnesia alumina graphite bricks. Based on thefactors normally considered, as discussed below, we define the domestic like product as MCBs, acategory that is coextensive with the scope of the investigations.
Physical Characteristics and Uses. MCBs are used to line lower sidewalls, upper sidewalls, slaglines, and roofs of ladles and ladle furnaces involved in steel production, where they come in contact withboth molten steel and molten slag.28 Other types of refractory brick also have high thermal resistance andare used in steelmaking applications, but MCBs are considered to be the most durable refractory bricks onthe market for ladle linings, especially around the slag line.29
Interchangeability. Other refractory bricks are not used interchangeably with MCBs, becauseMCBs have certain physical and chemical properties that are required for more demanding applications.30 Although respondents note that other types of refractory bricks may be used instead of MCBs in somecircumstances, other refractory bricks are not typically used interchangeably with MCBs.31
Channels of distribution. The record indicates that MCBs and other refractory bricks are solddirectly to the end users, steel producers.32
Common Manufacturing Facilities, Production Processes, and Production Employees. MCBsand other refractory bricks are made by the same manufacturers, but the manufacturing processes forMCBs and other refractory bricks may differ.33
Producer/Customer Perceptions. MCBs are perceived to be a distinct refractory product. Producers display MCBs separately from other refractory bricks in company brochures, on their websites,on pricing materials, and in purchase orders and technical guidelines.34
35 See CR/PR at Table C-1. 36 Tr. at 48 (Mazard). 37 The RHI Respondents argue that other types of refractory bricks are competitive with MCBs. RHIRespondents’ Br. at 3. They do not argue, however, that the domestic like product should be defined more broadlyto include such products. We remind the parties that, pursuant to rule 207.20(b), the written comments on draftquestionnaires in the final phase of the investigations must propose and identify any specific additional data that aparty wishes the Commission to gather concerning a possible broader definition of the domestic like product. 38 19 U.S.C. § 1677(4)(A). 39 19 U.S.C. § 1677(4)(B). 40 CR/PR at Table III-5. 41 19 U.S.C. § 1677(4)(B). 42 RHI Respondents’ Br. at 5-6. 43 Pet. Br. at 5-8. 44 CR/PR at Table III-1. 45 CR/PR at Table III-5. *** imported *** short tons in 2006, *** short tons in 2007, *** short tons in 2008,and *** short tons in the first six months of 2009 (interim 2009). Id. 46 CR/PR at Table III-5.
7
Price. The average unit net sales value for U.S.-produced MCBs in 2008 was $*** per ton.35 The record indicates that MCBs are $150-$500 more per ton than other refractory products.36
Conclusion. The record indicates that MCBs are not used interchangeably with other refractoryproducts. Compared with other refractory products, MCBs have distinct uses, differ in physicalcharacteristics, are priced higher, and are made by different production processes. Based on this evidenceand absent any arguments to the contrary,37 we define the domestic like product as consisting of MCBs, acategory that is coextensive with the scope of investigation.
IV. DOMESTIC INDUSTRY
The domestic industry is defined as the domestic “producers as a whole of a domestic likeproduct, or those producers whose collective output of a domestic like product constitutes a majorproportion of the total domestic production of the product.”38 In defining the domestic industry, theCommission’s general practice has been to include in the industry producers of all domestic production ofthe like product, whether toll-produced, captively consumed, or sold in the domestic merchant market. Based on our definition of the domestic like product, we define the domestic industry as all domesticproducers of MCBs.
We must determine whether any producer of the domestic like product should be excluded fromthe domestic industry pursuant to 19 U.S.C. § 1677(4)(B). Subsection 1677(4)(B) allows theCommission, if appropriate circumstances exist, to exclude from the domestic industry producers that arerelated to an exporter or importer of subject merchandise or which are themselves importers.39 Exclusionof such producers is within the Commission’s discretion based upon the facts presented in eachinvestigation. In these investigations, two U.S. producers, ***, reported that they imported subject MCBsduring the period examined.40 Thus, they may be excluded from the industry if appropriate circumstancesexist.41
The RHI Respondents urge the Commission to exclude *** from the definition of the domesticindustry because it is a significant importer.42 Resco argues that *** should not be excluded as a relatedparty because it is ***.43
*** domestic producer of MCBs, accounting for approximately *** of all domestic production in2008.44 ***.45 Although its importing activity was most extensive toward the end of the period and in*** in particular,46 the record indicates that its primary interest lies in domestic production. Its ratio of

47 CR/PR at Table III-5. 48 CR/PR at Table III-1. 49 See CR/PR at Table IV-1. 50 Consistent with her practice in past investigations and reviews, Chairman Aranoff does not rely on individual-company operating income margins, which reflect a domestic producer’s financial operations related to productionof the domestic like product, in assessing whether a related party has benefitted from importation of subjectmerchandise. Rather, she determines whether to exclude a related party based principally on its ratio of subjectimports to domestic production and whether its primary interests lie in domestic production or importation. 51 For purposes of the preliminary phase of these investigations, Commissioner Pinkert does not rely uponfinancial performance as a factor in determining whether there are appropriate circumstances to exclude relatedparties from the domestic industry. See Allied Mineral Products v. United States, 28 C.I.T. 1861, 1865-67 (2004). For the final phase of these investigations, Commissioner Pinkert invites the parties to provide any information theymay have with respect to whether these companies are benefitting financially from their status as related parties. 52 CR/PR at Table VI-2. 53 CR/PR at Table VI-2. 54 CR/PR at Table III-5; Tr. at 64 (Brown). *** imported *** short tons in 2006, *** short tons in 2007, ***short tons in 2008, and *** short tons in interim 2009. CR/PR at Table III-5. 55 CR/PR at Table III-1. 56 CR/PR at Table III-5. 57 CR/PR at Table VI-2. 58 19 U.S.C. § 1677(7)(G)(i).
8
subject imports to domestic production was a modest *** percent in 2008.47 *** also supports thepetition.48 These facts support the conclusion that its primary interest has remained that of a domesticproducer.
Furthermore, despite the fact that *** was the *** importer during the period,49 it does not appearto have benefitted from its importing activity or been shielded thereby from any injury from the subjectimports. 50 51 ***.52 It also did ***.53 We therefore do not exclude *** from the domestic industry underthe statute’s related party provision.
*** explained that ***.54 *** accounted for *** percent of domestic production in 2008.55 Itsratio of imports to production fell during the period from *** percent in 2006 to just *** percent in firsthalf of 2009 (interim 2009).56 The *** amounts that it imported, the *** in the level of its imports, andthe fact that it has *** the subject imports all suggest that its primary interest lies in domestic production. *** also generally reported *** than the industry as a whole, suggesting that it was not shielded from theeffects of the subject imports.57 We therefore find that it is not appropriate to exclude *** from thedefinition of the domestic industry as a related party.
For the reasons discussed above, we do not exclude either related party and define the domesticindustry to include all domestic producers of MCBs.
V. CUMULATION
A. Legal Framework
For purposes of evaluating the volume and price effects for a determination of material injury byreason of the subject imports, section 771(7)(G)(i) of the Tariff Act requires the Commission to cumulatesubject imports from all countries as to which petitions were filed and/or investigations self-initiated byCommerce on the same day, if such imports compete with each other and the domestic like product in theU.S. market.58 In assessing whether subject imports compete with each other and with the domestic likeproduct, the Commission has generally considered four factors, including the following:
59 Commissioner Lane notes that, with respect to fungibility, her analysis does not require such similarity ofproducts that a perfectly symmetrical fungibility is required, and she notes that this factor would be better describedas an analysis of whether subject imports from each country and the domestic like product could be substituted foreach other. See Separate Views of Commissioner Charlotte R. Lane, Certain Lightweight Thermal Paper fromChina, Germany, and Korea, Invs. Nos. 701-TA-451 and 731-TA-1126 to 1128 (Prelim.), USITC Pub. 3964 (Nov.2007). 60 See Certain Cast-Iron Pipe Fittings from Brazil, the Republic of Korea, and Taiwan, Invs. Nos. 731-TA-278 to280 (Final), USITC Pub. 1845 (May 1986), aff’d, Fundicao Tupy, S.A. v. United States, 678 F. Supp. 898 (Ct. Int’lTrade), aff’d, 859 F.2d 915 (Fed. Cir. 1988). 61 See, e.g., Wieland Werke, AG v. United States, 718 F. Supp. 50 (Ct. Int’l Trade 1989). 62 The Statement of Administrative Action (“SAA”) states that “the new section will not affect currentCommission practice under which the statutory requirement is satisfied if there is a reasonable overlap ofcompetition.” SAA on Uruguay Round Agreements Act (“URAA”), H.R. Rep. 103-316, Vol. I at 848 (1994) (citingFundicao Tupy, S.A. v. United States, 678 F. Supp. 898, 902 (Ct. Int’l Trade 1988)), aff’d, 859 F.2d 915 (Fed. Cir.1988). See also, e.g., Goss Graphic Sys., Inc. v. United States, 33 F. Supp. 2d 1082, 1087 (Ct. Int’l Trade 1998)(“cumulation does not require two products to be highly fungible”); Wieland Werke, AG, 718 F. Supp. at 52(“Completely overlapping markets are not required.”). 63 See 19 U.S.C. § 1677(7)(G)(ii). 64 Pet. Br. at 13-19. 65 RHI Respondents’ Br. at 7-8.
9
(1) the degree of fungibility between the subject imports from different countries andbetween imports and the domestic like product, including consideration of specificcustomer requirements and other quality related questions;59
(2) the presence of sales or offers to sell in the same geographic markets of subjectimports from different countries and the domestic like product;
(3) the existence of common or similar channels of distribution for subject importsfrom different countries and the domestic like product; and
(4) whether the subject imports are simultaneously present in the market.60
Although no single factor is necessarily determinative, and the list of factors is not exclusive, these factorsare intended to provide the Commission with a framework for determining whether the subject importscompete with each other and with the domestic like product.61 Only a “reasonable overlap” ofcompetition is required.62
B. Discussion
In these investigations, the threshold criterion for cumulation is satisfied because the petitionerfiled the antidumping duty petitions with respect to both China and Mexico, as well as the countervailingduty petition with respect to China, on the same day. None of the cumulation exceptions apply.63 Subjectimports from China and Mexico are therefore eligible for cumulation. We consequently examine whetherthere is a reasonable overlap of competition between subject imports from China and Mexico, as well asbetween subject imports and the domestic like product.
Petitioner Resco urges the Commission to cumulate subject imports from China and Mexicobecause there is a reasonable overlap of competition.64 The RHI Respondents question the geographicoverlap of the subject imports, arguing that subject imports from Mexico and China do not compete witheach other because they are sold in different geographic markets.65 They contend that MCBs from
66 RHI Respondents’ Br. at 7-8. 67 CR/PR at Table II-2. 68 CR/PR at Table II-2. See also Tr. 34, 37 (Magrath). 69 RHI Respondents’ Br. at 7. 70 ***. *** Questionnaire response at III-11. The largest importer of MCBs from China, ***, indicated that ***,suggesting that it sells them in the Southeast and Southwest. *** Questionnaire response at III-11. 71 Pricing data indicate that subject imports from Mexico were present in the U.S. market in 9 of 14 quarters forwhich pricing data were collected, while subject imports from China and domestic MCBs were present in all 14quarters for which pricing data were collected. See CR/PR at Tables V-1 and V-2. 72 CR/PR at II-1.
10
Mexico are trucked into the United States and that high transportation costs relative to value limit thegeographic reach of MCBs from Mexico to the Southeast and Southwest regions of the United States.66
Fungibility. The record indicates a reasonable degree of fungibility among the subject importsfrom each country and the domestic like product. Market participants perceive domestic MCBs and thesubject imports to be interchangeable. All responding producers and over two-thirds of importersindicated that subject imports from each country are always or frequently interchangeable withdomestically produced MCBs.67 All responding producers and six of seven responding importersindicated that subject imports from China are always or frequently interchangeable with subject importsfrom Mexico.68
Geographic Overlap. As noted, the RHI Respondents contend that Mexican MCBs are sold toend users in the Southwest and Southeast, while subject imports from China serve the North Centralportion of the United States where steel production is concentrated.69 The information on the record inthis preliminary phase of the investigations indicates that subject imports from Mexico are limited to theSouthwest and Southeast, but subject imports from China are also sold in those regions, suggesting anoverlap of competition.70 We intend to examine this issue more fully in any final phase of theinvestigations.
Simultaneous Presence in Market. The domestic product and subject imports from each countrywere present in each year and most quarters of the period of investigation and in both interim periods.71 Therefore, we conclude that domestically produced MCBs and subject imports from China and Mexicowere simultaneously present in the United States.
Channels of Distribution. Virtually all U.S. shipments of domestically produced merchandiseand subject imports were made directly to end users by domestic producers and importers.72
Conclusion. Questionnaire responses indicate that the domestic like product and subject importsfrom China and Mexico are generally interchangeable, are sold through the same channels of distribution,and have been sold in overlapping geographic markets during the period of investigation. We thus find areasonable overlap of competition between the domestic like product and subject imports from China andMexico and cumulate the subject imports for purposes of assessing material injury.
73 Negligibility under 19 U.S.C. § 1677(24) is not an issue in these investigations, and no party made anyarguments concerning this issue. Based on importer questionnaire responses, subject imports from China accountedfor *** percent and subject imports from Mexico accounted for *** percent of total U.S. imports of MCBs, byquantity, for the period July 2008 to June 2009, the most recent 12-month period preceding the filing of the petitionsfor which questionnaire data are available. CR at IV-7, PR at IV-5. 74 19 U.S.C. §§ 1671b(a), 1673b(a). 75 19 U.S.C. § 1677(7)(B)( i). The Commission “may consider such other economic factors as are relevant to thedetermination” but shall “identify each {such} factor ... {a}nd explain in full its relevance to the determination.” 19 U.S.C. § 1677(7)(B). 76 19 U.S.C. § 1677(7)(A). 77 19 U.S.C. § 1677(7)(C)(iii). 78 19 U.S.C. § 1677(7)(C)(iii). 79 19 U.S.C. §§ 1671b(a), 1673b(a). 80 Angus Chemical Co. v. United States, 140 F.3d 1478, 1484-85 (Fed. Cir. 1998) (“{T}he statute does not‘compel the commissioners’ to employ {a particular methodology}.”), aff’g 944 F. Supp. 943, 951 (Ct. Int’l Trade1996). 81 The Federal Circuit, in addressing the causation standard of the statute, observed that “{a}s long as its effectsare not merely incidental, tangential, or trivial, the foreign product sold at less than fair value meets the causationrequirement.” Nippon Steel Corp. v. USITC, 345 F.3d 1379, 1384 (Fed. Cir. 2003). This was further ratified inMittal Steel Point Lisas Ltd. v. United States, 542 F.3d 867, 873 (Fed. Cir. 2008), where the Federal Circuit, quotingGerald Metals, Inc. v. United States, 132 F.3d 716, 722 (Fed. Cir. 1997), stated that “this court requires evidence inthe record ‘to show that the harm occurred “by reason of” the LTFV imports, not by reason of a minimal ortangential contribution to material harm caused by LTFV goods.’” See also Nippon Steel Corp. v. United States, 458F.3d 1345, 1357 (Fed. Cir. 2006); Taiwan Semiconductor Industry Ass’n v. USITC, 266 F.3d 1339, 1345 (Fed. Cir.2001).
11
VI. REASONABLE INDICATION OF MATERIAL INJURY BY REASON OF SUBJECTIMPORTS 73
A. Legal Standards
In the preliminary phase of antidumping or countervailing duty investigations, the Commissiondetermines whether there is a reasonable indication that an industry in the United States is materiallyinjured or threatened with material injury by reason of the imports under investigation.74 In making thisdetermination, the Commission must consider the volume of subject imports, their effect on prices for thedomestic like product, and their impact on domestic producers of the domestic like product, but only inthe context of U.S. production operations.75 The statute defines “material injury” as “harm which is notinconsequential, immaterial, or unimportant.”76 In assessing whether there is a reasonable indication thatthe domestic industry is materially injured by reason of subject imports, we consider all relevanteconomic factors that bear on the state of the industry in the United States.77 No single factor isdispositive, and all relevant factors are considered “within the context of the business cycle andconditions of competition that are distinctive to the affected industry.”78
Although the statute requires the Commission to determine whether there is a reasonableindication that the domestic industry is “materially injured by reason of” unfairly traded imports,79 it doesnot define the phrase “by reason of,” indicating that this aspect of the injury analysis is left to theCommission’s reasonable exercise of its discretion.80 In identifying a causal link, if any, between subjectimports and material injury to the domestic industry, the Commission examines the facts of record thatrelate to the significance of the volume and price effects of the subject imports and any impact of thoseimports on the condition of the domestic industry. This evaluation under the “by reason of” standardmust ensure that subject imports are more than a minimal or tangential cause of injury and that there is asufficient causal, not merely a temporal, nexus between subject imports and material injury.81

82 Statement of Administrative Action (“SAA”) on Uruguay Round Agreements Act (“URAA”), H.R. Rep. 103-316, Vol. I at 851-52 (1994) (“{T}he Commission must examine other factors to ensure that it is not attributinginjury from other sources to the subject imports.”); S. Rep. 96-249 at 75 (1979) (the Commission “will considerinformation which indicates that harm is caused by factors other than less-than-fair-value imports.”); H.R. Rep. 96-317 at 47 (1979) (“in examining the overall injury being experienced by a domestic industry, the ITC will take intoaccount evidence presented to it which demonstrates that the harm attributed by the petitioner to the subsidized ordumped imports is attributable to such other factors;” those factors include “the volume and prices of nonsubsidizedimports or imports sold at fair value, contraction in demand or changes in patterns of consumption, trade restrictivepractices of and competition between the foreign and domestic producers, developments in technology and theexport performance and productivity of the domestic industry”); accord Mittal Steel, 542 F.3d at 877. 83 SAA at 851-52 (“{T}he Commission need not isolate the injury caused by other factors from injury caused byunfair imports.”); Taiwan Semiconductor Industry Ass’n v. USITC, 266 F.3d 1339, 1345 (Fed. Cir. 2001) (“{T}heCommission need not isolate the injury caused by other factors from injury caused by unfair imports ... . Rather, theCommission must examine other factors to ensure that it is not attributing injury from other sources to the subjectimports.” (emphasis in original)); Asociacion de Productores de Salmon y Trucha de Chile AG v. United States, 180F. Supp. 2d 1360, 1375 (Ct. Int’l Trade 2002) (“{t}he Commission is not required to isolate the effects of subjectimports from other factors contributing to injury” or make “bright-line distinctions” between the effects of subjectimports and other causes.); see also Softwood Lumber from Canada, Inv. Nos. 701-TA-414 and 731-TA-928(Remand), USITC Pub. 3658 at 100-01 (Dec. 2003) (Commission recognized that “{i}f an alleged other factor isfound not to have or threaten to have injurious effects to the domestic industry, i.e., it is not an ‘other causal factor,’then there is nothing to further examine regarding attribution to injury”), citing Gerald Metals, Inc. v. United States,132 F.3d 716, 722 (Fed. Cir. 1997) (the statute “does not suggest that an importer of LTFV goods can escapecountervailing duties by finding some tangential or minor cause unrelated to the LTFV goods that contributed to theharmful effects on domestic market prices.”). 84 S. Rep. 96-249 at 74-75; H.R. Rep. 96-317 at 47. 85 See Nippon Steel Corp., 345 F.3d at 1381 (“an affirmative material-injury determination under the statuterequires no more than a substantial-factor showing. That is, the ‘dumping’ need not be the sole or principal cause ofinjury.”). 86 Mittal Steel, 542 F.3d at 877-78; see also id. at 873 (“While the Commission may not enter an affirmativedetermination unless it finds that a domestic industry is materially injured ‘by reason of’ subject imports, theCommission is not required to follow a single methodology for making that determination ... . {and has} broaddiscretion with respect to its choice of methodology.”) citing United States Steel Group v. United States, 96 F.3d1352, 1362 (Fed. Cir. 1996) and S. Rep. 96-249 at 75. 87 Commissioner Pinkert does not join this paragraph or the following four paragraphs. He points out that theFederal Circuit, in Bratsk, 444 F.3d 1369, and Mittal, held that the Commission is required, in certain circumstances
(continued...)
12
In many investigations, there are other economic factors at work, some or all of which may alsobe having adverse effects on the domestic industry. Such economic factors might include nonsubjectimports; changes in technology, demand, or consumer tastes; competition among domestic producers; ormanagement decisions by domestic producers. The legislative history explains that the Commission mustexamine factors other than subject imports to ensure that it is not attributing injury from other factors tothe subject imports, thereby inflating an otherwise tangential cause of injury into one that satisfies thestatutory material injury threshold.82 In performing its examination, however, the Commission need notisolate the injury caused by other factors from injury caused by unfairly traded imports.83 Nor does the“by reason of” standard require that unfairly traded imports be the “principal” cause of injury orcontemplate that injury from unfairly traded imports be weighed against other factors, such as nonsubjectimports, which may be contributing to overall injury to an industry.84 It is clear that the existence ofinjury caused by other factors does not compel a negative determination.85
Assessment of whether material injury to the domestic industry is “by reason of” subject imports“does not require the Commission to address the causation issue in any particular way” as long as “theinjury to the domestic industry can reasonably be attributed to the subject imports” and the Commission“ensure{s} that it is not attributing injury from other sources to the subject imports.”86 87 Indeed, the
87 (...continued)when considering present material injury, to undertake a particular kind of analysis of nonsubject imports. Mittalexplains as follows:
What Bratsk held is that “where commodity products are at issue and fairly traded, price-competitive, non-subject imports are in the market,” the Commission would not fulfill its obligation to consider an importantaspect of the problem if it failed to consider whether non-subject or non-LTFV imports would havereplaced LTFV subject imports during the period of investigation without a continuing benefit to thedomestic industry. 444 F.3d at 1369. Under those circumstances, Bratsk requires the Commission toconsider whether replacement of the LTFV subject imports might have occurred during the period ofinvestigation, and it requires the Commission to provide an explanation of its conclusion with respect tothat factor.
542 F.3d at 878. 88 Nucor Corp. v. United States, 414 F.3d 1331, 1336, 1341 (Fed. Cir. 2005); see also Mittal Steel, 542 F.3d at879 (“Bratsk did not read into the antidumping statute a Procrustean formula for determining whether a domesticinjury was ‘by reason’ of subject imports.”). 89 Mittal Steel, 542 F.3d at 875-79. 90 Mittal Steel, 542 F.3d at 873 (quoting from Gerald Metals, 132 F.3d at 722), 875-79 & n.2 (recognizing theCommission’s alternative interpretation of Bratsk as a reminder to conduct a non-attribution analysis). 91 Commissioner Lane also refers to her dissenting views in Polyethylene Terephthalate Film, Sheet, and Stripfrom Brazil, China, Thailand, and the United Arab Emirates, Inv. Nos. 731-TA-1131-1134 (Final), USITC Pub.4040 (Oct. 2008), for further discussion of Mittal Steel. 92 To that end, after the Federal Circuit issued its decision in Bratsk, the Commission began to present publishedinformation or send out information requests in final phase investigations to producers in nonsubject countries thataccounted for substantial shares of U.S. imports of subject merchandise (if, in fact, there were large nonsubjectimport suppliers). In order to provide a more complete record for the Commission’s causation analysis, theserequests typically seek information on capacity, production, and shipments of the product under investigation in themajor source countries that export to the United States. The Commission plans to continue utilizing published orrequested information in final phase investigations in which there are substantial levels of nonsubject imports.
13
Federal Circuit has examined and affirmed various Commission methodologies and has disavowed “rigidadherence to a specific formula.”88
The Federal Circuit’s decisions in Gerald Metals, Bratsk, and Mittal Steel all involved caseswhere the relevant “other factor” was the presence in the market of significant volumes of price-competitive nonsubject imports. The Commission interpreted the Federal Circuit’s guidance in Bratsk asrequiring it to apply a particular additional methodology following its finding of material injury in casesinvolving commodity products and a significant market presence of price-competitive nonsubjectimports.89 The additional “replacement/benefit” test looked at whether nonsubject imports might havereplaced subject imports without any benefit to the U.S. industry. The Commission applied that specificadditional test in subsequent cases, including the Carbon and Certain Alloy Steel Wire Rod from Trinidadand Tobago determination that underlies the Mittal Steel litigation.
Mittal Steel clarifies that the Commission’s interpretation of Bratsk was too rigid and makes clearthat the Federal Circuit does not require the Commission to apply an additional test nor any one specificmethodology; instead, the court requires the Commission to have “evidence in the record ‘to show thatthe harm occurred ‘by reason of’ the LTFV imports,’” and requires that the Commission not attributeinjury from nonsubject imports or other factors to subject imports.90 Accordingly, we do not considerourselves required to apply the replacement/benefit test that was included in Commission opinionssubsequent to Bratsk.
The progression of Gerald Metals, Bratsk, and Mittal Steel clarifies that, in cases involvingcommodity products where price-competitive nonsubject imports are a significant factor in the U.S.market, the Court will require the Commission to give full consideration, with adequate explanation, tonon-attribution issues when it performs its causation analysis.91 92

93 Mittal Steel, 542 F.3d at 873; Nippon Steel Corp., 458 F.3d at 1350, citing U.S. Steel Group, 96 F.3d at 1357;S. Rep. 96-249 at 75 (“The determination of the ITC with respect to causation is ... complex and difficult, and is amatter for the judgment of the ITC.”). 94 We provide in the discussion of impact in section VI.E. below an analysis of other factors, such as theeconomic recession, that could have caused any material injury experienced by the domestic industry. 95 CR/PR at IV-1. 96 CR at VII-3, VII-5, PR at VII-2, VII-4. 97 CR at II-6, PR at II-4; Tr. at 31, 34 (Magrath). 98 Tr. at 31, 126, 134 (Magrath, Koenig, Planert). 99 CR at II-6, Figs. II-1 and II-2, PR at II-4, Figs. II-1 and II-2. 100 CR at II-6, PR at II-4. 101 CR/PR at Table C-1. 102 CR/PR at Table IV-4.
14
The question of whether the material injury threshold for subject imports is satisfiednotwithstanding any injury from other factors is factual, subject to review under the substantial evidencestandard. Congress has delegated this factual finding to the Commission because of the agency’sinstitutional expertise in resolving injury issues.93 94
As noted above, the Commission has nearly complete data coverage for the domestic industry. The Commission also received completed questionnaire responses from 16 importers that accounted for80 percent of subject imports from China and all subject imports from Mexico.95 The Commissionreceived foreign producer questionnaires from the only producer of MCBs in Mexico and seven subjectproducers in China that accounted for an estimated *** percent of exports of MCBs from China in 2008.96 For the reasons stated below, we find a reasonable indication that the domestic industry producing MCBsis materially injured by reason of subject imports from China and Mexico.
B. Conditions of Competition and the Business Cycle
The following conditions of competition inform our analysis of whether there is a reasonableindication of material injury by reason of subject imports.
1. Demand Considerations
MCBs are used in the production of steel, and therefore demand for MCBs is closely related tothe level of steel production.97 The parties agree that the overall level of steel production is a goodindicator of demand for MCBs.98 The monthly index of U.S. raw steel production fluctuated modestlybetween January 2006 and August 2008, increasing or decreasing in any month by no more than 13percent relative to January 2006, and increased overall by only 3 percent.99 The index then dropped by 48percent from August 2008 to June 2009.100
Similarly, total apparent U.S. consumption of MCBs increased by *** percent between 2006 and2008, with most of the increase occurring during 2007-2008, then decreased by *** percent betweeninterim 2008 and interim 2009.101 Apparent U.S. consumption decreased slightly from *** short tons in2006 to *** short tons in 2007, before increasing by *** percent to *** short tons in 2008.102

103 Tr. at 27-29 (Copp). 104 CR/PR at Table C-1. 105 CR/PR at II-1. 106 CR/PR at II-1. 107 Tr. at 47, 62-63 (Mazard, Copp). 108 CR/PR at Table IV-4. 109 In 2008, the domestic producers’ production capacity was equal to *** percent of apparent U.S. consumption. See CR/PR at Tables III-2, IV-4. 110 CR/PR at Table IV-4. 111 CR at VII-2, PR at VII-1. 112 CR/PR at Table IV-4. 113 CR at II-8, PR at II-6. 114 CR/PR at Table II-2. 115 Tr. at 50, 72 (Brown).
15
Demand collapsed as a result of a steep worldwide recession in approximately the fourth quarterof 2008.103 As a result, apparent U.S. consumption fell by over *** percent from interim 2008 to interim2009.104
2. Supply Conditions
Both domestic producers and importers make most of their sales directly to end users.105 Twenty-five purchasers are estimated to account for 75 percent of all purchases of MCBs.106 The domesticproducers often sell MCBs as part of a package of refractory products; such package sales account forabout half of domestic producers’ MCB sales.107
The domestic industry was the largest source of supply for the U.S. market during the period ofinvestigation, with the exception of interim 2009 when subject imports surpassed the quantity supplied byU.S. producers. Domestic producers’ U.S. market share was *** percent in 2006, *** percent in 2007,and *** percent in 2008. The industry’s share was *** percent in interim 2008, but only *** percent ininterim 2009.108 U.S. producers’ production capacity was unchanged at 160,903 short tons during theperiod examined and exceeded domestic demand.109
The U.S. market share of cumulated subject imports increased overall from *** percent in 2006to *** percent in 2008 and was *** percent in interim 2009 and *** percent in interim 2008.110 China isreported to have almost *** of global capacity for production of MCBs.111 Nonsubject importsaccounted for less than *** percent of total imports throughout the period examined and were not asignificant factor in the U.S. market.112
3. Product Considerations
There is a high degree of substitutability between the domestic like product and subjectimports.113 All three responding domestic producers reported that the domestic like product and subjectimports from China and Mexico are always or frequently interchangeable. Seven of ten respondingimporters reported that the domestic like product and subject imports from China are always or frequentlyinterchangeable, and six of seven responding importers reported that the domestic like product andsubject imports from Mexico are always or frequently interchangeable.114
Resco indicated that it uses about 150 different formulations for MCBs and that it sells MCBs inabout 3,000 different shapes.115 Nonetheless, about half of the market consists of standardized shapes
116 Tr. at 52 (Brown). 117 Tr. at 67 (Brown). 118 Tr. at 69-70 (Brown). 119 See CR at V-2 to V-3, PR at V-2. 120 Tr. at 55-56 (Brown). 121 CR/PR at V-1. 122 CR/PR at V-1. 123 CR/PR at V-1. ***. Id. 124 CR/PR at V-1. 125 Chairman Shara L. Aranoff, Vice Chairman Daniel R. Pearson, and Commissioner Deanna Tanner Okun donot join the remainder of this opinion. 126 We base our analysis of subject import volume on importers’ questionnaire responses, which were receivedfrom all firms believed to be large importers of MCBs from China and Mexico. As noted, the official statistics arederived from basket categories that include imports other than the subject merchandise. See CR at IV-3, n.6, PR atIV-1 n.6. 127 19 U.S.C. § 1677(7)(C)(i). 128 See CR/PR at Table IV-2. 129 See CR/PR at Table IV-3.
16
and sizes of MCBs.116 Price is often the most important factor in purchasing decisions,117 but testimony atthe staff conference by Resco’s and respondents’ representatives indicated that technical services can beimportant to some purchasers.118 Subject imports and the domestic product may also have different leadtimes for MCBs that are made to order.119
4. Other Conditions
The MCB industry is a mature industry with few recent technological changes, and there have notbeen any significant recent technological changes in steel production, which is the primary downstreamuse for MCBs.120 Magnesia is the primary raw material used in the production of MCBs, and raw materialcosts accounted for approximately 74 percent of U.S. producers’ total cost of goods sold (“COGS”)during 2006-2008.121 Per unit raw material costs fell by 2 percent between 2006 and 2007, but thenincreased by 26 percent between 2007 and 2008 and by 9 percent from interim 2008 to interim 2009.122 *** increased over the period.123 ***.124 125
C. Volume of Subject Imports126
Section 771(7)(C)(i) of the Act provides that the “Commission shall consider whether the volumeof imports of the merchandise, or any increase in that volume, either in absolute terms or relative toproduction or consumption in the United States, is significant.”127
Subject imports were already present in substantial volumes and market share at the beginning ofthe period and were a significant presence in the U.S. market throughout the period. The quantity ofsubject imports in the U.S. market stood at *** short tons in 2006; it decreased by *** percent to ***short tons in 2007, increased by *** percent to *** short tons in 2008, and decreased by *** percent from*** short tons to *** short tons between interim 2008 and interim 2009.128
U.S. shipments of subject imports, however, increased throughout 2006-2008, with the majorityof the increase occurring during 2007-2008, before decreasing from interim 2008 to interim 2009. U.S.shipments of subject imports totaled *** short tons in 2006; they increased by *** percent to *** shorttons in 2007, increased again by *** percent to *** short tons in 2008, and decreased by *** percentfrom *** short tons to *** short tons between interim 2008 and interim 2009.129

130 See CR/PR at Table IV-4. 131 CR/PR at Table IV-5. 132 19 U.S.C. § 1677(7)(C)(ii). 133 See also CR at II-8, PR at II-6. 134 Tr. at 66-67 (Brown) (70 percent of customers reported price to be the most important consideration). 135 CR at V-5, PR at V-2. Product 1 is resin bonded, magnesia-carbon brick for electric arc furnaces with acarbon content of 13 percent, fused grain and antioxidant additions that correspond to Resco’s brand Nuline 10-99,with the following dimensions: 13½ x 6 x 3 No. 1 key. Product 2 is resin bonded, magnesia-carbon brick for ladleswith a carbon content of 10 percent, fused grain and antioxidant additions that correspond to Resco’s brand Maxline10 DFZ with the following dimensions: SU 6 x 60 x 100 mm. Product 3 is resin bonded, magnesia-carbon brick forladles with a carbon content of 10 percent, fused grain and antioxidant additions that correspond to Resco’s brandMaxline 10 AFX, with the following dimensions: 7 x (6-5½) x 3 inch mini key. 136 CR at V-4, PR at V-2 to V-3. Some importers reported that the product categories did not precisely match theproducts that they were selling. Resco and one of the respondents indicated, however, that the products werecompetitive and that it may be difficult to establish pricing categories that are more representative of competitionthan pricing product 2 given the variety of mixes and shapes of MCBs. See CR at V-5, PR at V-2 to V-3. In anyfinal phase investigations, the parties are encouraged in written comments on draft questionnaires to propose anypricing products that they believe will more accurately reflect competition in the MCB market.
17
Because there were virtually no nonsubject imports in the U.S. market, the significant increase insubject import market share came almost entirely at the expense of the domestic industry as subjectimports increasingly displaced domestic shipments from the U.S. market. Subject imports increased theirshare of the U.S. market from*** percent to *** percent during 2006-2008 and to *** percent duringinterim 2009, while U.S. producers’ market share decreased from *** percent to *** percent during2006-2008 and further decreased to *** percent during interim 2009.130
The increasing presence of subject imports in the U.S. market during the period of investigation isalso apparent when considered relative to U.S. production. The ratio of subject imports to domesticproduction was *** percent in 2006; it decreased to *** percent in 2007 before increasing to *** percentin 2008 and *** percent in interim 2009.131
For purposes of the preliminary phase of these investigations, we find that the volume and marketshare of the subject imports were significant during the period of investigation both in absolute terms andrelative to consumption and production in the United States. We also find the increase in subject importshipments and market share over the period examined to be significant.
D. Price Effects of the Subject Imports
Section 771(C)(ii) of the Act provides that, in evaluating the price effects of subject imports, the Commission shall consider whether – (I) there has been significant price undersellingby the imported merchandise as compared with the price of domestic like products of theUnited States, and (II) the effect of imports of such merchandise otherwise depressesprices to a significant degree or prevents price increases, which otherwise would haveoccurred, to a significant degree.132
As addressed in section V.B.3 above, the record indicates that there is a high degree ofsubstitutability between subject imports and the domestic like product.133 Price is an importantconsideration for most purchasers.134
The Commission collected quarterly f.o.b. pricing data for three MCB products.135 Threedomestic producers, 11 importers of MCBs from China, and one importer of MCBs from Mexicoprovided usable pricing data for sales of the requested products, although not all firms reported pricing forall products for all quarters.136 The pricing data accounted for 24.8 percent of U.S. producers’
137 CR at V-5, PR at V-2. 138 CR/PR at Table V-4. 139 CR/PR at Table V-4. Data for products 2 and 3 were combined because ***. The underselling data without*** for products 2 and 3 show underselling and pricing trends that are similar to those with *** combined dataincluded. CR at V-5 n.10, V-10 n.11, PR at V-3 n.10, V-5 n.11. 140 CR at V-5, Fig. V-1, PR at V-3, Fig. V-1. 141 CR/PR at Tables VI-1, C-1. 142 CR/PR at Tables VI-1, C-1. 143 CR/PR at Table VI-1. Unit COGS was $*** in 2006, $*** in 2007, $*** in 2008, $*** in interim 2008, and$*** in interim 2009. Id. Unit net sales value was $*** in 2006, $*** in 2007, $*** in 2008, $*** in interim 2008,and $*** in interim 2009. CR/PR at Table V1-1. 144 CR/PR at Table VI-1. As noted, ***. CR/PR at V-1. 145 CR/PR at Table VI-1. 146 See CR/PR at Table C-1. 147 CR/PR at Table VI-1. 148 CR/PR at V-11, PR at V-6.
18
shipments of MCBs, 17.2 percent of U.S. shipments of subject imports from China, and *** percent ofU.S. shipments of subject imports from Mexico in 2008.137 Subject imports undersold the domestic likeproduct in 39 of 41 quarterly pricing comparisons by an average margin of 12.8 percent.138 Undersellingmargins ranged from 0.8 percent to 32.1 percent.139 Given the consistent underselling by the subjectimports, we find that underselling was significant during the period examined.
Prices for both the domestically produced products and subject imports increased during theperiod. Weighted-average sales prices for the two U.S.-produced MCBs selected by the Commissionincreased by 4.4 percent and 15.2 percent, respectively. The increase in the weighted-average sales pricesfor the same products imported from China and Mexico ranged between 10.9 percent and 28.7 percent.140 In light of this information, we do not find the existence of significant price depression by reason ofsubject imports.
We do find some evidence, however, that subject import competition may have suppresseddomestic like product prices during the period examined. Although domestic producers were able toincrease prices to some extent over the period examined, they were not always able to increase themsufficiently to cover increased COGS. Domestic producers’ unit net sales value increased by $***, or*** percent, from 2006 to 2008, and was $***, or *** percent, higher in interim 2009 than in interim2008.141 The domestic industry’s unit COGS increased by $***, or *** percent, from 2006 to 2008.142 The average unit COGS was $***, or *** percent, higher in interim 2009 than in interim 2008.143 Theseincreases in unit COGS were largely attributable to increased raw material costs.144 Despite the rise in itssales values, the domestic industry’s margins were squeezed.
The domestic industry’s COGS to net sales ratio decreased from *** percent in 2006 to ***percent in 2007, but then increased to *** percent in 2008.145 Notably, the increase in the COGS/net salesratio occurred in 2008, when U.S. shipments of the subject imports increased the most.146 The ratio waslower in interim 2009, at *** percent, than in interim 2008, at *** percent.147 We intend to examinefurther the extent to which subject imports are suppressing price increases in any final phaseinvestigations.
We have also examined the lost sales and lost revenue allegations made by the ***. All threeindicated that they had lost sales to the subject producers, but *** indicated that they had not loweredprices in response to the subject imports.148 The *** lost sales allegations totaled $***, and the *** lost
149 CR at V-11, PR at V-6. 150 CR/PR at Table V-6, CR at V-17, PR at V-7 to V-8. It is notable that, although one purchaser indicated that***. CR at V-16, PR at V-7. 151 CR at V-12, PR at V-6; CR/PR at Tables V-8, V-9. 152 CR/PR at Table V-5. 153 Commerce initiated the antidumping duty investigations based on estimated dumping margins of 112 to 349percent for MCBs from China and estimated margins of 153 percent to 295 percent for MCBs from Mexico. 74 Fed.Reg. 42852, 42856 (Aug. 25, 2009). 154 19 U.S.C. § 1677(7)(C)(iii); see also SAA at 851 and 885 (“In material injury determinations, the Commissionconsiders, in addition to imports, other factors that may be contributing to overall injury. While these factors, insome cases, may account for the injury to the domestic industry, they also may demonstrate that an industry is facingdifficulties from a variety of sources and is vulnerable to dumped or subsidized imports.”) 155 19 U.S.C. § 1677(7)(C)(iii); see also SAA at 851, 885; Live Cattle from Canada and Mexico, Inv. Nos. 701-TA-386, 731-TA-812-813 (Prelim.), USITC Pub. 3155 at 25 n.148 (Feb. 1999). 156 CR/PR at Table III-2. 157 CR/PR at Table III-2. 158 CR/PR at Table III-2. 159 CR/PR at Table III-3. Domestic producers’ inventories fell, both absolutely and relative to production, from2006 to 2008. Inventories were lower in interim 2009 than in interim 2008. CR/PR at Table III-4.
19
revenue allegations totaled $***.149 Although *** lost revenue allegation was confirmed,150 lost salesaccounting for a large share ($*** million) of the alleged lost sales were confirmed.151 We also note that*** purchasers involved in lost sales allegations did not respond to at least some of the Commissionstaff’s attempts to confirm the allegations.152
In light of the above, we find a reasonable indication that the significant volume of subjectimports during the period examined had a significant adverse effect on domestic producers’ prices.
E. Impact of the Subject Imports153
Section 771(7)(C)(iii) of the Act provides that the Commission, in examining the impact of thesubject imports on the domestic industry, “shall evaluate all relevant economic factors which have abearing on the state of the industry.”154 These factors include output, sales, inventories, capacityutilization, market share, employment, wages, productivity, profits, cash flow, return on investment,ability to raise capital, research and development, and factors affecting domestic prices. No single factoris dispositive and all relevant factors are considered “within the context of the business cycle andconditions of competition that are distinctive to the affected industry.”155
Based on the record in the preliminary phase of these investigations, we find that the domesticindustry’s performance was adversely affected by the subject imports over the period examined. Domesticindustry production declined 3.4 percent between 2006 and 2008, from 72,895 short tons in 2006 to70,441 short tons in 2008, and was 57.1 percent lower in interim 2009, at 17,412 short tons, than ininterim 2008, at 40,633 short tons.156 Domestic production capacity remained unchanged during theperiod at 160,903 short tons.157 The industry’s rate of capacity utilization decreased from 45.3 percent in2006 to 43.8 percent in 2008, a decline of 1.5 percentage points; it was 28.9 percentage points lower ininterim 2009, at 21.6 percent, than in interim 2008, at 50.5 percent.158
The domestic industry’s U.S. shipments decreased from 59,180 short tons in 2006 to 58,074 shorttons in 2007, before increasing to 62,470 short tons in 2008, an overall increase of 5.6 percent, but theywere 53.6 percent lower in interim 2009, at 16,284 short tons, than in interim 2008, at 35,111 shorttons.159
Despite the increase in its U.S. shipments, the domestic industry’s share of apparent U.S.consumption decreased from *** percent in 2006 to *** percent in 2007 and *** percent in 2008. The
160 CR/PR at Table IV-4. 161 CR/PR at Table IV-4. 162 CR/PR at Table VI-1. On a quantity basis, the domestic industry’s net sales only increased slightly from ***short tons in 2006 to *** short tons in 2008. Id. 163 CR/PR at Table IV-4. 164 CR/PR at Tables VI-1, C-1. 165 CR/PR at Tables VI-1, C-1. 166 CR/PR at Table III-6. 167 CR/PR at Table III-6. Hours worked increased from 226,000 in 2006 to 227,000 in 2008, and were 78,000 ininterim 2009 compared with 122,000 in interim 2008. Id. Labor productivity in short tons per 1,000 hoursdecreased from 322.5 short tons in 2006 to 310.3 short tons in 2008. Id. It was 33.0 percent lower in interim 2009,at 223.2 short tons, than in interim 2008, at 333.1 short tons. Id. 168 CR/PR at Table VI-4. Research and development expenses decreased from $*** in 2006 to $*** in 2008,and were lower in interim 2009, at $***, than in interim 2008, at $***. CR/PR at Table VI-4. 169 CR/PR at Table VI-5. 170 CR/PR at Table IV-4.
20
2008 level was *** percentage points lower than that of 2006.160 The domestic industry lost furthermarket share in interim 2009, as shipments of subject imports did not decline as much as domesticproducers’ shipments in the face of declining demand. The industry’s market share was *** percent ininterim 2008, but only *** percent in interim 2009.161
The quantity of U.S. producers’ net sales was relatively stable during 2006-08, but decreasedsignificantly between the interim periods. Although the value of U.S. producers’ net sales increasedthroughout the period of investigation, this increase was almost entirely attributable to increased unitvalues, which, as noted above, reflected the rise in raw material costs for MCBs. Although domesticprices were rising, they did not increase sufficiently to offset increased raw material costs.
The industry’s net sales value increased from $*** million in 2006 to $*** million in 2007 and$*** million in 2008, an overall increase of 18.1 percent, but was 50.1 percent lower in interim 2009, at$*** million, than in interim 2008, at $*** million.162
As a result, the domestic industry’s operating income and operating margins fell in 2008 eventhough apparent U.S. consumption of MCBs increased *** percent over 2007.163 The industry’soperating income increased from $*** million in 2006 to $*** million in 2007, but then dropped to $***million in 2008. The industry earned an operating income of $*** in interim 2008, but a $*** operatingloss in interim 2009.164 The industry’s operating income margin increased from *** percent in 2006 to*** percent in 2007, but then fell to *** percent in 2008 despite the increase in apparent U.S.consumption. The operating income margin also fell from *** percent of sales in interim 2008 to ***percent in interim 2009.165
Domestic industry employment declined from 109 workers in 2006 to 102 workers in 2008.166 Itwas 28.7 percent lower in interim 2009, at 78 workers, than in interim 2008, at 110 workers.167
The domestic industry’s capital expenditures declined from $*** in 2006 to $*** in 2007 and$*** in 2008, a level *** percent lower than that in 2006. Capital expenditures were *** percent lowerin interim 2009, at $***, than in interim 2008, at $***.168 The industry’s return on investment increasedfrom *** percent in 2006 to *** percent in 2007, before falling to *** percent in 2008.169
For purposes of these preliminary phase investigations, we find a causal nexus between theincreasing subject imports and the deteriorating condition of the domestic industry. Subject importsincreased their already substantial market share during the period at the expense of domestic producers. Subject imports consistently undersold the domestic like product170 and appear to have played a role in thecost-price squeeze experienced by domestic producers during the period examined. As a result, domesticproducers were unable to increase prices sufficiently to fully cover increasing COGS despite increaseddemand during much of the period. Thus, we conclude that, for purposes of the preliminary
171 RHI Respondents’ Br. at 23-24. 172 The industry experienced a reduced operating income ratio of *** percent and an elevated COGS/net salesratio of *** percent in interim 2008. CR/PR at Table C-1. The recession and the resulting decline in demand,however, began in the second half of 2008. See CR/PR at Table IV-4 (majority of apparent U.S. consumption in2008 occurred in first six months of year). See also CR/PR at Fig. II-2. This information indicates that therecession and declining demand likely were not responsible for the deteriorating financial condition of the domesticindustry in 2008, given that they occurred later in 2008 and would have affected only the second half of the year. 173 We also recognize, and the parties agree, that nonsubject imports were not a significant factor in the U.S.market during the period, inasmuch as they were estimated to account for no more than *** percent of total importsof MCBs over the period examined. 174 Commissioner Pinkert notes that there is some question on the record of these preliminary investigations as towhether MCBs constitute a commodity product and thus whether the first threshold consideration for the analysisrequired by the Federal Circuit in Bratsk and Mittal is satisfied. See Tr. at 51-53 (Brown, Magrath); VesuviusRespondents’ Br. at 6-7; RHI Respondents’ Br. at 13-14. In any event, nonsubject imports never accounted for morethan *** percent of apparent U.S. consumption at any time during the period of investigation. Thus, the secondthreshold consideration for the analysis required by Bratsk and Mittal (whether price-competitive non-subjectimports were a significant factor in the U.S. market) is not satisfied. 175 Chairman Shara L. Aranoff, Vice Chairman Daniel R. Pearson, and Commissioner Deanna Tanner Okundetermine that there is a reasonable indication that an industry in the United States is threatened with material injuryby reason of subject imports from China and that there is no reasonable indication that an industry in the UnitedStates is materially injured or threatened with material injury by reason of subject imports from Mexico. SeeSeparate and Dissenting Views of Chairman Shara L. Aranoff, Vice Chairman Daniel R. Pearson, and CommissionerDeanna Tanner Okun.
21
phase of these investigations, the subject imports are having a significant adverse impact on the domesticindustry.
We have considered whether there are other factors that may have adversely affected thedomestic industry during the period examined. We acknowledge, as respondents argue,171 that the severerecession, beginning in 2008 and continuing into 2009, is likely to have adversely impacted theindustry.172 In any final phase of these investigations, we intend to explore further the role that anychanges in demand played in the performance of the domestic industry in order to ensure that we do notattribute to subject imports the effects of any adverse demand conditions.173 174
For the reasons discussed above, we conclude for purposes of these preliminary phaseinvestigations that there is a causal nexus between the subject imports and the declining performance ofthe domestic industry, which demonstrates a reasonable indication that the domestic industry is materiallyinjured by reason of subject imports.
CONCLUSION
For the foregoing reasons, and based on the record in the preliminary phase of theseinvestigations, we find that there is a reasonable indication that an industry in the United States ismaterially injured175 by reason of imports of MCBs from China that are allegedly sold in the United Statesat less than fair value and allegedly subsidized by the Government of China and by imports of MCBsfrom Mexico that are allegedly sold in the United States at less than fair value.

1 CR at III-1, PR at III-1. 2 CR at VII-3, PR at VII-2. 3 CR at VII-5, PR at VII-4. 4 Commissioner Okun notes that the statute authorizes the Commission to take adverse inferences, but suchauthorization does not relieve the Commission of its obligation to consider the record evidence as a whole in makingits determination. See 19 U.S.C. § 1677e. She generally gives credence to the facts supplied by the participatingparties and certified by them as true, but bases her decision on the evidence as a whole, and does not automaticallyaccept participating parties’ suggested interpretations of the record evidence. Regardless of the level of participationand the interpretations urged by participating parties, the Commission is obligated to consider all evidence relating toeach of the statutory factors and may not draw adverse inferences that render such analysis superfluous. “In general,the Commission makes determinations by weighing all of the available evidence regarding a multiplicity of factorsrelating to the domestic industry as a whole and by drawing reasonable inferences from the evidence it finds mostpersuasive.” SAA at 869.
23
SEPARATE AND DISSENTING VIEWS OF CHAIRMAN SHARA L.ARANOFF, VICE CHAIRMAN DANIEL R. PEARSON, AND COMMISSIONER
DEANNA TANNER OKUN
Based on the record in the preliminary phase of these investigations, we find that there is areasonable indication that an industry in the United States is threatened with material injury by reason ofimports of certain magnesia carbon bricks (MCBs) from China that are allegedly subsidized by thegovernment of China and sold in the United States at less than fair value (LTFV). We further determinethat there is no reasonable indication that an industry in the United States is materially injured orthreatened with material injury by reason of imports of certain magnesia carbon bricks from Mexico thatare allegedly sold in the United States at LTFV.
We join the Commission’s Views with respect to background, domestic like product, domesticindustry, cumulation for purposes of our material injury analysis, legal standards, and conditions ofcompetition. We write separately, however, with respect to our analysis of reasonable indication ofmaterial injury and threat of material injury by reason of the subject imports.
The Commission has essentially complete data coverage for the domestic industry.1 The Commission also received completed questionnaire responses from seven subject producers in China thataccounted for an estimated *** percent of Chinese export shipments to the United States in 20082 andfrom a single subject producer in Mexico that accounted for approximately *** percent of Mexicanexports during the period examined.3 When appropriate, we have relied on the facts otherwise available,including information available from published sources and information submitted in theseinvestigations.4
5 Negligibility under 19 U.S.C. § 1677(24) is not an issue in these investigations. Questionnaire data indicatethat from July 2008 to June 2009, which is the most recent 12-month period preceding the filing of the petition forwhich data were available, subject imports from China accounted for *** percent of total U.S. imports of MCBs,while subject imports from Mexico accounted for *** percent of total U.S. imports of MCBs. The volume of subjectimports is thus well above the statute’s three percent negligibility level. CR at IV-7, PR at IV-5. 6 19 U.S.C. § 1677(7)(C)(i). 7 This volume discussion is based on the shipments of subject imports. CR/PR at Table IV-3. Because theHarmonized Tariff Schedule numbers applicable to MCBs are basket categories, questionnaire data are the best dataavailable for measuring the volume of imports. Questionnaire data may understate import volumes because not allimporters responded. Based on questionnaire responses, the volume of shipments of subject imports was *** shorttons in 2006, *** short tons in 2007, and *** short tons in 2008. CR/PR at Table C-1. Apparent U.S. consumptionwas *** short tons in 2006, *** short tons in 2007, and *** short tons in 2008. Id. 8 The market share of subject imports measured by quantity made small gains each year from *** percent in2006, to *** percent in 2007, and to *** percent in 2008. The domestic industry's market share declined from ***percent in 2006, to *** percent in 2007, and was *** percent in 2008. Nonsubject imports were nearly completelyreplaced in the market as their already small market share declined from *** percent in 2006 to *** percent in 2008. CR/PR at Table C-1. 9 The ratio of cumulated subject imports to U.S. production rose from *** percent in 2006 to *** percent in 2008and was higher in interim 2009 at *** percent compared with interim 2008 at *** percent. CR/PR at Table IV-5. 10 CR at II-6, PR at II-4-II-6, CR/PR at Figures II-1 and II-2. 11 Apparent U.S. consumption was *** short tons in interim 2009 compared with *** short tons in interim 2008. CR/PR at Table C-1. 12 CR/PR at Table C-1.
24
I. NO REASONABLE INDICATION OF MATERIAL INJURY BY REASON OF SUBJECTIMPORTS FROM CHINA AND MEXICO5
A. Volume of Subject Imports
In evaluating the volume of subject imports, section 771(7)(C)(i) of the Tariff Act provides thatthe “Commission shall consider whether the volume of imports of the merchandise, or any increase in thatvolume, either in absolute terms or relative to production or consumption in the United States, issignificant.”6
Subject imports were in the U.S. market in substantial volumes on a cumulated basis throughoutthe period examined, never accounting for less than *** of the market. The cumulated volume of subjectimports, however, was relatively unchanged from 2006 to 2007, and increased from 2007 to 2008, asapparent U.S. consumption rose.7 While the increase in the cumulated volume of subject imports from2007 to 2008 was at a rate higher than the increase in apparent U.S. consumption, subject imports’ smallgains in market share was at the expense of both the domestic industry and nonsubject imports.8 Moreover, the steady increases in the ratio of cumulated subject imports to U.S. production was the resultof decreases in domestic production from 2006 to 2008, as well as the increase in the volume of subjectimports on a cumulated basis from 2007 to 2008.9
The first half of 2009, however, saw a sharp decline in apparent U.S. consumption caused by thefalloff in domestic steel production.10 Apparent U.S. consumption was *** percent lower in interim 2009compared with interim 2008.11 Accordingly, subject imports on a cumulated basis were *** percentlower, or *** short tons in interim 2009 compared with *** short tons in interim 2008.12 We recognizethat the market share of subject imports on a cumulated basis was higher in interim 2009 compared with

13 CR/PR at Table C-1. The market share of subject imports on a cumulated basis was higher in interim 2009, at*** percent compared with *** percent in interim 2008. Id. Domestic producers' market share was *** percent ininterim 2009 compared with *** percent in interim 2008, while nonsubject imports’ market share in those periodswere *** percent and *** percent, respectively. Id. Resco argues that "the abrupt slowdown caused large amountsof Chinese products to be either caught on the water or in the importers' inventories." Transcript, p. 28 (Copp). Respondents counter that "subject imports responded remarkably rapidly, given the long lead times for imports, tothe collapse in demand for MCBs triggered by the recession." Post-conference brief of Vesuvius and Bayuguan, p.10. 14 19 U.S.C. § 1677(7)(C)(ii). 15 From January 2006 through June 2009, over 99 percent of shipments of U.S. product and over 90 percent ofimports from China were made to end users. In addition, *** reported U.S. shipments of imports from Mexico andfrom nonsubject sources were to end users. CR at II-1 and II-8, PR at II-1 and II-6, CR/PR at Table II-1. 16 All three responding producers viewed subject imports from China and from Mexico as either “always” or“frequently” interchangeable with the domestic like product. Seven of 10 importers viewed imports from China and6 of 7 importers viewed imports from Mexico as either “always” or “frequently” interchangeable. CR/PR at TableII-2. 17 CR at II-8 and II-9, PR at II-6-II-7, CR/PR at Table II-3. Nine of 17 responding importers and two of threeresponding producers reported that non-price factors were either “sometimes” or “never” important in their sales.
Resco indicated that price is an important, and many times the only, factor that customers consider whenmaking their purchasing decisions. CR at II-8, PR at II-6-II-7. According to Resco, the market price is not thedeciding factor for less than 30 percent of its customers. CR at II-8, PR at II-6-II-7. Respondents indicated thatwhile price is important to their customers, their customers are more concerned with finding suppliers who bringnew ideas and new abilities through technology and service to lower their costs of producing steel. CR at II-9, PR atII-6-II-7.
25
interim 2008, but place less weight on this interim period shift in market share as the U.S. market was influx.13
For purposes of the preliminary phase of these investigations, we find that the volume of subjectimports on a cumulated basis is significant, both in absolute terms and relative to consumption andproduction in the United States.
B. Price Effects of Subject Imports
In evaluating the price effects of the subject imports, section 771(7)(C)(ii) of the TariffAct provides that the Commission shall consider whether –
(I) there has been significant price underselling by the imported merchandise ascompared with the price of domestic like products of the United States, and
(II) the effect of imports of such merchandise otherwise depresses prices to a significantdegree or prevents price increases, which otherwise would have occurred, to a significantdegree.14
Subject imports and domestic MCBs appear to be highly substitutable and most sales of both thedomestic like product and subject imports are made directly to end users.15 With regard tosubstitutability, a majority of questionnaire respondents considered subject imports to be “always” or atleast “frequently” interchangeable with the domestic product.16 Both petitioner and respondents indicatedthat price is an important factor in purchasing decisions, although respondents also indicated that non-price factors may be equally important in some instances.17
18 The specification of the products were the following: Product 1-- resin bonded, magnesia-carbon brick forelectric arc furnaces with a carbon content of 13 percent, fused grain and antioxidant additions that correspond toResco's brand Nuline 10-99, with the following dimensions: 13 ½ x 6 x 3 No. 1 key; Product 2– Resin bonded,magnesia-carbon brick for ladles with a carbon content of 10 percent, fused grain and antioxidant additions thatcorrespond to Resco's brand Maxline 10 DFZ with the following dimensions: SU 6 x 60 x 100 mm; Product 3--Resin bonded, magnesia-carbon brick for ladles with a carbon content of 10 percent, fused grain and antioxidantadditions that correspond to Resco's brand Maxline 10 AFX, with the following dimensions: 7 x (6-5 ½) x 3 inchmini key. CR at V-3, PR at V-2. 19 In one quarter, ***, imports from China were priced *** percent higher than domestically-produced MCBsand in one quarter, (***), imports from Mexico were priced *** percent higher than domestically-produced MCBs. CR/PR at Table V-1. 20 CR at V-10, PR at V-5, CR/PR at Table V-4. 21 CR at V-10, PR at V-5, CR/PR at Table V-4. 22 Transcript at 81-82, (Fetzer), CR at V-4-V-5, PR at V-II-V-III. 23 Data for Mexico were reported ***. CR at V-5, PR at V-3. Respondents suggest that “available quarterlypricing data for Mexico are so limited, both in terms of the total volumes and in terms of the number of quarters forwhich data are reported, that no meaningful analysis of quarterly prices of subject imports from Mexico is possible.”Post-conference brief of Vesuvius and Bayuquan, p.17, fn.66. In any final phase of these investigations, we willsolicit parties’ comments on the appropriate products for use in quarterly price comparisons, in order to mitigate anyfuture confusion over the pricing items. 24 CR/PR at Table V-5 and V-6. We note, however, that *** purchasers involved in lost sales allegations did notrespond to the Commission staff's attempts to confirm the allegations and *** purchasers involved in the lost salesallegations disagreed with the allegations. Id. 25 CR at V-14, PR at V-7. 26 CR at V-14-V-17, PR at V-6-V-8.
26
The Commission collected quarterly pricing data for three products: one specification of MCBfor electric arc furnaces and two MCB sizes for use in ladles.18 The subject imports were priced lowerthan domestic MCBs in all but two quarters for all products.19 Subject imports from China undersold thedomestic like product in 27 of 28 quarterly pricing comparisons by margins ranging from 0.8 to 21.0percent.20 Subject imports from Mexico undersold the domestic like product in 12 of 13 quarterly pricingcomparisons by margins ranging from 4.7 to 32.1 percent.21 Given the consistency of the undersellingmargins and the substitutability of domestic and imported products, we find significant price undersellingby the subject imports from China and Mexico compared with the price of the domestic like product.
We give limited weight, however, to these price comparisons because of the numerous reports ofconfusion among questionnaire respondents over how to report pricing data. First, *** was unable toprovide separate data for pricing products 2 and 3, and second, multiple questionnaire respondentsreported difficulty in identifying which of their own available products corresponded most closely withthe pricing products.22 In addition, due to the limited presence of subject imports from Mexico in the U.S.market, very little data were available for pricing of subject imports from Mexico.23
The lost sales and lost revenue data provide some support for the proposition that certainpurchasers are switching from domestic to subject sources based on price, but other purchasers claim tobe focused on non-price factors. With regard to lost sales and revenue, of the 15 lost sales allegationstotaling $4.7 million and four lost revenue allegations totaling $419,547, *** lost sales allegations wereconfirmed totaling *** and *** lost revenue allegations *** confirmed.24 One purchaser that respondedto the lost sales allegations reported that it shifted MCB purchases from U.S. producers to subject importsfrom China in ***25 Four purchasers identified non-price factors as the reason for their shift away fromdomestically-produced MCBs.26

27 CR at V-5, PR at V-3, CR/PR at Table V-3. 28 CR/PR at Figure V-1. 29 CR/PR at Tables V-1 and V-2. 30 CR at VI-4, PR at VI-2. Unit COGS was $*** in 2006, $*** in 2007, $*** in 2008, and $*** in interim 2009compared with $*** in interim 2008. CR/PR at Tables VI-1 and C-1. 31 CR/PR at Tables VI-1 and C-1. The unit value of net sales was $*** in 2006, $*** in 2007, $*** in 2008,and $*** in interim 2008 and $*** in interim 2009. 32 CR/PR at Tables VI-1 and C-1. The COGS-to-net-sales ratio was *** percent in 2006, *** percent in 2007,and *** percent in 2008. 33 CR/PR at Tables VI-1 and C-1. 34 Commerce initiated an antidumping duty investigation based on estimated dumping margins of 112 to 349percent for MCBs from China and of 153 to 295 percent for MCBs from Mexico. Commerce initiated acountervailing duty investigation on MCBs from China based on allegations of various loan subsidy programs, theprovision of inputs for less than adequate remuneration, export restraints on raw materials, tax benefit programs,Northeast revitalization program and related provincial policies, direct grants as well as grants for expansion andexport performance, preferential loans to the MCB industry, cash grant programs, and a provincial program to rebateantidumping costs. CR at I-4-I-5, PR at I-3-I-4.
27
We have also examined pricing trends. Prices for both the domestically produced product andsubject imports increased during the period examined. Depending on the product in question,weighted-average sales prices for U.S.-produced MCBs increased by 4.4 percent to 15.2 percent whileweighted-average sales prices for products imported from China and Mexico increased by 10.9 percent to28.7 percent.27 Prices for all pricing products (product 1 and products 2 and 3 combined), followedsimilar trends.28 Prices for the domestically produced products peaked in the last quarter of 2008 and thefirst quarter of 2009. While prices in the second quarter of 2009 were lower than prices during 2008 theywere higher than prices during 2006 and 2007.29 Because prices for the domestic like product generallyincreased during the period examined, we conclude that subject imports did not have significantprice-depressing effects.
There also is little indication that subject imports suppressed domestic producer prices during theperiod examined, as changes in prices the domestic industry charged largely, but not entirely, trackedchanges in the industry's costs. On a per unit basis, the domestic industry's cost of goods sold (COGS)increased from $*** in 2006 to $*** in 2008, or by *** percent, primarily as a result of changes in rawmaterial costs.30 While the industry increased the unit value of its net sales, the increases were not quitesufficient to offset rising costs.31 Nevertheless, for the three year period between 2006 and 2008, theindustry’s COGS/net sales ratio fluctuated between years and increased by less than one percentage point,which does not indicate that prices were suppressed to a significant degree.32 We, furthermore, note thatthe industry’s COGS/sales ratio was lower in interim 2009, at *** percent, than in interim 2008, at ***percent.33
Based on the foregoing, we find for purposes of the preliminary phase of these investigations thatthe significant cumulated volume of subject imports consistently undersold the domestic like product, buthas not yet had a significant adverse effect on domestic prices.
C. Impact of Subject Imports on the Domestic Industry34
In examining the impact of subject imports, section 771(7)(C)(iii) of the Tariff Act provides thatthe Commission “shall evaluate all relevant economic factors which have a bearing on the state of the
35 19 U.S.C. § 1677(7)(C)(iii); see also SAA at 851 and 885 (“In material injury determinations, the Commissionconsiders, in addition to imports, other factors that may be contributing to overall injury. While these factors, insome cases, may account for the injury to the domestic industry, they also may demonstrate that an industry is facingdifficulties from a variety of sources and is vulnerable to dumped or subsidized imports.”). 36 19 U.S.C. § 1677(7)(C)(iii); see also SAA at 851, 885; Live Cattle from Canada and Mexico, Inv. Nos. 701-TA-386, 731-TA-812-813 (Preliminary), USITC Publication 3155 at 25 n.148 (Feb. 1999). 37 CR/PR at Table III-2. Domestic production of MCBs decreased from 72,895 short tons in 2006 to 71,125short tons in 2007 and to 70,441 short tons in 2008. Production was 17,412 short tons in interim 2009 comparedwith 40,633 short tons in interim 2008. Id. 38 CR/PR at Table III-2. Capacity utilization was 45.3 percent in 2006, 44.2 percent in 2007, 43.8 percent in2008, 50.5 percent in interim 2008 and 21.6 percent in interim 2009. 39 CR/PR at Table C-1. 40 U.S. shipments were 59,181 short tons in 2006, 58,074 short tons in 2007, and 62,470 short tons in 2008. U.S.shipments were 16,284 short tons in interim 2009 compared with 35,111 short tons in interim 2008. CR/PR at TableIII-3. 41 CR/PR at Table III-4. The ratio of inventories to total shipments was *** percent in 2006, *** percent in2007, and *** percent in 2008. The ratio was *** percent in interim 2008 compared with *** percent in interim2009. 42 CR/PR at Tables VI-1 and C-1. The domestic industry's quantity of net sales was *** short tons in 2006, ***short tons in 2007, and *** short tons in 2008. The total value of the industry's net sales was $*** in 2006, $*** in2007, and $*** in 2008. In interim 2008, total net sales were *** short tons (***), compared with *** short tons(***) in interim 2009. 43 Operating income was $*** million in 2006, $*** million in 2007, and $*** million in 2008. The domesticindustry experienced a $*** operating loss in interim 2009 compared with operating income of $*** in interim2008. CR/PR at Tables VI-1 and C-1. 44 CR/PR at Tables VI-1 and C-1.
28
industry.”35 These factors include output, sales, inventories, ability to raise capital, research anddevelopment, and factors affecting domestic prices. No single factor is dispositive and all relevant factorsare considered “within the context of the business cycle and conditions of competition that are distinctiveto the affected industry.”36
Based on the record of these preliminary phase investigations, we find that the domesticindustry’s performance was mixed over the period examined, with positive changes in most factorsrelating to U.S. shipments and financial indicators, and negative changes relating to production, capacityutilization, and employment. From 2006 to 2008, while the U.S. producers’ capacity to produce MCBsremained constant, domestic production of MCBs decreased by 3.4 percent,37 and the already lowcapacity utilization declined steadily from 45.3 percent in 2006 to 43.8 percent in 2008.38 The number ofproduction and related workers declined by 7.2 percent and productivity declined by 3.8 percent from2006 to 2008.39 Despite the declines in production, however, domestic producers were able to increasetheir U.S. shipments by 5.6 percent40 and to decrease their inventories as a ratio to shipments from 2006to 2008, as apparent U.S. consumption increased.41
The domestic industry’s financial indicators – specifically, net sales measured by value andoperating income – increased overall from 2006 to 2008.42 The domestic industry was profitable in eachfull year of the period, with operating income fluctuating between years and increasing from $*** in 2006to $*** in 2008.43 Operating income as a share of net sales remained positive from 2006 to 2008,increasing from *** percent in 2006 to *** percent in 2007, and returning in 2008 to *** percent.44 Thedomestic industry as a whole did not become unprofitable until the first half of 2009 when demand from
45 Operating losses as a share of net sales was *** percent in interim 2009 compared with operating income as ashare of net sales of *** percent in interim 2008. CR/PR at Table C-1. 46 CR/PR at Tables VI-1 and VI-2. 47 CR/PR at Table C-1. 48 19 U.S.C. 1677(7)(H) (emphasis added).
29
its customers in the steel industry collapsed.45 Even with the unprecedented drop in demand, ***.46 Forthese reasons, we find that the domestic industry has not yet experienced material injury by reason ofsubject imports on a cumulated basis.
Moreover, we do not find a sufficient causal link between subject imports on a cumulated basisand the current condition of the domestic industry. As discussed above, cumulated subject imports madeonly small gains in U.S. market share, particularly as apparent U.S. consumption and U.S. shipmentsincreased from 2007 to 2008. Despite consistent underselling, the prices of subject imports did notappear to suppress domestic prices for MCBs.47 The domestic industry was able to raise prices to covermost of its increased costs, even as subject imports increased from 2007 to 2008. In fact, it was not untildomestic demand collapsed that the domestic industry became ***. Indeed, the significant decline inapparent U.S. consumption that began in the fourth quarter of 2008 and continued in the first half of 2009likely had a role in the domestic industry's negative financial performance at the end of the periodexamined.
For the foregoing reasons, and based on the record in the preliminary phase of theseinvestigations, we find that there is no reasonable indication that an industry in the United States ismaterially injured by reason of cumulated subject imports of MCBs from China and Mexico that areallegedly sold in the United States at less than fair value and are allegedly subsidized by the Governmentof China.
II. REASONABLE INDICATION OF THREAT OF MATERIAL INJURY
A. Cumulation
For a determination of threat of material injury by reason of subject imports, section 771(7)(H) ofthe Tariff Act of 1930 provides that to the extent practicable, the Commission may cumulatively assessthe volume and price effects of imports of the subject merchandise from all countries with respect towhich –
(i) petitions were filed under section 1671a(b) or 1673a(b) of this title on the sameday.
(ii) investigations were initiated under section 1671a(a) or 1673a(a) of this title onthe same day, or
(iii) petitions were filed under section 1671a(b) or 1673a(b) of this title andinvestigations were initiated under section 1671a(a) or 1673a(a) of this title onthe same day,
if such imports compete with each other and with domestic like products in the United States market.48
Cumulation for determining threat of material injury, in contrast to cumulation for materialinjury, is within the discretion of the Commission. In exercising that discretion, the Commission hastraditionally considered factors such as (1) whether the imports are increasing at similar rates in the samemarkets, (2) whether the imports have similar margins of underselling, and (3) the probability that importswill enter the United States at prices that would have a depressing or suppressing effect on

49 See Torrington Co. v. United States, 790 F. Supp. 1161, 1172 (Ct. Int’l Trade 1992) (affirming Commission’sdetermination not to cumulate for purposes of threat analysis when pricing and volume trends among subjectcountries were not uniform and import penetration was extremely low for most of the subject countries), aff’dwithout opinion, 991 F.2d 809 (Fed. Cir. 1993); Metallverken Nederland B.V. v. United States, 728 F. Supp. 730,741-42 (Ct. Int’l Trade 1989); Asociacion Colombiana de Exportadores de Flores v. United States, 704 F. Supp.1068, 1072 (Ct. Int’l Trade 1988). 50 CR/PR at Table IV-3. Shipments of subject imports from China increased from 32,976 short tons in 2006 to36,184 short tons in 2007, or by 9.7 percent, but then increased more markedly to 42,072 short tons in 2008, or by16.3 percent. 51 CR/PR at Table IV-3. Subject imports from Mexico declined sharply from *** short tons in 2006 to *** shorttons in 2007, or by *** percent, and then declined an additional *** percent in 2008 to *** short tons. 52 Reported Chinese capacity increased from 327,363 short tons in 2006 to 369,463 short tons in 2007, and thenmore sharply to 520,272 short tons in 2008. The capacity of the Mexican producer remained constant over thatperiod at *** short tons. CR/PR at Tables VII-1 and VII-2. 53 The different pricing strategies of the subject imports also indicates the different incentives the subject sourceshave in selling to the U.S. market. Examination of unit value data on imports suggests that during the periodexamined, subject imports from China occupied one price point, the U.S. industry a much higher one, and subjectimports from Mexico a price point somewhere in between. For example, in 2008 the unit value of U.S. shipmentswas $1,226 per short ton, that of shipments of imports from China was $901 per ton, and that of shipments ofimports from Mexico was $*** per ton. This relationship among the three sources remained the same throughout theperiod examined. CR/PR at Table C-1. 54 19 U.S.C. § 1677(7)(F)(ii).
30
domestic prices of that merchandise.49 In these investigations, examination of these factors lead us toconclude that we should not exercise our discretion to cumulate subject imports from China with subjectimports from Mexico.
In particular, subject imports from China and Mexico are not increasing at similar rates in theU.S. market. Shipments of subject imports from China increased steadily and substantially from 2006 to2008.50 Shipments of subject imports from Mexico, on the other hand, fell rapidly, by more than half,over the period examined, particularly between 2006 and 2007.51 Moreover, the Chinese industryexpanded rapidly between 2006 and 2008, whereas the size of the Mexican industry remained static overthat period,52 indicating that the Chinese industry would have a greater incentive to ship to the UnitedStates in the imminent future than would the Mexican industry.53 These differing trends in imports,industry size, and incentive to ship to the U.S. market indicate that, in the absence of antidumping andcountervailing duty orders in these investigations, imports from subject sources would likely competedifferently in the U.S. market.
Accordingly, in determining whether there is a reasonable indication that an industry in theUnited States is threatened with material injury by reason of subject imports, we do not exercise ourdiscretion to cumulate subject imports from China with subject imports from Mexico, and conductseparate threat of material injury analyses regarding each of these subject countries.
B. Reasonable Indication of Threat of Material Injury by Reason of Subject Importsfrom China
Section 771(7)(F) of the Tariff Act directs the Commission to determine whether the U.S.industry is threatened with material injury by reason of the subject imports by analyzing whether “furtherdumped or subsidized imports are imminent and whether material injury by reason of imports wouldoccur unless an order is issued or a suspension agreement is accepted.”54 The Commission may not makesuch a determination “on the basis of mere conjecture or supposition,” and considers the threat factors

55 Id. 56 These factors are as follows:
(I) if a countervailable subsidy is involved, such information as may be presented to it by the administeringauthority as to the nature of the subsidy (particularly as to whether the countervailable subsidy is a subsidydescribed in Article 3 or 6.1 of the Subsidies Agreement) and whether imports of the subject merchandiseare likely to increase,(II) any existing unused production capacity or imminent, substantial increase in production capacity in theexporting country indicating the likelihood of substantially increased imports of the subject merchandiseinto the United States, taking into account the availability of other export markets to absorb any additionalexports,(III) a significant rate of increase of the volume or market penetration of imports of the subject merchandiseindicating the likelihood of substantially increased imports,(IV) whether imports of the subject merchandise are entering at prices that are likely to have a significantdepressing or suppressing effect on domestic prices and are likely to increase demand for further imports,(V) inventories of the subject merchandise,(VI) the potential for product-shifting if production facilities in the foreign country, which can be used toproduce the subject merchandise, are currently being used to produce other products;(VIII) the actual and potential negative effects on the existing development and production efforts of thedomestic industry, including efforts to develop a derivative or more advanced version of the domestic likeproduct, and , . .(IX) any other demonstrable adverse trends that indicate the probability that there is likely to be materialinjury by reason of imports (or sale for importation) of the subject merchandise (whether or not it is actuallybeing imported at the time).
19 U.S.C. § 1677(7)(F)(i). This investigation does not involve an agricultural product, so statutory threat factor(VII) is not implicated. As no one has argued that the domestic industry is currently engaging or will imminentlyengage in any efforts to develop a derivative or more advanced version of the domestic like product, statutory threatfactor (VIII) is not implicated. 57 CR/PR at Table IV-2. During the first six months of 2009, subject imports were *** short tons compared with*** short tons during the same period in 2008. Id. 58 The market share of subject imports from China increased from *** percent in 2006 to *** percent in 2008. During that same period, the market share of domestic producers declined from *** percent to *** percent, themarket share of subject imports from Mexico declined from *** percent to *** percent, and the market share ofnonsubject imports fell from *** percent to *** percent. CR/PR at Table C-1. 59 CR at VII-3, PR at VII-2.
31
“as a whole” in making its determination whether dumped or subsidized imports are imminent andwhether material injury by reason of subject imports would occur unless an order is issued.55 In makingour determinations, we consider all statutory threat factors that are relevant to these investigations.56
The volume of subject imports from China was substantial and increased overall from 40,441short tons in 2006 to 44,891 short tons in 2008.57 By 2008, subject imports from China had capturedsubstantial market share from the domestic industry, subject imports from Mexico and nonsubject importsas the market shares of those sources declined.58 Thus, the domestic industry’s overall loss of marketshare to subject imports was due entirely to the rapid increase in subject imports, and subject imports’overall presence in the market increased by 5.8 percentage points.
With regard to production capacity for MCBs in China, as an initial matter we note that theinformation the Commission has on the Chinese industry, while not comprehensive, is fairly extensive fora preliminary phase investigation. Petitioner Resco identified 35 MCB producers in China.59 Seven ofthese firms responded to the Commission questionnaire, and these responses are estimated to account

60 CR at VII-3, PR at VII-2. 61 Reported capacity in China increased from 327,363 short tons in 2006 to 369,463 short tons in 2007, andincreased more sharply, to 520,272 short tons, in 2008. Reported capacity is expected to decline slightly to 503,332short tons in 2009, and increase slightly to 513,012 short tons in 2010. CR/PR at Table VII-1. 62 CR/PR at Table VII-1. 63 CR/PR at Table C-1. Apparent U.S. consumption in 2008 was *** short tons. 64 The share of exports in total shipments by reporting Chinese producers first declined very slightly from 70.7percent in 2006 to 70.5 percent in 2007, and then increased to 76.0 percent in 2008. CR/PR at Table VII-1. 65 CR at VII-9, PR at VII-7. 66 U.S. importers’ end-of-period inventories increased from 24,279 short tons in 2006 to 25,373 short tons in2007, and then increased again to 27,527 short tons in 2008. The 2008 total was 65.4 percent of preceding-periodU.S. shipments and was *** percent of apparent U.S. consumption. CR/PR at Tables VII-3 and C-1. 67 CR at II-8 and II-9, PR at II-6-II-7, CR/PR at Table II-3. Nine of 17 responding importers and two of threeresponding producers reported that non-price factors were either “sometimes” or “never” important in their sales.
Resco indicated that price is an important, and many times the only, factor that customers consider whenmaking their purchasing decisions. CR at II-8, PR at II-6-II-7. According to Resco, the market price is not thedeciding factor for less than 30 percent of its customers. CR at II-8, PR at II-6-II-7. Respondents indicated thatwhile price is important to their customers, their customers are more concerned with finding suppliers who bringnew ideas and new abilities through technology and service to lower their costs of producing steel. CR at II-9, PR atII-6-II-7.
32
for approximately *** of Chinese exports to the United States in 2008.60 Based on data from these firms,reported Chinese production capacity rose markedly during the period examined, increasing over ***percent between 2007 and 2008, and is not expected to shrink appreciably in 2009 and 2010.61 Thesefirms, moreover, reported ample excess capacity; in 2008, they operated at a capacity utilization rate ofonly 62.9 percent, or approximately 193,000 short tons.62 Assuming that other non-responding Chinesefirms have similar amounts of excess capacity, and taking the responding firms’ estimate of their share intotal production at face value, as of the end of 2008 there was approximately 288,000 short tons of excesscapacity in China, which is nearly *** apparent U.S. consumption in that year, a level we find to besignificant.63
Moreover, to the extent the excess capacity would be utilized, much of the new production willbe devoted to export markets as reporting Chinese producers became increasingly export-oriented duringthe period examined.64 Although the U.S. market accounted for a relatively small share of total exportshipments by the Chinese industry, we note that since 2007, the Chinese industry has been subject toantidumping orders in the European Union and in Turkey.65 Thus, going forward, the U.S. market will bemore attractive to the Chinese industry than alternative export markets. In addition, with regard toinventories held in the United States by U.S. importers, such inventories increased from 2006 to 2008,and by the end of the period were significant in relation to preceding-period shipments and apparent U.S.consumption.66 We find that the rising trend in the volume of imports from China during the periodexamined, substantial excess capacity in the Chinese industry, the industry’s consistent focus on exportmarkets, the high level of inventories held in the United States, and the presence of significant barriers toChinese exports in third country markets indicate the likelihood of substantially increased subject importsin the absence of import relief.
With regard to likely price effects, we evaluate the likely underselling and price effects in light ofkey conditions of competition in the U.S. market. First, although information at this preliminary stage ofthe investigations is limited, the record suggests that price is an important factor in purchasing decisions,although non-price factors may be equally important in some instances.67 This suggests that subjectimports from China are likely highly substitutable with the domestic like product. Second, as measured
68 Apparent U.S. consumption first decreased slightly from *** short tons in 2006 to *** short tons in 2007, andthen rose to *** short tons in 2008. Apparent U.S. consumption was *** short tons in January-June 2009 comparedwith *** short tons in January-June 2008. CR/PR at Table C-1. 69 Apparent U.S. consumption first decreased slightly from *** short tons in 2006 to *** short tons in 2007, andthen rose to *** short tons in 2008. Apparent U.S. consumption was *** short tons in January-June 2009 comparedwith *** short tons in January-June 2008. CR/PR at Table C-1. 70 CR at II-5-II-6, PR at II-4. 71 CR/PR at Table VII-3. Inventories of imports from China held by U.S. importers increased from 24,279 shorttons in 2006 to 27,527 short tons in 2008. Such imports declined as a ratio to preceding-period U.S. shipments ofimports from 73.6 percent in 2006 to 65.4 percent in 2008. That ratio, however, was 73.4 percent in January-June2009 compared with 46.1 percent in January-June 2008.
33
by apparent U.S. consumption, demand for MCBs decreased, but only slightly, from 2006 to 2007, beforerising, by *** percent, from 2007 to 2008. Consumption was substantially lower in interim 2009 than ininterim 2008, however, and full-year 2009 consumption is likely to be substantially lower than 2008levels.68
We have found that subject imports from China undersold domestic MCBs to a significant degree and that, notwithstanding this underselling, prices for the domestic like product were not depressed duringthe period examined. As explained above, however, the record does not contain sufficient evidence ofprice suppression, and therefore we do not conclude that subject imports had a significant adverse effecton domestic prices during the period examined. We have found that, among other factors, the substantialexcess capacity in the Chinese industry and its consistent focus on export markets during the periodexamined indicate the likelihood of increased subject imports in the absence of import relief. Eventhough demand is currently weak, we find that it is likely that, given the fact that Chinese MCBs areconsistently priced below the domestic like product, and given the importance of price in purchasingdecisions, those purchasers that are in the market for MCBs would likely purchase the Chinese product. This purchasing pattern would likely result in either price depression or suppression. Consequently, inlight of consistent underselling, we determine that imports of the subject merchandise are entering atprices that are likely imminently to have a significant depressing or suppressing effect on domestic pricesin a market where U.S. demand was lower at the end of the period than at the beginning, and that suchprices are likely to increase demand for further imports.
Finally, and most important, although we believe the domestic industry has not yet experiencedmaterial injury by reason of subject imports, the market conditions that allowed the domestic industry toavoid such injury have deteriorated. While steady to slightly increasing demand from 2006 to 2008cushioned the impact of subject imports, demand was substantially lower in interim 2009 compared to thecorresponding period of 2008.69 Indeed, the domestic industry faces a much different environment in2009 and 2010 than it did at the beginning of the period examined. Demand for MCBs has recently fallendramatically due to the severe slump in the steel industry.70 Further evidence of the industry’svulnerability is found in the fact that inventories of Chinese product held in the United States increasedsteadily over the period examined, peaking in 2008, and were significant in relation to preceding-periodU.S. shipments throughout the period, particularly so in interim 2009.71 Accordingly, based on ourconsideration of the record and the recent developments in the marketplace in particular, we find that thedomestic industry is vulnerable to material injury from likely substantially increased volumes of subjectimports.
Because of worsening demand conditions, the domestic industry is no longer shielded from theimpact of subject imports, which are likely to increase significantly in volume and continue to undersellsignificantly the domestic like product in the absence of import relief. The domestic industry would

72 Demand for MCBs, as measured by apparent U.S. consumption, was *** short tons in January-June 2009,compared with *** short tons in January-June 2008. Industry profitability, as measured by the ratio of operatingincome to net sales, was *** percent in January-June 2009, compared with *** percent in January-June 2008. CR/PR at Table C-1. 73 U.S. shipments of imports from nonsubject sources declined from *** short tons in 2006 to *** short tons in2007, and then declined again, to *** short tons, in 2008. Their market share declined from *** percent in 2006 to*** percent in 2007, and then even further to *** percent in 2008, for an overall decline of *** percentage points. CR/PR at Table C-1.
34
likely experience significantly reduced profitability due to significantly depressed or suppressed prices aswell as reduced production, shipments, market share, and employment
We also find that subject imports will have negative effects on the development and productionefforts of the domestic industry. From 2006 to 2008, steady to slowly rising demand mitigated the impactof subject imports, and allowed the domestic industry to maintain its profitability even as it lost marketshare. This trend did not continue in the interim 2009 period, however, as demand dropped, the marketshare of imports from China continued to increase, and the domestic industry experienced decliningfinancial performance, moving into a ***. As subject imports are likely to continue to increase in theimminent future in the absence of import relief, the domestic industry will lose not only market share, butsales volumes as well. Given the clear link between production volumes and profitability, if volumes fallfurther the domestic industry will experience further declines in operating income, and will likelyexperience declines in employment, returns on assets, and in its ability to maintain and upgradeproduction facilities.
In considering whether the domestic industry is threatened with material injury by reason ofsubject imports, we have also considered the extent to which other factors are likely to contribute toinjury to ensure that we do not attribute injury from other factors to subject imports. As discussed above,we find that reduced demand for MCBs is likely to render the industry more vulnerable to the effects ofimports. With regard to the current demand environment, we note that Chinese import market shareincreased in interim 2009, indicating that imports from China, given their lower prices, were takingmarket share from domestic product in an environment of rapidly weakening demand.72 In any finalphase of these investigations, we intend to explore further the role that any changes in demand would playin the performance of the domestic industry in order to ensure that we do not attribute to subject importsthe effects of any future adverse demand conditions. Further, nonsubject imports are not a significantfactor in the MCB market, inasmuch as during the period examined they never exceeded *** percent ofthe U.S. market and their volumes declined in both absolute volume and market share.73 Thus, there isno indication that, in the imminent future, nonsubject imports would capture market share from thedomestic industry to the same extent as subject imports.
Consequently, we conclude for purposes of the preliminary phase of these investigations thatthere is a causal nexus between the subject imports and a likely imminent adverse impact on the domesticindustry, which demonstrates a reasonable indication that the domestic industry is threatened withmaterial injury by reason of subject imports.
C. No Reasonable Indication of Threat of Material Injury by Reason of SubjectImports from Mexico
Based on an evaluation of the statutory threat factors that are relevant to this investigation, wedetermine that there is no reasonable indication that the domestic industry producing MCBs is threatenedwith material injury by reason of subject imports from Mexico.

74 CR/PR at Tables IV-2, IV-4, IV-5. 75 CR/PR at Table IV-2. The volume of subject imports from Mexico was slightly higher in interim 2009 than ininterim 2008, but was still at a level far below that at the start of the period examined. Id. 76 Market penetration of subject imports from Mexico decreased from *** percent in 2006 to *** percent in2007 and then dropped further to *** percent in 2008. CR/PR at Table IV-8. 77 CR/PR at Table VII-2. Reported production capacity in Mexico remained at *** through the periodexamined. 78 CR/PR at Table VII-2. 79 CR/PR at Table VII-2. The share of exports in Refmex’ total shipments declined from *** percent in 2006 to*** percent in 2008. 80 With regard to Refmex’ projections of shipments to the United States in calendar years 2009 and 2010, wenote that the projected shipment levels are within the range of those with regard to which we found no reasonableindication of injury during the period examined. CR/PR at table VII-2. 81 CR/PR at Table VII-3. U.S. importers’ end-of-period inventories of imports from Mexico increased from ***short tons in 2006 to *** short tons in 2008. As a ratio to preceding-period shipments, these inventories increasedfrom *** percent in 2006 to *** percent in 2008. These inventories totaled *** short tons in interim 2009 comparedwith *** short tons in interim 2008.
35
In the absence of an antidumping duty order, we find that substantially increased imports of thesubject merchandise from Mexico into the United States are not imminent for a number of reasons. First,subject imports from Mexico did not increase at a significant rate on either an absolute or relative basisduring the period examined.74 In fact, the volume of subject imports from Mexico declined *** from2006 to 2007, before it recovered *** in 2008. Such imports decreased from *** short tons in 2006 to*** short tons in 2007 and then rose to *** short tons in 2008.75 Consequently, as apparent U.S.consumption increased from 2006 to 2008, the market penetration of the subject imports from Mexicofell, indicating that the Mexican producer was gradually withdrawing from what was, at the time, agrowing market, preferring to concentrate, as discussed below, on its home market.76
Second, reported capacity in Mexico from the lone Mexican producer RHI-Refmex S.A. de C.V.(Refmex), was stable from 2006 to 2008 and is projected to remain stable through 2010.77 Moreover, theindustry in Mexico producing subject merchandise is small and does not have substantial unused capacity. As of the end of 2008, Refmex reported unused capacity of only *** and projects excess capacity in 2009and 2010 of no more than approximately *** short tons.78 Consequently, the projected unused capacityof the reporting producer in Mexico does not indicate that the subject industry is capable of increasing itsshipments to the United States to a level that would exceed *** percent of current (2008) U.S.consumption, even assuming it had an incentive to do so.
Third, the subject industry in Mexico became less and less export oriented during the periodexamined. By 2008, its exports accounted for only *** percent of its total shipments, indicating that itcurrently intends to focus on the Mexican market.79 Although the United States was Refmex’ mostimportant export market during the period, in light of its increased focus on its home market we do notfind that Refmex is likely to devote its unused capacity or shift its consistent shipment patterns to increaseshipments substantially to the United States in the absence of an antidumping duty order.80 We furtherobserve that, although U.S. importers’ inventories of subject imports from Mexico were *** as a share ofpreceding-period shipments, their absolute levels were minimal.81 Finally, we note that the Mexicanindustry is not faced with any barriers in third-country markets. Consequently, we conclude that thevolume of subject imports, which was declining and not significant during the period examined, is notlikely to increase substantially in the imminent future.

82 CR/PR at Tables V-1, V-2, and V-4. 83 We note further that petitioner ***. CR/PR at Table V-6.
36
As discussed above, we recognize that subject imports from Mexico undersold the domesticproduct in the majority of possible quarterly price comparisons. We also noted, however, that becauseprices for the domestic like product generally increased during the period examined, subject imports didnot have significant price-depressing effects, nor did they have price-suppressing effects during the periodexamined.82 Given the low volumes of imports from Mexico during the period examined, and our findingthat significant increased imports from Mexico are not imminent, we find that subject imports fromMexico likely will not affect prices for the domestic like product negatively in the imminent future, assubject imports did not do so in a significant manner during the period examined.83 Therefore, weconclude that subject imports from Mexico will likely not have significant price-depressing or price-suppressing effects in the imminent future which would be likely to increase demand for further imports.
In evaluating the likely impact on the domestic industry of subject imports from Mexico, we notethat, as explained above, we cannot conclude that the cumulated subject imports, let alone subject importsfrom Mexico, are currently having a significant adverse impact on the domestic industry. Moreover, asdiscussed above, we find that in the imminent future the subject imports from Mexico will not likelyincrease substantially in volume or begin to have significant price-suppressing effects. Thus, despite ourfinding that the domestic industry is vulnerable to future injury from subject imports from China, we findthat further imports from Mexico are not imminent and that material injury by reason of subject importsfrom Mexico would not occur in the absence of an antidumping duty order. Accordingly, we determinethat there is no reasonable indication that the domestic industry is threatened with material injury byreason of subject imports from Mexico.
III. CONCLUSION
For the foregoing reasons, we determine that there is a reasonable indication that an industry inthe United States is threatened with material injury by reason of imports of certain magnesia carbonbricks from China that are allegedly subsidized by the government of China and sold in the United Statesat LTFV. We further determine that there is no reasonable indication that an industry in the United Statesis materially injured or threatened with material injury by reason of imports of certain magnesia carbonbricks from Mexico that are allegedly sold in the United States at LTFV.
1 See the section entitled “The Subject Merchandise” in Part I of this report for a complete description of themerchandise subject to these investigations. 2 Federal Register notices cited in the tabulation are presented in appendix A.
I-1
PART I: INTRODUCTION
BACKGROUND
These investigations result from a petition filed on July 29, 2009, with the U.S. Department ofCommerce (“Commerce”) and the U.S. International Trade Commission (“USITC” or “Commission”) byResco Products Inc., (Resco) Pittsburgh, PA. The petition alleges that an industry in the United States ismaterially injured and threatened with material injury by reason of subsidized and less-than-fair-value(“LTFV”) imports of certain magnesia carbon bricks (“MCB”)1 from China and by reason of LTFVimports of MCB from Mexico. Information relating to the background of the investigations is providedbelow.2
Effective date Action
July 29, 2009 Petition filed with Commerce and the Commission; institution of Commissioninvestigations (74 FR 39969, August 10, 2009)
August 19, 2009 Commission’s conference1
August 25, 2009 Commerce’s notice of initiation of antidumping duty investigations (74 FR 42852);Commerce’s notice of initiation of countervailing duty investigation (74 FR 42858)
September 11, 2009 Commission’s vote
September 14, 2009 Commission determinations transmitted to Commerce
September 21, 2009 Commission views transmitted to Commerce
1 A list of witnesses appearing at the conference is presented in app. B.
STATUTORY CRITERIA AND ORGANIZATION OF THE REPORT
Statutory Criteria
Section 771(7)(B) of the Tariff Act of 1930 (the “Act”) (19 U.S.C. § 1677(7)(B)) provides that inmaking its determinations of injury to an industry in the United States, the Commission--
shall consider (I) the volume of imports of the subject merchandise, (II)the effect of imports of that merchandise on prices in the United Statesfor domestic like products, and (III) the impact of imports of suchmerchandise on domestic producers of domestic like products, but onlyin the context of production operations within the United States; and. . .may consider such other economic factors as are relevant to thedetermination regarding whether there is material injury by reason ofimports.
I-2
Section 771(7)(C) of the Act (19 U.S.C. § 1677(7)(C)) further provides that--
In evaluating the volume of imports of merchandise, the Commissionshall consider whether the volume of imports of the merchandise, or anyincrease in that volume, either in absolute terms or relative to productionor consumption in the United States is significant.. . .In evaluating the effect of imports of such merchandise on prices, theCommission shall consider whether . . . (I) there has been significantprice underselling by the imported merchandise as compared with theprice of domestic like products of the United States, and (II) the effect ofimports of such merchandise otherwise depresses prices to a significantdegree or prevents price increases, which otherwise would haveoccurred, to a significant degree.. . .In examining the impact required to be considered under subparagraph(B)(i)(III), the Commission shall evaluate (within the context of thebusiness cycle and conditions of competition that are distinctive to theaffected industry) all relevant economic factors which have a bearing onthe state of the industry in the United States, including, but not limited to. . . (I) actual and potential declines in output, sales, market share, profits,productivity, return on investments, and utilization of capacity, (II)factors affecting domestic prices, (III) actual and potential negativeeffects on cash flow, inventories, employment, wages, growth, ability toraise capital, and investment, (IV) actual and potential negative effectson the existing development and production efforts of the domesticindustry, including efforts to develop a derivative or more advancedversion of the domestic like product, and (V) in {an antidumpinginvestigation}, the magnitude of the margin of dumping.
Organization of the Report
Part I of this report presents information on the subject merchandise, alleged subsidies anddumping margins, and domestic like product. Part II of this report presents information on conditions ofcompetition and other relevant economic factors. Part III presents information on the condition of theU.S. industry, including data on capacity, production, shipments, inventories, and employment. Parts IVand V present the volume and pricing of imports of the subject merchandise, respectively. Part VIpresents information on the financial experience of U.S. producers. Part VII presents the statutoryrequirements and information obtained for use in the Commission’s consideration of the question of threatof material injury, as well as information regarding nonsubject countries.
U.S. MARKET SUMMARY
MCB generally is used to provide thermal and corrosion resistance in a variety of settings,primarily in the production of iron and steel. The leading U.S. producers of MCB are ANH, LWBRefractories (LWB), and Resco, while leading producers of MCB outside the United States include RHIRefractories Liaoning, Mayerton, and Jiangsu Suja of China and RHI-Refmex of Mexico. The leadingU.S. importers of MCB from China are Veitsch-Radex, Mayerton, and Fedmet, while the leading
3 Certain Magnesia Carbon Bricks from the People’s Republic of China: Initiation of Countervailing DutyInvestigation, 74 FR 42858, August 25, 2009.
I-3
importer of MCB from Mexico is Veitsch-Radex. Leading importers of MCB from nonsubject countries(primarily Germany and the United Kingdom) include Veitsch-Radex and Vesuvius.
Apparent U.S. consumption of MCB totaled approximately *** short tons $*** in 2008. Currently, four firms are known to produce MCB in the United States. U.S. producers’ U.S. shipments ofMCB totaled 62,470 short tons ($76.6 million) in 2008, and accounted for *** percent of apparent U.S.consumption by quantity and *** percent by value. U.S. shipments of imports from subject sourcestotaled 43,837 short tons ($39.6 million) in 2008 and accounted for *** percent of apparent U.S.consumption by quantity and *** percent by value. U.S. imports from nonsubject sources totaled ***short tons ($***) in 2008 and accounted for *** percent of apparent U.S. consumption by quantity and*** percent by value.
SUMMARY DATA AND DATA SOURCES
A summary of data collected in the investigations is presented in appendix C, table C-1. Exceptas noted, U.S. industry data are based on questionnaire responses of three firms that accounted for ***percent of U.S. production of MCB during 2008. U.S. imports from China and Mexico are based onquestionnaire responses from 16 firms and one firm, respectively. Data regarding the Chinese industryare based on seven foreign producer questionnaire responses, data regarding the Mexican industry arebased on one foreign producer questionnaire response, while information with respect to other foreignindustries is drawn from public sources.
PREVIOUS AND RELATED TITLE VII INVESTIGATIONS
MCB has not been the subject of any prior countervailing/antidumping duty investigation(s) inthe United States.
NATURE AND EXTENT OF ALLEGED SUBSIDIES AND SALES AT LTFV
Alleged Subsidies
On August 25, 2009, Commerce published a notice in the Federal Register of the initiation of itscountervailing duty investigation on MCB from China.3 In its notice, Commerce identified the followinggovernment programs alleged in the petition to have provided countervailable subsidies to producers ofMCB in China:
! Provision of inputs for less than adequate remuneration! Export restraints of raw materials! Tax benefit programs! Northeast revitalization program and related provincial policies! Direct Grants! Grants to companies for “outward expansion” and export performance in Guangdong province! Preferential loans and directed credit to the magnesia carbon brick industry! Cash grant programs! Zhejiang Province program to rebate antidumping costs.
4 Certain Magnesia Carbon Bricks from the People’s Republic of China and Mexico: Initiation of AntidumpingDuty Investigations, 74 FR 42852, August 25, 2009. 5 Ibid. 6 Ibid. 7 Ibid.
I-4
Alleged Sales at LTFV
On August 25, 2009, Commerce published a notice in the Federal Register of the initiation of itsantidumping duty investigations on MCB from China4 and Mexico.5 Commerce has initiatedantidumping duty investigations based on estimated dumping margins of 112 percent to 349 percent forMCB from China and 153 percent to 295 percent for MCB from Mexico.
THE SUBJECT MERCHANDISE
Commerce’s Scope
Commerce has defined the imported merchandise subject to these investigations as:
certain chemically bonded (resin or pitch), magnesia carbon bricks with a magnesia component ofat least 70 percent magnesia (“MgO”) by weight, regardless of the source of raw materials for theMgO, with carbon levels ranging from trace amounts to 30 percent by weight, regardless ofenhancements, (for example, magnesia carbon bricks can be enhanced with coating, grinding, tarimpregnation or coking, high temperature heat treatments, anti-slip treatments or metal casing)and regardless of whether or not anti-oxidants are present (for example, antioxidants can be addedto the mix from trace amounts to 15 percent by weight as various metals, metal alloys, and metalcarbides).6
Tariff Treatment
During the period examined, MCB has been classified in the Harmonized Tariff Schedule of theUnited States (HTS) under subheading 6902.10.10, magnesite bricks (which also contains products otherthan MCB, including refractory blocks, tiles and other refractory products), and under HTS subheading6902.10.50, other refractory bricks. MCB may also enter under HTS subheading 6815.91.00, articles ofstone or other mineral substances, not elsewhere specified or included, containing magnesite, dolomite orchromite, or HTS subheading 6815.99.10, articles of stone or other mineral substances, not elsewherespecified or included, not containing magnesite, dolomite, or chromite.7 Table I-1 presents current tariffrates for MCB.
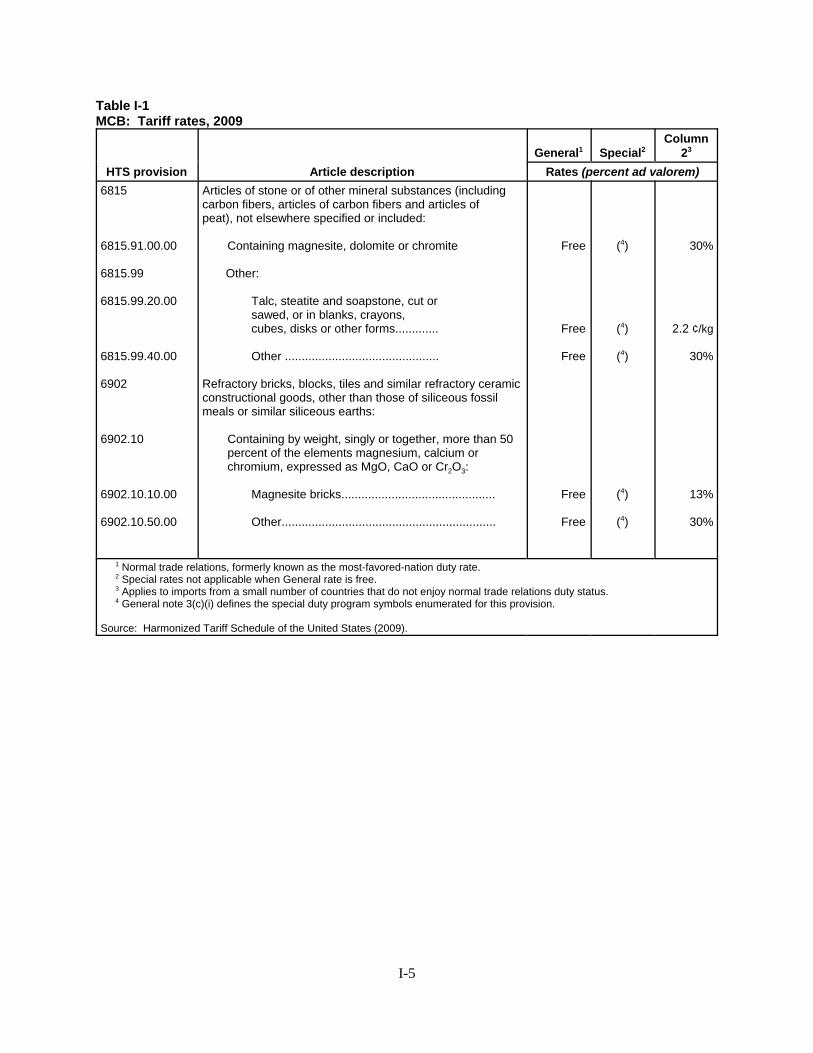
I-5
Table I-1MCB: Tariff rates, 2009
HTS provision Article descriptionGeneral1 Special2
Column23
Rates (percent ad valorem)6815
6815.91.00.00
6815.99
6815.99.20.00
6815.99.40.00
6902
6902.10
6902.10.10.00
6902.10.50.00
Articles of stone or of other mineral substances (includingcarbon fibers, articles of carbon fibers and articles ofpeat), not elsewhere specified or included:
Containing magnesite, dolomite or chromite
Other:
Talc, steatite and soapstone, cut or sawed, or in blanks, crayons, cubes, disks or other forms.............
Other ..............................................
Refractory bricks, blocks, tiles and similar refractory ceramicconstructional goods, other than those of siliceous fossilmeals or similar siliceous earths:
Containing by weight, singly or together, more than 50 percent of the elements magnesium, calcium or chromium, expressed as MgO, CaO or Cr2O3:
Magnesite bricks..............................................
Other................................................................
Free
Free
Free
Free
Free
(4)
(4)
(4)
(4)
(4)
30%
2.2 ¢/kg
30%
13%
30%
1 Normal trade relations, formerly known as the most-favored-nation duty rate. 2 Special rates not applicable when General rate is free. 3 Applies to imports from a small number of countries that do not enjoy normal trade relations duty status. 4 General note 3(c)(i) defines the special duty program symbols enumerated for this provision.
Source: Harmonized Tariff Schedule of the United States (2009).

8 Refractories are heat-resistant materials that line high-temperature furnaces, ladles, and other processing units. In addition to being heat-resistant, refractories also withstand physical wear and corrosion by chemical agents. TheRefractories Institute, http://www.refractoriesinstitute.org (accessed August 12, 2009). 9 Petition, CVD Vol. I, p. 5. 10 Conference transcript, p. 46 (Mazard). 11 Conference transcript, p. 45 (Mazard). 12 Ladles used in steel production are the largest users of MCB, followed by electric arc furnaces. Sales for basicoxygen furnaces constitute a small portion of the MCB market since steel manufacturing practices have extended thelife of MCB applications. Conference transcript, p. 24 (Brown). 13 Troell, Peter T., “Evolution of Magnesia-Carbon Refractories,” Ceramic Industry; Feb. 1995, Vol. 144, Issue 2. 14 There are at least eight different grades of magnesia and four different grades of graphite. Conferencetranscript, p. 110 (B. Stein). 15 MCB with 90 to 95 percent magnesia has a melting point of 3,980 degrees Fahrenheit while pure magnesia(100 percent) melts at 5,070 degrees Fahrenheit. Harbison-Walker Co., “Refractory Raw Materials,” p. CR-3. 16 Magnesia is said to be fused when the heat treatment during the production process becomes molten. Landy,Richard A., “Magnesia Refractories,” Refractories Handbook, ed. Schacht, Charles A. 2004, p. 111. 17 Sintering refers to the process of forming objects from a metal powder by heating the powder at a temperaturebelow its melting point. When the powder is compacted into the desired shape and heated, i.e., sintered, for up tothree hours, the particles composing the powder join together to form a single solid object. Landy, Richard A.,“Magnesia Refractories,” Refractories Handbook, ed. Schacht, Charles A. 2004, p. 111.
I-6
THE PRODUCT
Description and Applications
MCB is a refractory8 product made mostly from a combination of magnesia and carbon thatprovides thermal and corrosion resistance in operations involving high temperatures and harsh operatingconditions, such as in the production of steel. The scope of this case consists of chemically bondedMCBs where the magnesia component amounts to at least 70 percent and the carbon levels range fromtrace amounts to 30 percent.9 MCB may contain other substances such as antioxidants that range fromtrace amounts to 15 percent by weight.
MCB is considered to be the most durable refractory brick on the market for furnaces and ladlelinings, especially around the slag line.10 While other refractory bricks, such as fired magnesite, firedbauxite, magnesia dolomite, and magnesia alumina graphite bricks, may be used in place of MCB, thesealternatives do not have the same physical characteristics of MCB, are easily differentiated by price, andtheir uses are not perceived by the steel producers as substitutable.11 MCB is used to line the lowersidewalls, upper sidewalls, slag lines, and roofs of ladles12 and ladle metallurgy furnaces involved in steelproduction and refining where it comes in contact with both molten steel and molten slag. Furthermore,MCB is also used to line basic oxygen furnaces (BOF) and for electric arc furnaces (EAF).13
MCB is produced in a large number of grades with different levels of magnesia, carbon, anddifferent contributions of additives depending upon the intended specific applications.14 MCB ischaracterized by its high heat resistance (it has a high melting point, which varies depending on theamount and type of impurity within the grain of the brick),15 good resistance to slags and possesses lowvulnerability to degradation by iron oxide and alkalies. Unlike most other refractory products, MCBdegradation can occur within the refractory structure itself as a result of high-temperature reactions. Thedegradation can disrupt the brick structure through the loss of the carbon bond, resulting greatervulnerability to wear. Therefore, the quality of magnesia selected for use in MCB should have overalllow levels of impurities to minimize the reducing effects of carbon. Heat treatments on the magnesia rawmaterials can cause the magnesia to be either fused16 or sintered,17 which alter the performance of MCB inits application. Sintered magnesia is used in a range of market applications and has a high melting
18 Landy, Richard A., “Magnesia Refractories,” Refractories Handbook, ed. Schacht, Charles A. 2004, pp.111–113. 19 Troell, Peter T., “Evolution of Magnesia-Carbon Refractories,” Ceramic Industry, Feb. 1995, Vol. 144, Issue 2. 20 Ibid. 21 Harbison-Walker Co., “Refractory Raw Materials,” p. CR-3. 22 Ibid. 23 Conference transcript, p. 44 (Mazard). 24 Pitch or resin impregnation fills in the voids of the brick, making is less porous and increasing the carbon in thebrick resulting in better steel slag resistance. E-mail from ***. 25 Metal casings on MCBs increase strength and improve corrosion resistance in areas of the furnace wheremechanical equipment can corrode MCB that is not plated. Metal cased MCB are not used in ladles used for steelproduction. E-mail from ***. 26 High-temperature treatments decrease the porosity of the MCB resulting in increased resistance to steel slagpenetration. E-mail from ***. 27 Troell, Peter T., “Evolution of Magnesia-Carbon Refractories,” Ceramic Industry, Feb. 1995, Vol. 144, Issue 2. 28 Conference transcript, p. 55 (Brown). 29 Conference transcript, p. 47 (Mazard). 30 Conference transcript, p. 91 (Copp). 31 The type of steel being produced and the specific production methods associated with the product determinehow frequently the lining of a ladle is replaced. Conference transcript, p. 53 (Brown). 32 Conference transcript, pp. 44-45 (Mazard).
I-7
point while fused magnesia is considered to maintain strength and corrosion resistance as well aschemical stability thereby enhancing the performance of MCB.18 The carbon in MCB prevents liquid slagfrom penetrating and eroding the brick. The high carbon content of MCB is achieved by adding carbon insuch forms as pitch or graphite with natural flake graphite the most common. Graphite purity is alsoimportant in determining stability and performance in high-temperature environments.19 Natural flakegraphite is one of the widely used carbons because of its high oxidation resistance, which contributes tothe reduced erosion rates, and its ability to impart high thermal conductivity to the brick.20 The highthermal conductivity results in reduced thermal stresses within the brick and faster cooling of the MCBbetween heats.21 High temperature stability of MCB also is achieved through the addition of additives,such as powdered metals (aluminum, magnesium, and silicon), to enhance resistance to oxidation as thesemetals consume oxygen that would otherwise oxidize with the carbon, thereby increasing the strength of the brick.22 MCB quality can be further enhanced with the combination of othertreatments23 such as pitch or resin impregnation,24 metal casing,25 and high-temperature treatments26
resulting in a broad range of product options to suit a variety of demanding steel applications.27 The refractory brick market is a mature industry and there have not been any major
breakthroughs in steel production and processing or in the refractory and MCB markets.28 Refractoryproducts are frequently sold independently of other refractory brick for a ladle, or as part of a packagefrom a single vendor including all of the bricks necessary to line a ladle.29 Package orders, as opposed toindividual orders for MCB, are determined based on customer preferences.30
Most steel producing companies use several types of refractory brick to line their furnaces andladles. A variety of refractory products are used because rates of wear and replacement of the refractorybricks vary significantly based on the type of steel being produced, individual furnaces used, and thevarious performance requirements of the different areas of the steel furnaces or ladle.31 More specifically,MCB is only used in the most demanding areas of the furnace or ladles which is principally along the slaglines and at the top of the steel vessel where active chemical processes are taking place andimpurities and waste tend to aggregate. Other less costly products are used at the bottom and lower sidesof the furnace or ladles where slag conditions are less aggressive and will wear out at lower rates.32

33 Conference transcript, p. 46 (Mazard).
I-8
MCB and the other refractory bricks are strategically placed in the ladle so that the overall wear on theladle is even and the ladle lining provides the lowest cost per ton of steel produced for refractories.33
An example of a refractory-lined ladle is shown in Figure I-1:
Figure I-1Refractory-lined ladle
Source: Petitioners’ postconference brief, exh. 2, p. 1.
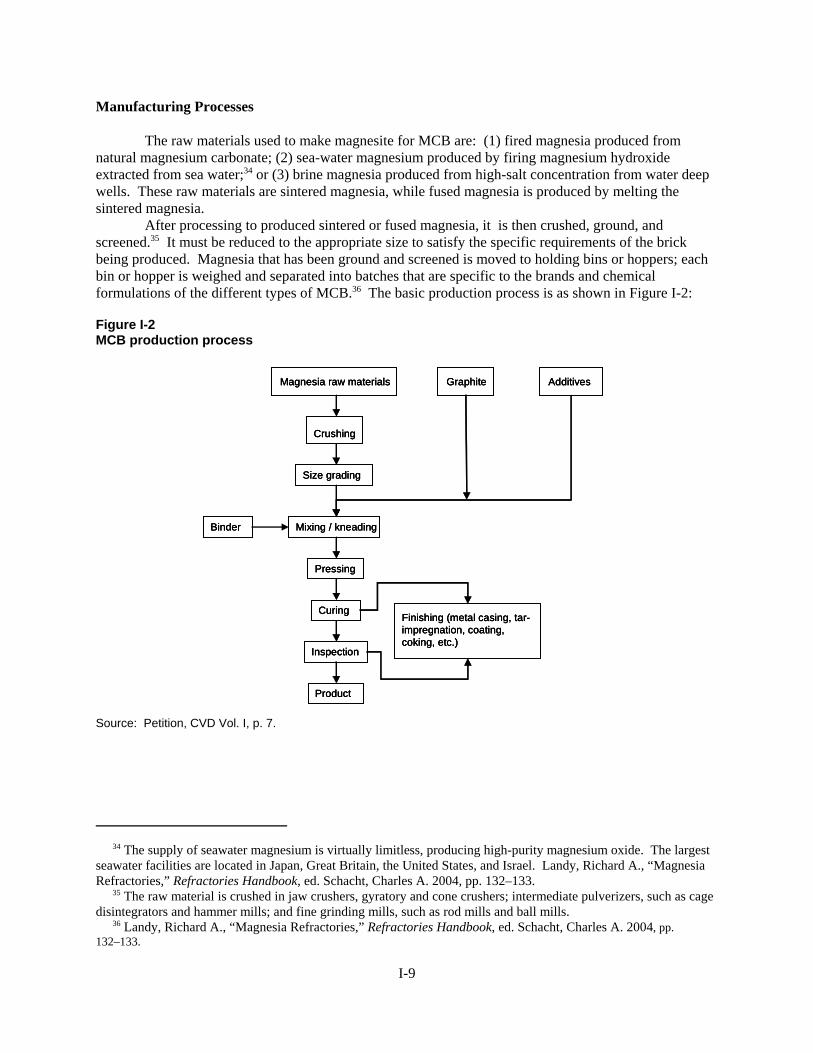
34 The supply of seawater magnesium is virtually limitless, producing high-purity magnesium oxide. The largestseawater facilities are located in Japan, Great Britain, the United States, and Israel. Landy, Richard A., “MagnesiaRefractories,” Refractories Handbook, ed. Schacht, Charles A. 2004, pp. 132–133. 35 The raw material is crushed in jaw crushers, gyratory and cone crushers; intermediate pulverizers, such as cagedisintegrators and hammer mills; and fine grinding mills, such as rod mills and ball mills. 36 Landy, Richard A., “Magnesia Refractories,” Refractories Handbook, ed. Schacht, Charles A. 2004, pp.132–133.
I-9
Manufacturing Processes
The raw materials used to make magnesite for MCB are: (1) fired magnesia produced fromnatural magnesium carbonate; (2) sea-water magnesium produced by firing magnesium hydroxideextracted from sea water;34 or (3) brine magnesia produced from high-salt concentration from water deepwells. These raw materials are sintered magnesia, while fused magnesia is produced by melting thesintered magnesia.
After processing to produced sintered or fused magnesia, it is then crushed, ground, andscreened.35 It must be reduced to the appropriate size to satisfy the specific requirements of the brickbeing produced. Magnesia that has been ground and screened is moved to holding bins or hoppers; eachbin or hopper is weighed and separated into batches that are specific to the brands and chemicalformulations of the different types of MCB.36 The basic production process is as shown in Figure I-2:
Figure I-2MCB production process
Source: Petition, CVD Vol. I, p. 7.
Magnesia raw materials Graphite
Crushing
Size grading
Mixing / kneadingBinder
Pressing
Curing
Inspection
Product
Finishing (metal casing, tar-impregnation, coating, coking, etc.)
AdditivesMagnesia raw materialsMagnesia raw materials GraphiteGraphite
CrushingCrushing
Size gradingSize grading
Mixing / kneadingMixing / kneadingBinderBinder
PressingPressing
CuringCuring
InspectionInspection
ProductProduct
Finishing (metal casing, tar-impregnation, coating, coking, etc.)
Finishing (metal casing, tar-impregnation, coating, coking, etc.)
AdditivesAdditives

37 The most common type is a muller mixer, a mixing bowl fitted with wheels that rotate while the mixer bowlrevolves or the rotating wheels revolve while the mixer bowl is stationary. This equipment produces a kneadingaction to the materials in which the portion of the materials directly under the wheels is squeezed and pressedproducing a “de-airing” action. Another mixer type is one that has a bowl fitted with a high-intensity rotor, ribbonblades, or screw. These mixers usually produce a uniform mix faster than the muller type, but the de-airing is not asgood. 38 A uniaxial press can apply force to a brick through a number of different methods. Pressure is applied in onedirection to achieve uniform density and a homogeneous micro-structure on a variety different presses. Amechanical press uses a ram to compact the brick against a stationary mold, and it uses the compacted brickthickness itself to control the final movement of the press without independent control of the compacting force. Afriction press uses a flywheel driven at a preset speed to drive a ram to compact the brick. A friction press uses theenergy contained in the flywheel to control the thickness of the brick without independent control of the brickthickness. A hydraulic press uses pressure to force a ram against the brick. Brick thickness is controlled by a rigidstop to control the travel of the ram. Carniglia, Stephen C. and Gordon L. Barna, Handbook of IndustrialRefractories Technology, Principles, Types, Properties and Applications, 1992, pp. 508-510 . 39 The isostatic press can be used to produce difficult refractory geometries such as nozzles, shrouds, anddiffusers for certain BOF applications. In isostatic pressing a preformed body is hermetically wrapped in a flexiblemetal foil or polymeric bag and placed in a vessel which is then filled with oil under pressure to form the complexdesign. 40 Carniglia, Stephen C. & Gordon L. Barna, Handbook of Industrial Refractories Technology, Principles, Types,Properties and Applications, 1992, pp. 515-516 and e-mail from ***. 41 Conference transcript, p. 177 (B. Stein). 42 Conference transcript, pp. 110–111 (B. Stein) and Petitioner’s postconference brief, exh. 1, pp. 12-13. 43 Conference transcript, p. 124 (Conrad). 44 Conference transcript, pp. 110-111 (B. Stein). 45 Conference transcript, p. 115 (B. Stein). 46 Conference transcript, p. 124 (Conrad).
I-10
The magnesia is mixed with other materials, including pitch, binders, carbon, and other metallicadditives specific to the brick being made.37 When mixing is complete, the material is transported to apress for forming into individual shaped bricks. MCBs are molded in a wide variety of sizes dependingon the specific application and the configuration of the furnace or ladle lining for which they aredesigned. There are several methods of pressing and manufacturing facilities differ with regard to the typeof press used. Presses include the uniaxial press (such as a mechanical press, friction press, or a hydraulicpress)38 and the isostatic press.39 Once the bricks are pressed they are heated in batch or tunnel ovens toset resin binds. Finally, the bricks are packaged for shipment.40
The shape and density of the MCB are major factors in determining resistance to degradation andoperational life of the brick.41 Density is determined, for the most part, by the type of press used inproduction. Refractory producers in the United States, the European Union, and Mexico tend to use thehydraulic press, while the friction press is more common among Chinese producers.42 The hydraulicpress uses the force of a hydraulic piston to press and de-air the mix in one stroke. Hydraulic presses area newer technology requiring fewer workers and are useful in the production of very large brick shapes.43 A friction press, presses the mix with frequent strokes in order to de-air the mix and results in a MCB ofhigher density compared to the hydraulic press according to respondents at the staff conference.44 Whilethe disparity in density of the refractory brick produced from the two presses may differ by a few percent,the difference in the brick’s resistance to wear and its operational life is more significant.45 Furthermore,although a friction press requires more manpower than a hydraulic press, the respondents claim thatfriction presses can change their brick molds more quickly and produce another size, shape, or qualitygrade that the customer may require.46
47 Petitioner’s postconference brief, exh. 1, pp. 12–13. 48 Petitioner’s postconference brief, p. 4. 49 Conference transcript, p. 142 (Levinson) and (Mendoza), p. 143 (Thomas). 50 Respondent RHI’s postconference brief, p. 3.
I-11
Petitioner disputes that the friction press makes a denser MCB than the hydraulic press and claimthat the hydraulic press has the capability and efficiency to make MCB that is just as dense. In thisregard, petitioner states:
“Petitioner also submits that there is absolutely no basis in fact or data to supportRespondents’ comments at the conference that a friction screw press can somehow makea denser MCB than a hydraulic press. This urban legend was debated and put to bed atleast 25 years ago. Friction screw presses are less costly to install than the moresophisticated and automated hydraulic presses. The friction screw press is generallymore labor intensive and typically does not have any automation, that is, the mold ishand fed with the MCB mix and the friction pressing is controlled by an operator who, atbest guesses at the density of the MCB . The idea that one could somehow use lowergrade raw materials and press a denser MCB product on a friction press that couldcompete with higher purity and quality raw materials used in MCB on a hydraulic pressis ludicrous. Hydraulic presses have the capability and the efficience to make just asdense MCB as a friction screw press by utilizing multiple strokes in the press-pausecycle of the pressing process. In general, hydraulic presses can make a higher qualityMCB than those made on friction presses.”47
DOMESTIC LIKE PRODUCT ISSUES
No issues with respect to domestic like product have been raised in these investigations. Thepetitioner proposes that the domestic like product is co-extensive with the scope of the petition.48 Respondents agree with the petitioner’s definition of domestic like product for purposes of thepreliminary determination;49 however, the respondent RHI notes that other refractory brick may becompetitive with MCB.50


1 RMA factbook 2009, p. 3. (See petition, p. 21 and exh. 5). 2 Petition, p. 9.
II-1
PART II: CONDITIONS OF COMPETITION IN THE U.S. MARKET
U.S. MARKET CHARACTERISTICS
Two of three responding U.S. producers and seven of 12 responding importers reported sellingMCB nationally. One responding U.S. producer (***) reported selling MCB to all regions except ***. The remaining responding five importers reported selling to various regions except for the RockyMountains and the Northwest. Four importers reported selling to the Midwest and four importersreporting selling to the Northeast.
CHANNELS OF DISTRIBUTION
Almost all MCBs from all sources are sold directly to end users.1 As shown in table II-1, in eachperiod, over 99 percent of shipments of U.S. product and over 90 percent of imports from China weremade to the end users. *** reported U.S. shipments of U.S. imports from Mexico and countries otherthan China and Mexico were to end users. Petitioner indicates that all major domestic and foreignproducers, including Chinese producers, compete for critical large volume accounts in the steel industryand approximately 75 percent of all MCB sold in the United States is sold to about 25 end users.2
SUPPLY AND DEMAND CONSIDERATIONS
Supply
U.S. Supply
Based on available information, U.S. MCB producers have the ability to respond to changes indemand with large changes in the quantity of shipments of U.S.-produced MCB to the U.S. market. Themain contributing factors to the high degree of responsiveness of supply are the availability of unusedcapacity, existence of alternate markets, and the ability to produce alternate products; supplyresponsiveness is constrained by the somewhat limited ability to use inventories.
Industry capacity
U.S. producers’ capacity utilization decreased from 45.3 percent in 2006 to 43.8 percent in 2008. This level of capacity utilization indicates that U.S. producers have unused capacity with which theycould increase production of MCB in the event of a price change.
Alternative markets
Exports by the U.S. producers, as a share of total shipments, decreased from *** percent in 2006to *** percent in 2008. These data indicate that U.S. producers have the ability to divert shipments to orfrom alternative markets in response to changes in the price of MCB.
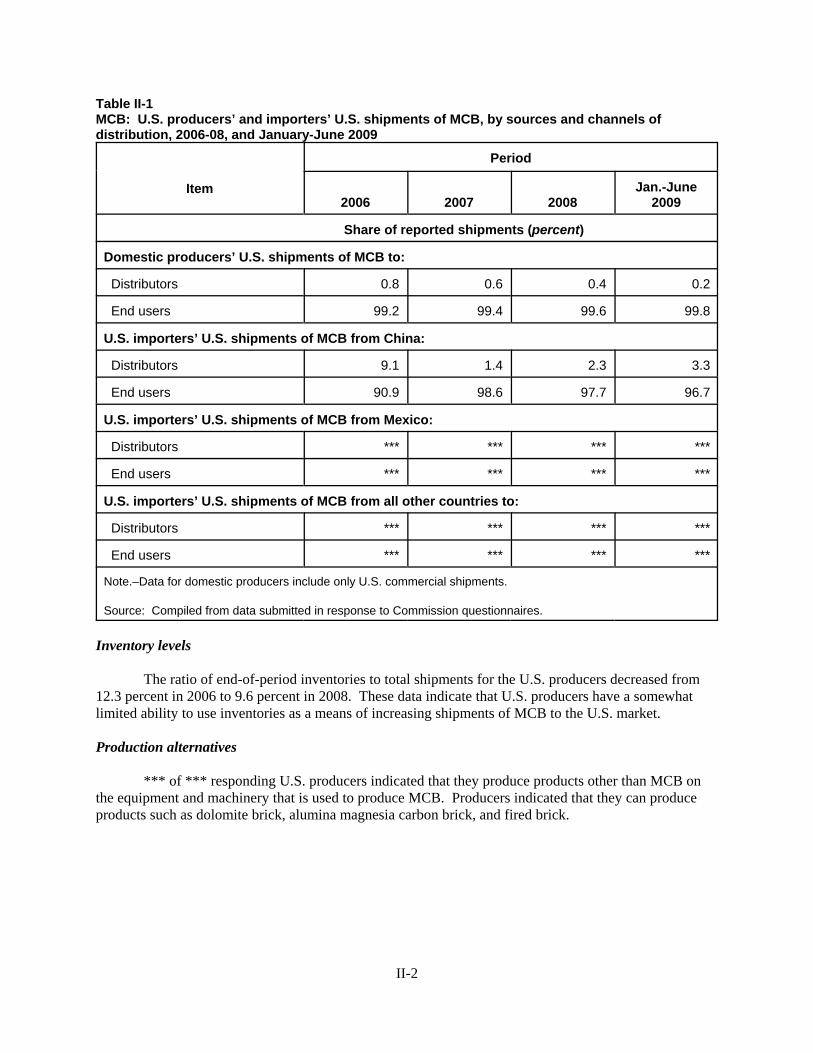
II-2
Table II-1MCB: U.S. producers’ and importers’ U.S. shipments of MCB, by sources and channels of distribution, 2006-08, and January-June 2009
Item
Period
2006 2007 2008Jan.-June
2009
Share of reported shipments (percent)
Domestic producers’ U.S. shipments of MCB to:
Distributors 0.8 0.6 0.4 0.2
End users 99.2 99.4 99.6 99.8
U.S. importers’ U.S. shipments of MCB from China:
Distributors 9.1 1.4 2.3 3.3
End users 90.9 98.6 97.7 96.7
U.S. importers’ U.S. shipments of MCB from Mexico:
Distributors *** *** *** ***
End users *** *** *** ***
U.S. importers’ U.S. shipments of MCB from all other countries to:
Distributors *** *** *** ***
End users *** *** *** ***
Note.–Data for domestic producers include only U.S. commercial shipments.
Source: Compiled from data submitted in response to Commission questionnaires.
Inventory levels
The ratio of end-of-period inventories to total shipments for the U.S. producers decreased from12.3 percent in 2006 to 9.6 percent in 2008. These data indicate that U.S. producers have a somewhatlimited ability to use inventories as a means of increasing shipments of MCB to the U.S. market.
Production alternatives
*** of *** responding U.S. producers indicated that they produce products other than MCB onthe equipment and machinery that is used to produce MCB. Producers indicated that they can produceproducts such as dolomite brick, alumina magnesia carbon brick, and fired brick.
3 Six Chinese producers responded to the foreign producers’ questionnaire. Their exports the U.S. represented 69percent of total reported U.S. imports from China in 2008. 4 One Mexican producer responded to the foreign producers’ questionnaire. Its exports the U.S. represented ***reported U.S. imports from Mexico in 2008.
II-3
Subject Imports from China
Based on available information, Chinese producers have the ability to respond to changes indemand with large changes in the quantity of shipments of MCB to the U.S. market.3 The maincontributing factors to the high degree of responsiveness of supply are the availability of unused capacity,the existence of alternate markets, and the ability to produce alternate products; supply responsiveness isconstrained by the somewhat limited ability to use inventories.
Industry capacity
Chinese producers’ capacity utilization decreased from 79.6 percent in 2006 to 62.9 percent in2008. This level of capacity utilization indicates that Chinese producers have unused capacity with whichthey could increase production of MCB in the event of a price change.
Alternative markets
Shipments of MCB from China to markets other than the United States (both exports toalternative markets and shipments to their home market) decreased from approximately 90.5 percent oftotal shipments in 2006 to 88.5 percent in 2008. Thus, available data indicate that subject producers inChina have the ability to divert shipments to or from their home market and alternative markets inresponse to changes in the price of MCB.
Inventory levels
The ratio of end-of-period inventories to total shipments for the Chinese producers increasedfrom 5.2 percent in 2006 to 6.6 percent in 2008. These data indicate that Chinese producers have asomewhat limited ability to use inventories as a means of increasing shipments of MCB to the U.S.market.
Production alternatives
Six of seven responding Chinese producers indicated that they produce products other than MCBon the equipment and machinery that is used to produce MCB. These producers indicated that they canproduce products such as alumina silicate carbon bricks and alumina magnesia carbon brick.
Subject Imports from Mexico
Based on available information, the Mexican producer has the ability to respond to changes indemand with large changes in the quantity of shipments of MCB to the U.S. market.4 The maincontributing factors to the high degree of responsiveness of supply are the availability of unused capacityand the existence of alternate markets or inventories; supply responsiveness is constrained by an inabilityto produce alternate products.

5 See Part I and conference transcript, p. 13 (Brown).
II-4
Industry capacity
The Mexican producer’s capacity utilization increased from *** percent in 2006 to *** percent in2008. This level of capacity utilization indicates that the Mexican producer has unused capacity withwhich it could increase production of MCB in the event of a price change.
Alternative markets
Shipments of MCB from Mexico to markets other than the United States (both exports toalternative markets and shipments to the home market) increased from approximately *** percent of totalshipments in 2006 to *** percent in 2008. Thus, available data indicate that the Mexican producer hasthe ability to divert shipments to or from its home market and alternative markets in response to changesin the price of MCB.
Inventory levels
The ratio of end-of-period inventories to total shipments for the Mexican producer increased from*** percent in 2006 to *** percent in 2008. These data indicate that the Mexican producer has an abilityto use inventories as a means of increasing shipments of MCB to the U.S. market.
Production alternatives
The Mexican producer indicated that it *** products other than MCB on the equipment andmachinery that is used to produce MCB.
Demand
Based on available information, it is likely that any change in the price level of MCB will resultin a small change in the quantity of MCB demanded. The main contributing factors are the lack ofsubstitute products and the small cost share of MCB in its end-use products.
Demand Characteristics
As described in more detail in Part I, MCB is used by steel producers for lining electric arcfurnaces, basic oxygen furnaces, steel transfer ladles, and steel processing ladles.5 Thus, demand forMCB depends upon steel production.
Demand for MCB increased from 2006 to late 2008 and then decreased during late 2008 andearly 2009. As seen in figure II-1, raw steel production fluctuated between January 2006 and August2008, increasing overall by 7 percent and then decreasing by 50 percent between August 2008 and June2009. Steel production from blast furnaces decreased by 62 percent between August 2008 and June 2009,while steel production from electric arc furnaces decreased by 40 percent during the same time period. Similarly, as seen in figure II-2, the monthly index of raw steel production fluctuated between January2006 and August 2008, increasing overall by 3 percent and then decreasing by 48 percent betweenAugust 2008 and June 2009. By comparison, available data indicate that total apparent U.S. consumptionof MCBs increased by 9 percent between 2006 and 2008 and decreased by 46 percent between interim2008 and interim 2009.

II-5
Figure II-1Pig iron and raw steel production, by month, January 2006 to June 2009
Source: American Iron and Steel Institute.
Figure II-2Indices of raw steel production, by month, January 2006 to June 2009
Source: Federal Reserve.

6 Conference transcript, p. 77 (Brown). 7 Conference transcript, pp. 169-171 (Conrad), p. 171 (B. Stein). 8 Also, see conference transcript, p. 75 (Brown), p. 76 (McGrath), and p. 169 (Thomas). 9 Conference transcript, pp. 66-67 (Brown). 10 Conference transcript, p. 67 (Brown). 11 Ibid.
II-6
Two of three responding U.S. producers and four of 11 responding importers indicated thatdemand for MCB in the United States has decreased since 2006 and five of eleven importers indicatedthat demand either had fluctuated or not changed during that period. The remaining responding U.S.producer and two remaining responding importers indicated that demand had increased since 2006.
Substitute Products
Two of three responding producers and nine of 13 responding importers indicated that there areno substitutes for MCB. The remaining U.S. producer and importers indicated that products such asdolomite brick, burned magnesite bricks, magnesia chrome brick, magnesium chrome, and aluminamagnesia carbon brick may be used as substitutes, although both responding producers and all sevenresponding importers indicated that changes in the prices of these substitutes do not affect the price forMCB. Petitioner indicates that while conceptually there is substitutability between MCB and some ofthese products, none of these products provide the performance, the cost effectiveness, the safety, thereliability, or the consistency of MCB.6 Two importers indicated that while MCB is often the bestproduct to use, for some applications alternative products can be used as substitutes.7
Cost Share
MCB generally makes up a small share of the final cost of steel products that it is used toproduce. Responding producers and importers indicated that value of MCB as a share of the cost of steelproduction is 2 percent or less.8
SUBSTITUTABILITY ISSUES
The degree of substitution between domestic and imported MCB depends upon such factors asrelative prices, quality (e.g., grade standards, reliability of supply, defect rates, etc.), and conditions ofsale (e.g., price discounts/rebates, lead times between order and delivery dates, payment terms, productservices, etc.). Based on available data, staff believes that there is a high degree of substitutabilitybetween domestically produced MCB and MCB imported from China and Mexico.
Factors Affecting Purchasing Decisions
Petitioner indicated that price is an important, and many times the only, factor that customersconsider when making their purchasing decisions. Petitioner also stated that although it attempts todifferentiate its products by providing augmented services such as being with the customer every day inits shop and understanding what its goals and expectations are in the current environment, price isbecoming more and more the only differentiating factor.9 Petitioner reported that “value buyers” forwhich price is not the deciding factor make up less than 30 percent of the market.10 Petitioner stated thatthese customers tend to have longer vision and want a domestic MCB industry, but that this type ofcustomer is becoming increasingly rare because the steel industry is presently under terrible pressure.11 Respondents indicated that while price is important to their customers, their customers are more
12 Conference transcript, p. 157 (B. Stein and Conrad). 13 Petitioner’s postconference brief, pp. 14-15.
II-7
concerned with finding suppliers who bring new ideas and new abilities through technology and serviceto lower their costs of producing steel.12
Comparison of U.S.-Produced and Imported MCB
In order to determine whether U.S.-produced MCB can generally be used in the same applicationsas imports from China and Mexico, and U.S. producers and U.S. importers were asked whether theproducts can “always,” “frequently,” “sometimes,” or “never” be used interchangeably. As shown fromtable II-2, two of three responding producers and at least one half of responding importers indicated thatMCB produced in the United States and imported from China and Mexico are “always” usedinterchangeably and all responding producers and at least 70 percent of responding importers reportedthat they are at least “frequently” used interchangeably. One importer (***) stated that every supplier hasspecial product formulations for different applications and that raw material from every magnesite mine isdifferent. Another importer (***) reported that the MCB from its Chinese producer out-performed otherChinese-produced MCB and that no U.S. MCB has been accepted by its customer. Another importer(***) indicated that MCB produced in different countries can be using different grades of raw materialcan affect the chemistry and result with problems in service. All responding producers and at least two-thirds of importers reported that MCB produced in the United States and imported from nonsubjectcountries are “always” used interchangeably; the same is true for imports from China, Brazil, and Mexicocompared to imports from other countries.
As indicated in table II-3, two of three responding U.S. producers and at least one-half ofresponding importers indicated that differences other than price between MCB produced in the UnitedStates and imported from China and Mexico were at most “sometimes” a significant factor in their sales. Petitioner stated that all countries produce MCB to the same standards and grades and that the limitedrange of forms that petitioner imports from China is for commodity products.13

II-8
Table II-2MCB: Perceived interchangeability between MCB produced in the United States and in othercountries, by country pairs
Country pairNumber of U.S. producers
reportingNumber of U.S. importers
reporting
A F S N A F S N
U.S. vs. subject countries:
U.S. vs. China 2 1 0 0 5 2 3 0
U.S. vs. Mexico 2 1 0 0 5 1 1 0
U.S. vs. nonsubject countries:
U.S. vs. Brazil 2 0 0 0 4 1 1 0
U.S. vs. Other nonsubject 2 0 0 0 5 1 1 0
Subject country comparisons:
China vs. Mexico 2 1 0 0 5 1 1 0
Nonsubject country comparisons:
China vs. Brazil 2 0 0 0 4 1 1 0
China vs. Other nonsubject 2 0 0 0 5 1 1 0
Mexico vs. Brazil 2 0 0 0 4 1 1 0
Mexico vs. Other nonsubject 2 0 0 0 5 1 1 0
Brazil vs. Other nonsubject 2 0 0 0 4 1 1 0
Note.--A = Always, F = Frequently, S = Sometimes, N = Never.
Source: Compiled from data submitted in response to Commission questionnaires.
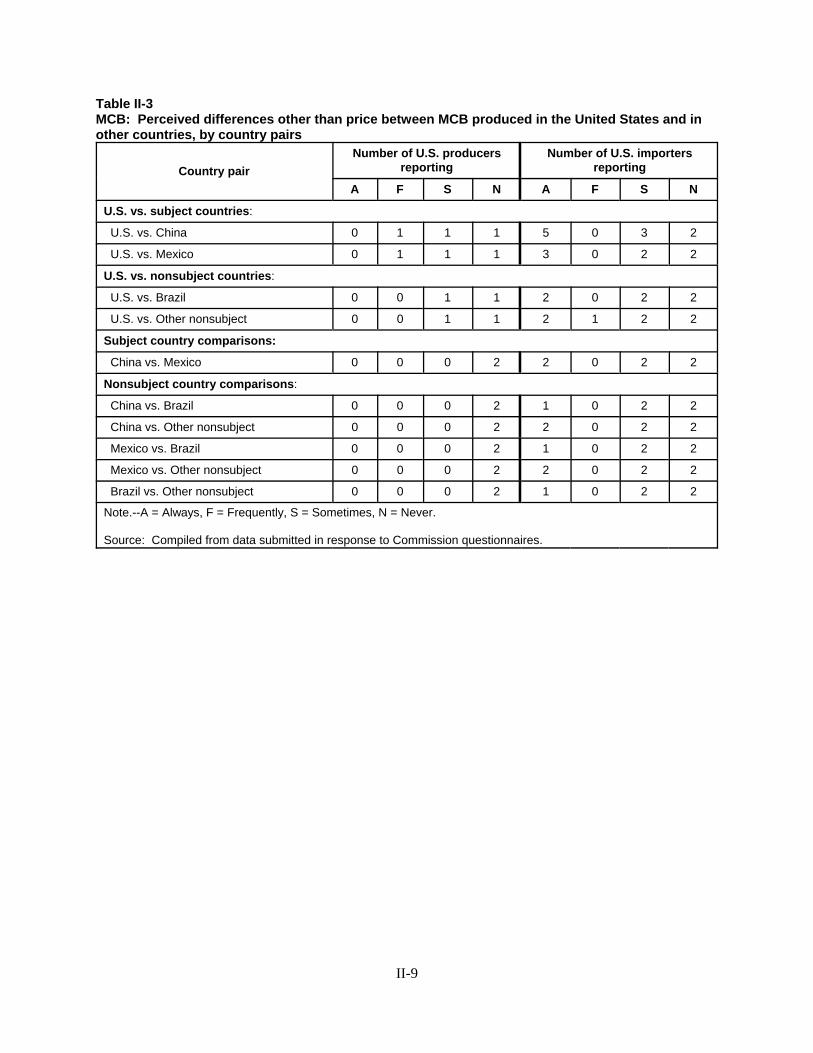
II-9
Table II-3MCB: Perceived differences other than price between MCB produced in the United States and inother countries, by country pairs
Country pairNumber of U.S. producers
reportingNumber of U.S. importers
reporting
A F S N A F S N
U.S. vs. subject countries:
U.S. vs. China 0 1 1 1 5 0 3 2
U.S. vs. Mexico 0 1 1 1 3 0 2 2
U.S. vs. nonsubject countries:
U.S. vs. Brazil 0 0 1 1 2 0 2 2
U.S. vs. Other nonsubject 0 0 1 1 2 1 2 2
Subject country comparisons:
China vs. Mexico 0 0 0 2 2 0 2 2
Nonsubject country comparisons:
China vs. Brazil 0 0 0 2 1 0 2 2
China vs. Other nonsubject 0 0 0 2 2 0 2 2
Mexico vs. Brazil 0 0 0 2 1 0 2 2
Mexico vs. Other nonsubject 0 0 0 2 2 0 2 2
Brazil vs. Other nonsubject 0 0 0 2 1 0 2 2
Note.--A = Always, F = Frequently, S = Sometimes, N = Never.
Source: Compiled from data submitted in response to Commission questionnaires.

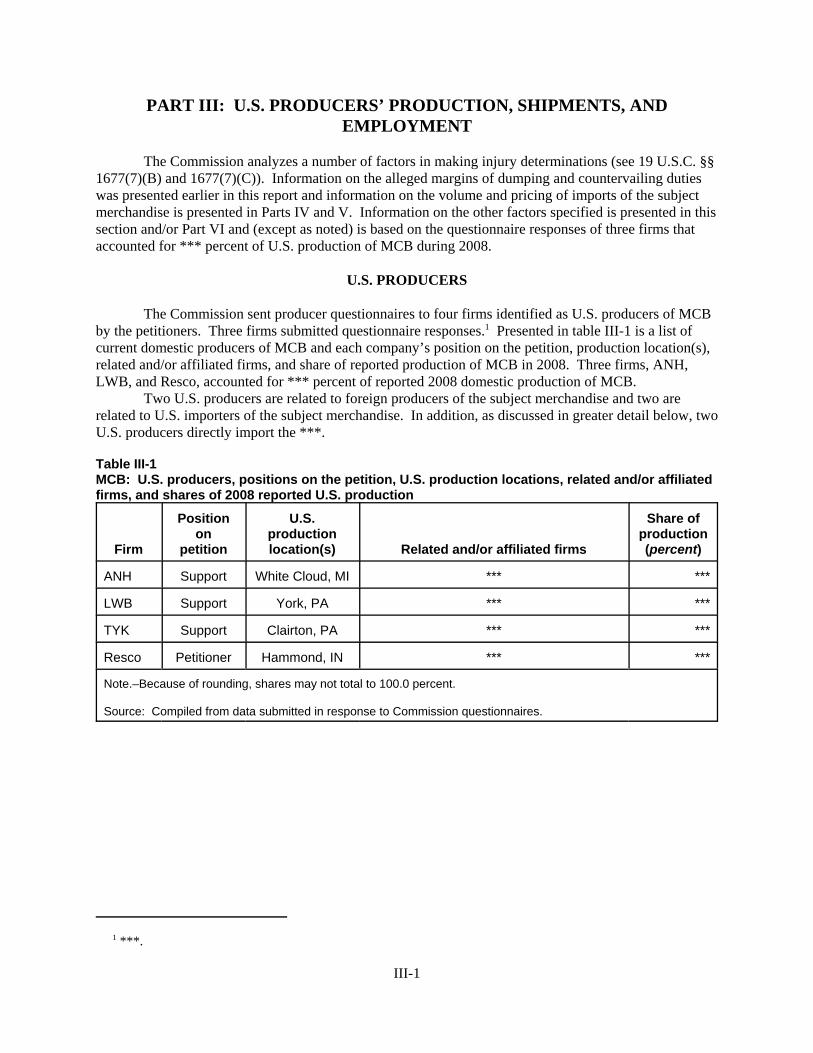
1 ***.
III-1
PART III: U.S. PRODUCERS’ PRODUCTION, SHIPMENTS, ANDEMPLOYMENT
The Commission analyzes a number of factors in making injury determinations (see 19 U.S.C. §§1677(7)(B) and 1677(7)(C)). Information on the alleged margins of dumping and countervailing dutieswas presented earlier in this report and information on the volume and pricing of imports of the subjectmerchandise is presented in Parts IV and V. Information on the other factors specified is presented in thissection and/or Part VI and (except as noted) is based on the questionnaire responses of three firms thataccounted for *** percent of U.S. production of MCB during 2008.
U.S. PRODUCERS
The Commission sent producer questionnaires to four firms identified as U.S. producers of MCBby the petitioners. Three firms submitted questionnaire responses.1 Presented in table III-1 is a list ofcurrent domestic producers of MCB and each company’s position on the petition, production location(s),related and/or affiliated firms, and share of reported production of MCB in 2008. Three firms, ANH,LWB, and Resco, accounted for *** percent of reported 2008 domestic production of MCB.
Two U.S. producers are related to foreign producers of the subject merchandise and two arerelated to U.S. importers of the subject merchandise. In addition, as discussed in greater detail below, twoU.S. producers directly import the ***.
Table III-1MCB: U.S. producers, positions on the petition, U.S. production locations, related and/or affiliatedfirms, and shares of 2008 reported U.S. production
Firm
Positionon
petition
U.S.productionlocation(s) Related and/or affiliated firms
Share ofproduction(percent)
ANH Support White Cloud, MI *** ***
LWB Support York, PA *** ***
TYK Support Clairton, PA *** ***
Resco Petitioner Hammond, IN *** ***
Note.–Because of rounding, shares may not total to 100.0 percent.
Source: Compiled from data submitted in response to Commission questionnaires.

2 ***. 3 ***. 4 ***.
III-2
U.S. CAPACITY, PRODUCTION, AND CAPACITY UTILIZATION
U.S. producers’ capacity, production, and capacity utilization data for MCB are presented in tableIII-2. These data show capacity to produce MCB remained steady from 2006 to 2008 and between theinterim periods January-June 2008 and January-June 2009. Production of MCB decreased by 3.4 percentfrom 2006 to 2008 and further decreased by 57.1 percent between the interim periods. Capacityutilization decreased by 1.5 percentage points from 2006 to 2008, and further decreased by 28.9percentage points between the interim periods.2
Table III-2MCB: U.S. capacity, production, and capacity utilization, 2006-08, January-June 2008, andJanuary-June 2009
Item
Calendar year January-June--
2006 2007 2008 2008 2009
Capacity (short tons) 160,903 160,903 160,903 80,451 80,451
Production (short tons) 72,895 71,125 70,441 40,633 17,412
Capacity utilization (percent) 45.3 44.2 43.8 50.5 21.6
Source: Compiled from data submitted in response to Commission questionnaires.
U.S. producers were asked if they had experienced any plant openings, relocations, expansions,acquisitions, consolidations, closures, or prolonged shutdowns because of strikes or equipment failure;curtailment of production because of shortages of materials; or any other change in the character of theiroperations or organization relating to the production of MCB since January 1, 2006. *** did not reportany such changes.3 *** reported the following:
* * * * * * *4
*** reported the production of other products on the same equipment and machinery and usingthe same production and related workers employed in the production of MCB. ***.
U.S. PRODUCERS’ SHIPMENTS
Data on domestic producers’ shipments of MCB are presented in table III-3. U.S. shipmentsaccounted for *** percent of U.S. producers’ total shipments of MCB in 2008, and *** percent in interim2009. There was no reported internal consumption. Transfers to related firms accounted for *** percentof U.S. producers’ total shipments of MCB in both 2008 and interim 2009. U.S. shipments increased by5.6 percent from 2006 to 2008, and decreased by 53.6 percent between the interim periods. The unitvalue of U.S. shipments increased by 17.1 percent from 2006 to 2008, and by 11.0 percent in the interimperiods. Exports of MCB were reported by ***. These exports decreased by *** percent from 2006 to2008, and decreased by *** percent between the interim periods. Exports accounted for *** percent ofU.S. producers’ total shipments during 2008, and *** percent in interim 2009. The export markets listedincluded ***.

III-3
Table III-3MCB: U.S. producers’ shipments, by types, 2006-08, January-June 2008, and January-June 2009
Item
Calendar year January-June--
2006 2007 2008 2008 2009
Quantity (short tons)
Commercial shipments *** *** *** *** ***
Transfers to related firms *** *** *** *** ***
U.S. shipments 59,180 58,074 62,470 35,111 16,284
Export shipments *** *** *** *** ***
Total shipments *** *** *** *** ***
Value (1,000 dollars)
Commercial shipments *** *** *** *** ***
Transfers to related firms *** *** *** *** ***
U.S. shipments 61,937 62,549 76,558 41,284 21,251
Export shipments *** *** *** *** ***
Total shipments *** *** *** *** ***
Unit value (per short ton)
Commercial shipments $*** $*** $*** $*** $***
Transfers to related firms *** *** *** *** ***
U.S. shipments 1,047 1,077 1,226 1,176 1,305
Export shipments *** *** *** *** ***
Total shipments *** *** *** *** ***
Share of quantity (percent)
Commercial shipments *** *** *** *** ***
Transfers to related firms *** *** *** *** ***
U.S. shipments *** *** *** *** ***
Export shipments *** *** *** *** ***
Total shipments 100.0 100.0 100.0 100.0 100.0
1 Not applicable.
Note.–Because of rounding, figures may not add to the totals shown.
Source: Compiled from data submitted in response to Commission questionnaires.
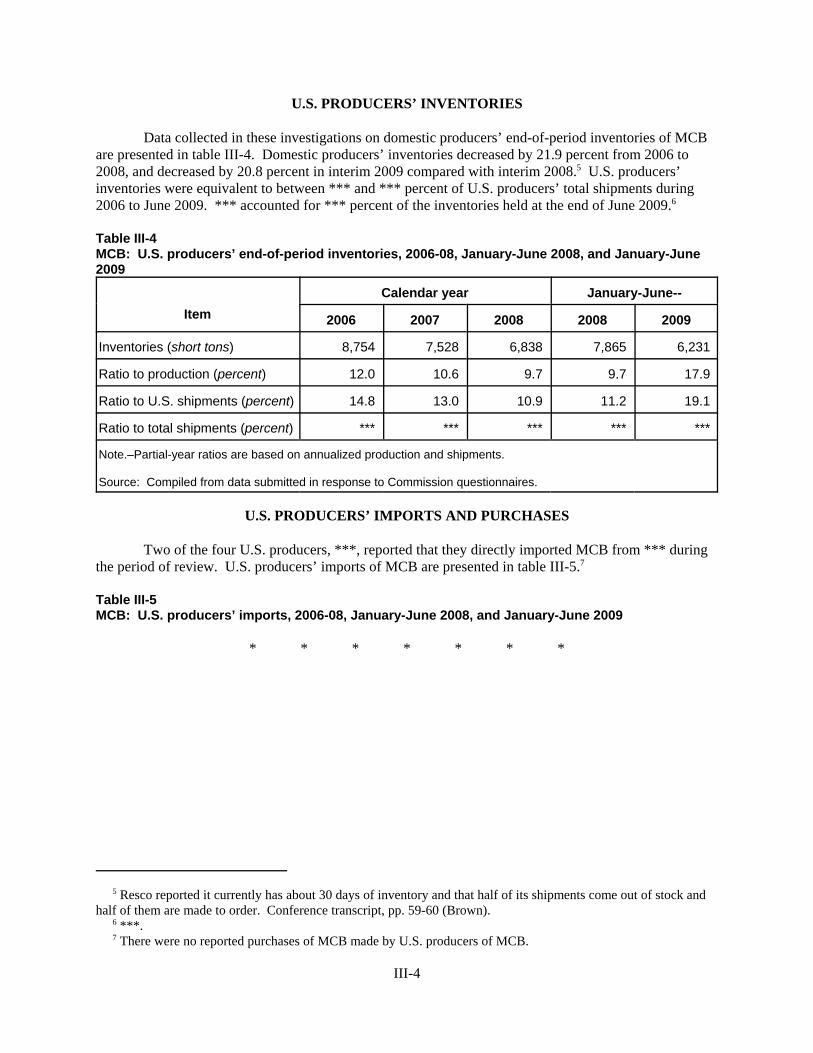
5 Resco reported it currently has about 30 days of inventory and that half of its shipments come out of stock andhalf of them are made to order. Conference transcript, pp. 59-60 (Brown). 6 ***. 7 There were no reported purchases of MCB made by U.S. producers of MCB.
III-4
U.S. PRODUCERS’ INVENTORIES
Data collected in these investigations on domestic producers’ end-of-period inventories of MCBare presented in table III-4. Domestic producers’ inventories decreased by 21.9 percent from 2006 to2008, and decreased by 20.8 percent in interim 2009 compared with interim 2008.5 U.S. producers’inventories were equivalent to between *** and *** percent of U.S. producers’ total shipments during2006 to June 2009. *** accounted for *** percent of the inventories held at the end of June 2009.6
Table III-4MCB: U.S. producers’ end-of-period inventories, 2006-08, January-June 2008, and January-June2009
ItemCalendar year January-June--
2006 2007 2008 2008 2009
Inventories (short tons) 8,754 7,528 6,838 7,865 6,231
Ratio to production (percent) 12.0 10.6 9.7 9.7 17.9
Ratio to U.S. shipments (percent) 14.8 13.0 10.9 11.2 19.1
Ratio to total shipments (percent) *** *** *** *** ***
Note.–Partial-year ratios are based on annualized production and shipments.
Source: Compiled from data submitted in response to Commission questionnaires.
U.S. PRODUCERS’ IMPORTS AND PURCHASES
Two of the four U.S. producers, ***, reported that they directly imported MCB from *** duringthe period of review. U.S. producers’ imports of MCB are presented in table III-5.7
Table III-5MCB: U.S. producers’ imports, 2006-08, January-June 2008, and January-June 2009
* * * * * * *

8 Resco reported that in addition to employee layoffs, its top four executives attending the conference have takena 65 percent compensation reduction since the middle of 2008. Conference transcript, p. 18 (Brown).
III-5
U.S. EMPLOYMENT, WAGES, AND PRODUCTIVITY
U.S. producers’ aggregate employment data for MCB are presented in table III-6. In theaggregate, U.S. MCB producers reported a decrease in the number of production and related workersemployed in the manufacture of MCB from 2006 to 2008, and in interim 2009 compared with interim2008. *** accounted for the major share of the decrease in number of employees from 2006 to 2008, and*** accounted for the majority of the decrease in interim 2009.8 Productivity fell in 2007 and then rose in2008 for an overall decrease of 3.8 percent, and decreased by 33.0 percent in interim 2009 compared withinterim 2008.
Table III-6MCB: U.S. producers’ employment-related data, 2006-08, January-June 2008, and January-June2009
Item
Calendar year January-June--
2006 2007 2008 2008 2009
Production and related workers (PRWs) 109 110 102 110 78
Hours worked by PRWs (1,000 hours) 226 239 227 122 78
Wages paid to PRWs (1,000 dollars) 6,081 6,441 6,420 3,460 2,095
Hourly wages $26.91 $26.95 $28.28 $28.36 $26.86
Productivity (short tons produced per 1,000 hours) 322.5 297.6 310.3 333.1 223.2
Unit labor costs (per short ton) $83.42 $90.56 $91.14 $85.15 $120.32
Source: Compiled from data submitted in response to Commission questionnaires.

1 The Commission sent questionnaires to those firms identified in the petition, along with firms that, based on areview of data provided by U.S. Customs and Border Protection (“Customs”), may have imported at least 100,000kilograms or greater than one percent of total imports under HTS subheading 6902.10.10 in any one year since 2006. 2 The Commission received an unusable questionnaire response from the firm ***, a customs broker. ***. TheCommission received a questionnaire response from ***, which reported imports of “taphole sleeves,” which areexcluded from the scope, therefore this questionnaire response was not used. The Commission receivedquestionnaire responses from 15 firms that reported that they did not import MCB during the period examined. Those firms are: ***. 3 Coverage for Chinese imports is derived from Petitioner’s estimate of total imports of MCB. Petition, exh. 3. 4 ***. 5 Only two firms reported imports from sources other than China and Mexico, ***. 6 MCB is classifiable in the Harmonized Tariff Schedule of the United States (“HTS”) under subheadings6815.91.00, 6815.99.00, 6902.10.10, and 6902.10.50. These HTS subheadings are residual or “basket” subheadingscovering MCB and other products. Chinese respondents report that the importer questionnaires received by the Commission provide goodcoverage and appear to account for all of the known major U.S. importers of subject imports, but do not have goodcoverage of nonsubject imports. Vesuvius and Yangkou Bayuquan’s postconference brief, pp. 8, 10-11. Respondent RHI reports that the data for U.S. producers is reasonably complete, but that imports of subject andnonsubject MCB are understated. Respondent RHI’s postconference brief, p. 12, fn. 34. Petitioner also reports thatquestionnaire responses understate the volume of U.S. imports, but argues that the data received renders themethodological problem moot because the volume shows imports to be significant. Petitioner’s postconferencebrief, pp.17-18. Commission staff believes that coverage for subject and nonsubject imports, while understated, is good. ***. 7 The remainder comes from ***.
IV-1
PART IV: U.S. IMPORTS, APPARENT CONSUMPTION, ANDMARKET SHARES
U.S. IMPORTERS
Importer questionnaires were sent to 46 firms believed to be importers of subject MCB, as well asto all U.S. producers of MCB.1 Usable questionnaire responses were received from 16 companies,2representing 80 percent of total imports from China and approximately 100 percent of total imports fromMexico.3 Table IV-1 lists all responding U.S. importers of MCB from China, Mexico, and other sources,their locations, and their shares of U.S. imports in 2008. In 2008, the largest importer of MCB fromChina was ***, the largest importer of MCB from Mexico was ***,4 and the only importer of MCB fromother sources was ***.5
U.S. IMPORTS
U.S. imports are based on questionnaire responses.6 Table IV-2 presents data for U.S. imports ofMCB from China, Mexico, and all other sources. China is the largest foreign supplier of MCB to theUnited States, accounting for *** percent of the quantity of total imports in 2008, and *** percent of thevalue. Mexico is the second-largest foreign supplier of MCB to the United States, accounting for ***percent of the quantity of total imports in 2008 and *** percent of the value.7
From 2006 to 2008, the quantity and value of imports of MCB from China increased by 11.0percent and 38.0 percent, respectively, then decreased by 59.4 percent and 56.3 percent, respectively, ininterim 2009 compared with interim 2008. The unit value of imports of MCB from China increased by24.4 percent from 2006 to 2008, and increased by 7.5 percent in interim 2009 compared with interim2008. From 2006 to 2008, the quantity and value of imports of MCB from Mexico decreased by ***
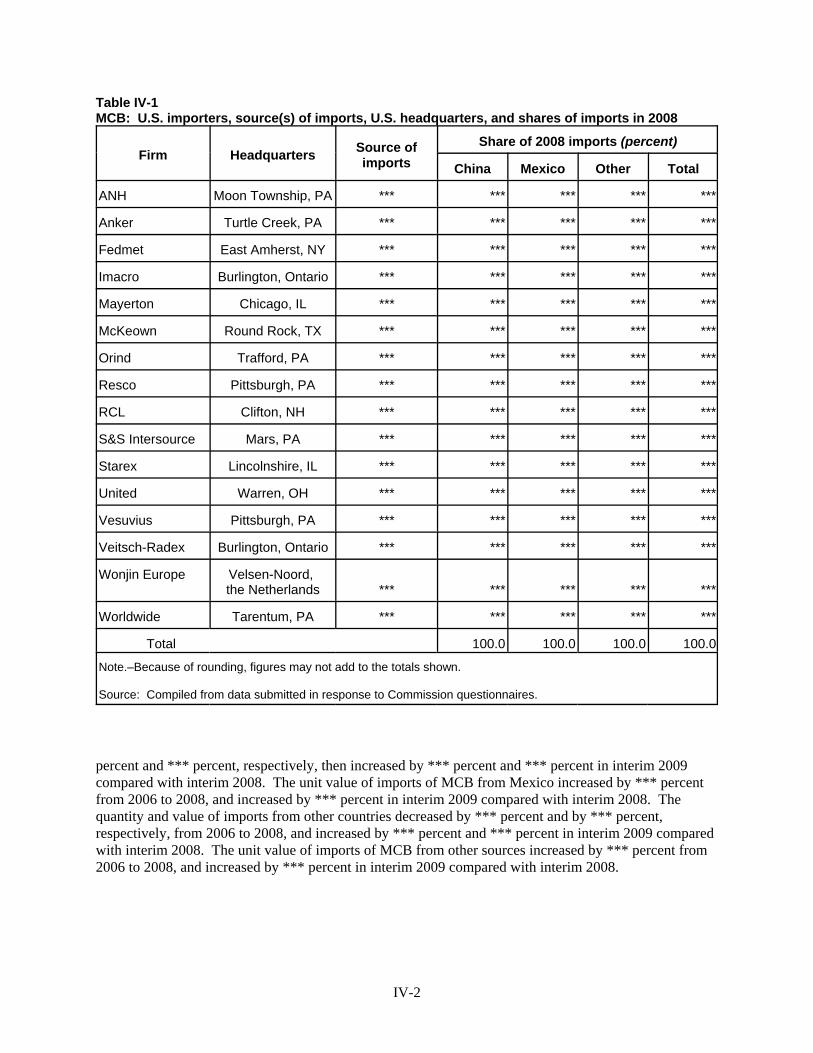
IV-2
Table IV-1MCB: U.S. importers, source(s) of imports, U.S. headquarters, and shares of imports in 2008
Firm Headquarters Source ofimports
Share of 2008 imports (percent)
China Mexico Other Total
ANH Moon Township, PA *** *** *** *** ***
Anker Turtle Creek, PA *** *** *** *** ***
Fedmet East Amherst, NY *** *** *** *** ***
Imacro Burlington, Ontario *** *** *** *** ***
Mayerton Chicago, IL *** *** *** *** ***
McKeown Round Rock, TX *** *** *** *** ***
Orind Trafford, PA *** *** *** *** ***
Resco Pittsburgh, PA *** *** *** *** ***
RCL Clifton, NH *** *** *** *** ***
S&S Intersource Mars, PA *** *** *** *** ***
Starex Lincolnshire, IL *** *** *** *** ***
United Warren, OH *** *** *** *** ***
Vesuvius Pittsburgh, PA *** *** *** *** ***
Veitsch-Radex Burlington, Ontario *** *** *** *** ***
Wonjin Europe Velsen-Noord, the Netherlands *** *** *** *** ***
Worldwide Tarentum, PA *** *** *** *** ***
Total 100.0 100.0 100.0 100.0
Note.–Because of rounding, figures may not add to the totals shown.
Source: Compiled from data submitted in response to Commission questionnaires.
percent and *** percent, respectively, then increased by *** percent and *** percent in interim 2009compared with interim 2008. The unit value of imports of MCB from Mexico increased by *** percentfrom 2006 to 2008, and increased by *** percent in interim 2009 compared with interim 2008. Thequantity and value of imports from other countries decreased by *** percent and by *** percent,respectively, from 2006 to 2008, and increased by *** percent and *** percent in interim 2009 comparedwith interim 2008. The unit value of imports of MCB from other sources increased by *** percent from2006 to 2008, and increased by *** percent in interim 2009 compared with interim 2008.

IV-3
Table IV-2MCB: U.S. imports, by sources, 2006-08, January-June 2008, and January-June 2009
Source
Calendar year January-June
2006 2007 2008 2008 2009
Quantity (short tons)
China 40,441 38,337 44,891 26,780 10,879
Mexico *** *** *** *** ***
Subtotal *** *** *** *** ***
Nonsubject *** *** *** *** ***
Total *** *** *** *** ***
Value (1,000 dollars)1
China 26,546 26,939 36,643 20,642 9,014
Mexico *** *** *** *** ***
Subtotal *** *** *** *** ***
Nonsubject *** *** *** *** ***
Total *** *** *** *** ***
Unit value (per short ton)1
China $656 $703 $816 $771 $829
Mexico *** *** *** *** ***
Subtotal *** *** *** *** ***
Nonsubject *** *** *** *** ***
Average *** *** *** *** ***
Share of quantity (percent)
China *** *** *** *** ***
Mexico *** *** *** *** ***
Subtotal *** *** *** *** ***
Nonsubject *** *** *** *** ***
Total *** *** *** *** ***
Share of value (percent)
China *** *** *** *** ***
Mexico *** *** *** *** ***
Subtotal *** *** *** *** ***
Nonsubject *** *** *** *** ***
Total *** *** *** *** ***1 Landed, U.S. port of entry, duty-paid.
Source: Compiled from data submitted in response to Commission questionnaires.
8 Petitioner’s postconference brief, p. 14. 9 Petitioner’s postconference brief, p. 15. 10 Table II-1. 11 Petitioner’s postconference brief, p. 16. 12 Respondents Vesuvius’ and Yingkou Bayuquan’s postconference brief, p. 28, fn. 93. 13 Respondent RHI’s postconference brief, p. 7. 14 Ibid., p. 8. 15 Sections 703(a)(1), 705(b)(1), 733(a)(1), and 735(b)(1) of the Act (19 U.S.C. §§ 1671b(a)(1), 1671d(b)(1),1673b(a)(1), and 1673d(b)(1)).
IV-4
CUMULATION CONSIDERATIONS
In assessing whether subject imports are likely to compete with each other and with the domestic like product with respect to cumulation, the Commission generally has considered the following fourfactors: (1) the degree of fungibility, including specific customer requirements and other quality-relatedquestions; (2) presence of sales or offers to sell in the same geographic markets; (3) common channels ofdistribution; and (4) simultaneous presence in the market. Channels of distribution and fungibility(interchangeability) are discussed in Part II of this report.
Petitioner has argued that U.S. imports of MCB from China and Mexico should be cumulated. Itreports that substitutability between domestic and subject imports is high and that imports from China andMexico are interchangeable.8 The Petitioner argues that the geographic market for the Chinese product isnational, and acknowledges that imports from Mexico enter largely through the Southwestern andSoutheastern regions of the United States, but that ***.9 Chinese, Mexican, and U.S. producers of MCBsell the majority of their product to end users.10 The petitioner also argues that imported MCB waspresent in the U.S. market simultaneously with U.S.-produced MCB.11
Chinese respondents have argued that decumulation is not warranted based upon the currentrecord and recommend that the Commission conduct its threat analysis on a cumulated basis.12 However,the Chinese respondents conclude that the threat analysis does not change for China regardless of whetherthe data are viewed cumulatively or on a decumulated basis. Mexican respondents have argued that thereis insignificant overlap between imports of MCB from Mexico and China, because the Mexican MCB issold in different geographic markets and in insignificant quantities. Imports of Mexican MCB aretransported overland to the Southeastern and Southwestern states and a few lower Midwestern states,whereas imports of MCB from China travel by ocean vessel to ports along both the east and west coastsand the north central region of the country.13 However, Mexican respondents conclude that the outcomeis the same whether imports from China and Mexico are cumulated or decumulated.14
NEGLIGIBILITY
The statute requires that an investigation be terminated without an injury determination if importsof the subject merchandise are found to be negligible.15 Negligible imports are generally defined in theTariff Act of 1930, as amended, as imports from a country of merchandise corresponding to a domesticlike product where such imports account for less than 3 percent of the volume of all such merchandiseimported into the United States in the most recent 12-month period for which data are available thatprecedes the filing of the petition or the initiation of the investigation. However, if there are imports ofsuch merchandise from a number of countries subject to investigations initiated on the same day thatindividually account for less than 3 percent of the total volume of the subject merchandise, and if theimports from those countries collectively account for more than 7 percent of the volume of all suchmerchandise imported into the United States during the applicable 12-month period, then imports

16 Section 771(24) of the Act (19 U.S.C. § 1677(24)). 17 Conference transcript, p. 13 (Brown) and p. 119 (J.Stein). 18 Petitioner’s postconference brief, p. 9. 19 Respondent Vesuvius’ and Yingkou Bayuquan’s postconference brief, p. 6. Respondent RHI’s postconferencebrief, p. 10.
IV-5
from such countries are deemed not to be negligible.16 Imports from China accounted for *** percent oftotal imports of MCB by quantity during July 2008 - June 2009. Imports from Mexico accounted for ***percent of total imports of MCB by quantity during July 2008 - June 2009.
APPARENT U.S. CONSUMPTION
Data concerning apparent U.S. consumption of MCB during the period of investigation shown intable IV-3 and figure IV-1 are based on questionnaire responses. The quantity of apparent U.S.consumption increased by *** percent from 2006 to 2008, and then decreased by *** percent in interim2009 compared with interim 2008. The steel industry is the sole end-use market for MCB, where they areused for the linings of ladles, electric arc furnaces, and basic oxygen furnaces.17 The strong demand forMCB stopped around the fourth quarter of 2008 with the onset of the recession and the steep decline inU.S. steel production.18 Steel production declined by 50 percent in the first half of 2009 compared withthe same period in 2008.19
U.S. MARKET SHARES
U.S. market share data are presented in table IV-4. The quantity of the U.S. producers’ marketshare decreased by *** percentage points from 2006 to 2008 and by was *** percentage points lower ininterim 2009 compared with interim 2008. In contrast, the share of subject imports from China increasedfrom *** percent in 2006 to *** percent in 2008, on the basis of quantity, and increased from *** percentin interim 2008 to *** percent in interim 2009. The share of subject imports from Mexico decreasedfrom *** percent in 2006 to *** percent in 2008, then increased from *** percent in interim 2008 to ***percent in interim 2009. Nonsubject imports’ market share decreased from *** percent in 2006 to ***percent in 2008, and decreased to less than *** percent in interim 2009 compared with *** percent ininterim 2008.

IV-6
Table IV-3MCB: U.S. shipments of domestic product, U.S. shipments of imports, and apparent U.S.consumption, 2006-08, January-June 2008, and January-June 2009
Item
Calendar year January-June
2006 2007 2008 2008 2009
Quantity (short tons)
U.S. producers’ U.S. shipments 59,180 58,074 62,470 35,111 16,284
U.S. shipments of imports from–China 32,976 36,184 42,072 26,899 15,682
Mexico *** *** *** *** ***
Subtotal *** *** *** *** ***
Nonsubject countries *** *** *** *** ***
Total U.S. import shipments *** *** *** *** ***
Apparent U.S. consumption *** *** *** *** ***
Value (1,000 dollars)
U.S. producers’ U.S. shipments 61,937 62,549 76,558 41,284 21,251
U.S. shipments of imports from--China 25,460 30,057 37,905 23,323 15,329
Mexico *** *** *** *** ***
Subtotal *** *** *** *** ***
Nonsubject countries *** *** *** *** ***
Total U.S. import shipments *** *** *** *** ***
Apparent U.S. consumption *** *** *** *** ***
Note.–Because of rounding, figures may not add to the totals shown.
Source: Compiled from data submitted in response to Commission questionnaires.
Figure IV-1MCB: Apparent U.S. consumption, by sources, 2006-08, January-June 2008, and January-June2009
* * * * * * *
Table IV-4MCB: U.S. consumption and market shares, 2006-08, January-June 2008, and January-June 2009
* * * * * * *
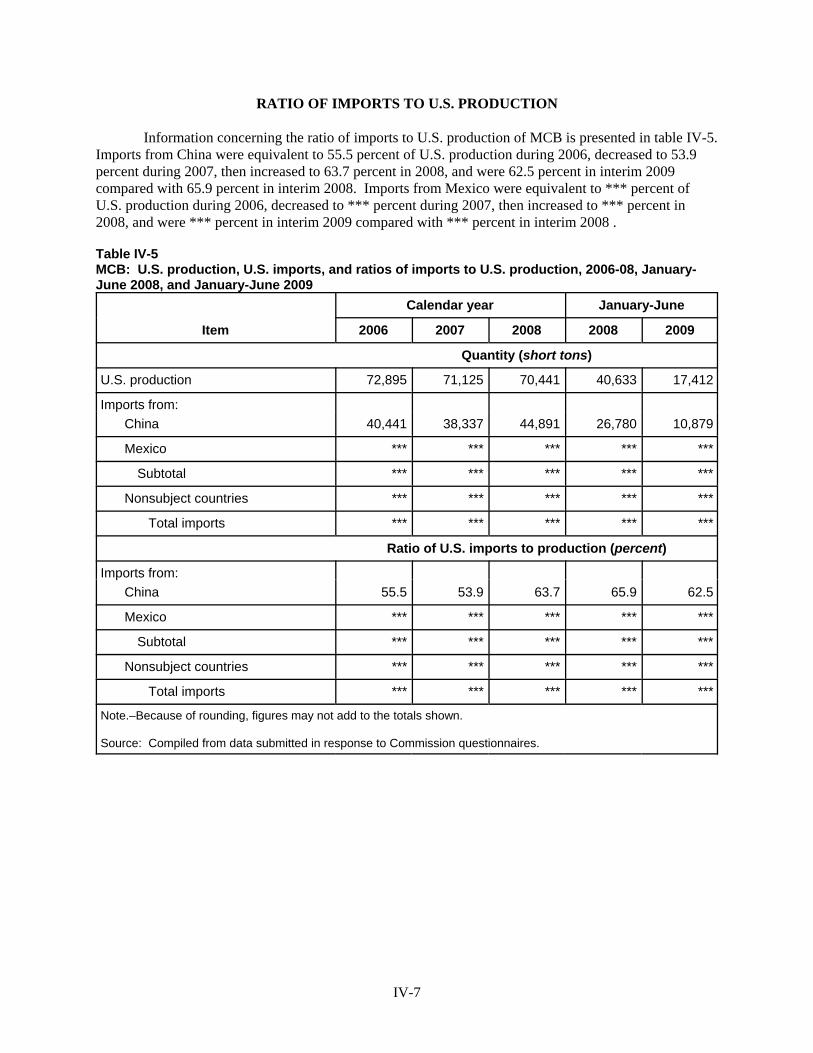
IV-7
RATIO OF IMPORTS TO U.S. PRODUCTION
Information concerning the ratio of imports to U.S. production of MCB is presented in table IV-5. Imports from China were equivalent to 55.5 percent of U.S. production during 2006, decreased to 53.9percent during 2007, then increased to 63.7 percent in 2008, and were 62.5 percent in interim 2009compared with 65.9 percent in interim 2008. Imports from Mexico were equivalent to *** percent ofU.S. production during 2006, decreased to *** percent during 2007, then increased to *** percent in2008, and were *** percent in interim 2009 compared with *** percent in interim 2008 .
Table IV-5MCB: U.S. production, U.S. imports, and ratios of imports to U.S. production, 2006-08, January-June 2008, and January-June 2009
Item
Calendar year January-June
2006 2007 2008 2008 2009
Quantity (short tons)
U.S. production 72,895 71,125 70,441 40,633 17,412
Imports from:China 40,441 38,337 44,891 26,780 10,879
Mexico *** *** *** *** ***
Subtotal *** *** *** *** ***
Nonsubject countries *** *** *** *** ***
Total imports *** *** *** *** ***
Ratio of U.S. imports to production (percent)
Imports from:China 55.5 53.9 63.7 65.9 62.5
Mexico *** *** *** *** ***
Subtotal *** *** *** *** ***
Nonsubject countries *** *** *** *** ***
Total imports *** *** *** *** ***
Note.–Because of rounding, figures may not add to the totals shown.
Source: Compiled from data submitted in response to Commission questionnaires.


1 Petitioner’s postconference brief, pp. 5-6 and exh. 12. 2 Staff telephone interview with ***, September 2, 2009. 3 Ibid. 4 Industry Study 2309: Refractories, The Freedonia Group, Inc. (February 2008), pp. 25-26 and table II-4,attached in Exhibit S-4 of Petitioner’s Responses to Questions Regarding Additional Subsidy Allegations, August 7,2009.
V-1
PART V: PRICING AND RELATED INFORMATION
FACTORS AFFECTING PRICES
Raw Material Costs
Raw material costs accounted for approximately 74 percent of the total cost of goods sold forU.S. producers during 2006 to 2008. Per unit raw material costs fell by 2 percent between 2006 and 2007and then increased by 26 percent between 2007 and 2008 and by 9 percent in interim 2009 compared tointerim 2008. Magnesia is the main raw material used to produce MCB. Petitioner indicates that itpurchases *** used in the production of MCB. Petitioner’s prices for ***.1 ***.2 ***.3 In February2008, the Freedonia Group projected that the price of refractories made of magnesite and chrome wouldincrease by 18 percent between 2006 and 2011 and by 15 percent between 2011 and 2016.4
U.S. Inland Transportation Costs
Transportation costs for U.S. inland shipments of MCB generally account for a small-to-moderateshare of the delivered price of these products. U.S. producers reported that the costs ranged from 4 to 7percent of the delivered price for MCB, while U.S. importers reported that the costs ranged from 2 to 14percent of the delivered price for MCB.
PRICING PRACTICES
Pricing Methods
All producers reported using transaction-by-transaction negotiations for some of their sales ofMCB, with one producer (***) reporting using a price list and another, (***,) reporting using contracts. Most importers reported that the prices that they charge for their sales are determined using transaction-by-transaction negotiations, although a few reported using contracts and price lists. The remainingresponding producers and importers make their sales on both f.o.b. and delivered bases. Both respondingproducers and four of 12 importers reported that at least 50 percent of their sales of MCB were frominventory. Seven of 12 responding importers reported that at least 95 percent of their sales are made toorder.
One of two responding producers and seven of 14 responding importers reported making at least69 percent of their sales on a short-term contract basis, with these contracts lasting from three months toone year. Four of 14 responding importers reported making at least 75 percent of their sales on a spotbasis. One producer, (***,) and two importers, (***,) reported making about one-half of their sales on along-term contract basis, with ***’s contracts lasting two to three years and ***’s contracts lasting 6months to one year.

V-2
Lead Times
U.S. producers reported lead times from inventory ranging from one to three days and lead timesfor sales of product-to-order of one to eight weeks. Lead times for delivery for all but one respondingU.S. importer ranged from one day to one week on sales from inventory and most importers reported leadtimes on sales of product produced-to-order ranging from 8 to 14 weeks. All but one respondingproducer and all responding importers reported that they generally arrange for the transportation to theircustomers’ locations. Both responding U.S. producers and five of 14 responding importers reportedmaking at least 60 percent of their sales within 101 to 1,000 miles of their storage or production facilities. Three of 14 responding importers reported making all of their sales over 1,000 miles from their storage orproduction facilities and five of 14 responding importers reported making at least 60 percent of their saleswithin 1,000 miles of their storage or production facilities.
Sales Terms and Discounts
One of three responding producers and 8 of 14 responding importers indicated that they do notoffer discounts for their sales of MCB. The other remaining producers and importers reported the use ofquantity discounts, annual volume discounts, or providing discounts on a case-by-case basis. Two ofthree reporting producers and two of 12 importers reported making all of their sales of MCB on an f.o.bbasis. Seven of 12 responding importers reported using a delivered basis for at least most of theirshipments.
PRICE DATA
The Commission requested U.S. producers and importers of MCB to provide quarterly data forthe total quantity and f.o.b. value of MCB that was shipped to unrelated customers in the U.S. marketduring January 2006-June 2009. The products for which pricing data were requested are as follows:
Product 1.--Resin bonded, magnesia-carbon brick for electric arc furnaces with a carbon contentof 13 percent, fused grain and antioxidant additions that correspond to Resco’s brand Nuline10-99, with the following dimensions: 13½ x 6 x 3 No. 1 key.
Product 2.--Resin bonded, magnesia-carbon brick for ladles with a carbon content of 10 percent,fused grain and antioxidant additions that correspond to Resco’s brand Maxline 10 DFZ with thefollowing dimensions: SU 6 x 60 x 100 mm.
Product 3.--Resin bonded, magnesia-carbon brick for ladles with a carbon content of 10 percent,fused grain and antioxidant additions that correspond to Resco’s brand Maxline 10 AFX, with thefollowing dimensions: 7 x (6-5½) x 3 inch mini key.
Three U.S. producers, 11 importers of MCB from China, and one importer of MCB from Mexicoprovided usable pricing data for sales of the requested products, although not all firms reported pricing forall products for all quarters. Pricing data reported by these firms accounted for approximately 24.8percent of U.S. producers’ shipments of MCB, 17.2 percent of U.S. shipments of subject imports fromChina, and *** percent of U.S. shipments of subject imports from Mexico in 2008.
Several importers of Chinese MCB reported price data for products that did not exactly meet thespecifications of one of these price products, but they felt were competitive with one of the specified
5 For product 1, *** reported data for a product specified as “resin bonded MC, elec.-arc furnace, carbon ***%,fused grain, ***, 18x6x3 key. *** reported data for “EAF MCB, ***. *** reported data for a product for which“shape and quality used for comparison is similar to the requested example.” *** indicated that “*** has reasonablycomparable specifications for Products 1 and 2 as demonstrated in the product specifications below. In addition,since *** product sizes do not match the sizes selected in the pricing categories, *** has provided quantities andvalues that combine all sizes of the relevant specification. Although prices vary on a per piece basis because of sizedifferences, there is no significant difference among sizes on a per-ton basis. *** reported data for a product with the“same dimensions but carbon contents of ***.
For product 2, *** reported data for a product specified as “resin bonded MC, ladles, carbon ***%, fusedgrain, ***.” *** indicated that it does not “have exact knowledge of RESCO products but our MCB slag lines arewith ***. *** indicated that “shape is the same, but quality may differ slightly due to lack of mix details” for theproduct for which it provided data. As noted for product 1, *** has provided quantities and values that combine allsizes of the relevant specification. *** indicated that the product it provided data for had the “same dimensions butcarbon contents of ***.”
For product 3, *** provided data for a product for which, “shape is a mini-key in similar style but not exactshape.” 6 Petitioner’s postconference brief, exhibit 1, p. 6. 7 Respondent Vesuvius and Yingkou Bayuquan’s postconference brief, p. 17. 8 Ibid., p. 17 and 19, fn. 69. 9 Respondent RHI’s postconference brief, p. 19. 10 ***.
Price trends and margins of underselling and overselling are similar for products 2 and 3 combined (with*** data included), as they are for products 2 and 3 separately (without *** data). However, the relative quantitiesreported by U.S. producers and importers (excluding ***), for products 2 and 3 were different. For U.S. producers(not including ***), quantities reported for product 3 were more than *** times those reported for product 2 (and nosales of product 2 were reported for 2006). However, for imports, quantities reported were much higher for product2 than product 3. For China, quantities reported for product 2 were about *** times those reported for product 3(this does not include ***). Data for Mexico were reported ***.
V-3
products.5 Petitioner indicates that in these cases, reported product descriptions differed from thespecified product descriptions by only *** and that such small differences would not have anymeaningful impact on product prices.6 Vesuvius and Yingkou Bayuquan respondents cited the difficultythat questionnaire respondents had in identifying which of their products conformed most closely to theprice products as one among several reasons why the Commission should regard the apparent absolutemargins of underselling with some caution.7 However, they also indicated that quarterly pricing data as awhole confirm the trends evident from import shipment unit value data and regarding product 2, thatgiven the vast diversity of products and the degree to which this mix is customized to particularcustomers’ requirements, it may be difficult to establish pricing categories that will be morerepresentative of actual competition than product 2.8 RHI respondents indicated that prices reported byimporters may vary substantially and differ materially from prices reported by petitioner and possiblyother domestic producers because the pricing product descriptions were most vague in describing thecomposition of the products, where variations will have a significant impact on price.9
Price Trends
Price data are shown in tables V-1 to V-2 and figure V-1. Data for products 2 and 3 arecombined since ***, was unable to provide separate data for the two products.10
Weighted-average sales prices for U.S.-produced MCB increased by 4.4 percent to 15.2 percent,while weighted-average sales prices for products imported from China and Mexico increased by 10.9percent to 28.7 percent (see table V-3).

V-4
Table V-1MCB: Weighted-average f.o.b. prices and quantities of domestic and imported product 11 andmargins of underselling/(overselling), by quarters, January 2006-June 2009
* * * * * * *
Table V-2MCB: Weighted-average f.o.b. prices and quantities of domestic and imported products 21 and 32
(combined) and margins of underselling/(overselling), by quarters, January 2006-June 2009
PeriodUnited States China Mexico
Price (per ton)
Quantity(tons)
Price (per ton)
Quantity(tons)
Margin(percent)
Price (per ton)
Quantity(tons)
Margin(percent)
2006: Jan.-Mar. $*** *** $936 1,052 *** $*** *** ***
Apr.-June *** *** 920 1,102 *** *** *** ***
July-Sept. *** *** 912 1,362 *** - 0 -
Oct.-Dec. *** *** 898 1,263 *** - 0 -
2007: Jan.-Mar. *** *** 914 1,731 *** - 0 -
Apr.-June *** *** 939 1,643 *** - 0 -
July-Sept. *** *** 929 1,659 *** *** *** ***
Oct.-Dec. *** *** 958 1,195 *** *** *** ***
2008: Jan.-Mar. *** *** 986 1,835 *** - 0 -
Apr.-June *** *** 1,035 1,546 *** *** *** ***
July-Sept. *** *** 1,079 1,463 *** *** *** ***
Oct.-Dec. *** *** 1,090 890 *** *** *** ***
2009: Jan.-Mar. 1,204 139 1,100 884 *** - 0 -
Apr.-June *** *** 1,099 1,108 *** - 0 -
1 Product 2: Resin bonded, magnesia-carbon brick for ladles with a carbon content of 10 percent, fused grainand antioxidant additions that correspond to Resco's brand Maxline 10 DFZ with the following dimensions: SU 6 x60 x 100 mm. 2 Product 3: Resin bonded, magnesia-carbon brick for ladles with a carbon content of 10 percent, fused grainand antioxidant additions that correspond to Resco's brand Maxline 10 AFX, with the following dimensions: 7 x(6-5½) x 3 inch mini key.
Source: Compiled from data submitted in response to Commission questionnaires.

11 The following are the results if price data for products 2 and 3 are not combined (thus excluding *** data forthese products). Prices for MCB imported from China were below those for U.S.-produced MCB in 33 of 36instances; margins of underselling ranged from 0.2 to 25.3 percent. Prices for MCB imported from China werehigher in 3 instances, with margins of overselling ranging from 0.9 to 27.5 percent. Prices for MCB imported fromMexico were below those for U.S.-produced MCB in 10 of 11 instances; margins of underselling ranged from 0.4 to29.6 percent. Prices for MCB imported from Mexico were higher in one instance with a margin of overselling of22.8 percent.
V-5
Figure V-1MCB: Weighted-average f.o.b. prices and quantities of domestic and imported product, byquarters, January 2006-June 2009
* * * * * * *
Source: Tables V-1 to V-2.
Table V-3MCB: Summary of weighted-average f.o.b. prices for products 1, 2, and 3 from the United States,China, and Mexico
Item Number ofquarters
Low price (per ton)
High price(per ton)
Change in price1
(percent)Product 1 United States 14 1,007 1,376 15.2China 14 889 1,368 10.9Mexico *** *** *** ***Products 2 and 3United States 14 966 1,226 4.4China 14 898 1,100 17.4Mexico *** *** *** *** 1 Percentage change from the first quarter in which price data were available to the last quarter in which price datawere available, based on unrounded data.
Source: Compiled from data submitted in response to Commission questionnaires.
Price Comparisons
Margins of underselling and overselling for the period are presented in table V-4.11 As can beseen from the table, prices for MCB imported from China were below those for U.S.-produced MCB in27 of 28 instances; margins of underselling ranged from 0.8 to 21.0 percent. In the remaining instance,prices for MCB from China were 27.5 percent above prices for the domestic product. Prices for MCBimported from Mexico were below those for U.S.-produced MCB in 12 of 13 instances; margins ofunderselling ranged from 4.7 to 32.1 percent. In the remaining instance, prices for MCB from Mexicowere 22.8 percent above prices for the domestic product.

12 Any pre-petition allegations submitted in petitioner’s producer questionnaire response were not included orverified. 13 Conference transcript, pp. 116-117 (J. Stein).
V-6
Table V-4MCB: Instances of underselling/overselling and the range and average of margins, January2006-June 20091
Source
Underselling Overselling
Number ofinstances
Range(percent)
Averagemargin
(percent)Number ofinstances
Range(percent)
Averagemargin
(percent)
China 27 0.8 to 21.0 11.1 1 - 27.5
Mexico 12 4.7 to 32.1 16.7 1 - 22.8
Total 39 0.8 to 32.1 12.8 2 25.1 1 Based on data for products 2 and 3 combined.
Source: Compiled from data submitted in response to Commission questionnaires.
LOST SALES AND LOST REVENUES
The Commission requested U.S. producers of MCB to report any instances of lost sales orrevenues they experienced due to competition from imports of MCB from China and/or Mexico duringJanuary 2006-June 2009. Petitioner provided both allegations of lost sales and revenues in the petition. Of the two responding non petitioning U.S. producers (*** and ***), neither reported that it had to eitherreduce prices or roll back announced price increases. One of these producers (***) indicated that ***.However, both of these producers indicated that they had lost sales of MCB to imports from China andMexico and provided lost sales allegations. The 15 lost sales allegations totaled $4.7 million and involved4,482 tons and the four lost revenues allegations totaled $419,547 and involved 1,335 tons of MCB.12 Staff contacted 14 purchasers and a summary of the information obtained follows (tables V-5 and V-6).
Table V-5MCB: U.S. producers’ lost sales allegations
* * * * * * *
Table V-6MCB: U.S. producers’ lost revenue allegations
* * * * * * *
S&S Intersource indicates that it is important to examine whether the lost sales and revenueallegations involve integrated steel mill or steel mills with electric arc furnaces.13 S&S Intersource feelsthat many of Resco’s long term relationships were with integrated steel mills selling BOF linings and theladles in those BOF plants, and that if “ET Works, Fairfield, Granite City, the big mills on the lakes inMichigan, and Sparrows Point” represent a significant portion of Resco’s customer base, they lost volume

14 Transcript, pp. 119-120 (Joseph Stein). S&S Intersource also indicated that in some cases Resco may have hada terrible payment history with some mills and indicated that it would provide details in a postconferencesubmission. However, S&S Intersource did not make a postconference submission. 15 Staff telephone interview with ***, August 14, 2009. 16 E-mail from ***, August 17, 2009. 17 E-mail from ***, August 24, 2009. 18 ***.
V-7
because the steel mills that they serve shut down.14 Of the purchasers named in lost sales and lost revenueallegations, *** are integrated steel mills. ***.
***, indicated that the company could only track transactions *** for the lost sales allegationmade by *** and involving *** and that it was possible that he company purchased product originatingfrom the alleged source ***. ***.15 ***.16 After further checking *** records, *** indicated that prior to*** did not purchase the product from ***.17
*** agreed with the two lost sales allegation involving his firm made by ***, but indicated thatthe alleged prices were higher. ***.
*** disagreed with the sales allegation made by *** involving *** tons of MCBs. ***. ***indicated that the decision to purchase from a Chinese source was based more on technical specificationsrather than price. *** indicated that his firm reviewed the technical specifications and decided that theChinese brick formulation best suited its operational parameters. He indicated that the prices quoted bythe Chinese supplier were about *** percent below the price quoted by the U.S. supplier, but that this isnot a true comparison because the brick specifications were not the same resulting in one of the mainreasons for the difference in price. *** indicated that the U.S. supplier is a key supplier to his businessand that in 2008 ***.
*** disagreed with the lost allegation made by ***. *** indicated that the sale was lost due toservice issues, not price.
*** disagreed with the lost sales allegation involving ***. They indicated that this was a trialorder. They also indicated that the price provided in the allegation is comparable to those offered byother suppliers of U.S.-produced MCB and imports of MCB except for ***.
Regarding the lost sales allegation made by *** indicated his firm had purchased MCB from ***,and has preferred to source its material inputs domestically. *** approached *** and stated that it wasnot particularly interested in supplying *** with magnesia brick. *** indicated that ***. He indicatedthat only after *** informed his company of its decision to not actively solicit its business did hiscompany seek to source magnesia brick from other vendors and in this case a Chinese vendor. ***indicated that his current price from his suppliers of Chinese-origin magensia bricks is approximately ***percent higher than the price at which it was procuring bricks from ***.
*** indicated that he purchased both U.S.-produced MCB and MCB imported from Mexico. ***.18 He also currently purchases MCB from *** (the U.S. producer that made the lost sales allegation),***. He indicated that “price was not the bottom line” in making his purchase decision, but that price,quality, and service all are important factors. He indicated that he strives for *** and that imports ofMCB from Mexico are priced “a little lower” than from other sources. He indicated that service is goodfrom ***. He also indicated that part of his decision to purchase from *** is based on the relationshipand familiarity he has with the company ***. He indicated that *** has higher-priced products than ***and that its service is not as good as other suppliers since it does not have ***. He also indicated that henever relies totally on one supplier and that he never purchases MCB ***.
*** indicated that he had purchased or considered quotes for MCB imported from China for somebut not all of the products listed in the lost revenue allegation made by ***. For the *** productsspecified in the allegation, *** indicated that he did not consider any quotes for MCB imported fromChina and only considered quotes for domestically produced MCB. For the other products mentioned inthe allegation, he indicated that the alleged quotes for the imported product were pretty close to the actual

19 Staff telephone interview with ***, August 11, 2009.
V-8
quotes. Although he has purchased MCB imported from China, he indicated that he will only usedomestically produced magnesia carbon bricks in some parts of his furnace ***.19 *** indicated thatbecause of ***, he currently requires various suppliers to *** indicated that the quality of the product isthe most important factor in determining from what source he will purchase and that service and price areequally considered as the second-most important factors in determining a purchase. He indicated that hetypically ***, and that quality and service for U.S.-produced MCB and MCB imported from China arecomparable.
*** agreed with the lost sales allegation made by *** involving his firm. However, he indicatedthat the alleged competing prices were larger. ***. All of these revised prices were below the allegedrejected U.S. prices for each of these products.
*** indicated that he did not recognize the quantities or dollar amounts regarding the two lostrevenue allegations involving his company made by ***. He indicated that he purchases somerefractories from ***, but the date provided and the large dollar amounts are not familiar to him. *** isunaware of any domestic suppliers that are losing sales or revenue regarding any recent/current purchases.
In a staff interview on August 26, 2009, *** indicated that *** could neither confirm nor denythe lost sales allegation involving *** made by *** because the company does not keep records in a waythat would allow it to confirm or deny the allegation.

1 The firms are: ANH, LWB, and Resco. TYK America ***. Letter from TYK America, Inc., August 10, 2009. Each of the reporting firms has a fiscal year that ends on or about December 31. There are minor differencesbetween data reported in the trade and financial sections of the Commission’s producers’ questionnaire, which areattributable to rounding. 2 During the period for which data were collected COGS was primarily affected by changes in raw material costs.The average unit value (“AUV”) of sales was higher in 2007 compared with 2006 while the AUVs of raw materialsand COGS were lower; sales AUV was higher in 2008, nearly matched by the increase in the AUV of raw materialsin that year compared with 2007 (the increase in the AUV of total COGS exceeded that of sales in 2008 becauseother factory costs and direct labor also increased). Finally, the sales AUV was *** higher in interim 2009compared to interim 2008, and the increase in sales AUV was *** greater than the increase in the AUVs of rawmaterials or total COGS. 3 The SG&A expense-to-sales ratio and AUVs were *** for the 2006-08 period for ***, but these measures were***. ***. 4 Net income before taxes is calculated after deducting interest charges (the largest single item) and otherexpenses and adding other income items to operating income. Cash flow is the sum of net income plus depreciation.***. U.S. producers’ questionnaire responses, III-11.
VI-1
PART VI: FINANCIAL EXPERIENCE OF U.S. PRODUCERS
BACKGROUND
Three U.S. firms provided usable financial data on their operations producing MCB.1 Thesereported data are believed to represent over *** percent of U.S. MCB production during 2008.
OPERATIONS ON MCB
Income-and-loss data for the reporting U.S. producers of MCB are presented in table VI-1. Thequantity, value, and average unit value (“AUV”) of total net sales increased from 2006 to 2007. Althoughthe quantity of total net sales declined *** from 2007 to 2008, sales value increased because of ***higher average unit values. In interim 2009 compared with interim 2008, total net sales were *** lower(down *** percent and *** percent by quantity and value, respectively because of the falloff in raw steelproduction) although sales unit values were higher. The absolute values of the cost of goods sold(“COGS”) and selling, general, and administrative (“SG&A”) expenses followed the trend of sales,increasing from 2006 to 2008, and were lower in interim 2009 than in interim 2008. The AUV of COGSdeclined from 2006 to 2007 (unlike sales, which rose) but was *** higher in 2008 from 2007; it wasgreater in interim 2009 than in interim 2008 (like sales).2 The COGS-to-sales ratio declined between2006 and 2007 but increased in 2008 for a net gain of about *** over the level in 2006; the ratio was ***lower in interim 2009 than in interim 2008. The AUV of SG&A expenses rose *** from 2006 to 2007and rose once more in 2008 from 2007; it was *** higher in interim 2009 than interim 2008 and led to theindustry’s ***. The SG&A expense-to-sales ratio was *** lower in 2008 compared to 2006 but was ***higher in interim 2009 than in interim 2008.3 For the three firms together, operating income *** from2006 to 2007 as sales increased due to demand from steel industry end users and costs did not increaseproportionately, but operating income fell back in 2008 to nearly the level in 2006. One factoraccounting for the increase in operating income between 2006 and 2008 was that ***. Operating incomewas *** lower (***) in interim 2009 compared with interim 2008 because ***; moreover, ***. Netincome before taxes and cash flow increased from 2006 to 2007 and fell in 2008; net income was negativein 2008 and both interim periods. Cash flow was *** in interim 2008 and negative in interim 2008.4

5 Natural gas and electricity also are used in the production process. Petition, exh. 11. Also, see Petitioner’spostconference brief, exh. 1, pp. 5-6 and exh. 12 (***). 6 Calculated from the questionnaire responses of the three firms, III-11. The upward price trend for magnesia rawmaterials during 2005-08 is depicted in exh. 12 of petitioner’s postconference brief, ***. Reportedly, purchases ***. Staff interview with ***, September 2, 2009. 7 Conference transcript, p. 54 (Brown). Also, ***. Resco’s U.S. producers’ questionnaire response, IV-15, andPetitioner’s postconference brief, exh. 1, p. 7. ***. 8 Resco argues that its profitability declined as prices could not be increased to keep up with escalating Chineseraw material costs for key inputs of MCB (magnesia and graphite), while imports of MCB were selling at less thanfair value. Conference transcript, p. 38 (Magrath) and Petitioner’s postconference brief, exh. 12. AdditionallyResco referred to U.S. proposed consultations on Chinese export restraints under Section 301 (USTR filing with theWTO in June 2009) and a private lawsuit alleging price fixing by an export cartel. Conference transcript, p. 38(Magrath). See Resco’s responses to Commerce’s questions regarding additional subsidy allegations, letter datedAugust 7, 2009, pp. 3-5; Freedonia Refractory Industry Study 2008, exh. S-4; and Expert Report ConcerningDamages, exh. S-5. 9 ANH ***. EDIS document 409563. 10 In 2008, ANH reported ***.
VI-2
Table VI-1MCB: Results of operations of U.S. producers, 2006-08, January-June 2008, and January-June2009
* * * * * * *
Raw materials utilized in the production of MCB include such inputs as magnesite, aluminum andsilicon powdered metal, carbon, and resin.5 COGS were mostly affected by changes in raw material costs. Raw material costs declined *** from 2006 to 2007 but rose in absolute value, as a percentage of netsales, and on a per-unit basis from 2007 to 2008. On a per-unit basis, raw material costs were higher ininterim 2009 than in interim 2008 (the absolute value and ratio to sales, however, were lower). Rawmaterial costs also increased as a share of total COGS, from *** percent in 2006 to *** percent in 2008and were *** percent in interim 2009 (*** than *** in interim 2008. Raw material costs averaged $***per short ton of sales in 2008 for the three reporting U.S. producers (up *** from $*** per short ton in2006, and ranged from $*** to $*** per short ton of sales on a firm-by-firm basis.6 Raw material costsincreased further in 2009, averaging nearly $*** for the three firms together and ranging from $*** to$***. Resco stated that in order to reduce raw material input costs, it began reclaiming unused brick touse in MCB mixes as a replacement for higher priced virgin materials, as well as processing “spentlinings” from steelmakers in 2006.7 Resco alleges that export restraints in China on magnesia rawmaterials have restricted supply and resulted in higher prices in the United States.8
Table VI-2 depicts operating data for MCB on a firm-by-firm basis.
Table VI-2MCB: Selected results of operations of U.S. producers, by firm, 2006-08, January-June 2008, andJanuary-June 2009
* * * * * * *
ANH, which produces MCB at White Cloud, MI, ***. It was *** of the periods for which datawere gathered–***. The quantity and value of ANH’s sales *** between 2006 and 2007 and *** in 2008,but were *** in interim 2009 (***) than in interim 2008.9 Its operating income margin *** in 2008 from2007 ***. ANH reported ***.10
11 Resco’s raw material costs are ***. However, there appear to be ***. 12 In 2008, Resco reported ***. Calculated from Resco’s *** questionnaire responses. 13 Raw material costs are “variable costs” (i.e., the dollar value varies directly with production and the AUV of avariable cost stays the same unless the underlying cost of the input changes). The dollar value of “fixed costs” staysthe same but the AUV changes with variations in how the fixed costs are absorbed by changes in production. Whilethe absolute value of fixed costs remains the same, the AUVs of fixed costs varies inversely with productionchanges–they rise when production falls and decrease with production increases. Variable costs increase or decreasewith changes in production although the AUV of variable costs stays the same with changes in production. *** ofthe reporting firms stated that raw material costs are variable costs and *** classified direct labor as a variable cost. Other factory costs include both fixed costs (depreciation, insurance, plant management) and variable costs (indirectmaterials, electricity, utility charges). The three reporting firms *** but were split on the nature of other factorycosts–***. In 2008, the fixed cost component accounted for *** percent of other factory costs. SG&A expensesalso have fixed and variable components. About *** percent of total SG&A expenses were estimated to be fixedcosts in 2008. 14 Compiled from data submitted in response to Commission questionnaires. 15 The breakeven point, or the point to which sales/production can fall before the firm loses money, can becalculated as sales minus variable costs minus fixed costs equals zero. Sales minus variable costs is the contributionmargin. Rearranging the equation, the quantity at the breakeven point equals fixed costs in dollars divided by theunit contribution margin. The validity of this calculation depends upon a number of crucial assumptions. See,Charles T. Horngren, George Foster, Srikant M. Datar, Cost Accounting: A Managerial Emphasis (New Jersey:Prentice Hall, 9th Ed, 1997), p. 60. 16 A variance analysis is calculated in three parts: sales variance, cost of sales variance, and SG&A expensevariance. Each part consists of a price variance (in the case of the sales variance) or a cost variance (in the case ofthe cost of sales and SG&A expense variance) and a volume variance. The sales or cost variance is calculated as thechange in unit price times the new volume, while the volume variance is calculated as the change in volume timesthe old unit price. Summarized at the bottom of the table, the price variance is from sales; the cost/expense varianceis the sum of those items from COGS and SG&A variances, respectively, and the volume variance is the sum of thelines under price and cost/expense variance. The volume component of price variance is nearly always negativebecause of the way in which the spreadsheet is constructed.
VI-3
LWB produces MCB at its plant in York, PA (*** of that plant’s production). In 2008, LWBwas the ***. It was *** of the periods for which data were collected; its operating income margin ***. The value and AUV of LWB’s sales increased between 2006 and 2008. Although its sales in interim2009 were lower than in interim 2008, the average unit value of its sales was greater. The AUVs ofLWB’s sales and COGS ***.
Resco is the ***. Unlike ***. Resco’s total net sales value rose from 2006 to 2008, but was ***. The increase between 2006 and 2007 was from ***. Resco’s ***.11 Its SG&A expenses are ***. Starting in July 2008, Resco cut costs at its Hammond, IN, plant through ***. Resco ***.12
Each of the responding firms provided a breakdown between fixed costs and variable costs13 intheir questionnaire response. For the three firms together, fixed costs accounted for about *** percent ofCOGS and *** percent of SG&A expenses in 2008.14 While the fixed cost portion of COGS seems verylow, it should be noted that raw materials costs, chiefly forms of magnesia, accounted for about ***percent of total COGS in 2008. Based on the breakdown between fixed and variable costs, the breakevenpoint, which is the quantity sold where total revenues and total costs are equal,15 can be calculated for thefive firms. That point was *** short tons in 2008 and constituted nearly *** percent of the reportedproduction of the three firms together in 2008; only *** percent of its production in 2008, the year inwhich ***. The breakeven points of *** in 2008 were *** and *** percent, respectively.
A variance analysis for the operations of U.S. producers of MCB is presented in table VI-3. Theinformation for this variance analysis is derived from table VI-1.16 The analysis shows that the increaseof $*** in the operating income from 2006 to 2008 was attributable to the favorable price variance (unitsales values increased) that was greater than the unfavorable net cost/expense variance (unit costsincreased). Operating income fell by nearly $*** between interim 2008 and interim 2009 because a
17 Resco stated at the staff conference that it planned to install a hydraulic press at Hammond in 2006 to preparefor a potential increase in MCB production due to increasing demand from steel producers. It claimed that low-priced imports from China and Mexico captured the increased volume of MCB, and that the press sits uninstalledand unused. Conference transcript, p. 19 (Brown). Resco also stated that ***. Resco’s U.S. producers’questionnaire response, III-14. 18 Resco stated ***. Resco’s U.S. producers’ questionnaire response, III-14.
VI-4
favorable price variance (unit prices increased) was overwhelmed by unfavorable variances on netcost/expense (unit costs and expenses increased) and volume.
Table VI-3MCB: Variance analysis on the operations of U.S. producers, 2006-08, and January-June 2008 toJanuary-June 2009
* * * * * * *
CAPITAL EXPENDITURES AND RESEARCH AND DEVELOPMENT EXPENSES
Each of the U.S. producers was asked about the nature of their capital expenditures and researchand development (“R&D”) expenses (table VI-4). ANH reported that ***. LWB stated that ***. Rescostated that its ***.17 Resco’s R&D expenses ***.18
Table VI-4MCB: Capital expenditures and research and development expenses of U.S. producers, 2006-08,January-June 2008, and January-June 2009
* * * * * * *
ASSETS AND RETURN ON INVESTMENT
Data on the U.S. producers’ total assets and their return on investment (“ROI”) are presented intable VI-5. Total assets utilized in the production, warehousing, and sale of MCB for reporting U.S.producers increased by *** percent from 2006 to 2008 led by ***, which nearly ***. ROI, which iscalculated as the ratio of operating income to total assets, therefore followed the trend of operatingincome, and was higher in 2007 from 2006 but fell back in 2008 to nearly the level it had been in 2006.
Table VI-5MCB: The value of assets and return on investment of U.S. producers, fiscal years 2006–08
* * * * * * *
Two asset management ratios, which measure how effectively the firm is managing its assets,may also be calculated from these data. These ratios assist in answering the question of whether a firm’stypes and amounts of assets assist its current and projected sales. The ratios examined here are: (1) theinventory turnover ratio; and (2) days sales outstanding.
The inventory turnover ratio is defined as sales divided by average inventories of finished goods. As a rough approximation, this measures the number of times per year that inventory is turned over orsold. A low number suggests that a firm is holding excess or unproductive inventory (unproductiveinventory represents low return). For the three firms together this ratio was *** times in 2008, up from*** times and *** times in 2006 and 2007, respectively. The increase in the ratio is due to the increase in
19 Each of the responding U.S. producers provided data for their inventories of raw materials and work-in-processgoods together as of the end of their fiscal year. For the industry as a whole, the ratio of this category to salesincreased during 2006 to 2008, from an average of *** percent to *** percent. The ratio *** between the threefirms. For ANH the ratio was *** percent in 2006, 2007, and 2008, respectively. For LWB, the ratio was ***percent and for Resco, the ratio was *** percent in 2006, 2007, and 2008, respectively. Calculated from U.S.producers’ questionnaire responses, III-11 and III-13. ***. 20 ***. U.S. producers’ questionnaire responses of the three firms, IV-5. 21 ***.
VI-5
sales value and the decline in value of inventories during the three full years. For *** the increase wasgreater than the industry average–*** in 2008 from 2006, respectively, while the ratio for ***.19
Days sales outstanding (“DSO”), which is also called the average collection period, may be usedto evaluate accounts receivable. It is defined as accounts receivable divided by average sales per day (orannual total net sales divided by 365 days). The DSO may be evaluated with respect to the firm’s creditterms because if the customer is paying later than the contractual terms,20 it deprives the producer offunds. Or, late payment may signal that the customer is in financial distress although this does not seemto be the case here. For the MCB industry, this ratio was *** days in 2008 down from *** days in 2006. For ***.
CAPITAL AND INVESTMENT
The Commission requested U.S. producers of MCB to describe any actual or potential negativeeffects of imports of MCB from China on their firms’ growth, investment, ability to raise capital,development and production efforts, or the scale of capital investments. Their responses are shownbelow.
Actual Negative Effects
ANH: ***.
LWB: ***.
Resco: ***.
Anticipated Negative Effects
ANH: ***.
LWB: ***.
Resco: ***.21


1 Section 771(7)(F)(ii) of the Act (19 U.S.C. § 1677(7)(F)(ii)) provides that “The Commission shall consider[these factors] . . . as a whole in making a determination of whether further dumped or subsidized imports areimminent and whether material injury by reason of imports would occur unless an order is issued or a suspensionagreement is accepted under this title. The presence or absence of any factor which the Commission is required toconsider . . . shall not necessarily give decisive guidance with respect to the determination. Such a determinationmay not be made on the basis of mere conjecture or supposition.”
VII-1
PART VII: THREAT CONSIDERATIONS AND INFORMATION ONNONSUBJECT COUNTRIES
Section 771(7)(F)(i) of the Act (19 U.S.C. § 1677(7)(F)(i)) provides that--
In determining whether an industry in the United States is threatenedwith material injury by reason of imports (or sales for importation) of thesubject merchandise, the Commission shall consider, among otherrelevant economic factors1--
(I) if a countervailable subsidy is involved, such information as may bepresented to it by the administering authority as to the nature of thesubsidy (particularly as to whether the countervailable subsidy is asubsidy described in Article 3 or 6.1 of the Subsidies Agreement), andwhether imports of the subject merchandise are likely to increase,
(II) any existing unused production capacity or imminent, substantialincrease in production capacity in the exporting country indicating thelikelihood of substantially increased imports of the subject merchandiseinto the United States, taking into account the availability of other exportmarkets to absorb any additional exports,
(III) a significant rate of increase of the volume or market penetration ofimports of the subject merchandise indicating the likelihood ofsubstantially increased imports,
(IV) whether imports of the subject merchandise are entering at pricesthat are likely to have a significant depressing or suppressing effect ondomestic prices, and are likely to increase demand for further imports,
(V) inventories of the subject merchandise,
(VI) the potential for product-shifting if production facilities in theforeign country, which can be used to produce the subject merchandise,are currently being used to produce other products,
(VII) in any investigation under this title which involves imports of botha raw agricultural product (within the meaning of paragraph (4)(E)(iv))and any product processed from such raw agricultural product, thelikelihood that there will be increased imports, by reason of productshifting, if there is an affirmative determination by the Commission

2 Section 771(7)(F)(iii) of the Act (19 U.S.C. § 1677(7)(F)(iii)) further provides that, in antidumpinginvestigations, “. . . the Commission shall consider whether dumping in the markets of foreign countries (asevidenced by dumping findings or antidumping remedies in other WTO member markets against the same class orkind of merchandise manufactured or exported by the same party as under investigation) suggests a threat of materialinjury to the domestic industry.” 3 ***. 4 http://www.fengchi.com.cn/en/jj.htm, retrieved September 1, 2009. 5 http://indmin.com/Article/2259762/Channel/0/Magnesia-make-over-a-global-review.html, retrieved September2, 2009. 6 Producers in China that submitted foreign producer questionnaires were: ***.
VII-2
under section 705(b)(1) or 735(b)(1) with respect to either the rawagricultural product or the processed agricultural product (but not both),
(VIII) the actual and potential negative effects on the existingdevelopment and production efforts of the domestic industry, includingefforts to develop a derivative or more advanced version of the domesticlike product, and
(IX) any other demonstrable adverse trends that indicate the probabilitythat there is likely to be material injury by reason of imports (or sale forimportation) of the subject merchandise (whether or not it is actuallybeing imported at the time).2
Information on the nature of the alleged subsidies was presented earlier in this report; informationon the volume and pricing of imports of the subject merchandise is presented in Parts IV and V; andinformation on the effects of imports of the subject merchandise on U.S. producers’ existing developmentand production efforts is presented in Part VI. Information on inventories of the subject merchandise;foreign producers’ operations, including the potential for “product-shifting;” any other threat indicators, ifapplicable; and any dumping in third-country markets, follows. Also presented in this section of thereport is information obtained for consideration by the Commission on nonsubject countries and theglobal market.
THE INDUSTRY IN CHINA
***. ***.3 The Chinese MCB industry relies on rich, high-grade magnesia reserves to produceits MCB.4 Together, China, North Korea, and Russia account for nearly 75 percent of global magnesiaproduction capacity. China has been described as a mainstay of world supply of magnesia with changesin Chinese exports of magnesia affecting worldwide refractory access to magnesia through tightenedsupply and rising prices.5
The Commission requested data from the 35 firms that were listed in the petition as producingMCB in China during the period of the investigation. The Commission received a response from sevenfirms,6 and data regarding the Chinese industry are based on the seven foreign producer questionnairesreceived. These responses are believed to account for approximately *** percent of Chinese exportshipments to the United States in 2008.
Table VII-1 presents information on the Chinese industry’s MCB operations. Chinese capacityand production both increased from 2006 to 2008, then decreased between the interim periods, and wereprojected to decrease in 2009 and increase in 2010. Chinese capacity utilization decreased steadily from2006 to 2008, then decreased in interim 2009 compared with interim 2008. Chinese producers projected

VII-3
Table VII-1MCB: Chinese production capacity, production, shipments, and inventories, 2006-08, January-June 2008,January-June 2009, and projected 2009-10
Item
Actual experience Projections
2006 2007 2008
January-June
2009 20102008 2009
Quantity (short tons)
Capacity1 327,363 369,463 520,272 259,831 251,361 503,332 513,012
Production 260,724 282,780 327,464 172,908 112,638 274,227 352,041
End of period inventories 13,759 20,481 21,653 21,355 20,085 23,210 23,745
Shipments Home market 77,515 81,472 78,341 41,361 30,326 62,374 87,615
Exports to--The United States 25,054 30,462 37,499 19,572 10,196 21,533 27,887
All other markets 161,969 164,506 210,323 111,307 73,934 190,839 233,479
Total exports 187,022 194,968 247,822 130,879 84,129 212,372 261,366
Total shipments 264,538 276,440 326,162 172,240 114,455 274,746 348,981
Ratios and shares (percent)
Capacity utilization 79.6 76.5 62.9 66.5 44.8 54.5 68.6
Inventories to production 5.3 7.2 6.6 6.2 8.9 8.5 6.7
Inventories to total shipments 5.2 7.4 6.6 6.2 8.8 8.4 6.8
Share of total quantity of shipments:
Home market 29.3 29.5 24.0 24.0 26.5 22.7 25.1
Exports to--The United States 9.5 11.0 11.5 11.4 8.9 7.8 8.0
All other markets 61.2 59.5 64.5 64.6 64.6 69.5 66.9
All export markets 70.7 70.5 76.0 76.0 73.5 77.3 74.9
1 ***.
Note. – Because of rounding, figures may not add to the totals shown.
Source: Compiled from data submitted in response to Commission questionnaires.

7 These other export markets include: ***. 8 ***. 9 The other export markets are ***. 10 ***. Respondent RHI’s postconference brief, p. 12.
VII-4
a decrease in capacity utilization in 2009 and an increase in 2010. The share of Chinese shipments sold toits home market ranged from 24.0 percent to 29.5 percent during 2006 to 2008. The majority of Chineseproducer export shipments was to countries other than the United States.7 Chinese total exports as a shareof its total shipments ranged from 70.5 percent to 76.0 percent during 2006-08.
In the most recent fiscal year, Chinese producers of MCB estimated that the share of their totalsales represented by sales of MCB, based on quantity, is as follows: ***.
Six Chinese producers of MCB reported that they produce other products on the same equipmentand machinery used to produce MCB: ***.
THE INDUSTRY IN MEXICO
The Commission requested data from the one MCB producer in Mexico, RHI-Refmex S.A. deD.V.(Refmex)8. The Commission received a response from Refmex, which accounted for 100 percent ofMexican production and approximately *** percent of Mexican exports during the period ofinvestigation.
Table VII-2 presents information on Refmex’s MCB operations in Mexico. Refmex’s capacity *** from 2006 to 2008 and during January-June 2009 and was projected to *** through 2010. Refmex’sproduction of MCB *** percent from 2006 to 2008 and *** percent between the interim periods. Refmex’s production is expected to ***. Refmex’s capacity utilization *** percent in 2006 to ***percent in 2008. Capacity utilization in 2009 is projected to be *** percent.
The volume of Refmex’s shipments to its home market ranged from a low of *** percent in 2006to *** percent in interim 2008. The *** of Refmex’s exports was exported to the United States.9 Theseexports *** percent from 2006 to 2008 and *** as a share of Refmex’s total shipments from *** percentin 2006 to *** percent in 2008.10 Refmex’s shipments to other countries *** from *** percent of totalshipments in 2006 to *** percent of total shipments in 2008. RHI Refmex *** produce other products onthe same machinery and equipment used to produce MCB.
Table VII-2MCB: Mexican production capacity, production, shipments, and inventories, 2006-08, January-June 2008, January-June 2009, and projected 2009-10
* * * * * * *

11 The following firms reported inventories from China: ***. 12 Those firms are ***. 13 On August 12, 2009, the EC amended the margin for Yingkou Bayuquan Refractories to zero percent and themargin for Dashiquiao Sanqiang Refractory to 14.4 percent. Respondent Vesuvius’ and Yingkou Banuquan’spostconference brief, exh.9. 14 Petitioner’s postconference brief, p. 29, exh. 7. 15 Mittal Steel Point Lisas Ltd. v. United States, Slip Op. 2007-1552 at 17 (Fed. Cir., Sept. 18, 2008), quotingfrom Statement of Administrative Action on Uruguay Round Agreements Act, H.R. Rep. 103-316, Vol. I at 851-52;see also Bratsk Aluminum Smelter v. United States, 444 F.3d 1369 (Fed. Cir. 2006).
VII-5
U.S. IMPORTERS’ INVENTORIES OF MCB
Eleven U.S. importers reported inventories of imports of MCB from China during the period forwhich data were collected, one firm reported inventories from Mexico, and two firms reported inventoriesfrom other countries.11 Data collected in these investigations on U.S. importers’ end-of-period inventoriesof MCB are presented in table VII-3. Inventories from China and Mexico *** from 2006 to 2008 then*** between the interim periods.
U.S. IMPORTERS’ CURRENT ORDERS
Ten U.S. importers reported imports or the arrangement of imports of MCB of 6,626 shorttons from China and *** short tons from Mexico after June 30, 2009.12
ANTIDUMPING AND COUNTERVAILING DUTY INVESTIGATIONSIN THIRD-COUNTRY MARKETS
On October 6, 2005, the European Commission imposed antidumping duties on imports of MCBfrom China that vary for six manufacturers and are fixed at 39.9 percent for all other companies.13 OnSeptember 1, 2007, Turkey imposed antidumping duties ($145/ton) on imports of MCB from China.14
INFORMATION ON PRODUCERS IN NONSUBJECT COUNTRIES
In assessing whether the domestic industry is materially injured or threatened with materialinjury “by reason of subject imports,” the legislative history states “that the Commission must examine allrelevant evidence, including any known factors, other than the dumped or subsidized imports, that may beinjuring the domestic industry, and that the Commission must examine those other factors (including non-subject imports) ‘to ensure that it is not attributing injury from other sources to the subject imports.’”15

VII-6
Table VII-3MCB: U.S. importers’ end-of-period inventories of imports, 2006-08, January-June 2008, andJanuary-June 2009
Source
Calendar year January-June
2006 2007 2008 2008 2009
Imports from China:
Inventories (short tons) 24,279 25,373 27,527 24,788 23,029
Ratio to imports (percent) 60.0 66.2 61.3 46.3 105.8
Ratio to U.S. shipments of imports (percent) 73.6 70.1 65.4 46.1 73.4
Imports from Mexico:
Inventories (short tons) *** *** *** *** ***
Ratio to imports (percent) *** *** *** *** ***
Ratio to U.S. shipments of imports (percent) *** *** *** *** ***
Imports from subject sources:
Inventories (short tons) *** *** *** *** ***
Ratio to imports (percent) *** *** *** *** ***
Ratio to U.S. shipments of imports (percent) *** *** *** *** ***
Imports from all other sources:
Inventories (short tons) *** *** *** *** ***
Ratio to imports (percent) *** *** *** *** ***
Ratio to U.S. shipments of imports (percent) *** *** *** *** ***
Imports from all sources:
Inventories (short tons) *** *** *** *** ***
Ratio to imports (percent) *** *** *** *** ***
Ratio to U.S. shipments of imports (percent) *** *** *** *** ***
Note.–Because of rounding, figures may not add to the totals shown. Partial-year ratios are based on annualizedimport and shipment data.
Source: Compiled from data submitted in response to Commission questionnaires.

16 http://www.referenceforbusiness.com/history2/68/RHI-AG.html, retrieved August 21, 2009. 17 Staff telephone interview with ***. 18 Petitioner’s postconference brief, exh. 1 and exh. 14. 19 Staff telephone interview with ***. 20 http://wrightreports.ecnext.com/coms2/reportdesc_COMPANY_C07621060, retrieved August 21, 2009. 21 http://www.wealth.bloomberg.com/apps/news?pid=conewsstory&tkr=GPIX:LX&sid=aYtSKEDpAhug,retrieved August 27, 2009. 22 E-mail correspondence with LWB, August 28, 2009.
VII-7
Europe
RHI AG (Austria) is the world's largest manufacturer of heat-resistant refractory products,and is said to account for a global refractories market share of some 15 percent and as much as 30 percentof the European and NAFTA markets.16 RHI AG is also the parent company of RHI RefractoriesLiaoning Co., Ltd. (China) and RHI-Refmex (Mexico). RHI has MCB producing plants in Duisburg,Germany; Veitsch, Germany, and Carinthia, Austria. According to counsel for RHI, ***.17 LWB hasMCB producing plants in Hagen and Oberhausen, Germany, as well as its MCB plant in York, PA.18 Finally, Refratechnik Cement GmbH produces MCB in a plant located in Gottingen, Germany. ***.19
Brazil
Magnesita Refractarios SA (Magnesita) is reported to be the largest producer of refractoryproducts, including brick, in Brazil. A profile of Magnesita’s activities indicated that the company sellsand distributes heat-resistant products used in the construction of high temperature industrial furnaces.Products include a full range of refractory bricks, paste, mortar, cement and concrete. In addition to itshome market and South American sales, Magnesita also exports its products to Europe, Asia and LatinAmerica.20 In September 2008, Magnesita purchased U.S. MCB producer LWB, making Magnesita theworld’s third-largest producer of refractory brick products.21 Magnesita has exported *** MCB to NorthAmerica. The company has made a ***.22 The vast majority of Magnesita’s MCB sales have been insideSouth America during the period of investigation.


A-1
APPENDIX A
FEDERAL REGISTER NOTICES

39969 Federal Register / Vol. 74, No. 152 / Monday, August 10, 2009 / Notices
(‘‘IA’’) and Ineos opposed Sinochem’s petition.
On June 1, 2009, the Commission determined to review the RID in its entirety and requested briefing on certain questions. The Commission determined to extend the target date to August 3, 2009, to accommodate its review.
Having examined the record of this investigation, including the ALJ’s RID and the submissions of the parties, the Commission has determined to reverse the conclusion of nonobviousness of claim 1 of the ‘276 patent in the RID. In so finding, the Commission has determined to rely on certain party admissions and other evidence as to the state of the prior art. The Commission majority has determined to take no position on the RID’s conclusions relating to obviousness arguments based on prior art references identified in the Commission’s remand instructions, including the RID’s conclusions on whether arguments as to those references have been waived. The Commission has also determined not to rely on the RID’s conclusions as to anticipation and waiver of anticipation arguments. The Commission has further determined to deny Sinochem’s motion to strike portions of Ineos’s response to its written submission and for leave to file a reply to that submission. The Commission has determined also to deny Sinochem’s motion to conform pleadings to evidence taken. These findings terminate the Commission’s investigation.
The authority for the Commission’s determination is contained in section 337 of the Tariff Act of 1930, as amended (19 U.S.C. 1337), and in Rule 210.45 of the Commission’s Rules of Practice and Procedure (19 CFR Part 210.45).
By order of the Commission. Issued: August 4, 2009.
Marilyn R. Abbott, Secretary to the Commission. [FR Doc. E9–19015 Filed 8–7–09; 8:45 am]
BILLING CODE 7020–02–P
INTERNATIONAL TRADE COMMISSION
[Investigation No. 337–TA–676]
In the Matter of Certain Lighting Control Devices Including Dimmer Switches and Parts Thereof; Notice of Commission Decision Not To Review an Initial Determination Terminating the Investigation Based on a Consent Order
AGENCY: U.S. International Trade Commission. ACTION: Notice.
SUMMARY: Notice is hereby given that the U.S. International Trade Commission has determined not to review the presiding administrative law judge’s (‘‘ALJ’’) initial determination (‘‘ID’’) (Order No. 8) granting the joint motion of complainant Lutron Electronics Co., Inc. (‘‘Lutron’’) and respondent Universal Smart Electric Corp. (‘‘Universal’’) to terminate the investigation based on a consent order. FOR FURTHER INFORMATION CONTACT: Daniel E. Valencia, Office of the General Counsel, U.S. International Trade Commission, 500 E Street, SW., Washington, DC 20436, telephone (202) 205–1999. Copies of non-confidential documents filed in connection with this investigation are or will be available for inspection during official business hours (8:45 a.m. to 5:15 p.m.) in the Office of the Secretary, U.S. International Trade Commission, 500 E Street, SW., Washington, DC 20436, telephone (202) 205–2000. General information concerning the Commission may also be obtained by accessing its Internet server at http://www.usitc.gov. The public record for this investigation may be viewed on the Commission’s electronic docket (EDIS) at http:// edis.usitc.gov. Hearing-impaired persons are advised that information on this matter can be obtained by contacting the Commission’s TDD terminal on (202) 205–1810. SUPPLEMENTARY INFORMATION: The Commission instituted this investigation on May 11, 2009, based on a complaint filed by Lutron of Coopersburg, Pennsylvania. 74 FR 21820 (May 11, 2009). The complaint alleges violations of section 337 of the Tariff Act of 1930 (19 U.S.C. 1337) in the importation into the United States, the sale for importation, and the sale within the United States after importation of certain lighting control devices including dimmer switches and parts thereof by reason of infringement of United States Patent Nos. 5,637,930 and 5,248,919 as well as U.S. Trademark
Registration No. 3,061,804. The complaint named Universal of Irvine, California as the sole respondent.
On July 8, 2009, Universal and Lutron jointly filed a motion pursuant to Commission rule 210.21(c) (19 CFR 210.21(c)) for termination of the investigation based on a consent order. The Commission investigative attorney supported the motion.
On July 14, 2009, the ALJ issued the subject ID granting the joint motion to terminate. The ALJ found that the consent order stipulation submitted with the joint motion complied with the requirements of Commission rule 210.21 (19 CFR 210.21). The ALJ also concluded that there is no evidence that termination of this investigation would be contrary to the public interest. No petitions for review of this ID were filed.
Having examined the record of this investigation, the Commission has determined not to review the ID.
The authority for the Commission’s determination is contained in section 337 of the Tariff Act of 1930, as amended (19 U.S.C. 1337), and in section 210.42 of the Commission’s Rules of Practice and Procedure (19 CFR 210.42).
Issued: August 4, 2009. By order of the Commission.
Marilyn R. Abbott, Secretary to the Commission. [FR Doc. E9–19021 Filed 8–7–09; 8:45 am] BILLING CODE 7020–02–P
INTERNATIONAL TRADE COMMISSION
[Investigation Nos. 701–TA–468 and 731– TA–1166–1167 (Preliminary)]
Certain Magnesia Carbon Bricks From China and Mexico
AGENCY: United States International Trade Commission. ACTION: Institution of antidumping and countervailing duty investigations and scheduling of preliminary phase investigations.
SUMMARY: The Commission hereby gives notice of the institution of investigations and commencement of preliminary phase countervailing duty investigation No. 701–TA–468 (Preliminary) and antidumping duty investigation Nos. 731–TA–1166–1167 (Preliminary) under sections 703(a) and 733(a) of the Tariff Act of 1930 (19 U.S.C. 1671b(a) and 1673b(a)) (the Act) to determine whether there is a reasonable indication that an industry in the United States is materially injured or threatened with material injury, or the establishment of
VerDate Nov<24>2008 15:09 Aug 07, 2009 Jkt 217001 PO 00000 Frm 00055 Fmt 4703 Sfmt 4703 E:\FR\FM\10AUN1.SGM 10AUN1rmaj
ette
on
DS
K29
S0Y
B1P
RO
D w
ith N
OT
ICE
S

39970 Federal Register / Vol. 74, No. 152 / Monday, August 10, 2009 / Notices
an industry in the United States is materially retarded, by reason of imports from China and Mexico of certain magnesia carbon bricks (‘‘MCB’’), provided for in subheadings 6902.10.10, 6902.10.50, 6815.91.00 and 6815.99.00 of the Harmonized Tariff Schedule of the United States, that are alleged to be subsidized by the Government of China, and sold in the United States at less than fair value. Unless the Department of Commerce extends the time for initiation pursuant to section 702(c)(1)(B) or 732(c)(1)(B) of the Act (19 U.S.C. 1671a(c)(1)(B) or 1673a(c)(1)(B)), the Commission must reach a preliminary determination in these investigations in 45 days, or in this case by September 14, 2009. The Commission’s views are due at Commerce within five business days thereafter, or by September 21, 2009.
For further information concerning the conduct of these investigations and rules of general application, consult the Commission’s Rules of Practice and Procedure, part 201, subparts A through E (19 CFR part 201), and part 207, subparts A and B (19 CFR part 207). DATES: Effective Date: July 29, 2009. FOR FURTHER INFORMATION CONTACT: Elizabeth Haines (202–205–3200), Office of Investigations, U.S. International Trade Commission, 500 E Street, SW., Washington, DC 20436. Hearing- impaired persons can obtain information on this matter by contacting the Commission’s TDD terminal on 202– 205–1810. Persons with mobility impairments who will need special assistance in gaining access to the Commission should contact the Office of the Secretary at 202–205–2000. General information concerning the Commission may also be obtained by accessing its internet server (http:// www.usitc.gov). The public record for these investigations may be viewed on the Commission’s electronic docket (EDIS) at http://edis.usitc.gov. SUPPLEMENTARY INFORMATION:
Background.—These investigations are being instituted in response to a petition filed on July 29, 2009, by Resco Products, Inc., (Pittsburgh, PA).
Participation in the investigations and public service list.—Persons (other than petitioners) wishing to participate in the investigations as parties must file an entry of appearance with the Secretary to the Commission, as provided in sections 201.11 and 207.10 of the Commission’s rules, not later than seven days after publication of this notice in the Federal Register. Industrial users and (if the merchandise under investigation is sold at the retail level) representative consumer organizations
have the right to appear as parties in Commission countervailing duty and antidumping duty investigations. The Secretary will prepare a public service list containing the names and addresses of all persons, or their representatives, who are parties to these investigations upon the expiration of the period for filing entries of appearance.
Limited disclosure of business proprietary information (BPI) under an administrative protective order (APO) and BPI service list.—Pursuant to section 207.7(a) of the Commission’s rules, the Secretary will make BPI gathered in these investigations available to authorized applicants representing interested parties (as defined in 19 U.S.C. 1677(9)) who are parties to the investigations under the APO issued in the investigations, provided that the application is made not later than seven days after the publication of this notice in the Federal Register. A separate service list will be maintained by the Secretary for those parties authorized to receive BPI under the APO.
Conference.—The Commission’s Director of Investigations has scheduled a conference in connection with these investigations for 9:30 a.m. on August 19, 2009, at the U.S. International Trade Commission Building, 500 E Street, SW., Washington, DC. Parties wishing to participate in the conference should contact Elizabeth Haines (202–205– 3200) not later than August 14, 2009, to arrange for their appearance. Parties in support of the imposition of countervailing and antidumping duties in these investigations and parties in opposition to the imposition of such duties will each be collectively allocated one hour within which to make an oral presentation at the conference. A nonparty who has testimony that may aid the Commission’s deliberations may request permission to present a short statement at the conference.
Written submissions.—As provided in sections 201.8 and 207.15 of the Commission’s rules, any person may submit to the Commission on or before August 24, 2009, a written brief containing information and arguments pertinent to the subject matter of the investigations. Parties may file written testimony in connection with their presentation at the conference no later than three days before the conference. If briefs or written testimony contain BPI, they must conform with the requirements of sections 201.6, 207.3, and 207.7 of the Commission’s rules. The Commission’s rules do not authorize filing of submissions with the Secretary by facsimile or electronic
means, except to the extent permitted by section 201.8 of the Commission’s rules, as amended, 67 FR 68036 (November 8, 2002). Even where electronic filing of a document is permitted, certain documents must also be filed in paper form, as specified in II(C) of the Commission’s Handbook on Electronic Filing Procedures, 67 FR 68168, 68173 (November 8, 2002).
In accordance with sections 201.16(c) and 207.3 of the rules, each document filed by a party to the investigations must be served on all other parties to the investigations (as identified by either the public or BPI service list), and a certificate of service must be timely filed. The Secretary will not accept a document for filing without a certificate of service.
Authority: These investigations are being conducted under authority of title VII of the Tariff Act of 1930; this notice is published pursuant to section 207.12 of the Commission’s rules.
By order of the Commission. Issued: July 30, 2009.
Marilyn R. Abbott, Secretary to the Commission. William R. Bishop, Acting Secretary to the Commission. [FR Doc. E9–19061 Filed 8–7–09; 8:45 am] BILLING CODE 7020–02–P
INTERNATIONAL TRADE COMMISSION
[USITC SE–09–023]
Government in the Sunshine Act Meeting Notice
AGENCY HOLDING THE MEETING: United States International Trade Commission. TIME AND DATE: August 18, 2009 at 2 p.m. PLACE: Room 101, 500 E Street, SW., Washington, DC 20436, Telephone: (202) 205–2000. STATUS: Open to the public. MATTERS TO BE CONSIDERED:
1. Agenda for future meetings: None. 2. Minutes. 3. Ratification List. 4. Inv. Nos. 701–TA–458 and 731–
TA–1154 (Final) (Certain Kitchen Appliance Shelving and Racks from China)—briefing and vote. (The Commission is currently scheduled to transmit its determinations and Commissioners’ opinions to the Secretary of Commerce on or before August 31, 2009.)
5. Outstanding action jackets: None. In accordance with Commission
policy, subject matter listed above, not disposed of at the scheduled meeting,
VerDate Nov<24>2008 15:09 Aug 07, 2009 Jkt 217001 PO 00000 Frm 00056 Fmt 4703 Sfmt 4703 E:\FR\FM\10AUN1.SGM 10AUN1rmaj
ette
on
DS
K29
S0Y
B1P
RO
D w
ith N
OT
ICE
S
42852 Federal Register / Vol. 74, No. 163 / Tuesday, August 25, 2009 / Notices
III. State Advisory Committee Issues
• Arizona SAC; • Hawaii SAC; • Michigan SAC; • Utah SAC; • Indiana SAC; • Nebraska SAC; • South Dakota SAC.
IV. Program Planning
• Update on National Civil Rights Conference.
V. Adjourn
CONTACT PERSON FOR FURTHER INFORMATION: Lenore Ostrowsky, Acting Chief, Public Affairs Unit (202) 376– 8582. TDD: (202) 376–8116.
Persons with a disability requiring special services, such as an interpreter for the hearing impaired, should contact Pamela Dunston at least seven days prior to the meeting at 202–376–8105. TDD: (202) 376–8116.
Dated: August 21, 2009. David Blackwood, General Counsel. [FR Doc. E9–20613 Filed 8–21–09; 4:15 pm] BILLING CODE 6335–01–P
DEPARTMENT OF COMMERCE
International Trade Administration
Proposed Information Collection; Comment Request; Procedures for Importation of Supplies for Use in Emergency Relief Work
AGENCY: International Trade Administration, Commerce. ACTION: Notice.
SUMMARY: The Department of Commerce, as part of its continuing effort to reduce paperwork and respondent burden, invites the general public and other Federal agencies to take this opportunity to comment on proposed and/or continuing information collections, as required by the Paperwork Reduction Act of 1995. DATES: Written comments must be submitted on or before October 26, 2009.
ADDRESSES: Direct all written comments to Diana Hynek, Departmental Paperwork Clearance Officer, Department of Commerce, Room 7845, 14th and Constitution Avenue, NW., Washington, DC 20230 (or via the Internet at [email protected]). FOR FURTHER INFORMATION CONTACT: Requests for additional information or copies of the information collection instrument and instructions should be
directed to Hardeep K. Josan, Office of the Chief Counsel for Import Administration, Room 3622, U.S. Department of Commerce, 1401 Constitution Avenue, NW., Washington, DC 20230; telephone: 202–482–0835; [email protected].
SUPPLEMENTARY INFORMATION:
I. Abstract
The regulations (19 CFR 358.101 through 358.104) provide procedures for requesting the Secretary of Commerce to permit the importation of supplies, such as food, clothing, and medical, surgical, and other supplies, for use in emergency relief work free of antidumping and countervailing duties.
Authority: 19 U.S.C. 1318(a). There are no proposed changes to this information collection.
II. Method of Collection
Three copies of the request must be submitted in writing to the Secretary of Commerce, Attention: Import Administration, Central Records Unit, Room 1870, U.S. Department of Commerce, 1401 Constitution Avenue, NW., Washington, DC 20230.
III. Data
OMB Control Number: 0625–0256. Form Number(s): None. Type of Review: Regular submission. Affected Public: Business or other for-
profit organizations. Estimated Number of Respondents: 5. Estimated Time per Response: 2. Estimated Total Annual Burden
Hours: 10. Estimated Total Annual Cost to
Public: $143.20.
IV. Request for Comments
Comments are invited on: (a) Whether the proposed collection of information is necessary for the proper performance of the functions of the agency, including whether the information shall have practical utility; (b) the accuracy of the agency’s estimate of the burden (including hours and cost) of the proposed collection of information; (c) ways to enhance the quality, utility, and clarity of the information to be collected; and (d) ways to minimize the burden of the collection of information on respondents, including through the use of automated collection techniques or other forms of information technology.
Comments submitted in response to this notice will be summarized and/or included in the request for OMB approval of this information collection; they also will become a matter of public record.
Dated: August 19, 2009. Gwellnar Banks, Management Analyst, Office of the Chief Information Officer. [FR Doc. E9–20346 Filed 8–24–09; 8:45 am] BILLING CODE 3510–DS–P
DEPARTMENT OF COMMERCE
International Trade Administration
[A–570–954, A–201–837]
Certain Magnesia Carbon Bricks from the People’s Republic of China and Mexico: Initiation of Antidumping Duty Investigations
AGENCY: Import Administration, International Trade Administration, Department of Commerce. EFFECTIVE DATE: August 25, 2009. FOR FURTHER INFORMATION CONTACT: Terre Keaton Stefanova at (202) 482– 1280 or David Goldberger at (202) 482– 4136 (Mexico), AD/CVD Operations, Office 2; Jerry Huang at (202) 482–4047 or Paul Walker at (202) 482–0413 (China), AD/CVD Operations, Office 9, Import Administration, International Trade Administration, U.S. Department of Commerce, 14th Street and Constitution Avenue, NW, Washington, DC 20230. SUPPLEMENTARY INFORMATION:
The Petitions
On July 29, 2009, the Department of Commerce (the ‘‘Department’’) received petitions concerning imports of certain magnesia carbon bricks (‘‘magnesia carbon bricks’’) from the People’s Republic of China (‘‘PRC’’) and Mexico filed in proper form by Resco Products, Inc. (‘‘Petitioner’’). See Petition for the Imposition of Antidumping Duties: Certain Magnesia Carbon Bricks from the People’s Republic of China, dated July 29, 2009 (‘‘AD PRC Petition’’); Petition for the Imposition of Antidumping Duties: Certain Magnesia Carbon Bricks from Mexico, dated July 29, 2009 (‘‘AD Mexico Petition’’)(collectively, the ‘‘Petitions’’). On August 4 and 12, 2009, the Department issued additional requests for information and clarification of certain areas of the Petitions. Based on the Department’s requests, Petitioner timely filed additional information pertaining to the Petitions on August 10 and 14, 2009 (hereinafter, ‘‘Supplement to the AD PRC Petition,’’ and ‘‘Supplement to the AD Mexico Petition,’’ both dated August 10, 2009, and ‘‘Second Supplement to the AD PRC Petition,’’ and ‘‘Second Supplement to the AD Mexico Petition,’’
VerDate Nov<24>2008 22:52 Aug 24, 2009 Jkt 217001 PO 00000 Frm 00011 Fmt 4703 Sfmt 4703 E:\FR\FM\25AUN1.SGM 25AUN1pwal
ker
on D
SK
8KY
BLC
1PR
OD
with
NO
TIC
ES
42853 Federal Register / Vol. 74, No. 163 / Tuesday, August 25, 2009 / Notices
1 September 8, 2009, is the first business day after twenty calendar days from the signature date of this notice.
both dated August 14, 2009). The period of investigation (‘‘POI’’) for the PRC is January 1, 2009, through June 30, 2009. The POI for Mexico is July 1, 2008, through June 30, 2009. See 19 CFR 351.204(b)(1).
In accordance with section 732(b) of the Tariff Act of 1930, as amended (the ‘‘Act’’), Petitioner alleges that imports of magnesia carbon bricks from the PRC and Mexico are being, or are likely to be, sold in the United States at less than fair value, within the meaning of section 731 of the Act, and that such imports are materially injuring, or threatening material injury to, an industry in the United States.
The Department finds that Petitioner filed the Petitions on behalf of the domestic industry because Petitioner is an interested party, as defined in section 771(9)(C) of the Act, and has demonstrated sufficient industry support with respect to the antidumping duty investigations that Petitioner is requesting the Department to initiate (see ‘‘Determination of Industry Support for the Petitions’’ section below).
Scope of Investigations
The products covered by these investigations are magnesia carbon bricks from the PRC and Mexico. For a full description of the scope of the investigations, please see the ‘‘Scope of Investigations,’’ in Appendix I of this notice.
Comments on Scope of Investigations
During our review of the Petitions, we discussed the scope with Petitioner to ensure that it is an accurate reflection of the products for which the domestic industry is seeking relief. Moreover, as discussed in the preamble to the regulations (Antidumping Duties; Countervailing Duties; Final Rule, 62 FR 27296, 27323 (May 19, 1997)), we are setting aside a period for interested parties to raise issues regarding product coverage. The Department encourages all interested parties to submit such comments by September 8, 2009.1 Comments should be addressed to Import Administration’s APO/Dockets Unit, Room 1870, U.S. Department of Commerce, 14th Street and Constitution Avenue, NW, Washington, DC 20230. The period of scope consultations is intended to provide the Department with ample opportunity to consider all comments and to consult with parties prior to the issuance of the preliminary determinations.
Comments on Product Characteristics for Antidumping Duty Questionnaires
We are requesting comments from interested parties regarding the appropriate physical characteristics of magnesia carbon bricks to be reported in response to the Department’s antidumping questionnaires. This information will be used to identify the key physical characteristics of the merchandise under consideration in order to more accurately report the relevant factors and costs of production, as well as to develop appropriate product comparison criteria.
Interested parties may provide information or comments that they believe are relevant to the development of an accurate listing of physical characteristics. Specifically, they may provide comments as to which characteristics are appropriate to use as: 1) general product characteristics; and 2) the product comparison criteria. We note that it is not always appropriate to use all product characteristics as product comparison criteria. We base product comparison criteria on meaningful commercial differences among products. In other words, while there may be some physical product characteristics utilized by manufacturers to describe magnesia carbon bricks, it may be that only a select few product characteristics take into account commercially meaningful physical characteristics. In addition, interested parties may comment on the order in which the physical characteristics should be used in product matching. Generally, the Department attempts to list the most important physical characteristics first and the least important characteristics last.
In order to consider the suggestions of interested parties in developing and issuing the antidumping duty questionnaires, we must receive comments at the above–referenced address by September 8, 2009. Additionally, rebuttal comments must be received by September 15, 2009.
Determination of Industry Support for the Petitions
Section 732(b)(1) of the Act requires that a petition be filed on behalf of the domestic industry. Section 732(c)(4)(A) of the Act provides that a petition meets this requirement if the domestic producers or workers who support the petition account for: (i) at least 25 percent of the total production of the domestic like product; and (ii) more than 50 percent of the production of the domestic like product produced by that portion of the industry expressing
support for, or opposition to, the petition. Moreover, section 732(c)(4)(D) of the Act provides that, if the petition does not establish support of domestic producers or workers accounting for more than 50 percent of the total production of the domestic like product, the Department shall: (i) poll the industry or rely on other information in order to determine if there is support for the petition, as required by subparagraph (A); or (ii) determine industry support using a statistically valid sampling method.
Section 771(4)(A) of the Act defines the ‘‘industry’’ as the producers as a whole of a domestic like product. Thus, to determine whether a petition has the requisite industry support, the statute directs the Department to look to producers and workers who produce the domestic like product. The International Trade Commission (‘‘ITC’’), which is responsible for determining whether ‘‘the domestic industry’’ has been injured, must also determine what constitutes a domestic like product in order to define the industry. While both the Department and the ITC must apply the same statutory definition regarding the domestic like product (see section 771(10) of the Act), they do so for different purposes and pursuant to a separate and distinct authority. In addition, the Department’s determination is subject to limitations of time and information. Although this may result in different definitions of the like product, such differences do not render the decision of either agency contrary to law. See USEC, Inc. v. United States, 132 F. Supp. 2d 1, 8 (Ct. Int’l Trade 2001), citing Algoma Steel Corp., Ltd. v. United States, 688 F. Supp. 639, 644 (Ct. Int’l Trade 1988), aff’d 865 F.2d 240 (Fed. Cir. 1989), cert. denied 492 U.S. 919 (1989).
Section 771(10) of the Act defines the domestic like product as ‘‘a product which is like, or in the absence of like, most similar in characteristics and uses with, the article subject to an investigation under this title.’’ Thus, the reference point from which the domestic like product analysis begins is ‘‘the article subject to an investigation’’ (i.e., the class or kind of merchandise to be investigated, which normally will be the scope as defined in the petition).
With regard to the domestic like product, Petitioner does not offer a definition of domestic like product distinct from the scope of the investigations. Based on our analysis of the information submitted on the record, we have determined that magnesia carbon bricks constitute a single domestic like product and we have analyzed industry support in terms
VerDate Nov<24>2008 22:52 Aug 24, 2009 Jkt 217001 PO 00000 Frm 00012 Fmt 4703 Sfmt 4703 E:\FR\FM\25AUN1.SGM 25AUN1pwal
ker
on D
SK
8KY
BLC
1PR
OD
with
NO
TIC
ES
42854 Federal Register / Vol. 74, No. 163 / Tuesday, August 25, 2009 / Notices
of that domestic like product. For a discussion of the domestic like product analysis in this case, see Antidumping Duty Investigation Initiation Checklist: Magnesia Carbon Bricks from the PRC (‘‘PRC Initiation Checklist’’) at Attachment II, Analysis of Industry Support for the Petitions Covering Certain Magnesia Carbon Bricks from the People’s Republic of China and Mexico, and Antidumping Duty Investigation Initiation Checklist: Magnesia Carbon Bricks from Mexico (‘‘Mexico Initiation Checklist’’) at Attachment II, Analysis of Industry Support for the Petitions Covering Certain Magnesia Carbon Bricks from the People’s Republic of China and Mexico, dated concurrently with this notice and on file in the Central Records Unit (‘‘CRU’’), Room 1117 of the main Department of Commerce building.
In determining whether Petitioner has standing under section 732(c)(4)(A) of the Act, we considered the industry support data contained in the Petitions with reference to the domestic like product as defined in the ‘‘Scope of Investigations’’, in Appendix I of this notice. To establish industry support, Petitioner provided its own 2008 production of the domestic like product, as well as the production of the two supporters of the Petitions, and compared this to the estimated total production of the domestic like product for the entire domestic industry. See Petitions, at Exhibits 2–4, Supplement to the AD PRC Petition, Supplement to the AD Mexico Petition, dated August 10, 2009, at 8–12, and Exhibits R2–R– 6, Second Supplement to the AD PRC Petition, and Second Supplement to the AD Mexico Petition, dated August 14, 2009, at 1–2. Petitioner estimated total 2008 production of the domestic like product based on its own production data, data from the two supporters of the Petitions, and knowledge of the U.S. industry. See Petitions, at Exhibits 2–4, Supplement to the AD PRC Petition, Supplement to the AD Mexico Petition, dated August 10, 2009, at 8–12, and Exhibits R2–R–6, Second Supplement to the AD PRC Petition, and Second Supplement to the AD Mexico Petition, dated August 14, 2009, at 1–2; see also PRC Initiation Checklist at Attachment II, and Mexico Initiation Checklist at Attachment II.
Our review of the data provided in the Petitions, supplemental submissions, and other information readily available to the Department indicates that Petitioner has established industry support. First, the Petitions established support from domestic producers (or workers) accounting for more than 50 percent of the total production of the
domestic like product and, as such, the Department is not required to take further action in order to evaluate industry support (e.g., polling). See section 732(c)(4)(D) of the Act; see also PRC Initiation Checklist at Attachment II, and Mexico Initiation Checklist at Attachment II. Second, the domestic producers (or workers) have met the statutory criteria for industry support under section 732(c)(4)(A)(i) of the Act because the domestic producers (or workers) who support the Petitions account for at least 25 percent of the total production of the domestic like product. See PRC Initiation Checklist at Attachment II, and Mexico Initiation Checklist at Attachment II. Finally, the domestic producers (or workers) have met the statutory criteria for industry support under section 732(c)(4)(A)(ii) of the Act because the domestic producers (or workers) who support the Petitions account for more than 50 percent of the production of the domestic like product produced by that portion of the industry expressing support for, or opposition to, the Petitions. Accordingly, the Department determines that the Petitions were filed on behalf of the domestic industry within the meaning of section 732(b)(1) of the Act. See id.
The Department finds that Petitioner filed the Petitions on behalf of the domestic industry because it is an interested party as defined in section 771(9)(C) of the Act and it has demonstrated sufficient industry support with respect to the antidumping duty investigations that it is requesting the Department initiate. See id.
Allegations and Evidence of Material Injury and Causation
Petitioner alleges that the U.S. industry producing the domestic like product is being materially injured, or is threatened with material injury, by reason of the imports of the subject merchandise sold at less than normal value (‘‘NV’’). In addition, Petitioner alleges that subject imports exceed the negligibility threshold provided for under section 771(24)(A) of the Act.
Petitioner contends that the industry’s injured condition is illustrated by reduced market share, underselling and price depressing and suppressing effects, increased import penetration, lost sales and revenue, reduced production, reduced capacity utilization, reduced shipments, reduced employment, and overall poor financial performance. We have assessed the allegations and supporting evidence regarding material injury, threat of material injury, and causation, and we have determined that these allegations are properly supported by adequate
evidence and meet the statutory requirements for initiation. See PRC Initiation Checklist at Attachment III, Analysis of Allegations and Evidence of Material Injury and Causation for the Petitions Covering Certain Magnesia Carbon Bricks from the People’s Republic of China and Mexico, and Mexico Initiation Checklist at Attachment III, Analysis of Allegations and Evidence of Material Injury and Causation for the Petitions Covering Certain Magnesia Carbon Bricks from the People’s Republic of China and Mexico.
Allegations of Sales at Less Than Fair Value
The following is a description of the allegations of sales at less than fair value upon which the Department based its decision to initiate these investigations of imports of magnesia carbon bricks from the PRC and Mexico. The sources of data for the deductions and adjustments relating to the U.S. price, the factors of production (for the PRC) and constructed value (‘‘CV’’) (for Mexico) are also discussed in the country–specific initiation checklists. See PRC Initiation Checklist and Mexico Initiation Checklist.
U.S. Price
The PRC
For the PRC, Petitioner calculated export price (‘‘EP’’) based on documentation of actual sales and offers for sale obtained from a confidential source. See PRC Initiation Checklist; see also AD PRC Petition at Exhibit 11, and Second Supplement to the AD PRC Petition, dated August 14, 2009, at 4. Petitioner made adjustments for distributor mark–ups, international freight and U.S. movement expenses. See PRC Initiation Checklist; see also Second Supplement to the AD PRC Petition, at Exhibit R–11.
Mexico
For Mexico, Petitioner based U.S. price on POI prices of magnesia carbon bricks produced by the Mexican manufacturer RHI–Refmex S.A. de C.V. (‘‘RHI–Refmex’’). Petitioner substantiated the U.S. prices used with affidavits from persons who obtained the information. Petitioner believes that these prices include selling expenses incurred by RHI–Refmex’s U.S. affiliate but conservatively assumed such expenses to be zero in its calculation of net U.S. price. Petitioner deducted, where appropriate, freight expenses (U.S. inland freight), but made no other adjustments. See Mexico Initiation Checklist; see also AD Mexico Petition
VerDate Nov<24>2008 22:52 Aug 24, 2009 Jkt 217001 PO 00000 Frm 00013 Fmt 4703 Sfmt 4703 E:\FR\FM\25AUN1.SGM 25AUN1pwal
ker
on D
SK
8KY
BLC
1PR
OD
with
NO
TIC
ES

42855 Federal Register / Vol. 74, No. 163 / Tuesday, August 25, 2009 / Notices
at 15, Supplement to the AD Mexico Petition, at 21 and Exhibits R–8, R–10 and R–11, and Second Supplement to the AD Mexico Petition, at 3.
Normal Value
The PRC
Petitioner states that the PRC is a non–market economy (‘‘NME’’) country and no determination to the contrary has been made by the Department. See AD PRC Petition, at 14. In accordance with section 771(18)(C)(i) of the Act, the presumption of NME status remains in effect until revoked by the Department. The presumption of NME status for the PRC has not been revoked by the Department and, therefore, remains in effect for purposes of the initiation of this investigation. Accordingly, the NV of the product for the PRC investigation is appropriately based on factors of production valued in a surrogate market–economy country in accordance with section 773(c) of the Act. In the course of the PRC investigation, all parties, including the public, will have the opportunity to provide relevant information related to the issue of the PRC’s NME status and the granting of separate rates to individual exporters.
Petitioner contends that India is the appropriate surrogate country for the PRC because: 1) it is at a level of economic development comparable to that of the PRC; and 2) it is a significant producer of comparable merchandise; and 3) information required to calculate unit factor costs and financial ratios is readily available. See AD PRC Petition at 14–16, and Exhibit 10. Based on the information provided by Petitioner, we believe that it is appropriate to use India as a surrogate country for initiation purposes. After initiation of the investigation, interested parties will have the opportunity to submit comments regarding surrogate country selection and, pursuant to 19 CFR 351.301(c)(3)(i), will be provided an opportunity to submit publicly available information to value factors of production within 40 days after the date of publication of the preliminary determination.
Petitioner calculated the NV and dumping margins using the Department’s NME methodology as required by 19 CFR 351.202(b)(7)(i)(C) and 19 CFR 351.408. Petitioner calculated NV based on its own consumption rates for producing magnesia carbon bricks in 2008. See AD PRC Petition at 17, and Exhibit 12. In calculating NV, Petitioner based the quantity of each of the inputs used to manufacture and pack magnesia carbon bricks in the PRC on its own industry
knowledge and production experience during the POI. See AD PRC Petition at 17, and Exhibit 12. Petitioner states that the actual usage rates of the foreign manufacturers of magnesia carbon bricks are not reasonably available; however, Petitioner notes that to the best of Petitioner’s knowledge, the production of magnesia carbon bricks in China relies on similar basic manufacturing processes as in the United States. See AD PRC Petition at 17.
Petitioner determined the consumption quantities of all raw materials and packing materials based on its own production experience. See AD PRC Petition at 17, and Exhibit 12. Petitioner valued the factors of production based on reasonably available, public surrogate country data, specifically, Indian import statistics from the World Trade Atlas (‘‘WTA’’). See Supplement to the AD PRC Petition, at Exhibit R–8. Petitioner excluded from these import statistics imports from countries previously determined by the Department to be NME countries and from Indonesia, the Republic of Korea, and Thailand as the Department has previously excluded prices from these countries because they maintain broadly available, non–industry-specific export subsidies. See id. In addition, the Petitioner made currency conversions, where necessary, based on the POI– average rupee/U.S. dollar exchange rate, as reported on the Department’s website. See Supplement to the AD PRC Petition, at 16 and Exhibit R–8. Petitioner determined labor costs using the labor consumption, in hours, derived from its own experience. See AD PRC Petition at Exhibit 12. Petitioner valued labor costs using the Department’s NME Wage Rate for the PRC at http://ia.ita.doc.gov/wages/ 05wages/05wages–051608.html. See Supplement to the AD PRC Petition, at Exhibit R–8. For purposes of initiation, the Department determines that the surrogate values used by Petitioner are reasonably available and, thus, acceptable for purposes of initiation.
Petitioner determined electricity costs using the electricity consumption, in kilowatt hours, derived from its own experience. See AD PRC Petition at Exhibit 12. Petitioner valued electricity using the Indian electricity rate reported by the Central Electric Authority of the Government of India. See Supplement to the AD PRC Petition, at 16 and Exhibit R–8.
Petitioner determined natural gas costs using the natural gas consumption derived from its own experience. See AD PRC Petition at Exhibit 12. Petitioner valued natural gas using
Indian import statistics from WTA. See Supplement to the AD PRC Petition, at Exhibit R–8.
Petitioner based factory overhead, selling, general and administrative (‘‘SG&A’’), and profit on data from IFGL Refractories Ltd. (‘‘IFGL’’), a producer of refractory products, for the fiscal year April 2007 through March 2008. See AD PRC Petition at Exhibit 13. Petitioner states that, as a manufacturer of non– subject products within the same general category of merchandise as magnesia carbon bricks, IFGL’s main operation in India can be considered a reasonable surrogate. See Supplement to the AD PRC Petition, at 17–18. Therefore, for purposes of the initiation, the Department finds Petitioner’s use of IFGL’s unconsolidated financial ratios appropriate.
Mexico Petitioner calculated NV for magnesia
carbon bricks using CV because Petitioner was unable to obtain home market or third country prices. See AD Mexico Petition at 13.
Pursuant to section 773(e) of the Act, CV consists of the cost of manufacturing (‘‘COM’’), SG&A expenses, packing expenses, and profit. In calculating COM and packing, Petitioner based the quantity of each of the inputs used to manufacture and pack magnesia carbon bricks in Mexico on its own production experience during 2008. See AD Mexico Petition at 14, and Exhibits 9 and 11, Supplement to the AD Mexico Petition, at Exhibit R–9, and Second Supplement to the AD Mexico Petition, at Exhibit R– 14. Petitioner notes that, to the best of its knowledge, the magnesia carbon bricks manufacturing process in Mexico is very similar to its magnesia carbon bricks manufacturing process. Accordingly, Petitioner states that it is reasonable to estimate the Mexican producer’s usage rates based on its own usage rates experienced in producing magnesia carbon bricks. Petitioner also states that certain ‘‘brands’’ (i.e., models) of RHI–Refmex’s magnesia carbon bricks are identical or very similar to its corresponding brands in terms of quantity and type of raw materials used, energy consumed, and the composition of the finished product. See AD Mexico Petition at 14 and 15, and Supplement to the AD Mexico Petition, at 14 and Exhibit R–9.
Petitioner multiplied the usage quantities of the inputs used to manufacture and pack magnesia carbon bricks by the Mexican values of those inputs based on publicly available data. See AD Mexico Petition, at 15 and Exhibit 10, Supplement to the AD Mexico Petition, at Exhibit R–8, and
VerDate Nov<24>2008 22:52 Aug 24, 2009 Jkt 217001 PO 00000 Frm 00014 Fmt 4703 Sfmt 4703 E:\FR\FM\25AUN1.SGM 25AUN1pwal
ker
on D
SK
8KY
BLC
1PR
OD
with
NO
TIC
ES
42856 Federal Register / Vol. 74, No. 163 / Tuesday, August 25, 2009 / Notices
Second Supplement to the AD Mexico Petition, at Exhibit R–14.
Raw materials (e.g., magnesite) are significant inputs used in the production of magnesia carbon bricks. Petitioner determined the consumption quantities of all raw materials and packing materials based on its own production experience. See AD Mexico Petition, at 14, and Exhibits 9 and 11, and Supplement to the AD Mexico Petition, at Exhibit R–9. Petitioner valued all raw materials and packing materials using Mexican import statistics as reflected in the WTA data for the period from June 2008 through May 2009, the most recent data available. Petitioner excluded from these import statistics imports from countries previously determined by the Department to be NME countries and from India, Indonesia, the Republic of Korea, and Thailand, as the Department has previously excluded prices from these countries because they maintain broadly available, non–industry-specific export subsidies. See AD Mexico Petition at Exhibit 10, and Supplement to the AD Mexico Petition, at Exhibit R– 8.
Petitioner determined labor costs using the labor consumption in hours derived from its own experience. Petitioner relied on Mexican wage rate data available from the Import Administration website at http:// ia.ita.doc.gov/wages to determine the average wage rate in Mexico. See AD Mexico Petition at 15, and Supplement to the AD Mexico Petition, at 17.
Petitioner determined the costs of electricity and natural gas using consumption amounts derived from its own experience. Petitioner valued electricity using the POI Mexican electricity rates for medium–sized enterprises reported by the Mexico Secretary of Energy at http:// www.sener.gob.mx. Petitioner converted the Mexican electricity rates into U.S. dollars using the Department’s POI exchange rates. Petitioner valued natural gas using Mexican import statistics as reflected in the WTA data for the period from June 2008 through May 2009, the most recent data available. See AD Mexico Petition at Exhibit 10, and Supplement to the AD Mexico Petition, at 18 and Exhibit R–8.
To calculate factory overhead, SG&A expenses, and profit, Petitioner relied on the financial statements of a Mexican producer of ceramic products, Grupo Lamosa, S.A.B. de C.V., a company that produces products in the same general category of merchandise as magnesia carbon bricks. See Supplement to the AD Mexico Petition, at Exhibit R–8, and Second Supplement to the AD Mexico
Petition, at Exhibit R–13. See also Mexico Initiation Checklist.
Fair–Value Comparisons Based on the data provided by
Petitioner, there is reason to believe that imports of magnesia carbon bricks from the PRC and Mexico are being, or are likely to be, sold in the United States at less than fair value. Based on a comparison of U.S. prices and NV calculated in accordance with section 773(c) of the Act, the estimated dumping margins for magnesia carbon bricks from the PRC range from 112 percent to 349 percent. See PRC Initiation Checklist. Based on a comparison of U.S. price and CV calculated in accordance with section 773(a)(4) of the Act, the estimated dumping margins for magnesia carbon bricks from Mexico range from 153 percent to 295 percent. See Mexico Initiation Checklist; see also Supplement to the AD Mexico Petition, at Exhibit R–10, and Second Supplement to the AD Mexico Petition, at Exhibit R–14 and R–15.
Initiation of Antidumping Investigations
Based upon the examination of the Petitions on magnesia carbon bricks from the PRC and Mexico, the Department finds that the Petitions meet the requirements of section 732 of the Act. Therefore, we are initiating antidumping duty investigations to determine whether imports of magnesia carbon bricks from the PRC and Mexico are being, or are likely to be, sold in the United States at less than fair value. In accordance with section 733(b)(1)(A) of the Act and 19 CFR 351.205(b)(1), unless postponed, we will make our preliminary determinations no later than 140 days after the date of this initiation.
Targeted–Dumping Allegations On December 10, 2008, the
Department issued an interim final rule for the purpose of withdrawing 19 CFR 351.414(f) and (g), the regulatory provisions governing the targeted- dumping analysis in antidumping duty investigations, and the corresponding regulation governing the deadline for targeted–dumping allegations, 19 CFR 351.301(d)(5). See Withdrawal of the Regulatory Provisions Governing Targeted Dumping in Antidumping Duty Investigations, 73 FR 74930 (December 10, 2008). The Department stated that ‘‘{w}ithdrawal will allow the Department to exercise the discretion intended by the statute and, thereby, develop a practice that will allow interested parties to pursue all statutory
avenues of relief in this area.’’ See id. at 74931.
In order to accomplish this objective, if any interested party wishes to make a targeted- dumping allegation in any of these investigations pursuant to section 777A(d)(1)(B) of the Act, such allegations are due no later than 45 days before the scheduled date of the country–specific preliminary determination.
Respondent Selection
The PRC
For this investigation, the Department will request quantity and value information from all known exporters and producers identified with complete contact information in the AD PRC Petition. The quantity and value data received from NME exporters/producers will be used as the basis to select the mandatory respondents.
The Department requires that the respondents submit a response to both the quantity and value questionnaire and the separate–rate application by the respective deadlines in order to receive consideration for separate–rate status. See Circular Welded Austenitic Stainless Pressure Pipe from the People’s Republic of China: Initiation of Antidumping Duty Investigation, 73 FR 10221, 10225 (February 26, 2008); Initiation of Antidumping Duty Investigation: Certain Artist Canvas From the People’s Republic of China, 70 FR 21996, 21999 (April 28, 2005). The Department will post the quantity and value questionnaire along with the filing instructions on the Import Administration website at http:// ia.ita.doc.gov/ia–highlights-and– news.html, and a response to the quantity and value questionnaire is due no later than September 10, 2009. Also, the Department will send the quantity and value questionnaire to those PRC companies identified in the AD PRC Petition, at Exhibit 9.
Mexico
For this investigation, the Department intends to select respondents based on U.S. Customs and Border Protection (‘‘CBP’’) data for U.S. imports under the Harmonized Tariff Schedule of the United States (‘‘HTSUS’’) numbers 6902.10.10.00 and 6902.10.50.00, the two HTSUS categories most specific to the subject merchandise, during the POI. We intend to release the CBP data under Administrative Protective Order (‘‘APO’’) to all parties with access to information protected by APO within five days of publication of this Federal Register notice and make our decision regarding respondent selection within
VerDate Nov<24>2008 22:52 Aug 24, 2009 Jkt 217001 PO 00000 Frm 00015 Fmt 4703 Sfmt 4703 E:\FR\FM\25AUN1.SGM 25AUN1pwal
ker
on D
SK
8KY
BLC
1PR
OD
with
NO
TIC
ES
42857 Federal Register / Vol. 74, No. 163 / Tuesday, August 25, 2009 / Notices
20 days of publication of this notice. The Department invites comments regarding the CBP data and respondent selection within ten days of publication of this Federal Register notice.
Interested parties must submit applications for disclosure under APO in accordance with 19 CFR 351.305. Instructions for filing such applications may be found on the Department’s website at http://ia.ita.doc.gov/apo.
Separate Rates
In order to obtain separate–rate status in NME investigations, exporters and producers must submit a separate–rate status application. See our practice, described in Policy Bulletin 05.1: Separate–Rates Practice and Application of Combination Rates in Antidumping Investigations involving Non–Market Economy Countries, dated April 5, 2005 (‘‘Separate Rates and Combination Rates Bulletin’’), available on the Department’s website at http:// ia.ita.doc.gov/policy/bull05–1.pdf. Based on our experience in processing the separate–rate applications in previous antidumping duty investigations, we have modified the application for this investigation to make it more administrable and easier for applicants to complete. See, e.g., Initiation of Antidumping Duty Investigation: Certain New Pneumatic Off–the-Road Tires From the People’s Republic of China, 72 FR 43591, 43594– 95 (August 6, 2007). The specific requirements for submitting the separate–rate application in this investigation are outlined in detail in the application itself, which will be available on the Department’s website at http://ia.ita.doc.gov/ia–highlights-and– news.html on the date of publication of this initiation notice in the Federal Register. The separate–rate application will be due 60 days after publication of this initiation notice. For exporters and producers who submit a separate–rate status application and subsequently are selected as mandatory respondents, these exporters and producers will no longer be eligible for consideration for separate rate status unless they respond to all parts of the questionnaire as mandatory respondents. As noted in the ‘‘Respondent Selection’’ section above, the Department requires that respondents submit a response to both the quantity and value questionnaire and the separate rate application by the respective deadlines in order to receive consideration for separate–rate status. The quantity and value questionnaire will be available on the Department’s website at http://ia.ita.doc.gov/ia– highlights-and–news.html on the date of
the publication of this initiation notice in the Federal Register.
Use of Combination Rates in an NME Investigation
The Department will calculate combination rates for certain respondents that are eligible for a separate rate in this investigation. The Separate Rates and Combination Rates Bulletin states:
{w}hile continuing the practice of assigning separate rates only to exporters, all separate rates that the Department will now assign in its NME investigations will be specific to those producers that supplied the exporter during the period of investigation. Note, however, that one rate is calculated for the exporter and all of the producers which supplied subject merchandise to it during the period of investigation. This practice applies both to mandatory respondents receiving an individually calculated separate rate as well as the pool of non– investigated firms receiving the weighted–average of the individually calculated rates. This practice is referred to as the application of ‘‘combination rates’’ because such rates apply to specific combinations of exporters and one or more producers. The cash– deposit rate assigned to an exporter will apply only to merchandise both exported by the firm in question and produced by a firm that supplied the exporter during the period of investigation.
See Separate Rates and Combination Rates Bulletin at 6 (emphasis added).
Distribution of Copies of the Petitions In accordance with section
732(b)(3)(A) of the Act and 19 CFR 351.202(f), copies of the public versions of the Petitions have been provided to the representatives of the Governments of the PRC and Mexico. Because of the large number of producers/exporters identified in the AD PRC Petition, the Department considers the service of the public version of the AD PRC Petition to the foreign producers/exporters satisfied by the delivery of the public version to the Government of the PRC, consistent with 19 CFR 351.203(c)(2).
ITC Notification We have notified the ITC of our
initiations, as required by section 732(d) of the Act.
Preliminary Determinations by the ITC The ITC will preliminarily determine,
no later than September 14, 2009,
whether there is a reasonable indication that imports of magnesia carbon bricks from the PRC and Mexico are materially injuring, or threatening material injury to a U.S. industry. A negative ITC determination with respect to any country will result in the investigation being terminated for that country; otherwise, these investigations will proceed according to statutory and regulatory time limits.
This notice is issued and published pursuant to section 777(i) of the Act.
Dated: August 18, 2009. Carole Showers, Acting Deputy Assistant Secretary for Policy and Negotiations.
Appendix I
Scope of the Investigations Imports covered by this petition
consist of certain chemically bonded (resin or pitch), magnesia carbon bricks with a magnesia component of at least 70 percent magnesia (‘‘MgO’’) by weight, regardless of the source of raw materials for the MgO, with carbon levels ranging from trace amounts to 30 percent by weight, regardless of enhancements, (for example, magnesia carbon bricks can be enhanced with coating, grinding, tar impregnation or coking, high temperature heat treatments, anti–slip treatments or metal casing) and regardless of whether or not anti–oxidants are present (for example, antioxidants can be added to the mix from trace amounts to 15 percent by weight as various metals, metal alloys, and metal carbides). Certain magnesia carbon bricks that are the subject of this investigation are currently classifiable under subheadings 6902.10.10.00, 6902.10.50.00, 6815.91.00.00, and 6815.99 of the Harmonized Tariff Schedule of the United States (HTSUS). While HTSUS subheadings are provided for convenience and customs purposes, the written description is dispositive. [FR Doc. E9–20494 Filed 8–24–09; 8:45 am] BILLING CODE 3510–DS–S
DEPARTMENT OF COMMERCE
International Trade Administration
[C–533–821]
Hot–Rolled Carbon Steel Products from India: Extension of Time Limit for Preliminary Results of Countervailing Duty Administrative Review
AGENCY: Import Administration, International Trade Administration, Department of Commerce. FOR FURTHER INFORMATION CONTACT: Gayle Longest, AD/CVD Operations,
VerDate Nov<24>2008 22:52 Aug 24, 2009 Jkt 217001 PO 00000 Frm 00016 Fmt 4703 Sfmt 4703 E:\FR\FM\25AUN1.SGM 25AUN1pwal
ker
on D
SK
8KY
BLC
1PR
OD
with
NO
TIC
ES

42858 Federal Register / Vol. 74, No. 163 / Tuesday, August 25, 2009 / Notices
1 September 8, 2009 is the first business day after twenty calendar days from the signature date of this notice.
Office 3, Import Administration, International Trade Administration, U.S. Department of Commerce, Room 4014, 14th Street and Constitution Ave., NW, Washington, DC 20230, telephone: (202) 482–3338.
SUPPLEMENTARY INFORMATION:
Background
On February 2, 2009, the U.S. Department of Commerce (‘‘the Department’’) published a notice of initiation of the administrative review of the countervailing duty order on hot– rolled carbon steel products from India covering the period January 1, 2008, through December 31, 2008. See Initiation of Antidumping and Countervailing Duty Administrative Reviews and Request for Revocation in Part, 74 FR 5821 (February 2, 2009). The preliminary results are currently due no later than September 2, 2009.
Extension of Time Limit for Preliminary Results
Section 751(a)(3)(A) of the Tariff Act of 1930, as amended (‘‘the Act’’), requires the Department to make a preliminary determination within 245 days after the last day of the anniversary month of an order for which a review is requested. Section 751(a)(3)(A) of the Act further states that if it is not practicable to complete the review within the time period specified, the administering authority may extend the 245-day period to issue its preliminary results to up to 365 days.
Due to the complexity of the issues in this administrative review, such as the number of programs under review during the POR, we have determined that it is not practicable to complete the preliminary results within the 245-day period. Therefore, in accordance with section 751(a)(3)(A) of the Act, we are extending the time period for issuing the preliminary results of the review by 120 days. The preliminary results are now due no later than December 31, 2009. The final results continue to be due 120 days after publication of the preliminary results.
This notice is issued and published in accordance with section 751(a)(3)(A) of the Act.
Dated: August 19, 2009.
John M. Andersen, Acting Deputy Assistant Secretary for Antidumping and Countervailing Duty Operations. [FR Doc. E9–20501 Filed 8–24–09; 8:45 am]
BILLING CODE 3510–DS–S
DEPARTMENT OF COMMERCE
International Trade Administration
[C–570–955]
Certain Magnesia Carbon Bricks from the People’s Republic of China: Initiation of Countervailing Duty Investigation
AGENCY: Import Administration, International Trade Administration, Department of Commerce DATES: Effective Date: August 25, 2009. FOR FURTHER INFORMATION CONTACT: Justin Neuman, Toni Page, or Nicholas Czajkowski; AD/CVD Operations, Office 6, Import Administration, International Trade Administration, U.S. Department of Commerce, 14th Street and Constitution Avenue NW, Washington, D.C. 20230; telephone: (202) 482–0486, (202) 482–1398, or (202) 482–1395 respectively.
SUPPLEMENTARY INFORMATION:
The Petitions
On July 29, 2009, the Department of Commerce (the Department) received countervailing duty (CVD) and antidumping (AD) petitions concerning imports of certain magnesia carbon bricks (magnesia carbon bricks) from the People’s Republic of China (PRC) filed in proper form by Resco Products, Inc. (Petitioner), domestic producers of magnesia carbon bricks. See ‘‘Petition for the Imposition of Countervailing Duties: Certain Magnesia Carbon Bricks from the People’s Republic of China’’ (CVD PRC Petition). On August 3, 2009, the Department spoke via telephone with petitioner to request additional information and clarification of certain areas of the CVD petition involving countervailable subsidy allegations. See Memorandum from Mark Hoadley, Program Manager, AD/CVD Operations, Office 6, to the File, ‘‘CVD Petition for Investigation of Magnesia Carbon Bricks from the People’s Republic of China (PRC): Phone Call with Counsel for Petitioner’’ dated August 4, 2009. Based on the Department’s requests, the Petitioner timely filed additional information on August 7, 2009. On August 4 and 12, 2009, the Department issued additional requests for information and clarification of certain areas of the CVD PRC Petition. Based on the Department’s requests, Petitioner timely filed additional information pertaining to the CVD PRC Petition on August 10 and 14, 2009, (hereinafter, Supplement to the CVD PRC Petition dated August 10, 2009 and Second Supplement to the CVD PRC Petition, dated August 14, 2009).
In accordance with section 702(b)(1) of the Tariff Act of 1930, as amended (the Act), Petitioner alleges that producers/exporters of magnesia carbon bricks in the PRC received countervailable subsidies within the meaning of section 701 and 771(5) of the Act, and that imports from these exporters/producers materially injure, or threaten material injury to, an industry in the United States.
The Department finds that Petitioner filed this CVD PRC Petition on behalf of the domestic industry because it is an interested party as defined in section 771(9)(C) of the Act, and Petitioner has demonstrated sufficient industry support with respect to the countervailing duty investigation that it is requesting the Department to initiate (see ‘‘Determination of Industry Support for the CVD Petition’’ below).
Period of Investigation
The anticipated period of investigation (POI) is calendar year 2008. See 19 CFR 351.204(b)(2).
Scope of Investigation
The products covered by this investigation are magnesia carbon bricks from the PRC. For a full description of the scope of the investigation, please see the ‘‘Scope of Investigation’’ in Appendix I to this notice.
Comments on Scope of Investigation
During our review of the CVD PRC Petition, we discussed the scope with Petitioner to ensure that it is an accurate reflection of the products for which the domestic industry is seeking relief. Moreover, as discussed in the preamble to the regulations (See Antidumping Duties; Countervailing Duties; Final Rule, 62 FR 27296, 27323 (May 19, 1997)), we are setting aside a period for interested parties to raise issues regarding product coverage. The Department encourages all interested parties to submit such comments by September 8, 2009.1 Comments should be addressed to Import Administration’s APO/Dockets Unit, Room 1870, U.S. Department of Commerce, 14th Street and Constitution Avenue, NW, Washington, DC 20230. The period of scope consultations is intended to provide the Department with ample opportunity to consider all comments and to consult with parties prior to the issuance of the preliminary determinations.
VerDate Nov<24>2008 00:58 Aug 25, 2009 Jkt 217001 PO 00000 Frm 00017 Fmt 4703 Sfmt 4703 E:\FR\FM\25AUN1.SGM 25AUN1pwal
ker
on D
SK
8KY
BLC
1PR
OD
with
NO
TIC
ES

42859 Federal Register / Vol. 74, No. 163 / Tuesday, August 25, 2009 / Notices
Consultations
Pursuant to section 702(b)(4)(A)(ii) of the Act, the Department held consultations with the government of the PRC (hereinafter, the GOC) with respect to the CVD PRC Petition on August 7, 2009. See Memorandum to the File, Countervailing Duty Petitions on Certain Magnesia Carbon Bricks from the People’s Republic of China: Consultations with the Government of the People’s Republic of China, on file in the Central Records Unit (CRU), Room 1117 of the main Department of Commerce building.
Determination of Industry Support for the CVD Petition
Section 702(b)(1) of the Act requires that a petition be filed on behalf of the domestic industry. Section 702(c)(4)(A) of the Act provides that a petition meets this requirement if the domestic producers or workers who support the petition account for: (i) at least 25 percent of the total production of the domestic like product; and (ii) more than 50 percent of the production of the domestic like product produced by that portion of the industry expressing support for, or opposition to, the petition. Moreover, section 702(c)(4)(D) of the Act provides that, if the petition does not establish support of domestic producers or workers accounting for more than 50 percent of the total production of the domestic like product, the Department shall: (i) poll the industry or rely on other information in order to determine if there is support for the petition, as required by subparagraph (A); or (ii) determine industry support using a statistically valid sampling method.
Section 771(4)(A) of the Act defines the ‘‘industry’’ as the producers as a whole of a domestic like product. Thus, to determine whether a petition has the requisite industry support, the statute directs the Department to look to producers and workers who produce the domestic like product. The United States International Trade Commission (ITC), which is responsible for determining whether ‘‘the domestic industry’’ has been injured, must also determine what constitutes a domestic like product in order to define the industry. While both the Department and the ITC must apply the same statutory definition regarding the domestic like product (see section 771(10) of the Act), they do so for different purposes and pursuant to a separate and distinct authority. In addition, the Department’s determination is subject to limitations of time and information. Although this
may result in different definitions of the like product, such differences do not render the decision of either agency contrary to law. See USEC, Inc. v. United States, 132 F. Supp. 2d 1, 8 (Ct. Int’l Trade 2001), citing Algoma Steel Corp. Ltd. v. United States, 688 F. Supp. 639, 644 (Ct. Int’l Trade 1988), aff’d 865 F.2d 240 (Fed. Cir. 1989), cert. denied 492 U.S. 919 (1989).
Section 771(10) of the Act defines the domestic like product as ‘‘a product which is like, or in the absence of like, most similar in characteristics and uses with, the article subject to an investigation under this title.’’ Thus, the reference point from which the domestic like product analysis begins is ‘‘the article subject to an investigation’’ (i.e., the class or kind of merchandise to be investigated, which normally will be the scope as defined in the petition).
With regard to the domestic like product, Petitioner does not offer a definition of domestic like product distinct from the scope of the investigations. Based on our analysis of the information submitted on the record, we have determined that magnesia carbon bricks constitute a single domestic like product and we have analyzed industry support in terms of that domestic like product. For a discussion of the domestic like product analysis in this case, see Countervailing Duty Investigation Initiation Checklist: Magnesia Carbon Bricks from the PRC (CVD Initiation Checklist) at Attachment II, Analysis of Industry Support for the Petitions Covering Certain Magnesia Carbon Bricks from the People’s Republic of China and Mexico, dated concurrently with this notice and on file in the CRU, Room 1117 of the main Department of Commerce building.
In determining whether Petitioner has standing under section 702(c)(4)(A) of the Act, we considered the industry support data contained in the CVD PRC Petition with reference to the domestic like product as defined in the ‘‘Scope of Investigations,’’ Appendix I of this notice. To establish industry support, Petitioner provided its own 2008 production of the domestic like product, as well as the production of the two supporters of the CVD PRC Petition, and compared this to the estimated total production of the domestic like product for the entire domestic industry. See the CVD PRC Petition, at Exhibits 2–4, Supplement to the CVD PRC Petition, dated August 10, 2009, at 8–12, and Exhibits R2–R–6, and Second Supplement to the CVD PRC Petition, dated August 14, 2009, at 1–2. Petitioner estimated total 2008 production of the domestic like product based on its own production data, data from the two
supporters of the CVD PRC Petition, and knowledge of the U.S. industry. See the CVD PRC Petition, at Exhibits 2–4, Supplement to the CVD PRC Petition, dated August 10, 2009, at 8–12, and Exhibits R2–R–6, and Second Supplement to the CVD PRC Petition, dated August 14, 2009, at 1–2; see also CVD Initiation Checklist at Attachment II.
Our review of the data provided in the CVD PRC Petition, the supplemental submissions, and other information readily available to the Department indicates that Petitioner has established industry support. First, the CVD PRC Petition established support from domestic producers (or workers) accounting for more than 50 percent of the total production of the domestic like product and, as such, the Department is not required to take further action in order to evaluate industry support (e.g., polling). See section 702(c)(4)(D) of the Act, see also CVD Initiation Checklist at Attachment II. Second, the domestic producers (or workers) have met the statutory criteria for industry support under section 702(c)(4)(A)(i) of the Act because the domestic producers (or workers) who support the CVD PRC Petition account for at least 25 percent of the total production of the domestic like product. See CVD Initiation Checklist at Attachment II. Finally, the domestic producers (or workers) have met the statutory criteria for industry support under section 702(c)(4)(A)(ii) of the Act because the domestic producers (or workers) who support the CVD PRC Petition account for more than 50 percent of the production of the domestic like product produced by that portion of the industry expressing support for, or opposition to, the CVD PRC Petition. Accordingly, the Department determines that the CVD PRC Petition was filed on behalf of the domestic industry within the meaning of section 702(b)(1) of the Act. See id.
The Department finds that Petitioner filed the CVD PRC Petition on behalf of the domestic industry because it is an interested party as defined in section 771(9)(C) of the Act and it has demonstrated sufficient industry support with respect to the countervailing investigation that it is requesting the Department to initiate. See id.
Injury Test Because the PRC is a ‘‘Subsidies
Agreement Country’’ within the meaning of section 701(b) of the Act, section 701(a)(2) of the Act applies to this investigation. Accordingly, the ITC must determine whether imports of the subject merchandise from the PRC
VerDate Nov<24>2008 22:52 Aug 24, 2009 Jkt 217001 PO 00000 Frm 00018 Fmt 4703 Sfmt 4703 E:\FR\FM\25AUN1.SGM 25AUN1pwal
ker
on D
SK
8KY
BLC
1PR
OD
with
NO
TIC
ES
42860 Federal Register / Vol. 74, No. 163 / Tuesday, August 25, 2009 / Notices
materially injure, or threaten material injury to, a U.S. industry.
Allegations and Evidence of Material Injury and Causation
Petitioner alleges that imports of magnesia carbon bricks from the PRC are benefitting from countervailable subsidies and that such imports are causing, or threaten to cause, material injury to the domestic industry producing magnesia carbon bricks. In addition, Petitioner alleges that subsidized imports exceed the negligibility threshold provided for under section 771(24)(A) of the Act.
Petitioner contends that the industry’s injured condition is illustrated by reduced market share, underselling and price depressing and suppressing effects, increased import penetration, lost sales and revenue, reduced production, reduced capacity utilization, reduced shipments, reduced employment, and overall poor financial performance. We have assessed the allegations and supporting evidence regarding material injury, threat of material injury, and causation, and we have determined that these allegations are properly supported by adequate evidence and meet the statutory requirements for initiation. See CVD Initiation Checklist at Attachment III, Analysis of Allegations and Evidence of Material Injury and Causation for the Petitions Covering Certain Magnesia Carbon Bricks from the People’s Republic of China and Mexico.
Initiation of Countervailing Duty Investigation
Section 702(b)(1) of the Act requires the Department to initiate a CVD proceeding whenever an interested party files a CVD petition on behalf of an industry that: (1) alleges the elements necessary for an imposition of a duty under section 701(a) of the Act; and (2) is accompanied by information reasonably available to the petitioners supporting the allegations.
The Department has examined the CVD PRC Petition on magnesia carbon bricks from the PRC and finds that it complies with the requirements of section 702(b)(1) of the Act. Therefore, in accordance with section 702(b)(1) of the Act, we are initiating a CVD investigation to determine whether producers/exporters of magnesia carbon bricks in the PRC receive countervailable subsidies. For a discussion of evidence supporting our initiation determination, see CVD Initiation Checklist.
We are including in our investigation the following programs alleged in the CVD PRC Petition to provide
countervailable subsidies to producers/ exporters of the subject merchandise: A. Provision of Inputs for Less than Adequate Remuneration (LTAR)
1. Provision of Land–Use Rights to State–Owned Enterprises (SOEs) for LTAR
2. Provision of Electricity at LTAR B. Export Restraints of Raw Materials C. Tax Benefit Programs
1. Two Free/Three Half Program for Foreign–Invested Enterprises (FIEs)
2. Income Tax Reductions for Export– Oriented FIEs
3. Preferential Income Tax Policy for Enterprises in the Northeast Region
4. Forgiveness of Tax Arrears for Enterprises in the Old Industrial Bases of Northeast China
5. Location–Based Income Tax Reduction Programs for FIEs
6. Local Income Tax Exemption and Reduction Programs for ‘‘Productive’’ FIEs
7. Domestic Preference Tax Benefits a. Income Tax Credits for
Domestically Owned Companies Purchasing Domestically Produced Equipment
b. Income Tax Credits for FIEs Purchasing Domestically Produced Equipment
c. VAT Rebates on Purchases of Domestically Produced Equipment
8. Preferential Tax Programs for Enterprises Recognized as High or New Technology Enterprises
D. Northeast Revitalization Program and Related Provincial Policies
a. E. Direct Grants 1. The State Key Technology
Renovation Project Fund 2. Famous Brands Programs
F. Grants to Companies for ‘‘Outward Expansion’’ and Export Performance in Guangdong Province G. Preferential Loans and Directed Credit to the Magnesia Carbon Brick Industry H. Cash Grant Programs
1. Fund for Supporting Technological Innovation for Technological Small- and Medium–Sized Enterprises (SMEs)
2. Development Fund for SMEs 3. Fund for International Market
Exploration by SMEs I. Zhejiang Province Program to Rebate Antidumping Costs
For further information explaining why the Department is investigating these programs, see CVD Initiation Checklist.
We are not including in our investigation the following programs alleged to benefit producers/exporters of the subject merchandise in the PRC: A. Provision of Water for Less Than Adequate Remuneration
B. Provision of Natural Gas for Less Than Adequate Remuneration C. VAT and Tariff Exemptions for Purposes of Fixed Assets Under the Foreign Trade Development Fund Program D. Shenzhen City Program to Rebate Antidumping Costs
For further information explaining why the Department is not initiating an investigation of these programs, see CVD Initiation Checklist.
Respondent Selection
For this investigation, the Department intends to select respondents based on U.S. Customs and Border Protection (CBP) data for U.S. imports during the POI (i.e., calendar year 2008). We intend to release the CBP data under Administrative Protective Order (APO) to all parties with access to information protected by APO within five days of the announcement of the initiation of this investigation. Interested parties may submit comments regarding the CBP data and respondent selection within seven calendar days of publication of this notice. We intend to make our decision regarding respondent selection within 20 days of publication of this notice.
Interested parties must submit applications for disclosure under APO in accordance with 19 CFR 351.305(b). Instructions for filing such applications may be found on the Department’s website at http://ia.ita.doc.gov/apo.
Distribution of Copies of the CVD Petition
In accordance with section 702(b)(4)(A)(i) of the Act and 19 CFR 351.202(f), a copy of the public version of the CVD PRC Petition has been provided to the representatives of the GOC. Because of the particularly large number of producers/exporters identified in the CVD PRC Petition, the Department considers the service of the public version of the petition to the foreign producers/exporters satisfied by the delivery of the public version to the GOC, consistent with 19 CFR 351.203(c)(2).
ITC Notification
We have notified the ITC of our initiation, as required by section 702(d) of the Act.
Preliminary Determination by the ITC
The ITC will preliminarily determine, within 45 days after the date on which the petition was filed, whether there is a reasonable indication that imports of subsidized magnesia carbon bricks from the PRC materially injure, or threaten material injury to, a U.S. industry. See
VerDate Nov<24>2008 22:52 Aug 24, 2009 Jkt 217001 PO 00000 Frm 00019 Fmt 4703 Sfmt 4703 E:\FR\FM\25AUN1.SGM 25AUN1pwal
ker
on D
SK
8KY
BLC
1PR
OD
with
NO
TIC
ES
42861 Federal Register / Vol. 74, No. 163 / Tuesday, August 25, 2009 / Notices
section 703(a)(2) of the Act. A negative ITC determination will result in the investigation being terminated; see section 703(a)(1) of the Act. Otherwise, the investigation will proceed according to statutory and regulatory time limits.
This notice is issued and published pursuant to section 777(i) of the Act.
Dated: August 18, 2009. Carole Showers, Acting Deputy Assistant Secretary for Policy and Negotiations.
Appendix I
Scope of the Investigation Imports covered by this petition
consist of certain chemically bonded (resin or pitch), magnesia carbon bricks with a magnesia component of at least 70 percent magnesia (‘‘MgO’’) by weight, regardless of the source of raw materials for the MgO, with carbon levels ranging from trace amounts to 30 percent by weight, regardless of enhancements, (for example, magnesia carbon bricks can be enhanced with coating, grinding, tar impregnation or coking, high temperature heat treatments, anti–slip treatments or metal casing) and regardless of whether or not anti–oxidants are present (for example, antioxidants can be added to the mix from trace amounts to 15 percent by weight as various metals, metal alloys, and metal carbides). Certain magnesia carbon bricks that are the subject of this investigation are currently classifiable under subheadings 6902.10.10.00, 6902.10.50.00, 6815.91.00.00, and 6815.99 of the Harmonized Tariff Schedule of the United States (HTSUS). While HTSUS subheadings are provided for convenience and customs purposes, the written description is dispositive.
[FR Doc. E9–20493 Filed 8–24–09; 8:45 am] BILLING CODE 3510–DS–S
DEPARTMENT OF COMMERCE
National Oceanic and Atmospheric Administration
RIN 0648–XR07
Endangered Species; File No. 14396
AGENCY: National Marine Fisheries Service (NMFS), National Oceanic and Atmospheric Administration (NOAA), Commerce. ACTION: Notice; receipt of application.
SUMMARY: Notice is hereby given that the Delaware Department of Natural Resources and Environmental Control- Division of Fish and Wildlife, Dover, Delaware, has applied in due form for a permit to take shortnose sturgeon
(Acipenser brevirostrum) for purposes of scientific research. DATES: Written, telefaxed, or e-mail comments must be received on or before September 24, 2009. ADDRESSES: The application and related documents are available for review by selecting ‘‘Records Open for Public Comment’’ from the Features box on the Applications and Permits for Protected Species (APPS) home page, https:// apps.nmfs.noaa.gov/index.cfm, and then selecting File No. 14396 from the list of available applications. These documents are also available for review upon written request or by appointment in the following office(s):
Permits, Conservation and Education Division, Office of Protected Resources, NMFS, 1315 East-West Highway, Room 13705, Silver Spring, MD 20910; phone (301)713–2289; fax (301)713–0376; and
Northeast Region, NMFS, Protected Resources Division, 55 Great Republic Drive, Gloucester, MA 01930; phone (978)281–9300; fax (978)281–9333.
Written comments or requests for a public hearing on this application should be mailed to the Chief, Permits, Conservation and Education Division, F/PR1, Office of Protected Resources, NMFS, 1315 East-West Highway, Room 13705, Silver Spring, MD 20910. Those individuals requesting a hearing should set forth the specific reasons why a hearing on this particular request would be appropriate.
Comments may also be submitted by facsimile at (301)713–0376, provided the facsimile is confirmed by hard copy submitted by mail and postmarked no later than the closing date of the comment period.
Comments may also be submitted by e-mail. The mailbox address for providing e-mail comments is [email protected]. Include in the subject line of the e-mail comment the following document identifier: File No. 14396. FOR FURTHER INFORMATION CONTACT: Malcolm Mohead or Kate Swails, (301)713–2289. SUPPLEMENTARY INFORMATION: The subject permit is requested under the authority of the Endangered Species Act of 1973, as amended (ESA; 16 U.S.C. 1531 et seq.), and the regulations governing the taking, importing, and exporting of endangered and threatened species (50 CFR 222–226).
The applicant is seeking a five-year scientific research permit to conduct a study of shortnose sturgeon in the Delaware River. The primary study objective would be to locate and document nursery areas, individual movement patterns, seasonal
movements, home ranges, and habitats of juvenile shortnose sturgeon through the use of telemetry. This focus would be in association with an ongoing Atlantic sturgeon (Acipenser oxyrinchus oxyrhinchus) study with similar objectives. Up to 200 shortnose sturgeon would be weighed, measured, examined for tags, marked with Passive Integrated Transponder (PIT) tags and Floy tags, and released. Up to 15 early stage juvenile shortnose sturgeon would also be anesthetized and implanted with acoustic transmitters if they are of suitable size. A total of one unintentional mortality is requested over the five year term of the project which is scheduled to take place from March 1 to December 15.
Dated: August 19, 2009. P. Michael Payne, Chief, Permits, Conservation and Education Division, Office of Protected Resources, National Marine Fisheries Service. [FR Doc. E9–20491 Filed 8–24–09; 8:45 am] BILLING CODE 3510–22–S
DEPARTMENT OF COMMERCE
National Oceanic and Atmospheric Administration
RIN 0648–XQ20
Incidental Takes of Marine Mammals During Specified Activities; Marine Geophysical Survey in the Northeast Pacific Ocean, August–October, 2009
AGENCY: National Marine Fisheries Service (NMFS), National Oceanic and Atmospheric Administration (NOAA), Commerce. ACTION: Notice; issuance of incidental take authorization.
SUMMARY: In accordance with the Marine Mammal Protection Act (MMPA) regulations, notification is hereby given that NMFS has issued an Incidental Harassment Authorization (IHA) to Lamont-Doherty Earth Observatory (L-DEO), a part of Columbia University, to take small numbers of marine mammals, by Level B harassment only, incidental to conducting a marine seismic survey in the northeast Pacific Ocean. DATES: Effective August 19, 2009 through October 13, 2009. ADDRESSES: A copy of the IHA and the application are available by writing to P. Michael Payne, Chief, Permits, Conservation and Education Division, Office of Protected Resources, National Marine Fisheries Service, 1315 East- West Highway, Silver Spring, MD 20910–3225 or by telephoning the
VerDate Nov<24>2008 22:52 Aug 24, 2009 Jkt 217001 PO 00000 Frm 00020 Fmt 4703 Sfmt 4703 E:\FR\FM\25AUN1.SGM 25AUN1pwal
ker
on D
SK
8KY
BLC
1PR
OD
with
NO
TIC
ES
B-1
APPENDIX B
CONFERENCE WITNESSES

B-3
CALENDAR OF THE PUBLIC CONFERENCE
Those listed below appeared as witnesses at the United States International Trade Commission’sconference held in connection with the following investigations:
Subject: Certain Magnesia Carbon Bricks from China and Mexico Investigation No.: 701-TA-468 & 731-TA-1166-1167 (Preliminary) Date and Time: August 19, 2009 - 9:30 am
The conference was held in Room 101 (Main Hearing Room) of the United States InternationalTrade Commission Building, 500 E Street, SW, Washington, DC.
In Support of the Imposition of Antidumping and Countervailing Duties: Doyle, Barlow & Mazard
Washington, DCon behalf of
Resco Products, Inc.
William K. Brown, President and CEO, Resco Products, Inc.Richard W. Copp, Vice President of Sales and Marketing, Resco Products, Inc.Tim Powell, Vice President of Finance and Chief Financial Officer, Resco Products, Inc.John Castilano, Chief Operating Officer, Resco Products, Inc. Dr. Patrick J. Magrath, Georgetown Economic Services
Camelia Mazard - OF COUNSELAndre P. BarlowRobert W. Doyle, Jr.
In Opposition to the Imposition of Antidumping and Countervailing Duties: Garvey, Schubert, Barer
Washington, DCon behalf of
Fedmet Resources Corp.S&S Intersource, LLC
James Conrad, Vice President of Refractory Technology, Fedmet ResourcesBrian J. Stein, President, S&S IntersourceJoseph Stein, President, S&S Intersource
Lizbeth R. Levinson - OF COUNSELRonald M. Wisla
B-4
In Opposition to the Imposition of Antidumping and Countervailing Duties:–Continued
Squire, Sanders & DempseyWashington, DCon behalf of
RHI-Refmex S.A. de C.V.RHI Refractories Liaoning Co. Ltd.Veitsch-Radex America, Inc.
Ritchie T. Thomas - OF COUNSELPeter J. Koenig
Troutman SandersWashington, DCon behalf of
Vesuvius USA Corp.Yingkou Bayuquan Refractories Co. Ltd.
Julie C. Mendoza - OF COUNSELDonald B. CameronR. Will PlanertMary S. Hodgins
C-1
APPENDIX C
SUMMARY DATA

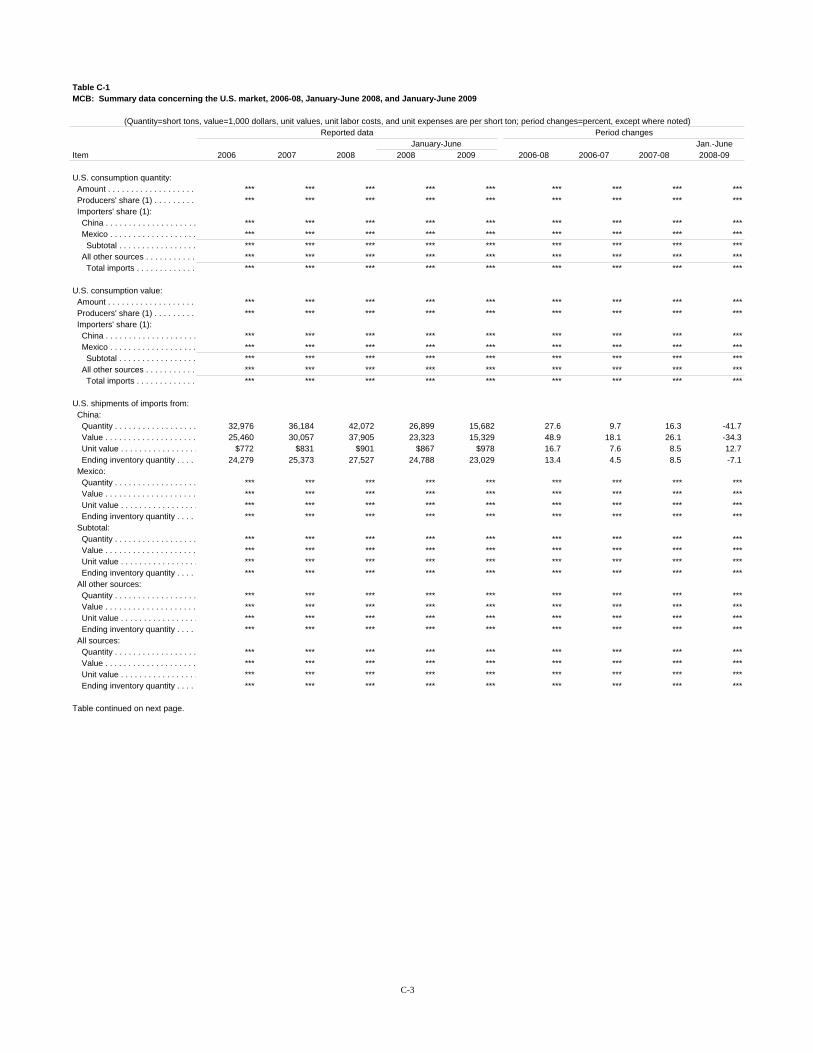
C-3
Table C-1MCB: Summary data concerning the U.S. market, 2006-08, January-June 2008, and January-June 2009
(Quantity=short tons, value=1,000 dollars, unit values, unit labor costs, and unit expenses are per short ton; period changes=percent, except where noted)Reported data Period changes
January-June Jan.-JuneItem 2006 2007 2008 2008 2009 2006-08 2006-07 2007-08 2008-09
U.S. consumption quantity: Amount . . . . . . . . . . . . . . . . . . . *** *** *** *** *** *** *** *** *** Producers' share (1) . . . . . . . . . *** *** *** *** *** *** *** *** *** Importers' share (1): China . . . . . . . . . . . . . . . . . . . . *** *** *** *** *** *** *** *** *** Mexico . . . . . . . . . . . . . . . . . . . *** *** *** *** *** *** *** *** *** Subtotal . . . . . . . . . . . . . . . . . *** *** *** *** *** *** *** *** *** All other sources . . . . . . . . . . . *** *** *** *** *** *** *** *** *** Total imports . . . . . . . . . . . . . *** *** *** *** *** *** *** *** ***
U.S. consumption value: Amount . . . . . . . . . . . . . . . . . . . *** *** *** *** *** *** *** *** *** Producers' share (1) . . . . . . . . . *** *** *** *** *** *** *** *** *** Importers' share (1): China . . . . . . . . . . . . . . . . . . . . *** *** *** *** *** *** *** *** *** Mexico . . . . . . . . . . . . . . . . . . . *** *** *** *** *** *** *** *** *** Subtotal . . . . . . . . . . . . . . . . . *** *** *** *** *** *** *** *** *** All other sources . . . . . . . . . . . *** *** *** *** *** *** *** *** *** Total imports . . . . . . . . . . . . . *** *** *** *** *** *** *** *** ***
U.S. shipments of imports from: China: Quantity . . . . . . . . . . . . . . . . . . 32,976 36,184 42,072 26,899 15,682 27.6 9.7 16.3 -41.7 Value . . . . . . . . . . . . . . . . . . . . 25,460 30,057 37,905 23,323 15,329 48.9 18.1 26.1 -34.3 Unit value . . . . . . . . . . . . . . . . . $772 $831 $901 $867 $978 16.7 7.6 8.5 12.7 Ending inventory quantity . . . . 24,279 25,373 27,527 24,788 23,029 13.4 4.5 8.5 -7.1 Mexico: Quantity . . . . . . . . . . . . . . . . . . *** *** *** *** *** *** *** *** *** Value . . . . . . . . . . . . . . . . . . . . *** *** *** *** *** *** *** *** *** Unit value . . . . . . . . . . . . . . . . . *** *** *** *** *** *** *** *** *** Ending inventory quantity . . . . *** *** *** *** *** *** *** *** *** Subtotal: Quantity . . . . . . . . . . . . . . . . . . *** *** *** *** *** *** *** *** *** Value . . . . . . . . . . . . . . . . . . . . *** *** *** *** *** *** *** *** *** Unit value . . . . . . . . . . . . . . . . . *** *** *** *** *** *** *** *** *** Ending inventory quantity . . . . *** *** *** *** *** *** *** *** *** All other sources: Quantity . . . . . . . . . . . . . . . . . . *** *** *** *** *** *** *** *** *** Value . . . . . . . . . . . . . . . . . . . . *** *** *** *** *** *** *** *** *** Unit value . . . . . . . . . . . . . . . . . *** *** *** *** *** *** *** *** *** Ending inventory quantity . . . . *** *** *** *** *** *** *** *** *** All sources: Quantity . . . . . . . . . . . . . . . . . . *** *** *** *** *** *** *** *** *** Value . . . . . . . . . . . . . . . . . . . . *** *** *** *** *** *** *** *** *** Unit value . . . . . . . . . . . . . . . . . *** *** *** *** *** *** *** *** *** Ending inventory quantity . . . . *** *** *** *** *** *** *** *** ***
Table continued on next page.
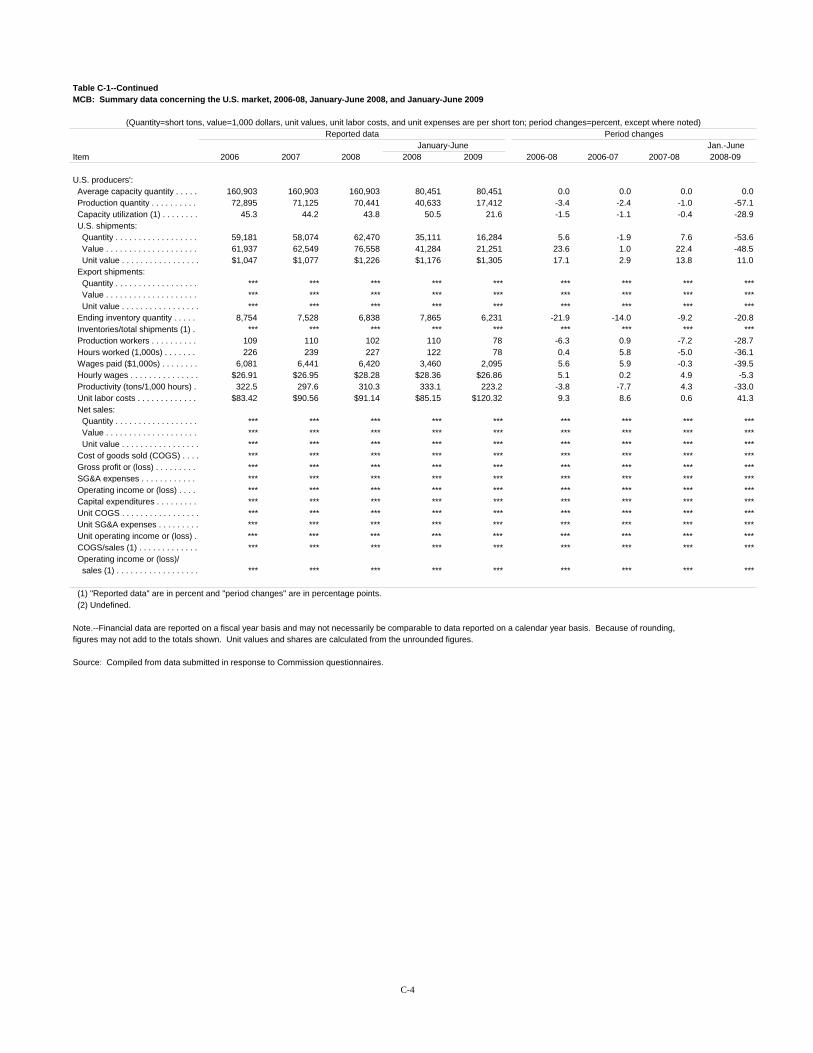
C-4
Table C-1--ContinuedMCB: Summary data concerning the U.S. market, 2006-08, January-June 2008, and January-June 2009
(Quantity=short tons, value=1,000 dollars, unit values, unit labor costs, and unit expenses are per short ton; period changes=percent, except where noted)Reported data Period changes
January-June Jan.-JuneItem 2006 2007 2008 2008 2009 2006-08 2006-07 2007-08 2008-09
U.S. producers': Average capacity quantity . . . . . 160,903 160,903 160,903 80,451 80,451 0.0 0.0 0.0 0.0 Production quantity . . . . . . . . . . 72,895 71,125 70,441 40,633 17,412 -3.4 -2.4 -1.0 -57.1 Capacity utilization (1) . . . . . . . . 45.3 44.2 43.8 50.5 21.6 -1.5 -1.1 -0.4 -28.9 U.S. shipments: Quantity . . . . . . . . . . . . . . . . . . 59,181 58,074 62,470 35,111 16,284 5.6 -1.9 7.6 -53.6 Value . . . . . . . . . . . . . . . . . . . . 61,937 62,549 76,558 41,284 21,251 23.6 1.0 22.4 -48.5 Unit value . . . . . . . . . . . . . . . . . $1,047 $1,077 $1,226 $1,176 $1,305 17.1 2.9 13.8 11.0 Export shipments: Quantity . . . . . . . . . . . . . . . . . . *** *** *** *** *** *** *** *** *** Value . . . . . . . . . . . . . . . . . . . . *** *** *** *** *** *** *** *** *** Unit value . . . . . . . . . . . . . . . . . *** *** *** *** *** *** *** *** *** Ending inventory quantity . . . . . . 8,754 7,528 6,838 7,865 6,231 -21.9 -14.0 -9.2 -20.8 Inventories/total shipments (1) . . *** *** *** *** *** *** *** *** *** Production workers . . . . . . . . . . 109 110 102 110 78 -6.3 0.9 -7.2 -28.7 Hours worked (1,000s) . . . . . . . . 226 239 227 122 78 0.4 5.8 -5.0 -36.1 Wages paid ($1,000s) . . . . . . . . 6,081 6,441 6,420 3,460 2,095 5.6 5.9 -0.3 -39.5 Hourly wages . . . . . . . . . . . . . . . $26.91 $26.95 $28.28 $28.36 $26.86 5.1 0.2 4.9 -5.3 Productivity (tons/1,000 hours) . 322.5 297.6 310.3 333.1 223.2 -3.8 -7.7 4.3 -33.0 Unit labor costs . . . . . . . . . . . . . $83.42 $90.56 $91.14 $85.15 $120.32 9.3 8.6 0.6 41.3 Net sales: Quantity . . . . . . . . . . . . . . . . . . *** *** *** *** *** *** *** *** *** Value . . . . . . . . . . . . . . . . . . . . *** *** *** *** *** *** *** *** *** Unit value . . . . . . . . . . . . . . . . . *** *** *** *** *** *** *** *** *** Cost of goods sold (COGS) . . . . *** *** *** *** *** *** *** *** *** Gross profit or (loss) . . . . . . . . . . *** *** *** *** *** *** *** *** *** SG&A expenses . . . . . . . . . . . . . *** *** *** *** *** *** *** *** *** Operating income or (loss) . . . . . *** *** *** *** *** *** *** *** *** Capital expenditures . . . . . . . . . *** *** *** *** *** *** *** *** *** Unit COGS . . . . . . . . . . . . . . . . . *** *** *** *** *** *** *** *** *** Unit SG&A expenses . . . . . . . . . *** *** *** *** *** *** *** *** *** Unit operating income or (loss) . *** *** *** *** *** *** *** *** *** COGS/sales (1) . . . . . . . . . . . . . *** *** *** *** *** *** *** *** *** Operating income or (loss)/ sales (1) . . . . . . . . . . . . . . . . . . *** *** *** *** *** *** *** *** ***
(1) "Reported data" are in percent and "period changes" are in percentage points. (2) Undefined.
Note.--Financial data are reported on a fiscal year basis and may not necessarily be comparable to data reported on a calendar year basis. Because of rounding,figures may not add to the totals shown. Unit values and shares are calculated from the unrounded figures.
Source: Compiled from data submitted in response to Commission questionnaires.


![Effects of SnO2 Addition on the Properties of Alumina ...lerating spinel -forming reactions [8] -[10] . Moreover, SnO 2 was used as a spinel forming agent in fired magnesia bricks](https://static.documents.pub/doc/80x56/5e87b5ac745a25285447f2a6/effects-of-sno2-addition-on-the-properties-of-alumina-lerating-spinel-forming.jpg)


