OIMB QK 49S .P8S J38 1987 PREDATOR-PREY INTERRELATIONSHIPS AND THE INTRODUCED EELGRASS. ZOSTERA JAPONICA (ASCHERS. AND GRAEBN.) IN THE SOUTH SLOUGH OF COOS BAY. OREGON. U.S.A. .. by SONIA NICOLAS JAVIER A THESIS Presented to the Department of Biology and the Graduate School of the University of Oregon in partial fulfillment of the requirements for the degree of Master of Science December 1987 o 1MB LIBRARY DEC 9 1987
Transcript
OIMBQK49S.P8SJ381987
PREDATOR-PREY INTERRELATIONSHIPS AND THE INTRODUCED EELGRASS.
ZOSTERA JAPONICA (ASCHERS. AND GRAEBN.) IN THE SOUTH
SLOUGH OF COOS BAY. OREGON. U.S.A.
..
by
SONIA NICOLAS JAVIER
A THESIS
Presented to the Department of Biologyand the Graduate School of the University of Oregon
in partial fulfillment of the requirementsfor the degree ofMaster of Science
December 1987
o1MB LIBRARYDEC 9 1987
APPROVED:Dr. James T. Carlton
.. '
ii
An Abstract of the Thesis of
Sonia Nicolas Javier for the degree of
in the Department of Biology to be taken
Master of Science
December 1987..
iii
Title: PREDATOR-PREY INTERRELATIONSHIPS AND THE INTRODUCED EELGRASS.
ZOSTERA JAPONlCA (ASCHERS. AND GRAEBN.) IN THE SOUTH SLOUGH OF
COOS BAY. OREGON. U.S.A.
Approved:
Dr. James T. Carlton
The role of the introduced eelgrass Zostera japonica as a refuge
from epibenthic predators ~5S invest1gated. Caging experiments were
employed inside and outside eelgrass beds. and density of the spionid
polychaetes were determined. A 2-way analysis of variance showed that
spionid density is dependent on several factors: site. season. caging
treatment. and the presence or absence of ~ japonica. Four species
were common: Pygospio elegans. Streblospio benedicti. Pseudopolydora
kempi. and Boccardia truncata.
The Wilcoxon signed-ranks test was used to compare spionid
densities inside and outside eelgrass beds. and to determine which
species contribute to the significant effect in the three sites. Two
sites showed significant effects. The four most common spionids showed
significantly higher densities inside eelgrass beds. The exclusion of
epibenthic predators was correlated with the relative abundance patterns
of spionids in the control and exclusion plots.
Zostera japonica. as a refuge for prey. contributed to the
abundance of the spionid community. Other factors. beyond the scope of
this study. may also be playing important roles in this community.po'
iv
NAME OF AUTHOR:
PLACE OF BIRTH:
DATE OF BIRTH:
VITA
Sonia Nicolas Javier
Manila. Philippines
July 1. 1957
v
GRADUATE AND UNDERGRADUATE SCHOOLS ATTENDED:
University of OregonUniversity of Santo Tomas
DEGREES AWARDED:
Master of Science. 1987. University of OregonBachelor of Science. 1979. University of Santo Tomas
PROFESSIONAL EXPERIENCE:
.,'
Research Assistant. University of the Philippines PublicationsOffice. College of Science. Diliman. Quezon City. Philippines.1981-1984
AWARD S AND HONORS:
P.E.O. International Peace Scholarship Fund. 1985-1987Sigma Xi. Grant-In-Aid of Research. 1986
ACKNOWLEDGEMENTS
I would like to express my deepest gratitute to the following:
my adviser. Dr. James T. Carlton for sharing with me his invaluable~.
suggestions and endless "exotic" ideas in the preparation of this
manuscript; Dr. Peter Frank for his statistical input; Dr. Martin H.
Posey for speaking his mind about the "soft-bottom" communities; and
Dr. Paul P. Rudy for his help in various ways. Very special thanks are
due to my best friend Gliss Pimentel who is always there for me through
thick and thin; my parents. brothers and sisters for the moral andr
spiritual encouragement they have given me throughout the duration of my
studies here in the U.S. I also thank the O.I.M.B. staff and graduate
students for their support in many ways. This research was supported in
part by the p.E.a. International Peace Scholarship Fund and by the Sigma
Xi. The Scientific Research Organization.
vi
vii
TABLE OF CONTENTS
Chapter
I. INTRODUCTION . .Page
1
BIBLIOGRAPHY
SUMMARY AND RECOMMENDATIONS
Sediment Analysis •.••.•••••.•.•••.•••••••••.••••Faunal Community in the Zostera japonica beds
Seasonal Patterns ••.••••••••••••••••••••.••••Comparison of Spionid Abundances Inside and
Outside the Eelgrass Beds •••••••••••••••••Eelgrass and Predation ••••••••••••••••••••••••••
Study AreaCaging ExperimentsSediment TypesStatistical Analysis
RESULTS
MATERIALS AND METHODS
DISCUSSION
II.
III.
V.
IV.
Table
LIST OF TABLES
Page
viii
1. Mean and Cumulative Percentage Weight of theSediment Fractions Inside and Outside the Zosterajaponica Beds at Sites A. B. and C. StandardErrors are in Parenthesis •••••••••••••••••••••••••••• J3
2. Average Densities (No. per 86.6 cm 2) in Control
Plots of Each Spionid Species in Sites A. B. andC at All Sampling Dates Inside and Outside theZostera japonica Bed ••••••••••••••••••••••••••••.•... 15
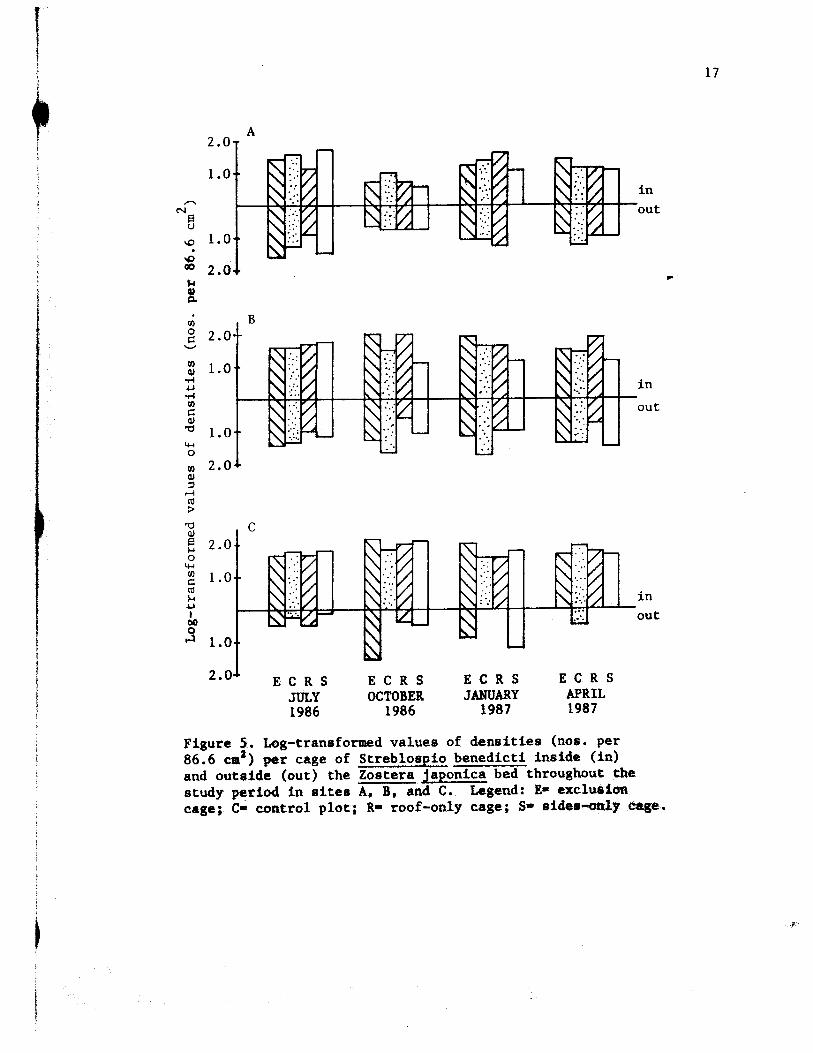
3. Proportion of Pygospio elegans and Streblospiobenedicti Inside the Eelgrass in the ControlPlots at Sites A. B. and C........................... 22
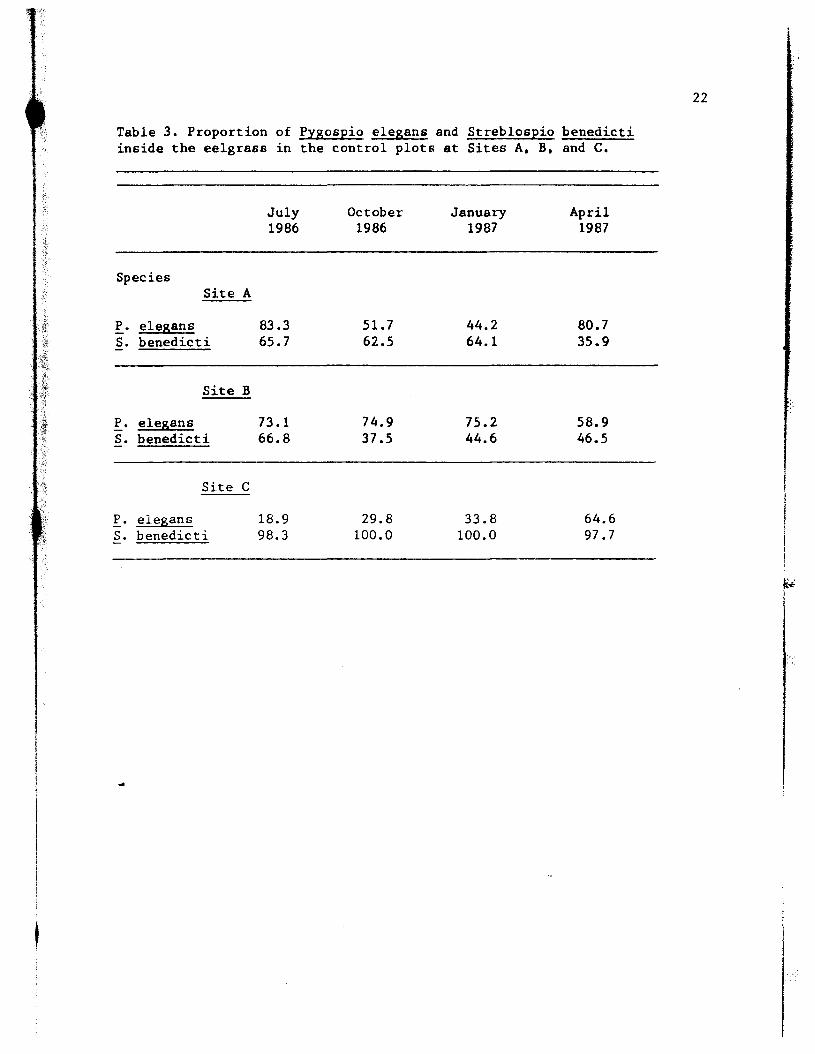
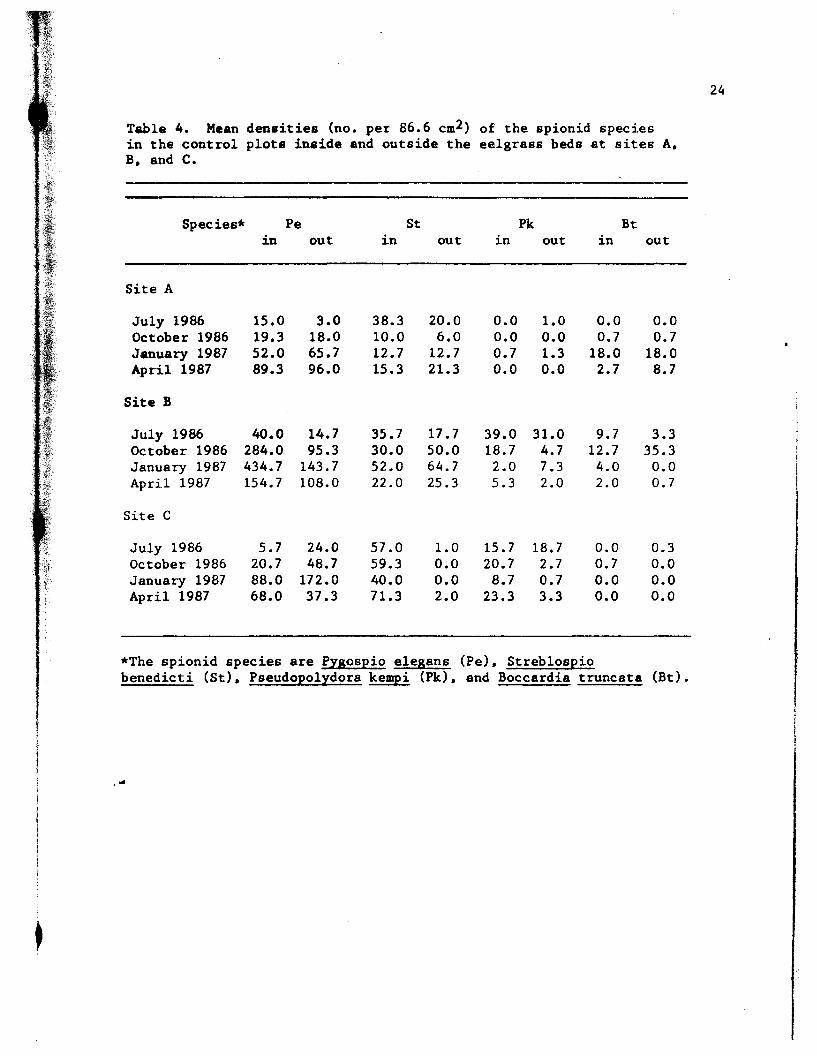
4. Mean Densities (No. per 86.6 cm 2) of the Spionid
Species in the Control Plots Inside and Outsidethe Eelgrass Beds at Sites A. B. and C •••••••••••••••
5. Mean Densities (No. per 86.6 cm 2) of the Spionid
Species in the Exclusion Cage Inside and Outsidethe Eelgrass Beds at Sites A. B. and C •••••••••••••••
24
25
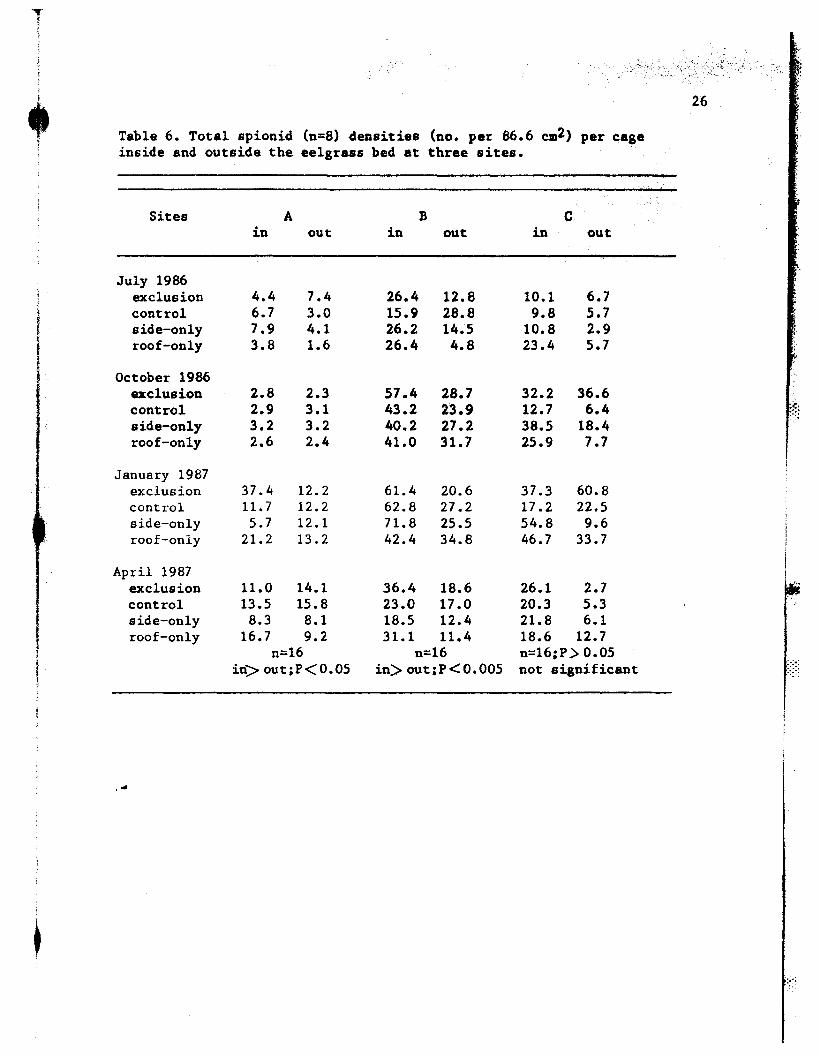
6. Total Spionid (N=8) Densities (No. per 86.6 cm 2)
Per Cage Inside and Outside the Eelgrass Bedat Three Sites ••••••••••••••••••••••••••••••••••••••• 26
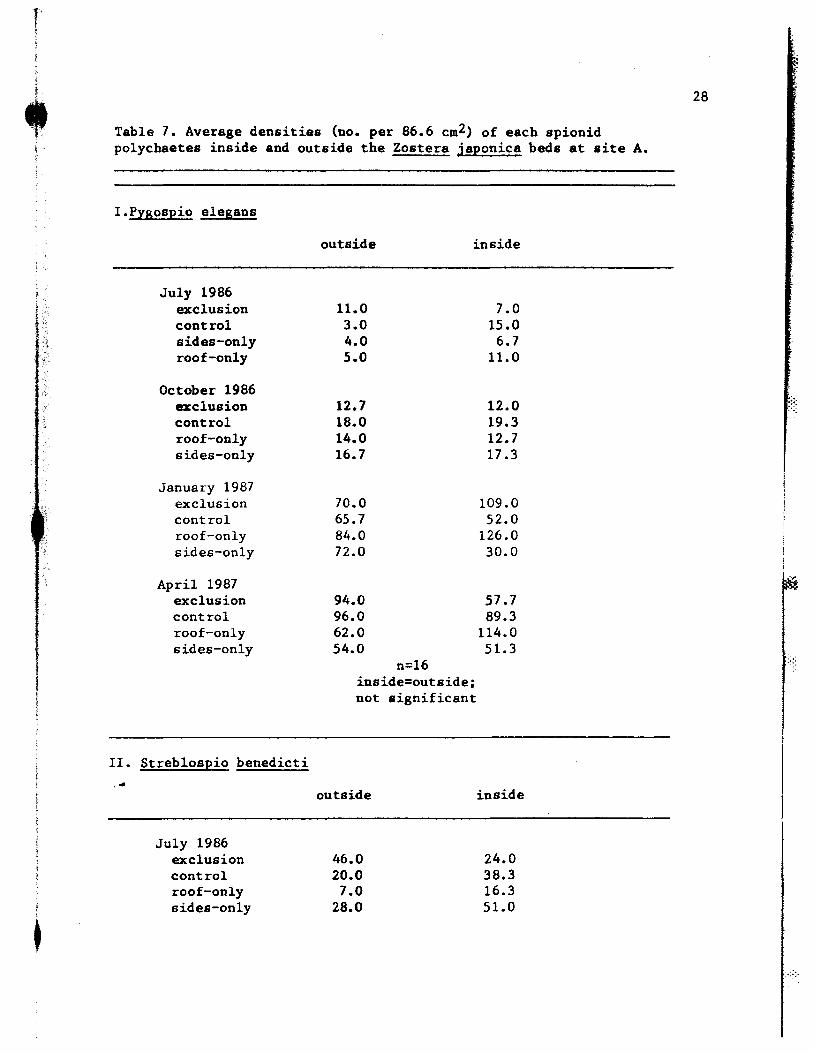
7. Average Densities (No. per 86.6 cm 2) of Each
Spionid Polychaetes Inside and Outside theZostera japonica Beds at Site A...................... 28
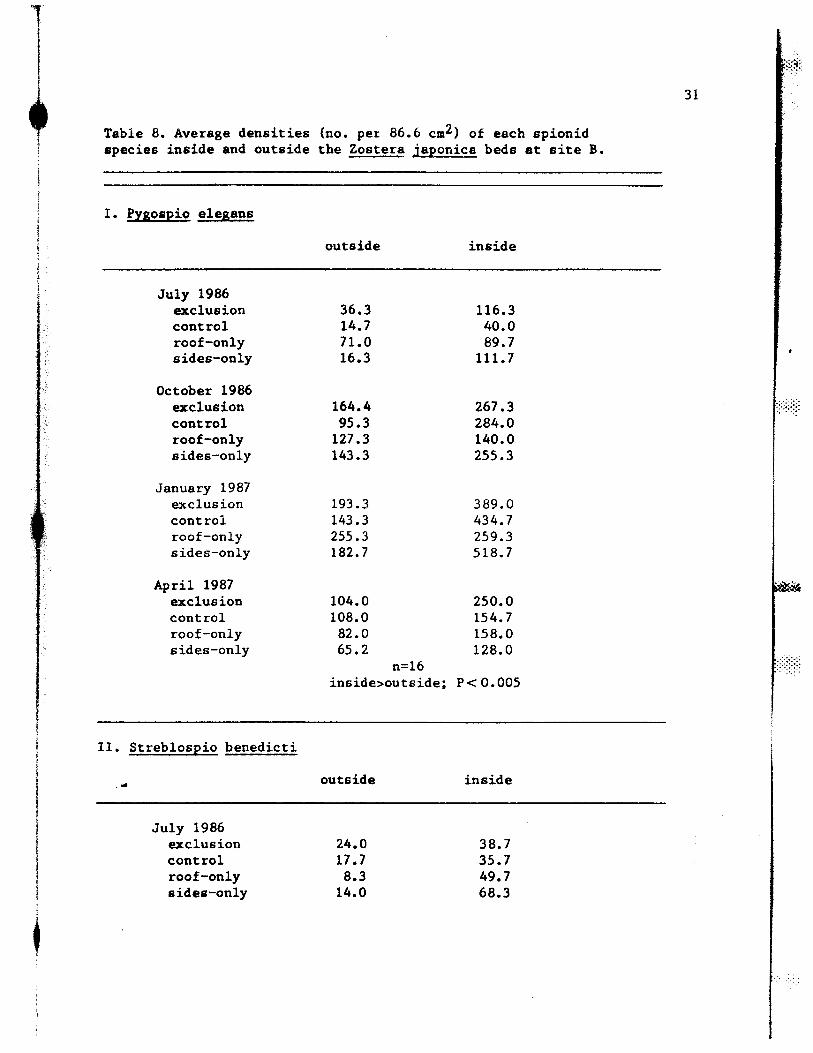
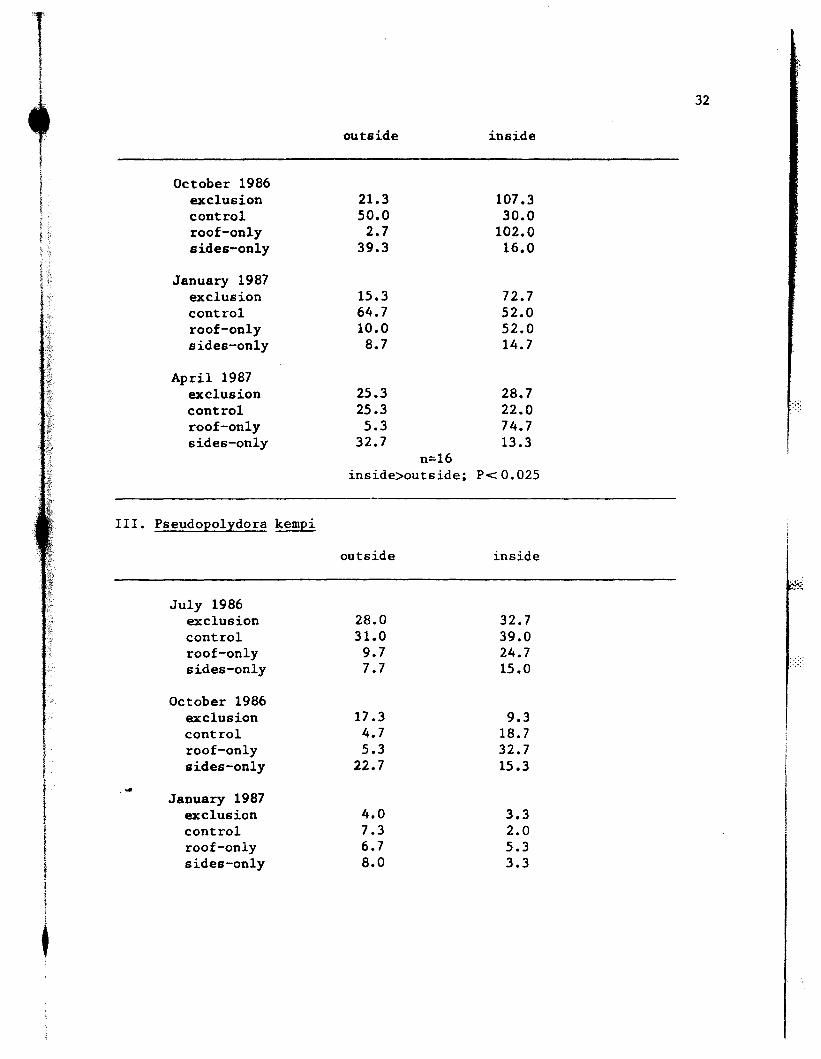
8. Average Densities (No. per 86.6 cm 2) of EachSpionid Species Inside and Outside the Zosterajaponica Beds at Site B.............................. 31
9. The 2-way ANOVA Results on the Effects of Cagingon the Densities of Spionid Species Inside theZostera japonica Bed in the Different Sites inJuly and October 1986. and January and April 1987 ... 35
10. The 2-way ANOVA Results on the Effects of Cagingon the Densities of Spionid Species Outside theZostera japonica Bed in the Different Sites inJuly and October 1986, and January and April 1987
11. Mean Densities (No. per 86.6 cm2 ) of the SpionidSpecies in the Exclusion (exc) Cage and Control(con) Plots Inside the Eelgrass Beds at SitesA. B. and C .•.•••..••••.••.•••.•••••••••••••••••..•.•
12. Mean Densities (No. per 86.6 cm2) of the Spionid
Species in the Exclusion (exc) Cage and Control(con) Plots Outside the Eelgrass Beds at Sites
36
38po'
ix
A. B. and C ...•...•......•............•.............. 39
13. Mean Densities (No. per 86.6 em 2) of the Spionid
Species in the Exclusion (exc) Cage Inside theEelgrass Bed, and in the Control (con) Plots Outsidethe Eelgrass Bed in Sites A, B, and C................ 40
14. Mean Densities (No. per 86.6 cm 2) of the Spionid
Species in the Exclusion (exe) Cage Outside theEelgrass Bed, and in the Control (con) Plots Insidethe Eelgrass Bed at Sites A, B, and C................ 41
1I
If
Figure
LI ST OF FIGURES
Page
x
1. Sites of Study Area: Site A- Ferrie Marsh; Site B- FerrieMarsh Levee; Site C- Ferrie Marsh Point •••.••.••••.•••••• 5
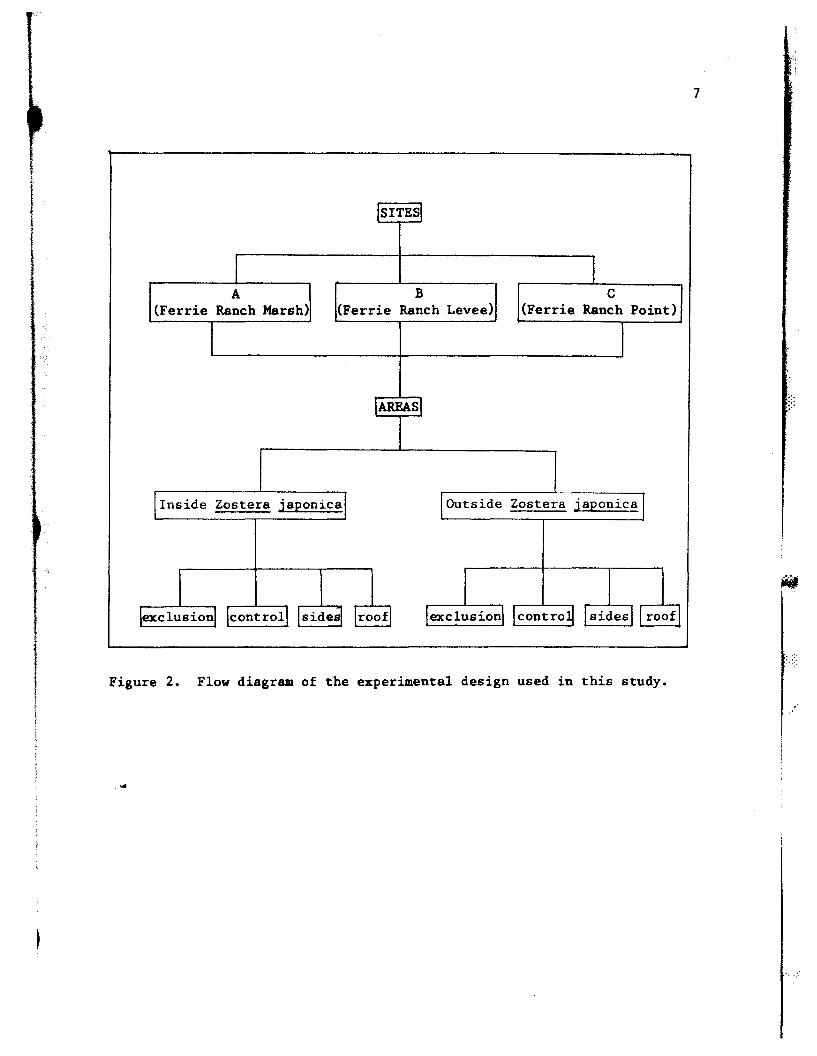
2. Flow Diagram of the Experimental Design Used ~.
in this Study •..•••.•.•.•........•...•••.•••..••.•.•..•.. 7
3. Types of Treatments Used in the Study: A- Roof-only Cage;B- Sides-only Cage; C- Exclusion Cage; D- Control Plot
4. Log-transfollDed Values of Densities (No. per 86.6 cmPer Cage of Pygospio elegans Inside (in) andOutside (out) the Zostera japonica Bed Throughoutthe Study Period in Sites A. B. and C. Legend:E- Exclusion Cage; C- Control Plot; R- Roof-only Cage;s- Sides-only Cage .
5. Log-transformed Values of Densities (No. per 86.6 cmPer Cage of Streblospio benedicti Inside (in) andOutside (out) the Zostera japonica Bed Throughoutthe Study Period in Sites A. B. and C. Legend:E- Exclusion Cage; C- ControL Plot; R- Roof-only Cage;S- Sides-only Cage .•••.•.•.•••••••••••••••••••••••••••••
8
16
17
6. Log-transfo~med Values of Densit1es (No. pel 86.6 cmPer Cage of Pseudopolydora kempi Inside (in) andOutside (out) the Zostera japonica Bed Throughoutthe Study Period in Sites A. B. and C. Legend:E- Exclusion Cage; C- Control Plot; R- Roof-only Cage;S- Sides-only Cage ••...•......•....•...•••.••.•••••.•.•• 18
7. Log-transformed Values of Densities (No. per 86.6 cm )Per Cage of Boccardia truncata Inside (in) andOutside (out) the Zostera japonica Bed Throughoutthe Study Period in Sites A. B. and C. Legend:E- Exclusion Cage; C- Control Plot; R- Roof-only Cage;s- Sides-only Cage .......••.••..••.•.•.•••..••.•..•...•• 19
8. Log-transformed Values of Densities (Nos. per 86.6 cm )Per Cage of All Spionid Species (N=8) Inside (in) andOutside (out) the Zostera japonica Bed Throughout theStudy Period in Sites A. B. and C. Legend: EX= ExclusionCages; CO= Control Plots; RF= Roof-only Cages; SD= Sides-only Cages . . . . . . • . . . . . . . . . . . . . . . . . . • . • • • . . . . . . . • . . . . . . . . 20
1
II
I)I
\
CHAPTER I
INTRODUCTION
.. '
The low density of predators in seagrass beds may explain the
extremely high densities of animals routinely recorded among masses of
"drift algae" in beds (Tabb et a1.. 1962; Marsh. 1973; Orth. 1973;
Thorhaug and Roessler. 1977; Gore et al •• 1981; Heck and Thoman. 1981)
and it is one of the major proposed explanations for the nursery role of
seagrass habitats (Thayer and Phillips. 1977; Hanekom and Baird. 1984;
Wilson et al •• 1987). Wilson et ale (1987) showed that juvenile blue
crabs inside an eelgrass bed were preyed on at lower rates than those on
adjacent bare sand patches. Other investigations also show that areas
of greater eelgrass and algal biomass have lower levels of predation
intensity than areas of lesser plant biomass (Kikuchi. 1980; Lewis.
1984; Orth et al •• 1984; Summerson and Peterson. 1984; Leber. 1985;
Ryer. 1987).
These general patterns have shown that predation is an important
determining factor in structuring communities ~ithin seagrass meadows
(Young and Young. 1977. 1978; Young et al •• 1976: Orth. 1977:
Virnstein. 1978: Nelson. 1979. 1981; Kikuchi. 1980; Homziak et al ••
1982; Virnstein et a1 •• 1984: Main. 1987). These investigations have
led to the hypothesis that the proximate cause of correlation between
1
I,,f:;
prey abundances and structural complexity of seagrass is predation
(Nelson. 1979; Heck and Orth. 1980; and. Stoner. 1983a).
The effects of epibenthic predators can be assessed
experimentally using exclosure cages. The limitations of such
manipulations in soft sediment environments (Virnstein. 1978) can be
overcome with an experimental design that includes assessing the
possible effects of exclosure artifacts. Based upon exclusion
experiments in soft sediment communities (Reise. 1977. 1978. 1985;
Schneider. 1978; Peterson. 1979; Quammen. 1984; Gee et al •• 1985; and
Posey. 1986a) invertebrates such as shrimps and crabs. and small
vertebrates such as gobiid fishes. appear to have a much greater effect
on the infaunal invertebrate populations than large fish and birds
(Posey. 1986b; Main. 1987; Raffaelli and Milne. 1987).
Zostera japonica Aschers. & Graebn. is an Asian eelgrass that
was first collected in North America in 1957 (Harrison, 1982a). It
occurs in the mid- and upper-intertidal zones from southwestern British
Columbia. Canada to Oregon and Washington. U.S.A•• where it is often
abundant on a variety of sediment types (Harrison. 1982b. 1982c).
Zostera iaponica represents an excellent example of a recent biological
invasion: it is a Japanese species believed to have been introduced to
the Pacific Northwest with oysters (Harrison and Bigley. 1982). Posey
and Rudy (1986) reported that records from the South Slough National
Estuarine Research Reserve in Coos Bay. Oregon showed that !. iaponica
has been in the Reserve for over 15 years. Surveys in the early 1970's
showed that Z. japonica was present in patches in the upper reaches of
2
1the Reserve. By the early 1980's it had covered 100% of some of the
3
large mid-intertidal areas of the upper estuary. and had established in
smaller patches near the mouth of Coos Bay.
The introduction of Zostera iaponica into Coos Bay has provided
an unusual opportunity to test some of the roles ascribed to predation
in eelgrass communities in a system where the eelgrass is an~.
ecologically new and major regulator of benthic patterns and processes.
Little is known about the relative patterns of infauna inside and
outside ;. iaponica beds. Posey (unpublished) has shown that the
densities of both native and introduced polychaetes are higher in ~.
japonica beds than in adjacent unvegetated areas. Similar results are
known for other eelgrass communities (e.g. Summerson and Peterson.
1984). The mechanisms that produced these polychaete patterns inside
and outside ;. japonica beds in Coos Bay are not known.
The objectives of this study are as follows: (1) to determine
the seasonal patterns of abundance of spionid polychaete worms inside
and outside the Zostera japonica beds. and. (2) to investigate
experimentally whether the exclusion of epibenthic predators can be
correlated with these relative abundance patterns. The null hypothesis
being tested is that predation does not regulate the abundance. density.
or diversity patterns of spionid polychaetes inside or outside a bed of
Zostera iaponica.
CHAPTER II
MATERIALS AND METHODS
~'
Study Area
The study area is an intertidal muddy sandflat (O.9m above MLLW)
of the South Slough in Coos Bay. Oregon (43.200 lat •• 1200 long.). Three
sites. each with areas with and without ~. japonica beds. were
I I I I 1lexclusionl Icontroll Iside~ roof lexclusionl Icontro~ Isides] Iroof
Figure 2. Flow diagram of the experimental design used in this study.
7
,"
8
~.
.. I
"
~':I'I
A
c D
Figure 3. Types of caging treatments used: A- roof-only cage; B- sides-onlycage; C- exclusion/full cage; D- control plot.
substratum. Each cage was sampled with three cores once every three
months for one year resulting in 24 cores for each site. The sampling
dates were July 27 and October 29. 1986. January 25 and April 17.
1987.
To sample a plot. the cage was carefully pulled out of the
sediments and set aside. A grid was visually placed over the caged
plot and three cores were taken per plot at positions determined by
randomly pre-selected two-digit numbers. No cores were taken within
5-cm of the edge of the cage. Samples were brought to the laboratory.
fixed in 10% buffered formaldehyde solution with rose-bengal for
24-hrs (Gonor and Kemp. 1978) and then passed through three metal
sieves (l.27-em. l.O-mm. O.5-mm) to separate the infauna from the
eelgrass fragments and detritus. Large debris from the residue of the
l.27-cm sieve was discarded after large worms were removed and the
rest was preserved in 70% isopropyl alcohol along with the residues
retained in the two finest sieves. These samples were then examined
under the dissecting microscope for spionid polychaetes. which were
removed. counted and identified. recording only the number of whole
individuals or the head or anterior portion of the whole organism.
Polychaetes were initially identified by M.H. Posey. Additional
.~dentification sources were Berkeley and Berkeley (1952): Day (1967):
Hartman (1969): Blake (1975): Light (1978): Fauchald (1977) and Rudy
and Rudy (1983). Due to the large sample size. a subsample of
one-half the whole sample was used for sorting and identification of
spionid worms. This is based on the assumption that the population of
9
I,!
i!
the spionid worms is homogeneously distributed.
Sediment Types
Sediment grain characteristics within the three study sites were
determined. Sediment samples were taken using the same core sampler
as in faunal sampling. In each site. three core samples were taken
inside and outside the Z. japonica beds. The sediment samples were
air dried and the clumped soil was separated into smaller particles.
Plant parts and other non-sediment materials were removed prior to dry
sieving of the sediment samples. Dry sieving was done by a portable
mechanical sieve shaker model R-24. Seventy-gram subsamples were
passed through a series of sieves (US Standard Sieve Mesh Nos. 4.0.
1.0. 0.25. 0.125 and 0.0625-mm) for 15 minutes. The sediment
particles that passed through the smallest screen (0.0625-mm) were
considered silt-clay and were not separated further. The residue in
each sieve was weighed. and the data were analyzed for particle size
according to the methods given by Folk (1961).
Statistical Analysis
,-The effects of predation and the role of eelgrass as a refuge. as
reflected in the differences in densities of spionids in uncaged and
caged plots inside and outside the !. japonica beds. were analyzed by
comparing paired spionid densities inside and outside the eelgrass by
I, the Wilcoxon signed-ranks test within sites. Within sites that showed
statistically significant differences in density between inside and
outside the eelgrass bed. species counts were also subjected to the
Wilcoxon signed-ranks tests. The effects of the treatments (cages)
and the sites on spionid densities were analyzed by a two-way analysis
of variance (ANOVA).
All individual counts for ANOVA were 10g10(x+l) transformed in
order to normalize the effects of very dense samples over less dense
ones (Sokal and Rolf. 1981). All statistical analyses were done using
the Multivariate General Linear Hypothesis and the Non-parametric
modules of the statistical package. SYSTAT by Wilkinson (1986).
11
CHAPTER III
RESULTS
Sediment Analysis
Sediments in all sites varied from fine sand (2.0 phi) to very fine
sand (4.0 phi) to silt and/or clay (above 4.0 phi). At site A. there is
a high cumulative percentage value of -2.0 and 0.0 phi of the sediment
size outside the eelgrass bed compared to the inside (Table 1). Visual
inspection of the first top 10.0 cm. of the substrata showed a sediment
sample consisting mostly of marsh plant roots and stems. This is one of
the reasons why the volume of the samples in this site is reduced from
30-cm. deep to 15 em. deep. The corer could not penetrate any deeper
than 15 em. In general. the high values obtained at the -2.0 phi and
0.0 phi consisted mostly of clumps of sand in between the eelgrass and
marsh plant roots and other plant parts.
12
," At site B. the gravel fraction consisted entirely of sOlDe pieces of
wood. metal. shell fragments and some plant parts despite the thorough
mixing and pounding done before dry-sieving. These accounted for the
high cumulative percentage values at the -2.0 phi and 0.0 phi obtained
outside the eelgrass bed as compared to the inside (Table 1).
At site C. the sediments are generally well-sorted and well
I~f!
Table 1. Mean and cumulative percentage weight of the sedimentfractions inside and outside the Zostera japonica beds at sites A.B. and C. Standard errors are in parentheses.
13
>-
Site AInside Outside
Phi values Mean Cumulative Mean Cumulativeweight percentage weight percentage
t- 1.distributed. This may be due to the relatively high wave and current
energy here. The cumulative percentage values inside the eelgrass are
higher than the outside (Table 1).
Faunal Community in the Zostera japonica Beds
Seasonal Patterns
A total of seven species of spionid po1ychaetes were collected and
identified from control core samples inside and outside the Zostera
japonica bed throughout the study period. Some of these species were
relatively rare. An eighth species. Spiophanes bombyx. was collected in
some experimental cages. Table 2 shows the respective mean densities of
these species in the control plots inside and outside the eelgrass bed.
Figures 4 to 7 give the log-transformed densities of the four most
common spionid species in all treatments. Figure 8 summarizes the mean
densities of all spionid species (n=8) inside and outside the Z.
japonica bed at sites A. B. and C for all caging treatments in July and
October 1986 to January and April 1987. The following discussion
summarizes the seasonal density patterns for the four most comon species~
at each site in all treatments.
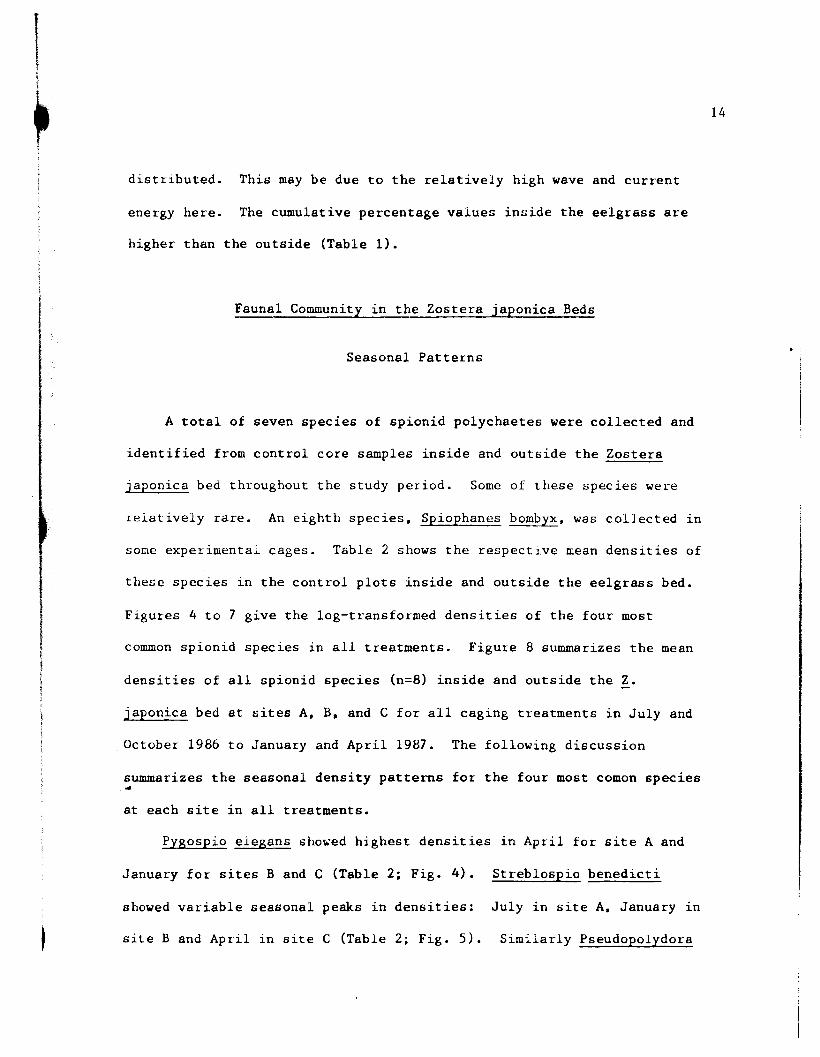
Pygospio elegans sho~ed highest densities in April for site A and
January for sites Band C (Table 2; Fig. 4). Streb10spio benedicti
showed variable seasonal peaks in densities: July in site A. January in
site B and April in site C (Table 2; Fig. 5). Similarly Pseudopolydora
Table 2. Average densities (no. per 86.6 cm2) in control plotsof each spionid species in Sites A. Band C at all sampling datesinside and outside the Zostera iaponica bed.
Figure 4. Log-transformed valuea of denalttes (nos. per86.6 ClIl:l) per cage of Pygoapto elegana inside (tn) and outside(out) the Zoat.r& japontca,bedthrOt.1fbout the study period insites A. B. and c. Legend: E.~fOft ca.. ; c- control plot;R- roof-only cage; S- sides-only tap.
Figure 5. Log-transformed values of densities (nos. per86.6 ca2 ) per cage of Streblospio benedicti inside (in)and outside (out) the Zostera japonica bed throughout thestudy period in sites A. B. and C. Lagend: E- exclusioncage; C~ control plot; R- roof-only cage; S- sides-only eage.
Figure 6. Log-transformed values of densities (nos. per86.6 cm2 ) per cage of Pseudopolydora kempi inside (in)and outside (out) the Zostera japonica bed throughout thestudy period in &.itea A. B, and C. Legend: E- exclusioncage; C- control plot; R- roof-only cage; S- sides-only cage.
Figure 7. Log-transformed values of densities (nos. per86.6 cm2 ) per cage of Boccardia truncata inside (in) andoutside (out) the Zostera japonica bed throughout the studyperiod in sites A. B, and C. Legend: E= exclusion cage;C= control plot; R= roof-only cage; S= sides-only cage.
Figure 8. Log-transformed values of densities (nos. per 86.6 cm2) per cage pf all sp~nid species (n=8)
iaside (in) and o~tside (o~t) the Zostera japonicd bed throughout the study period in July (CJ), October(~), Jan~ary (a!), and April (~) in sites A, E, and C. Legend: EX= exclusion cages; Co= control plots;RE- roof-only cages; SD- sides-only cages.
No
kempi showed highest density in the different sites at different
sampling dates: January in site A (but rare). July in site B. and April
in site C (Table 2: Fig. 6).
The rest of the spionids showed peaks in densities at different
seasons. Boccardia truncata is present throughout the year in sites A
and B. but not in site C (Fig. 7). This species did not show any pre-
ference in habitat with respect to the occurrence of eelgrass (Fig. 7).
Polydora ligni is present throughout the year only in site B where it
showed higher densities outside than inside the eelgrass bed (Table 2).
Pygospio californica is absent in site A but present throughout the year
in sites Band C. Generally it showed higher densities outside than
inside the eelgrass beds (Table 2).
Pygospio elegans and ~. benedicti were present at all sites
throughout the four sampling dates. To determine the seasonality of
these two most abundant species. their relative percentage abundances
during the four sampling dates in the control plots were computed inside
and outside the eelgrass beds (Table 3). Both species exhibited
variable percentage abundances throughout the year at all sites.
Pygospio elegans showed high abundance inside the eelgrass in July and
April at site A; July. October and January in site B. and April in site,~
C. Streblospio showed relatively the same percentage abundance for sites
A and C throughout the year. except in April at site A where it dropped
from 64.1% to 35.9% inside the eelgrass bed. At site B. there are
variable seasonal peaks in abundances (Table 2: Fig. 5). In site B.
there was an increase in relative abundance from October to April. but a
21
Table 3. Proportion of Pygospio elegans and Streblospio benedictiinside the eelgrass in the control plots at Sites A. B. and C.
July 1986exclusion 8.3 12.7control 3.3 9.7roof-only 22.0 42.0sides-only 0.0 12.0
October 1986exclusion 26.0 75.3control 35.3 12.7roof-only 115.3 50.0sides-only 12.0 34.0
January 1987exclusion 4.0 16.7control 0.0 4.0roof-only 6.7 20.0sides-only 4.7 31.3
April 1987exclusion 15.3 10.0control 0.7 2.0roof-only 0.0 13.3
." sides-only 0.0 2.7n=16
inside>outside: P<0.05
n=16inside=outside:
not significant
I
April 1987exclusioncontrolroof-onlysides-only
IV. Boccardia truncata
outside
3.32.03.01.3
outside
inside
2.75.33.04.0
inside
33
done for the different spionid species using site and cage treatments as
factors. Inside the eelgrass beds. caging had no significant effects on
the density of three of the four common spionid species in July;
significant in three out of four species in October; not significant in
one out of four species in January; and significant effects in two out
of four species in April (Table 9).
Outside the eelgrass beds. caging treatments showed a significant
effect for all four common spionid species in July; a significant effect
in two of the four species in October and April; and no significant
effect in one species in January (Table 10).
Based on the mean density at each site for each season for each
cage treatments. it appears that only sites Band C have higher mean
density values in the exclusion cages relative to the control and the
other partial cages for the four most common spionid species whether
inside or outside the eelgrass bed. In site B. K. elegans and ~.
truncata have higher densities in the exclusion cage in October; January
for s. benedicti and April for B. truncata. In site C. P.
elegans. S. benedicti. and K. kempi have high mean density value~ in
October and January whether inside or outside the eelgrass bed.
Site had a statistically significant effect on the density of the
.~ifferent spionid species (Table 9 and 10). Except for S. benedicti
(July: inside). all other species densities were significantly different
at the different sites. This substantiates the results of the
Wilcoxon-signed ranks test on the density differences inside and outside
the eelgrass bed in each site. The highly significant effects of site
34
Table 9. The 2-way ANOVA results on the effects of caging on thedensities of spionid species inside the Zostera japonica bed in thedifferent sites in July and October 1986, and January and April 1987.
Caging Site-TreatmentSpecies Treatment Site Interaction
I. July 1986P. elegans * *** ***S. benedicti n.s. n.s. n.B.P. kempi n.s. *** n.s.B. truncata n.s. *** n.s.
The 2-way ANOVA results on the effects of caging on theof spionid species outside the Zostera japonica bed in thesites in July and October 1986, and January and April 1987.
36
,"
Caging Site-TreatmentSpecies Treatment Site Interaction
on the different spionid densities are also reflected in the significant
results of site-treatment interactions for some species.
Eelgrass and Predation
To determine whether the exclusion of epibenthic predators can be
correlated with the relative abundance patterns of spionids. densities
of the four most abundant spionid species in the control plots and
exclusion cages were compared. Tables 11 and 12 show a comparison of
mean densities in the exclusion cage and control plots inside and
outside the eelgrass bed. respectively. These tables show that at all
sites. with some exceptions. the spionids have generally higher
densities in the exclusion cages than in the control whether both cages
are inside or outside the eelgrass bed. An even more dramatic
comparison is between the mean densities of exclusion cages inside the
eelgrass and the control outside the eelgrass (Table 13). The data
substantiates the same conclusion that exclusion cages have higher
spionid densities. but the differences between the means are greater due
to the combined protective effects of the eelgrass and the exclusion
cage. Furthermore. a comparison of spionid densities in the control
plots inside the eelgrass beds and exclusion cages outside the eelgrass,.beds (Table 14) show a trend (with some exceptions) towards higher
densities in the control plots inside the eelgrass bed. This again
substantiates the earlier results that the eelgrass bed serves as a
refuge from predators.
37
Table 11. Mean densities (no. per 86.6 cm2) of the spionid speciesin the exclusion (exc) cage and control (con) plots inside theeelgrass beds at sites A. B. and C.
Species* Pe St Pk Btexc con exc con exc con axe con
*The spionid species are Pygospio elegans (Pe), Streblospiobenedicti (St), Pseudopolydora kempi (Pk), and Boccardia truncata (Bt) •
..
!i
Table 13. Mean densities (no. per 86.6 em ) of the spionid species inthe exclusion (exc) cage inside the eelgrass bed and the control (con)plots outside the eelgrass bed at sites A. B. and C.
Species* Pe St Pk Btexc con exc con exc con exc con
*The spionid species are Pygospio elegans (Pe). Streblospiobenedicti (St). Pseudopolydora kempi (Pk). and Boccardia truncata (Bt).
..
40
I1
~
Table 14. Mean densities (no. per 86.6 cm2) of the spionid sp&ciesin the exclusion (exc) cage outside the eelgrass bed and in thecontrol (con) plots inside the eelgrass bed at sites A. B. and C.
Species. Pe St Pk Btexc con exc con exc con exc con
*The spionid species are Pygospio elegans (Pe). Streblospiobenedicti (St). Pseudopolydora kempi (Pk). and Boccardia truncata (Bt) •
."
CHAPTER IV
DISCUSSION
A total of eight spionid species were identified and collected in
the study area. Only two of the eight species were present at all sites
throughout the year. The followiugdiscussion focuses on the spionid
species that showed relatively distinct patterns of distribution
throughout the study.
Pygospio elegans is a deposit and filter feeder that lives in
clear. papery tubes in mud and sand flats. It can switch from deposit
to suspension feeding when water flow velocity increases (Taghon et al ••
1980). The high relative abundance of this spionid in the summer (July)
at site A could be due to the fact that there is more eelgrass cover
during this time (Harrison 1982a and 1982b). which protects them from
predators that are also known to be more abundant in the summer. The
decline in winter (January) at site A could be due to the reduced or
absent eelgrass cover during the winter. therefore making them more
,Rrone to predation. There thus may be a direct relationship between the
abundance of Zostera and ~. elegans at site A. Another factor that
could have contributed to the abundance of Pygospio in July is that it
may have been reproducing and recruitment may thus have exceeded
predation. The increase in abundance observed from January to April at
II
~!
t
site A may have been due to the sediment build-up in that area caused by
the winter storm in December 1986. The sediment imported into the area
could have carried with it a population of spionids thus resulting to an
increase in abundances. Moreover. this sediment build-up could have
provided more surface area for the survival and settlement of the
polychaetes.
At sites Band C. there appeared to be an inverse relationship
between K. elegans and the abundance of predators. When the abundance
of predators declines from summer to winter (Le Mao. 1986; Wiltse et
al •• 1984). there is a slight increase in the percentage abundance of P.
elegans from summer (July) to winter (January) inside the eelgrass bed.
Some of the reasons for this increase could be the following: (1) the
Zostera acts as a refuge against predation for this spionid. thereby
generally producing an increase in abundance throughout the year at
sites Band C (except in April for site B). (2) some reproduction could
be taking place. and (3) the decay of the rhizomes. stems. and blades of
the eelgrass cause organic nutrients to leach into the sediments.
thereby enhancing the growth and survival of this spionid through the
year. Moreover. K. elegans may be reproducing throughout the year.
which may have contributed to the high January densities (Table 2). The
d~crease in abundance in April at site B could be due to the disturbance
by a winter storm in late January. Half of the trail at site B was
eroded by the storm. Although this site is protected from strong tides
and waves by the channel. it is not however protected from landward
erosion.
43
.~
In the April samples many individuals of this species were observed
to have regenerating parts of their anterior or posterior body segments.
This was not observed in January samples. This would suggest an
increase in predation from January to April. which may be caused by
browsing predators. Many predators known to feed on polychaete
tentacles and tails are visual feeders. like dab. plaice. and juvenile
flatfish (Groot. 1971; Muus. 1976). Posey (1986a) reported that the
known polychaete predators in my study sites are the staghorn sculpin
Leptocottus armatus. the shiner perch Cymatogaster aggregata. and the
Dungeness crab Cancer magister.
Streblospio benedicti is believed to be introduced with the
importation of adult and seed oysters. Crassostrea virginica. from the
Atlantic coast (Carlton. 1979). This spionid species is a deposit
feeder. living in a membranous tube in the sediment and feeding at the
surface by means of long grooved palps (Young and Young. 1978). The
mean density of this organism at all sites is generally higher inside
the eelgrass bed than outside the bed. Jones (1961:234 in Light. 1978)
reported that the period of greatest abundance of ~. benedicti extends
from January to April and from July to November in San Francisco Bay.
In my study. S. benedicti had highest relative abundances at different
.~easons depending on the site: July in sites A and B and almost
throughout the year at site C (Table 3). The slight decrease in
abundance at site A from July to October could be due to the presence of
predators in a less dense eelgrass bed which may have persisted
throughout the early part of the winter. However. the increase in
44
abundance from October to January may be due to the fact that the
presumed absence of predators in the winter enabled them to survive
despite the absence of Zostera. The drop in abundance inside the bed
from January to April may have been caused by the winter storms of
December 1986 and January 1987. A high relative abundance of !.
benedicti is observed in July in site B. and throughout the year at site
C. Moreover. the presumed decrease in predator abundance in the winter
enabled the worms to increase in abundance from October to April at site
B. This decrease in predator intensity could explain the large number
of individuals of this species observed to have regenerating palps and
tentacles in the October samples. These tissue (tentacles and tails)
losses affect the growth rate (Trevallion et al., 1970; De Vlas. 1979)
and reproductive output (Gibbs. 1968) of infauna because energy is
expended for regeneration rather than reproduction. Described as an
opportunistic species by some authors (Grassle and Grassle. 1974:
McCall, 1977). this spionid species is observed to have a higher overall
density inside than outside eelgrass beds in Chesapeake Bay (Virnstein,
1977). This is also true of the !. benedicti population in South
Slough.
Another exotic species believed to be imported with the Japanese
'pyster Crassostrea gigas (Carlton. 1979) is Pseudopolydora kempi. It is
a spionid that inhabits mucoid tubes in sandy mud environments. It is
primarily a deposit-feeder and without exposing the anterior end out of
its tube. it holds its tentacles on the sediment surface to feed (Taghon
et al •• 1980: Woodin. 1982). Pseudopolydora kempi is absent at site A
45
except in January when it appears in low densities. Processes that
could have accounted for this phenomenon are: (1) failure of the larvae
to reach site A but no such failure for sites Band C: (2) it has a
preferred habitat for survival of the larvae: and (3) the presence of
other aggressive competitive species in the community competing for food
resources. At sites Band C. they show variable abundances.
Generally. ~. kempi had higher densities inside than outside the
eelgrass bed at all sites except in site B in January (Table 2).
Boccardia truncata is a deposit feeder and like S. benedicti and P.
kempi has a tendency to suspension feed (Taghon et al •• 1980).
Boccardia truncata does not show any preference in habitat with regard
to the presence or absence of Z. japonica beds at the three sites. The
highest peak in abundance of Boccardia was in January in site A. but in
October at sites Band C (Table 2). It was in October howeveI that a
significant number of individuals were found to brood their young or
larvae in their leathery tubes. Boccardia appears to brood in
relatively open sandy-muddy intertidal areas (sites B and C) and the
young consequently migrate to other areas (site A). This could explain
the difference in time of peak abundance between sites Band C and site
A.
~ Po1ydora 1igni is a sedentary spionid that lives in a fragile
U-shaped tube and feeds at the sediment surface. Two pa1ps are extended
that carry food particles to the mouth (Young and Young. 1978: Dauer et
al •• 1981). It introduced with the Atlantic oyster. Rare in site A. P.
ligni generally showed higher densities outside than inside the eelgrass
46
beds in Sites Band C.
The other species found in the study showed variable occurrences
and low densities (cumulative. 1.6%) and will not be discussed further.
All of these spionids were either deposit or suspension-feeders.
and therefore the differences in their distribution among the three
sites appear to be a function of the sediment characteristics of the
three sites. Moreover. the temporal differences in sbundance of these
organisms could be due to differences in time of reproduction.
recruitment and growth of these organisms (Virnstein. 1978. 1980:
Peterson. 1979) and the presence or absence of the Z. japonica beds.
The exclusion of epibenthic predators from seagrass beds has given
variable results. Virnstein (1978) did not find consistent significant
effects at two eelgrass sites in his study in Florida. and suggested
that predation may not play the major role in community structure of
seagrass beds. In my study. I found that exclusion cages result in
higher densities of worms for abundant species at some but not all
sites. Therefore the observed structure of seagrass communities may
also be explained by other physical and/or biological phemonena: habitat
preference (Orth. 1977: Stoner. 1980: Bell and Westoby. 1986: Main
1987). nutrient and food availability (Whitlatch. 1980: Kitting. 1984:
Wiltse et al •• 1984). sediment stabilization and current disruption
(Coull. 1970: Young and Rhoads. 1971: Orth. 1977). intraspecific
competition (Peterson. 1979) and differences in passive settlement
(Woodin. 1974). For example. Main (1987) showed that prey survival
increased within seagrass that had a better cover suggesting that
47
preference for the habitat would be selected.
The effects of predatory infauna. like nemerteans. amphipods and
nereid po1ychaetes. although not accounted for in this study. should
also be considered. A significant number of these predators were
observed in my samples. Nevertheless. their effects in the regulation
of the structure of soft-bottom communities have not been extensively
studied and are poorly understood (Treval1ion et a1 •• 1970; Witte and
de Wilde. 1979: Wilson. 1979. 1984; Woodin. 1984; Commito and Ambrose.
1985).
The presence of more species at site B both inside and outside the
Zostera. compared to sites A and C. could be due to the presence of
shell fragments. and pieces of metal. wood and rocks in the sediments
here. creating a more spatially heterogeneous habitat. Objects in the
sediments such as wood stakes and rocks. other than supporting an
attachment for epifaunal community. also appear to attract a rich
infaunal community close to them (Orth. 1977). Moreover. Posey and Rudy
(1986) reported that the Ferrie Ranch marsh (site B) had the longest
history of ~. japonica colonization. At sites A and B. there were more
spionid po1ychaetes inside than outside the eelgrass. This could be due
to the fact that these two sites are more protected from the energy of
.the waves and tides as they come into the estuary. This protection
therefore may enhance the settlement of the organisms due to the
relatively lower movement of the substratum and the stabilizing effect
of the rhizomes and other physical structures of the Zostera (Orth et
al •• 1984). As previously stated. the presence of objects in site Band
48
the presence of plant marsh roots and stems in the subtratum of site A.
in the presence of Zostera. could have contributed to the observed
higher density of spionid polychaetes inside than outside the eelgrass
bed. Moreover. site A is more protected than site B.
At site C. the area is relatively unprotected subjecting it to high
wave and tide energy. This high energy would cause drastic shifts in
the sediments. thereby not enabling some organisms to survive and
settle. despite the presence of Zostera.
The one-time occurrence of Spio filicornis at site A in the April
sampling could be due to the sediment importation brought about by the
winter storms in late December 1986 and late January 1987. Sediments
were piled in the area down to approximately 2.5 cm of the top sediment
layer. This suggests that site A is a low energy area which permitted
sedimentation. Therefore. the physical environment of site A is
different from sites Band C which may also explain the difference in
seagrass community structure observed. This sediment build-up at site A
could be responsible for the development of patches of ~. japonica here.
49
,....
the establishment of Zostera at site A could have also contributed to
The expansion of Zostera could be due to habitat modification (Peterson.
1979; Harrison and Bigley. 1982 Bertness. 1984). On the other hand.
t»e sedimentation at this site.
The physical presence of the cages had a significant effect on the
density of spionids inside or outside the ~. japonica beds. This could
be due to the development of a thick mat of the alga Ulva sp. on some of
the cages during these sampling dates. It was observed at site A that
there were more Ulva sp. entagled on some cages. and less at sites Band
C. This is again an evidence of the low energy present at site A.
Hodder (1985) showed that densities of Ulva sp. were highest during the
summer and fall seasons in the South Slough Estuary. Cages with algal
mats exerted more effects outside of eelgrass than inside because
vegetation was a "new" occurrence outside of the ~. japonica beds
resulting in significant cage effects. while algal mats inside the
Zostera beds may be equivalent to the effect of more Zostera growth.
The accumulation of detritus and algae inside the cages could have an
effect on the animals that are inside or outside the eelgrass bed. due
to the nutrients leached out by the detritus and algae. This could be
one of the reasons why there were some cage effects outside the
eelgrass.
The results of this study have demonstrated that predation is one
of the primary processes controlling the differential abundance of
spionids inside versus outside the eelgrass beds. although there were
important exceptions. This result is supported by the experimental data
obtained from predator exclusion cages. Zostera japonica affects the
benthic community by several mechanisms. some of which are evident in
South Slough: (1) the nursery function of submerged vegetation (Hanekom
aand Baird. 1984; Wilson et al •• 1987); (2) the ability to provide cover....for and enhance survival of eelgrass inhabitants (Heck and Thoman. 1981;
Main. 1987); and. (3) the positive correlation of eelgrass with
sedentary species (Posey and Rudy. 1986). These factors could explain
the generally higher densities of spionids inside than outside the
so
51
eelgrass beds. Other than the added protection of the spionid tube. the
stabilizing effect of the Zostera on the substrate and the physical
structures of the eelgrass (e.g. roots-rhizome mat and plant canopy)
also contribute to the protection of the spionids.
CHAPTER V
CONCLUSION AND RECOMMENDATIONS
The density and abundance of the spionid wor.ms in the South Slough
of Coos Bay is evidently influenced by the presence of the introduced
eelgrass Zostera japonica. Inside the Zostera bed there are a high
abundance and density of spionid worms as compared to adjacent
unvegetated areas. Changes in faunal abundances are also affected by
species. site. and season.
The results of this study demonstrate the potential importance of
Zostera. as an introduced species. in structuring part of the benthic
community. The role of ~. japonica as a refuge from predation is only
one of the factors that contribute to the abundance of the spionid
polychaete community. Other factors such as larval recruitment. passive
transport, nutrient availability, disturbance and reproduction may also
be playing important roles in this community.
However. the predictions made in this study should be taken with
caution since they represent only a year of observation. Measurement of....eelgrass cover, in particular, is subject to yearly variations.
Correlation of the eelgrass cover with abundance and diversity of the
spionid community for two or three consecutive years is therefore
recommended. This will also determine more effectively the .ro1e of Z.
52
iaponica in providing protection and refuge from predation.
It is also recommended that monthly sampling of epifaunal predators
should be done to better assess the amount of predation. Furthermore.
infaunal predators must also be considered.
To minimize cage effects a larger cage dimension should be
employed. but the problem here is its management in the field (i.e ••
bringing it to the study site. etc.). Moreover. cages should be rotated
to control for the alteration of hydrodynamic characteristics around the
cage.
53
BIBLIOGRAPHY
Adams. S.M. 1976. Feeding ecology of eelgrass fish communities.Trans. Am. Fish. Soc. 105 (4) :514-519.
54
Bell, J.D •• and M. Westoby. 1986.seagrass is due to habitatOecologia 68:205-209.
Abundance of macrofauna densepreference. not predation.
Berkeley. E•• and C. Berkeley. 1952. Canadian Pacific fauna. Pt.9Annelida 9b(2). Polychaeta Sedentaria.
Bertness. M.D. 1984. Habitat and community modification by anintroduced herbivorous snail. Ecology 65(2):370-381.
Blake. J. 1975. Polychaeta. p.151-243. In Smith, W. and J.T. Carlton(eds.). Light's Manual: intertidal invertebrates of the CentralCalifornia Coast. University of California Press. Berlekey.California. U.S.A.
Carlton. J.T. 1979. History, bibliography. and ecology of theintroduced marine and estuarine invertebrates of the PacificCoast of North America. Ph.D. Dissertation. University ofCalifornia, Davis.
Carr. W.E.S., and C.A. Adams. 1973. Food habits of juvenile marinefishes occupying seagrass beds in the estuarine zone nearCrystal River, Florida. Trans. Am. Fish. Soc. 102(3):511-540.
Commit 0 , J.A•• and W.G. Ambrose. Jr. 1985. Predatory infauna andtrophic complexity in soft-bottom communities, p.323-333.In P.E. Gibbs (ed.), Proceedings of the Nineteenth EuropeanMarine Biology Symposium. Cambridge University Press.Cambridge. England.
Coull. B.C•• and J.B.J. Wells. 1983. Refuges from fish predation:.- experiments with phytal meiofauna from the New Zealand rockyintertidal. Ecology 64:1599-1609.
Day. J.H. 1967. A monograph on the Polychaeta of South Africa. Pt.2.Sedentaria. Eyre and Spottiswoode, Lmtd •• Portmouth.
Dauer, D.M•• C.A. Maybury. and R. Michael Ewing. 1981. Feedingbehavior and general ecology of several spionid polychaetesfrom the Chesapeake Bay. J. Exp. Mar. BioI. Ecol. 54:21-38.
De Groot. S.J. 1971. On the interrelationships between morphology ofthe alimentary tract. food and feeding behaviour in flatfishes(Pisces: Pleuronectiformes). Neth. J. Sea Res. 5:121-196.
De VIas. J. 1979. Secondary production by tail regeneration in a tidalflat population of lugworm (Arenicola marina). cropped byflatfish. Neth. J. Sea Res. 13:362-393.
55
Fauchald. K. 1977. The polychaete wonls.orders. families and genera. Sci.Angeles Cty. Vol. 28. p.1-190.
Definitions and keys toSere Nat. Hist. Mus. Los
Folk. R.L. 1961. Petrology of sedimentary rocks. Hemphill1s.Austin. Texas.
Gambi. M.C •• and H. Giangrande. 1986. Distribut~on of soft-bottompolychaetes in two coastal areas of the Tyrrhenian Sea (Italy):structural analysis. Est. Coastal Shelf Sci. 23:847-862.
Frankenberg. D•• and A.S. Leiper. 1977. Seasonal cycles in benthiccommunities of the Georgia continental shelf. p.383-397.In B.C. Coull (ed.). Ecology of Marine Benthos. Univ. of SouthCarolina Press. Columbia. South Carolina.
Gee. J.M •• R.M. Warwick. J.T. Davey. and C.L.experiments on the role of epibenthicprey density in an estuarine mudflat.21:429-448.
George. 1985. Fieldpredation in determiningEst. Coastal Shelf Sci.
Gonor. J.J •• and P.F. Kemp. 1978. Procedures for quantitativeecological assessments in intertidal environment. Grant No.R805018-01. E.V. Environmental Protection Agency. Corvallis.Oregon.
Gore. R.H •• L.E. Scotto. K.A. Wilson. and E.E. Gallagher. 1981.Studies on decapod crustacea from the Indian River region ofFlorida. XI. Species composition. structure. biomass andspecies-areal relationships of seagrass and drift-algaeassociated macrocrustaceans. Est. Coastal Mar. Sci.
Grassle. J.F •• and J.P. Grassle. 1976. Sibling species in the marinepollution indicator Capitella (Polychaeta). Science 192:567-569.
Gray. J.S. 1974. Animal-sediment relationships. Oceanogr. Mar. BioI.Ann. Rev. 12:223-261.
Hanekom. N•• and D. Baird. 1984. Fish community structures in Zosteraand non-Zostera regions of the Kromme estuary. St. Francis Bay.S. Afr. J. Zool. 19:295-301.
Harper. J.L. 1969. The role of predation in vegetational diversity.Brookhaven Symp. Biol. 22:48-62.
Harrison. P.G. 1979. Reproductive strategies in intertidal populationsof two co-occurring seagrasses (Zostera spp.) Can. J. Bot. 57:2635-2638.
Harrison. P.G. 1982a. Spatial and temporal patterns in abundance oftwo intertidal seagrasses Zostera americana den Hartog andZostera marina L. Aquat. Bot. 12:305-320.
Harrison. P.G. 1982b. Comparative growth of Zostera japonicaAschers & Graebn. and Z. marina L. under simulatedintertidal conditions. Aquat. Bot. 14:373-379.
Harrison. P.G. 1982c. Seasonal and year-to-year variations in mixedintertidal populations of Zostera japonica Aschers. & Graebn.and Ruppia maritima L.S.l. Aquat. Bot. 14:357-371.
Harrison. P.G •• and R.E. Bigley. 1982. The recent introduct~on ofseagrass. Zostera japonica Aschers. and Graebn. to thePacific Coast of North America. Can. J. Fish. Aquat. Sci.39:1642-1648.
56
Hartman. O. 1969.California.
Atlas of sedentariate polychaetous annelids fromAllan Hancock Foundation. Los Angeles. 828 pp.
Hayne. D.W •• and R.C. Ball.by fish predation.
1956. Benthic productivity as influencedLimnol. Oceanogr. 1:162-175.
Heck. K.L. Jr •• and R.J. Orth. 1980. Seagrass habitats: the roles ofhabitat complexity. competition and predation in structuringassociated fish and motile macroinvertebrate assemblage. p.449464. In V.S. Kennedy (ed.). Estuarine Perspectives. AcademicPress. N.Y.
Heck. K.L. Jr •• and T.A. Thoman. 1981. Experiments on predator-preyinteractions in vegetated aquatic habitats. J. Exp. Mar. BioI.Ecol. 53:125-134.
Hodder. J. 1986. Production biology of an estuarine population of thegreen algae. Ulva spp. in Coos Bay. Univ. of Oregon Ph. D.Dissertation. 106 p.
57
Homziak. J •• M.S. Fonseca. and W.J. Kenworthy. 1982. MacrobenthLccommunity structure in a transplanted eelgrass (Zosteramarina) meadow. Mar. Ecol. Prog. Sere 9:211-221.
Johnson. R.G.flat.
1967. The vertical distribution of the infauna of a sandEcology 48:571-578.
Kikuchi. T. 1974. Japanese contributions on consumer ecology ineelgrass (Z. marina L.) beds. with special reference totrophic relationships and resources in inshore fisheriesAquaculture 4:145-16U.
Kitting. C.L. 1984. Selectivity by dense populations of smallinvertebrates foraging amon~ seagrass blade surfaces. Estuaries7(4A):276-288.
Kikuchi. T•• and J.M. Peres. 1977. Consumer ecology of seagrass beds.p.147-193. In C.P. McRoy and C. Helfferich (eds.). SeagrassEcosybtems:a scientific perspective.
Knox. G.A. 1977. The role of polychaetes in benthic soft-bottomcommunities. p.547-604. In D.J. Reish and K. Fauchald (eds.).Essays on Polychaetous Annelids in Memory of Dr. Olga Hartman.Allan Hancock Foundation. Inc.
Faunal relationships in temperate seagrass beds.In R.C. Phillips and C.P. McRoy (eds.). HandbookBiology. Garland STPM Press. N.Y.
Kikuchi. T. 1980.p.153-172.of Seagrass
Lappalainen. A•• G. Hallfors. and P. Kangas. 1977. Dynamics ofmacrobenthos in a sandy bottom Zostera marina community inTvarminne Finland. Int. Rev. ges. Hydrobiol. 62(4):465-504.
Leber. K.M. 1985. The influence of predatory decapod crustaceans,refuge. and microhabitat selection on seagrass communities.Ecology 66:1951-1964.
iLe Mao. P. 1986. Feeding relationships between the benthic infauna andthe dominant benthic fish of the Rance Estuary (France). J.Mar. BioI. Ass. U.K. 66:391-401.
Lewis. F.G. III. 1984. Distribution of macrobenthic crustaceansassociated with Thallasia. Halodule and bare sand substrata.Mar. Ecol. Prog. Sere 19:101-113.
Light. W. J. 1978. Spionidae: Polychaeta Annelida. The Boxwood Press.Pacific Grove. California. U.S.A. 211p.
58
Main. K.L. 1987. Predator avoidance in seagrass meadows: preybehavior. microhabitat selection and cryptic coloration.Ecology 68(1):170-180.
Marsh. G.A. 1973. The Zostera epifaunal community in the York River.Viginia. Chesapeake Sci. 14:87-97.
McCall. P.L. 1977. Community patterns and adaptive strategies of theinfaunal benthos of Long Island Sound. J. Mar. Res. 35:221-266.
McRoy. C.P •• and C. Helfferich. 1977. Seagrass ecosystems: ascientific perspective. Marcel Dekker. Inc. New York.
Nelson. W.G. 1981. Experimental studies of decapod and fishpredation on seagrass macrobenthos. Mar. Ecol. Prog. Ser. 5:141-149.
Nelson. W.G. 1979. Experimental studles of selective predation onamphipods: consequences for amphipod distribution and abundance.J. Exp. Mar. BioI. Ecol. 38:225-245.
S.W •• and C.A. Oviatt. 1972.midsummer metabolism in bedsEcology 53(1):150-153.
Nixon.
Muus. B.J. 1967. The fauna of Danish estuaries and lagoons.Distributions and ecology of dominating species in the shallowreaches of the mesohaline zone. Medd. Dan. Fisk. Havunders. 5:1-316.
Orth. R.J. 1977. The importance of sediment stability in seagrasscommunities. p.281-300. In B.C. Coull (ed.). Ecology of MarineBenthos. Univ. of South-carolina Press. Columbia.
Orth. R.J •• J.L. Heck. Jr •• and J. van Montfrans. 1984. Faunalcommunities in seagrass beds: a review of the influence of plantstructure and prey characteristics on predator-prey relationships. Estuaries 7(4A):339-350.
Peterson. C.H. 1979. Predation. competitive exclusion. and diversityin the soft-sediment benthic communities of estuaries andlagoons. p.233-261. In R.J. Livingston (ed.). EcologicalProcesses in Coastal-and Marine Systems. Plenum Publ. Corp.
II. ~:ItfI
Posey. M.H. 1985. The effects upon the macrofaunal community of adominant burrowing deposit feeder. Callianassa californiensis.and the role of predation in determining its intertidaldistribution. Univ. of Oregon. Ph. D. Dissertation. 119 p.
Posey. M.H. 1986a. Predation on a burrowing shrimp: distributionand community consequences. J. Exp. Mar. BioI. Ecol. 103:143-161.
Posey. M.H. 1986b. Changes in a benthic community associate withdense beds of a burrowing deposit feeder. Calliannassacaliforniensis. Mar. Ecol. Prog. Ser. 31:15-22.
Posey. M.H •• and P.P. Rudy. 1986. The effects of an introducedseagrass. Zostera japonica on benthic communities in theSouth Slough National Estuarine Sanctuary. Draft Report.U.S. Dept. of Commerce. NOAA Grant # NA855AA-D-CZ036.
Quammen. N.L. 1984. Predation by shoreb1rds. flsh. and crabs oninvertebrates in intert1dal mudflats: an expe~imentaL test.Ecol. 65(2):529-537.
Raffaelli. D•• and H. Milne. 1987. An experimental investigation ofthe effects of shorebirds and flatfish predation on estuarineinvertebrates. Est. Coastal Shelf Sci. 24:1-13.
Reise. K. 1977. Predation pressure and community structure of anintertidal soft-bottom fauna. p.513-520. In B.F. Keegan.P.O'Ceidigh and P.J.S. Boaden (eds.). Biology of BenthicOrganism. 11th European Symposium on Marine Biology. Galway.Ireland. 1976. Oxford. Pergamon Press.
Reise. K. 1978. Experiments on epibenthic predation in the WaddenSea. Helgolander wissenschaftliche Meeresuntersuchungen~
55-101.
Reise. K. 1985. Tidal Flat Ecology: an experimental approach to..species interactions. Springer-Verlag. Berlin. 191p •
Rhoads. D.C •• and O.K. Young. 1970. The influence of deposit-feedingorganisms on sediment stabillty and community trophlc structure.J. Mar. Res. 28:150-178.
59
Oregon Estuarine Invertebrates:common and important invertebrateService. FWS 10B5-83/16.
Rudy. P. Jr •• and L.H. Rudy. 1983.an illustrated guide to theanimals. Fish and WildlifeCharleston. Oregon. U.S.A.
Ryer. C.H. 1987. Temporal patterns of feeding by blue crabs(Callinectes sapidus) in a tidal-marsh creek and adjacentseagrass meadow in the lower Chesapeake Bay. Estuaries 10(2):136-140.
Santos. S.L •• and J. L. Simon. 1974. Distribution and abundance of thepolychaetous annelids in a South Florida estuary. Bull. Mar.Sci. 24(3):669-689.
60
Schneider. P. 1978.shorebirds.
Equalisation of prey numbers by migratoryNature 271:353-354.
Sokal. R.R •• and F.J. Rohlf. 1981. Biometry. Second edition. W.H.Freeman. San Francisco. California. U.S.A.
Stoner. A.W. 1983a. Distributional ecology of amphipods andtanaidaceans with three sea grass species. J. Crus. BioI. 49:505-518.
Stoner. A.W. 1980. Abundance.preferences of amphipodApalachee Bay. Florida.
reproductive seasonality and habitatcrustaceans 1n seagrass ffieadows ofMar. Sci. 23:63-77.
Role of predation ina temperate-zone seagrass bed.
Stoner. A.W •• and H.S. Greening. 1983b. Comparison of macrobenthoscollected with cores and suction sampler in vegetated andunvegetated marine habitats. Estuaries 6(1):76-82
Tabb. D.C •• D. Dubrow. and R. Manning. 1962. The ecology of northernFlorida Bay and adjacent estuaries. Tech. Sere Fla. St. Bd.Conserve 39:1-79.
Taghon. G.L •• A.M. Nowell. and P.A. Jumars. 1980. Induction ofsuspension feeding in spionid polychaetes by high particulatefluxes. Science 210(4469):562-564.
Tenore. K.R •• L. Cammen. S.E.G. Findlay. and N. Phillips. 1982.Perspective of research on detritus: do factors controllingthe availability of detritus to macroconsumers depend on itssource? J. Mar. Res. 40:473-490. I
i
II,\
1I
~I.~
It
Thayer. G.W •• S.M. Adams. and M.W. La Croix. 1975a. Structural andfunctional aspects of a recently established Zostera marinacommunity. p.518-540. In Estuarine Research. Vol. I. AcademicPress. New Yo rk.
Thayer. G.W .• and R.C. Phillips. 1977. Importance of eelgrass beds inPuget Sound. Mar. Fish. Res. 39:18-22.
Thorhaug. A•• and M.A. Roessler. 1977. Seagrass community dynamics insubtropical estuarine lagoon. Aquaculture 12:253-277
Trevallion. A.R •• R.C. Edwards. and J.H. Steele. 1970. Dynamics of abenthic bivalve. p.285-295. In J.H. Steele (ed.): MarineFood Chains. Berkeley. University of California Press.
Virnstein. R.W. 1977. The importance of predation by crabs and fisheson benthic infauna in Chesapeake Bay. Ecology 58:1199-1217.
Virnstein, R.W. 1978. Predator caging experiments in soft sediments:caution advised, p.261-273. In V. S. Kennedy Ced.), EstuarineInteractions. Academic Press, Inc.
Virnste~n, R.W. 1980. Measuring effects of predation on benth~c
communities in soft sediments. p.281-290. In V.S. Kennedy(ed.). Estuarine Perspective. Academic Press. New York.
Virnstein. R.W •• W.G. Nelson, F .G. Lewis. III. and R.K. Howard. 1984.Latitudinal patterns in seagrass epifauna: do patterns exist.and can they be explained? Estuaries 7:310-330.
Wilkinson. R.P. 1984. Systems Statistics. Ill.
Wilson, J.H. Jr. 1979. Community structure and species diversity ofthe sedimentary reefs constructed by Petaloproctus socialis(Polychaeta: Maldanidae). J. Mar. Res. 37:623-641.
Wilson. J.H. Jr. 1984. An experimental analysis of spatialcompetition in a dense infaunal community: the importance ofrelative effects. Est. Coastal Shelf Sci. 18:673-684.
Wilson. K.A •• K.L. Heck. Jr •• and K.W. Able. 1987. Juvenile blue crab,Callinectes sapidus. survival: an evaluation of eelgrass.Zostera marina. as refuge. Fish. Bull. 85(1):53-58.
Wiltse. W.I •• K.H. Foreman. J.M. Teal. and I. Valiela. 1984. Effectsof predators and food resources on the macrobenthos of saltmarsh creeks. J. Mar. Res. 42:923-942.
61
Witte. F•• and P.A.W.J. de Wilde. 1979. On the ecological relationbetween Nereis diversicolor and juvenile Arenicola marina.Neth. J. Sea Res. 13:394-405.
62
Whitlatch. R.B. 1980. Patterns of resource utilization and coexistencein marine intertidal deposit-feeding communities. J. Mar. Res.38:743-765.
Woodin. S.A. 1974. Polychaete abundance patterns in a marine softsediment environment: the importance of biological interactions. Ecol. Monog. 44:171-187.
Woodin. S.A. 1982. Browsing: important in marine sedimentaryenvironments? Spionid polychaete examples. J. Exp. Mar.BioI. Ecol. 60:35-45.
Woodin. S.A. 1984. Effects of browing predators: act1v1ty changesin infauna following tissue loss. BioI. Bull. Mar. Biol. Lab .•Woods Hole. Mass. 166:558-573.
Woodwick. K.H. 1977. Lecithotrophic larval development in Boccardiaproboscidea Hartman. p.347-372. In D.J. Reish and K. Fauchald(eds.): Essays on Polychaetous Anneclids in Memory of Dr. OlgaHartman. Allan Hancock Foundation. U.S.A.
Young. D.K •• and D.C. Rhoads. 1971. Animal-sediment relations in CapeCod Bay. Massachusetts. I. A transect study. Mar. Biol. 11:242-254.
Young. D.K •• M.A. Buzas. and M.W. Young. 1976. Species densities ofmacrobenthos aasociated with seagrass: a field experimentalstudy of predation. J. Mar. Res. 34:577-592.
Young. D.K •• and M.W. Young. 1977. Community structure of the benthosassociated with seagrass of the Indian River Estuary. Florida.p.359-382. In B.C. Coull (ed.). Ecology of Marine Benthos.Univ. of South Carolina Press. Columbia.
Young. D.K ••• and M.W. Young. 1978. Regulation of species densitiesof seagrass-associated macrobenthos: evidence from fieldexperiments in the Indian River estuary. Florida. J. Mar. Res.36(4):569-593