54
Qlik User Forum 17 th June 2015

Qlik User Forum 17th June 2015

Agenda
• Welcome – Tony Bell, Sales Director, Decision Inc.
• It’s not just analytics. Embedding information management best practices across the organisation– Nick Bell, CEO, Decision Inc.
• SAB Limited’s QlikView Journey– Grant McDavid, Systems Manager, MIS, SAB Limited
• NPrinting– Gavin Sheehan, Operations Manager, Decision Inc.
• Predictive Analytics– Paul Morgan, Director and Rousseau Kluever, QlikView Manager, Decision Inc.
• Is Qlik Sense Enterprise Ready? – Willem Ahlers, Solution Architect, Qlik
• Closing – Tony Bell, Sales Director, Decision Inc.

It’s not just analytics. Embedding information
management best practices across the
organisation - Nick Bell

Nick Bell
• Nick holds a B.Comm Honours degree from the University of Johannesburg
• Established BusinessIntelligent in 2006\
• Nick built BusinessIntelligent into the largest Qlikview partner in South Africa
• Started Decision Inc. through merger of BusinessIntelligent, ASYST Intelligence and DigiQuillProductivity.

Agenda
• What is Information Management
• Decision Inc.’s journey of understanding
• Understanding Decision Making
• Understanding the User
• Where BI and IM integrate
• BI in the Enterprise

What is Information Management
• Information management (IM) concerns a cycle of organisational activity:
• the acquisition of information from one or more sources• the custodianship and the distribution of that information to those
who need it• its ultimate disposition through archiving or deletion
Taming the Digital DragonThe 2014 CIO Agenda - Gartner
Understanding Information Management
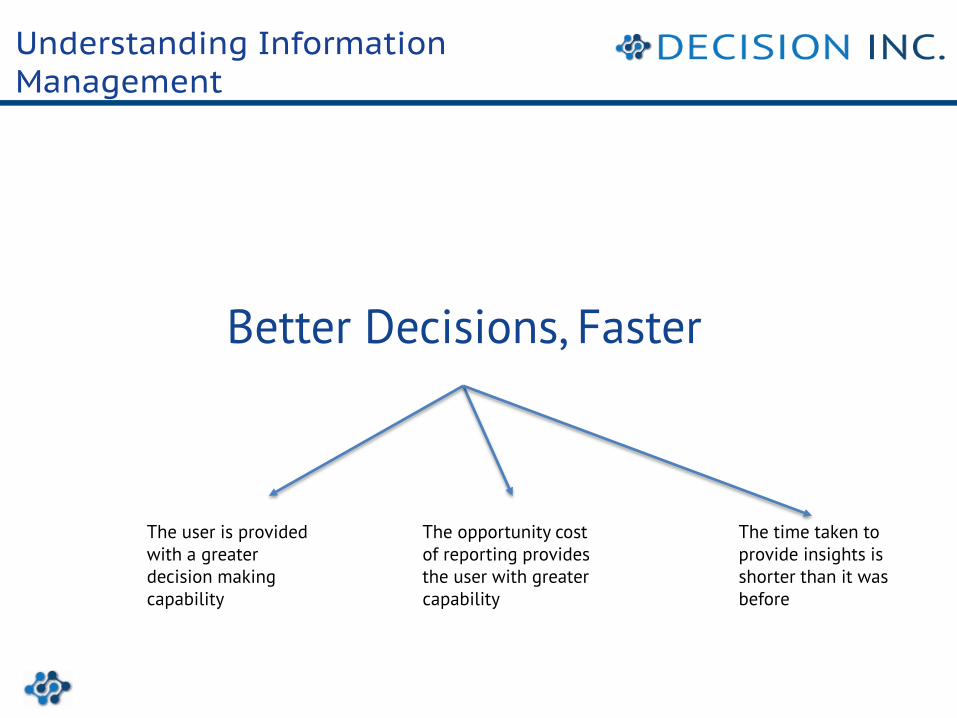
Better Decisions, Faster
The user is provided with a greater decision making capability
The opportunity cost of reporting provides the user with greater capability
The time taken to provide insights is shorter than it was before

Understanding Information Management
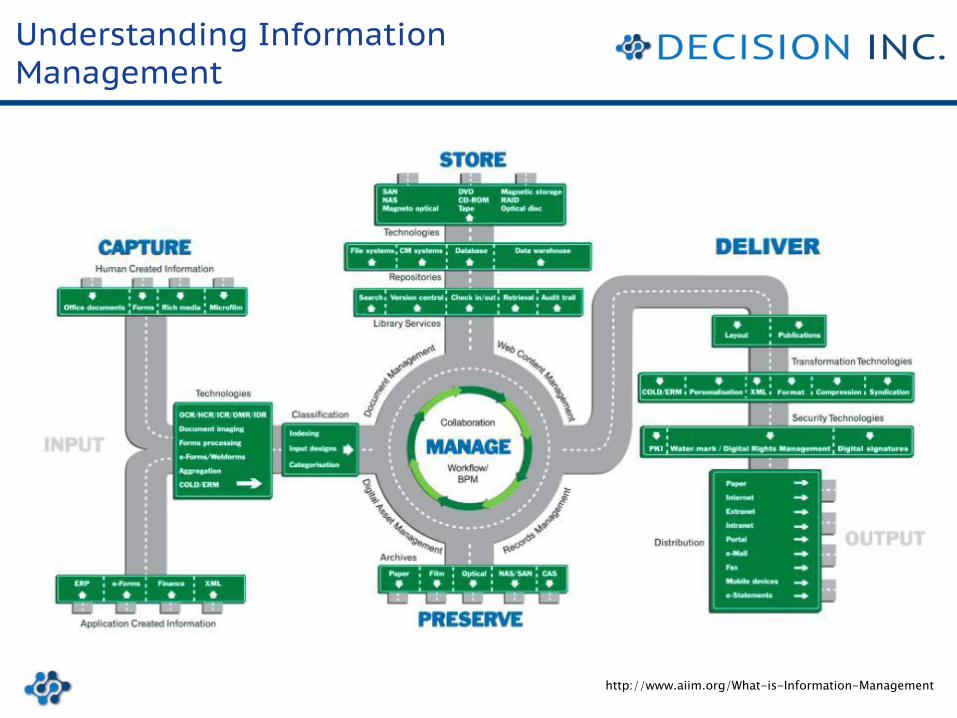
http://www.aiim.org/What-is-Information-Management

Understanding Information Management
Business Intelligence
Content and Collaboration
Data Management
ERP and Source Systems
Understanding Information Management
http://www.aiim.org/What-is-Information-Management

Capture Engage Store Insight Measure
Understanding Information Management

Understanding Information Management
DECISION MADE
Capture Engage Store Insight Measure

Information Management Components
• Strategy Design and Roadmap
• Industry Analysis
• IM Capability Support
IM Strategy
• Data Governance
• Data Quality
• Data Migration
• Master Data Management
• Data Integration
• Big Data
Data Management
• Structured/Unstructured Data
• Collaboration and Portals
• Document Management
Content Management
• Dashboards
• Analysis
• Reporting
• Business Discovery
• Mobility
Business Intelligence
• Simulations and Optimizations
• Scenario Analysis
• Real Time Analytics
• Predictive Analysis
Advanced Analytics
• Financial Budgeting and Planning
• Financial Consolidation
• Balanced Scorecard
• Performance Management
Enterprise Performance Management

Process of Understanding
Context
UnderstandingData
Information
Knowledge
Wisdom
Reports
Analytics
Predictive
Data is an item without any context or relation to other things.
Information represented by relationships between data and other data sources to make it meaningful.
Knowledge is represented by patterns among data, information and other knowledge. The patterns don’t provide knowledge until they have been understood.
Wisdom is the recognition that knowledge patters arise from fundamental principles and the understanding of what those principles are.
UNDERSTANDING RELATIONSHIPS
UNDERSTANDING PATTERNS
UNDERSTANDING PRINCIPLES
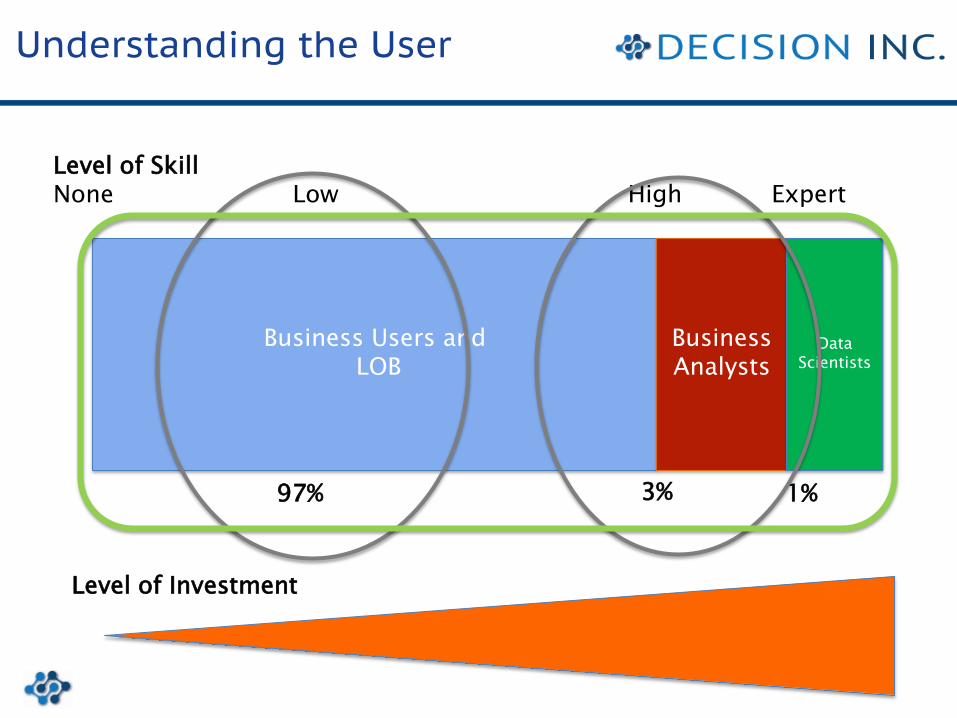
Understanding the User
15
Business Users andLOB
Business Analysts
Data Scientists
97% 3% 1%
Level of SkillNone Low High Expert
Level of Investment
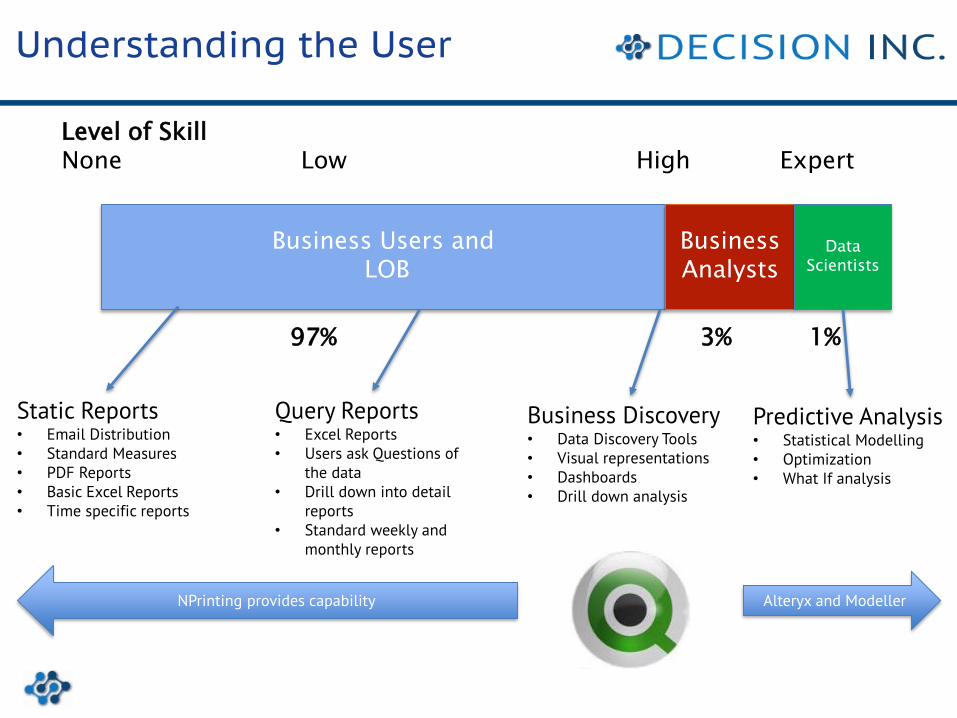
Understanding the User
16
Business Users andLOB
Business Analysts
Data Scientists
97% 3% 1%
Level of SkillNone Low High Expert
Static Reports• Email Distribution• Standard Measures• PDF Reports• Basic Excel Reports• Time specific reports
Query Reports• Excel Reports• Users ask Questions of
the data• Drill down into detail
reports• Standard weekly and
monthly reports
Business Discovery• Data Discovery Tools• Visual representations• Dashboards• Drill down analysis
Predictive Analysis• Statistical Modelling• Optimization• What If analysis
NPrinting provides capability Alteryx and Modeller

BI in the Enterprise
• With the importance of Information Management within the organization as the solution to enabling decision making
• As well as the need to expand the provision of information across the organization
• A scalable, enterprise ready application is needed to provide the backbone for the organizations decision making needs
• We believe QlikView has this capability
• We also believe that the steps the organization is taking to deliver true enterprise BI position it as a leader in the market

Summary
• Decision Inc. is investing in its organization to deliver greater capability to your business
• We are acquiring firms that we believe will provide you with a better service offering
• We will continue to invest in research and design of concepts and information that we believe will provide you with the best solution for your business
• Thank you for your time and continued support!

SAB Limited’s QlikView Journey –
Grant McDavid, Systems Manager, MIS, SAB Limited
19

Grant McDavid
Grant joined SAB Limited initially in 1997 as a sales rep and joined SAB IS in 2001 after working as an analyst in Trade Marketing.
During a break from SABMiller for 2 years , Grant participated in Projects in both Saudi Arabia and London and after an integration role on the Global SAP Template project for SABMiller in 2010, transitioned into MIS.
Grant was promoted to MIS Manager in 2014

Creating Curiosity with Qlikview
Grant Mc DavidMIS Manager: SABMiller GIS ZA

© SABMiller plc 2013
Internal Use / Confidential / Secret 22
Have you ever considered what happens around us in 60 secs..

© SABMiller plc 2013
Internal Use / Confidential / Secret 23
Agenda
1. SABMiller, the C21 Global Beverage organisation
2. 5 Steps to Effective Business Intelligence
3. Use Case: TTL BI in the Order to Cash Cycle
4. Multiple Platforms of information delivery at SABM
5. From the Customer’s viewpoint..

© SABMiller plc 2013
Internal Use / Confidential / Secret 24
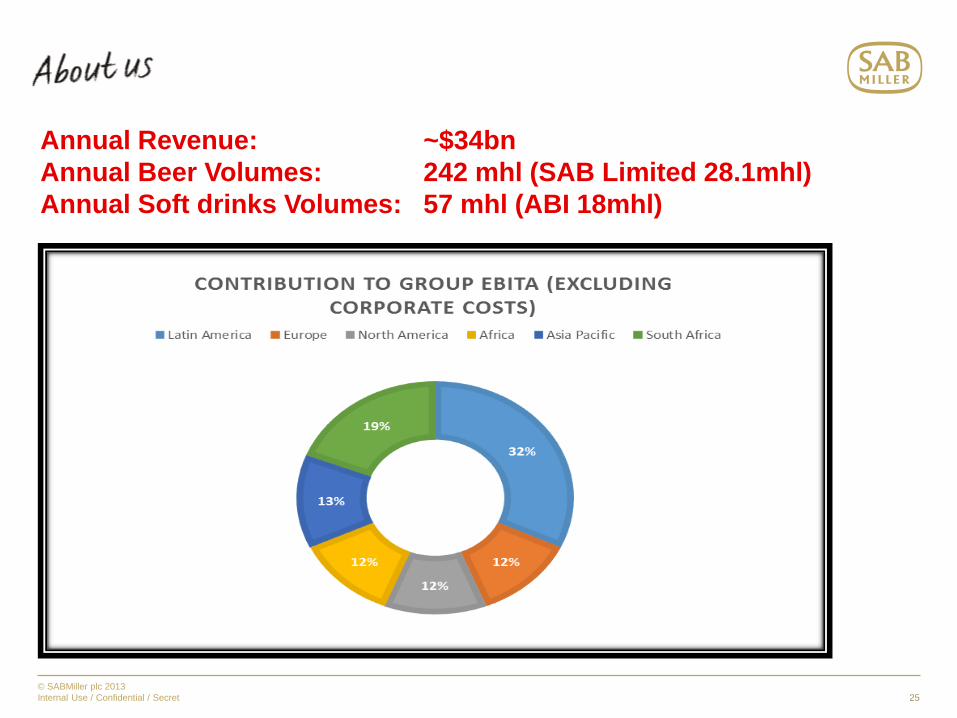
SABMiller plc is one of the world’s leading brewers with
more than 200 beer brands and some 70,000 employees in
over 75 countries.
© SABMiller plc 2013
Internal Use / Confidential / Secret 25
Annual Revenue: ~$34bn
Annual Beer Volumes: 242 mhl (SAB Limited 28.1mhl)
Annual Soft drinks Volumes: 57 mhl (ABI 18mhl)

© SABMiller plc 2013
Internal Use / Confidential / Secret 26
How did we get it right?
People
Business Partnering has aggressively accelerated our ability to deliver business value
Mature IS Organisation encompassing build and run
Growing relevant Business Organisation
Process
Growing Business gravitation towards SSBI
IS cannot staff the growing analytics needs
Teach those men and women to fish
Technology
Relevant Technology for relevant use cases
Don’t be scared to redefine
© SABMiller plc 2013
Internal Use / Confidential / Secret 27
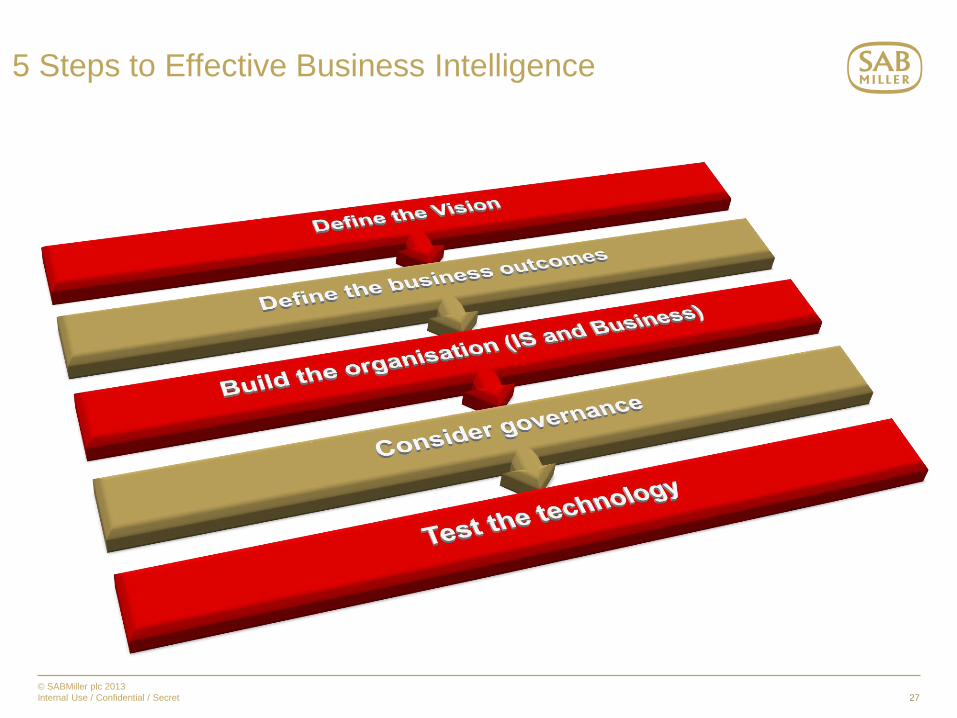
5 Steps to Effective Business Intelligence

© SABMiller plc 2013
Internal Use / Confidential / Secret 28
The Order to Cash BI Journey
2001
Introduction of SAP BW on non SAP ERP system
Flat BW Native Reporting
2003
Introduction of GIS reporting capability on top of original Flat Structure
2005
Introduction of SAP ECC ERP system
BI reporting remains unchanged
2009
Introduction of Qlikview analytics Capability
Significant Increase in analytical Capability
2013
Never Lose sight of the goal…
© SABMiller plc 2013
Internal Use / Confidential / Secret 29
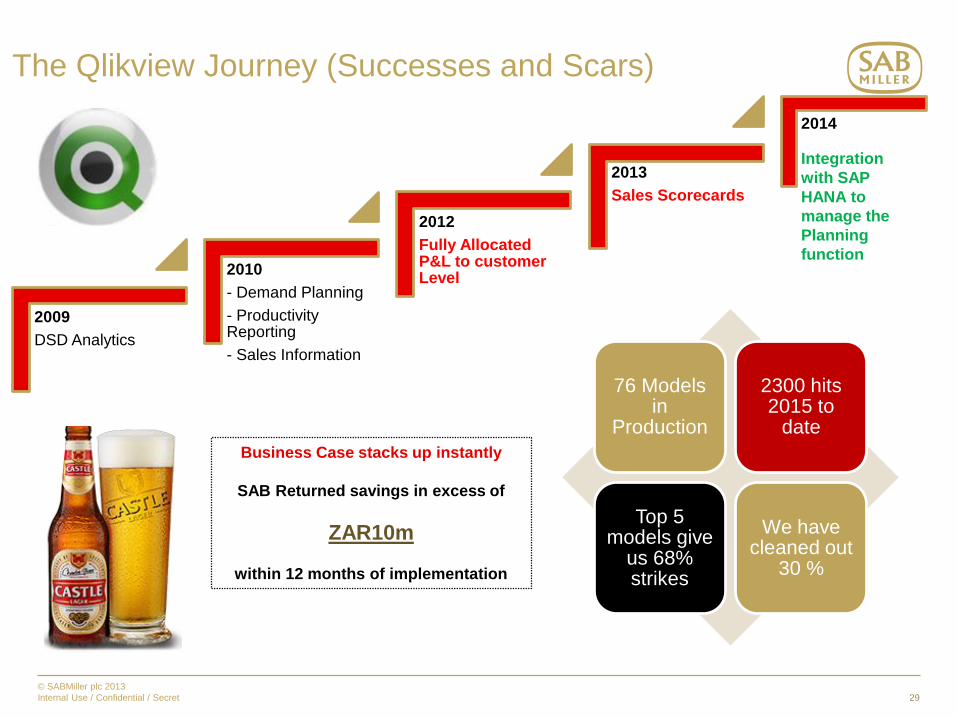
The Qlikview Journey (Successes and Scars)
2009
DSD Analytics
2010
- Demand Planning
- Productivity Reporting
- Sales Information
2012
Fully Allocated P&L to customer Level
2013
Sales Scorecards
2014
Integration
with SAP
HANA to
manage the
Planning
function
76 Models in
Production
2300 hits 2015 to
date
Top 5 models give
us 68% strikes
We have cleaned out
30 %
Business Case stacks up instantly
SAB Returned savings in excess of
ZAR10m
within 12 months of implementation

© SABMiller plc 2013
Internal Use / Confidential / Secret 30
IM Vision for the Future – Ways of Working
The IM Continuum

© SABMiller plc 2013
Internal Use / Confidential / Secret 31
Business Intelligence Technology Platform (example)
Strategic
Analytical
OperationalH
O
T
W
A
R
M
C
O
L
D
Data Temperature
EDW

© SABMiller plc 2013
Internal Use / Confidential / Secret 32
From the Customers Viewpoint
“Curiosity is the engine of achievement.”
“If you're not prepared to be wrong, you'll never come up with anything original.”

© SABMiller plc 2013
Internal Use / Confidential / Secret 33
Questions..
Nprinting – Gavin Sheehan, Operations Manager, Decision
Inc.
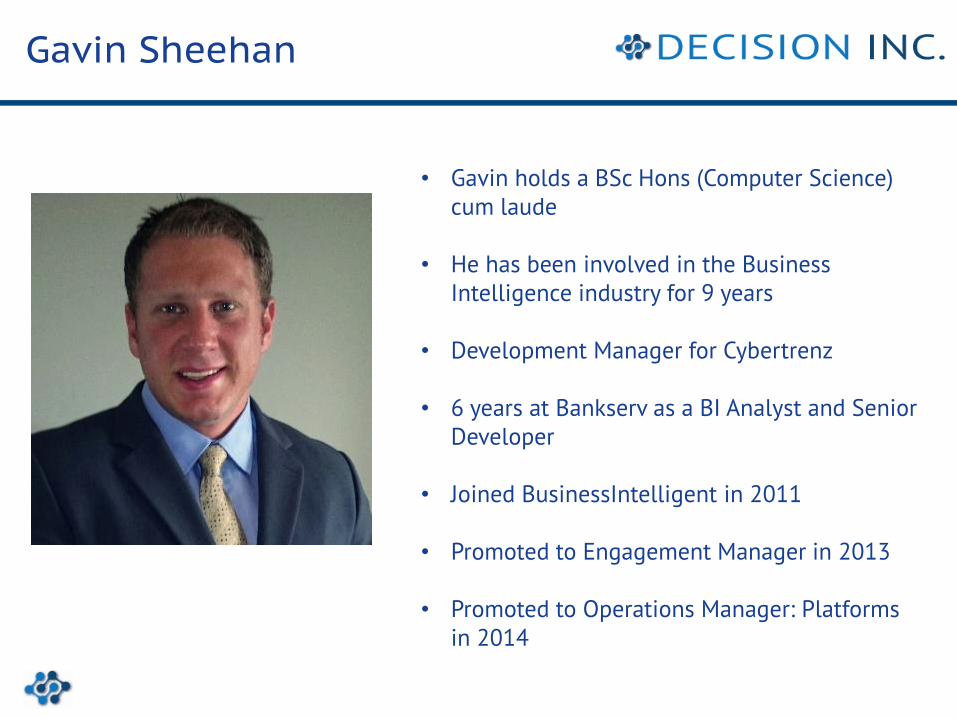
Gavin Sheehan
• Gavin holds a BSc Hons (Computer Science) cum laude
• He has been involved in the Business Intelligence industry for 9 years
• Development Manager for Cybertrenz
• 6 years at Bankserv as a BI Analyst and Senior Developer
• Joined BusinessIntelligent in 2011
• Promoted to Engagement Manager in 2013
• Promoted to Operations Manager: Platforms in 2014
NPrinting
What is
NPrinting

NPrinting
NPrinting is an advanced report generation, distribution and scheduling application for
QlikView.

NPrinting
Create great looking reports, fast!
- Office reports and integration- PDF and Web reports
Distribute the right reports to the right people - Managed report distribution
- On-Demand reporting
Drive Reporting Efficiencies- Eliminate legacy reporting systems
- Engage with a single vendor
NPrinting
NPrinting Demo

Predictive Analytics –
Paul Morgan, Director and Rousseau Kluever, QlikView Manager

Paul Morgan & Rousseau Kluever
• Rousseau holds Honours degrees in both Information Systems and Financial Management
• Rousseau has 6 years experience in BI• Joined BusinessIntelligent in 2012• Promoted to Engagement Manager in
2013• Promoted to QlikView Manager in
2015•
• Paul holds a Bachelor of Science in Information Technology (Honours) from Loughborough University of Technology
• He has 25 years experience in BI and data management.
• Paul was previously Managing Director of ASYST Intelligence
• In 2014 ASYST merged with Decision Inc., with Paul as a Director and Head of Platforms.
What is Predictive Analytics?
Predictive analytics deals with extracting information from data and using it to predict trends and behavior patterns.
Often the unknown event of interest is in the future, but predictive analytics can be applied to any type of unknown whether it be in the past, present or future.
(Wikipedia)
43
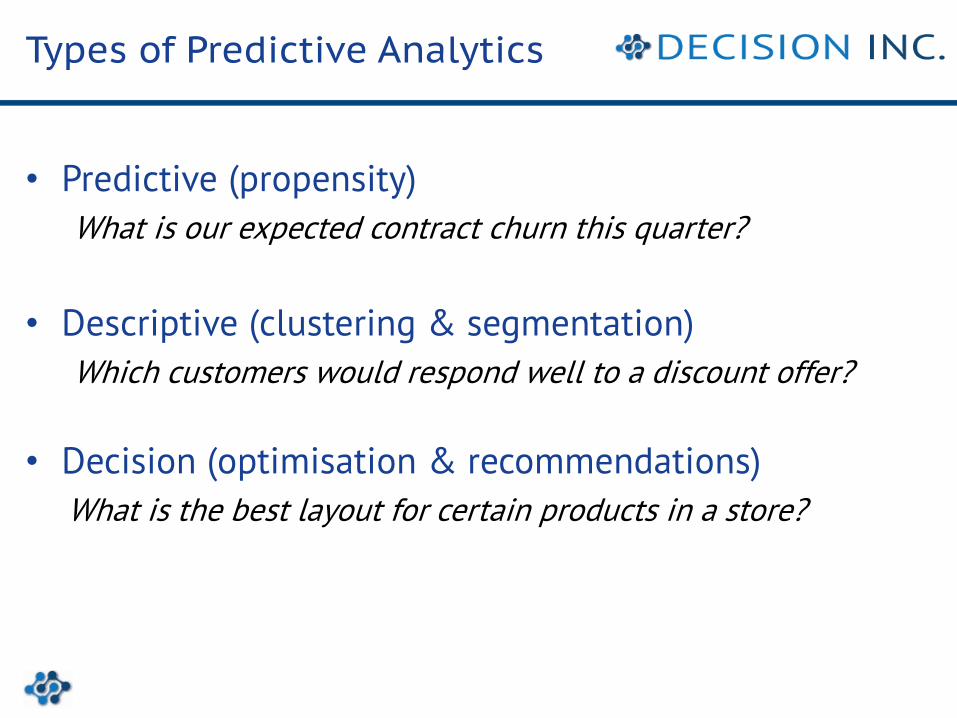
Types of Predictive Analytics
• Predictive (propensity)
What is our expected contract churn this quarter?
• Descriptive (clustering & segmentation)
Which customers would respond well to a discount offer?
• Decision (optimisation & recommendations)
What is the best layout for certain products in a store?
•

44
Maturity of Analytics
RawData
CleanedData
Standard Reports
Ad Hoc Reports
Agile Visualisation
Predictive Modelling
Optimisation
What happened?
Why did it happen?
What will happen?
What isthe best that
could happen?Use
r E
ng
ag
em
en
t
Maturity of Analytics Capabilities
Self Service BI
Generic Predictive Analysis
Co
lle
ctiv
e I
nsi
gh
t
45
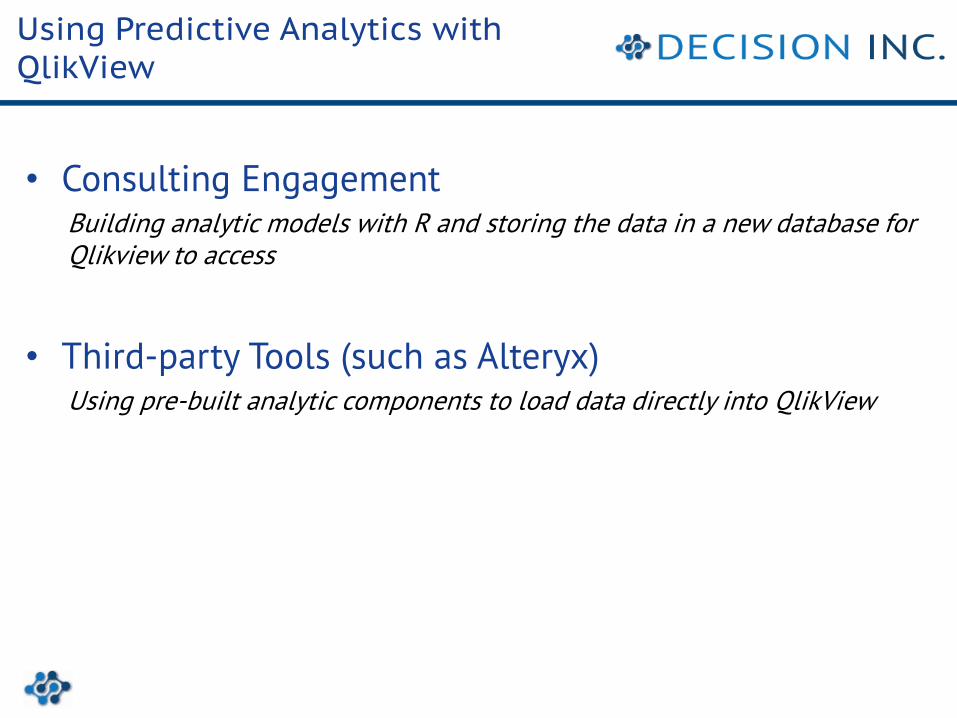
Using Predictive Analytics with QlikView
• Consulting EngagementBuilding analytic models with R and storing the data in a new database for Qlikview to access
• Third-party Tools (such as Alteryx)Using pre-built analytic components to load data directly into QlikView
•

Basket Analysis
Potential Benefits of Basket Analysis
• Aim of the analysis is to identify actionable information, such as:
• Purchase profiles by uncovering consumer spending patterns,
• Profitability of each purchase profile,
• Insight about fast and slow moving products,
• Design and layout of catalogues exploiting cross-sell and upsell opportunities,
• Selection of appropriate products for promotion including bundling, coupons etc., and
• Shelf space allocation and product placement e.g. affinity positioning.
Where should detergents be placed in the store to maximise their sales?
Are window cleaning products purchases when detergents and orange juice are bought together?
Are carbonated soft drinks typically purchased with fruit and vegetables?
Is there potential for cross-sell and up-sell of goods?

‘Bundle sugar and washing powder to increase the likelihood of a customer
purchasing goods across product categories.’
• Consumers who buy sugar, have a high probability of purchasing associated goods such as creamers and maize, i.e. sugar is a ‘product driver’
• Bundling product drivers increases basket size, prevents consumers from purchasing associated products from competitors and creates affinity for the retailer
To understand which combinations of goods should be bundled, discounted or placed strategically together in order to increase volumes
Cross-Sell Opportunity

To understand which combinations of goods should be bundled, discounted or placed strategically together in order to increase volumes
‘Discount Roll-ons to attract customers to buy at the retailer, increasing the likelihood that customers purchase associated products such as aerosols, toothpaste etc.’
• By incentivising customers to purchase Roll-ons at the retailer, there is an increased probability they will also buy the associated goods, such as aerosols, toothpaste, hand & body lotions etc.
Discount Opportunity

To understand which combinations of goods should be bundled, discounted or placed strategically together in order to increase volumes
‘Place associated products such as baking powder and custards
far from jelly, compelling customers to walk through other parts of the store, increasing the
likelihood of other products being purchased.’
• Customers purchasing jelly have a high probability to purchase associated items such as baking powder etc. By placing these items apart, we compel the customer to walk through the store to get both, thereby increasing the chance of other purchases.
Product Placement Opportunity

R 18
R 19
R 20
R 21
R 22
R 23
R 24
60 70 80 90 100 110 120 130 140 150
Pri
ce
Average Quantity per Day
TASTIC RICE PARBOILED 2 kgNotes:
• Rice is a KVI and part of a list of products with prices most remembered
• The elasticity at different price points indicates that consumers are sensitive to the price
Relatively Inelasticɛ = 1,7
Relatively Elasticɛ = 3,79
-7%
29%
Consumers decrease the volumes
purchased at higher price points. The
slope indicates that prices above R22 are
relatively more inelastic.
A 7% decrease in price will
lead to a 29% increase in
daily quantity purchased.
Overall effect is a net gain.
As prices increase, customers tend to substitute Tastic rice for other similar goods or switch to competing stores
Price Elasticity

Sales Forecasting
Demo

Is Qlik Sense Enterprise Ready?
Willem Ahlers, Solution Architect, Qlik MEA & Turkey

Willem Ahlers
Willem Ahlers is a Solution Architect for Qlik MEA & Turkey.
Willem has more than a decade's experience in delivering Business Intelligence solutions to enterprise clients across a broad range of industries, including finance, banking, fast moving consumable goods, telecommunication and hospitality. With a passion for realising tangible benefits Willem has made a career of creating value for organisations and the people that work in them.

Thank you


