55
QlikView Overview Insert Your Name

QlikView Overview
Insert Your Name
A New Kind of Software Company
• U.S.-based company, founded in 1993 in Sweden
• Highest customer success rate
• 15,000 customers in 100 countries
• 1,100 global partners
• 650 employees across 22 offices in 24 countries
• NASDAQ: QLIK
Broad Base of 15,000 Customers

July 16 - NASDAQ: QLIK
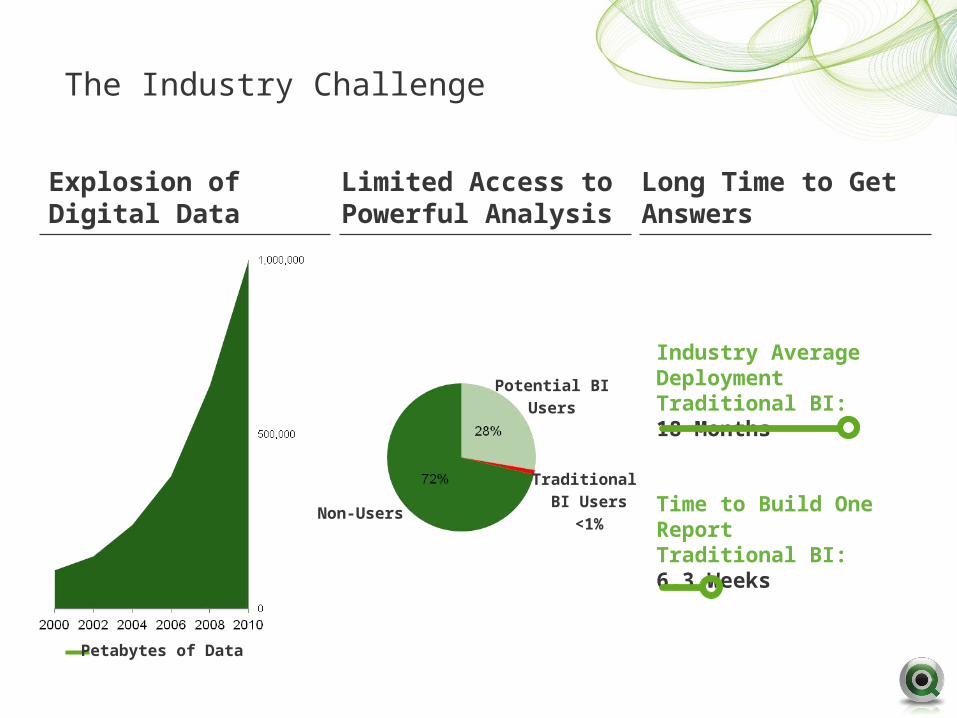
The Industry Challenge
Explosion of Digital Data
Limited Access to Powerful Analysis
Long Time to Get Answers
Non-Users
Industry Average Deployment Traditional BI: 18 Months
Time to Build One ReportTraditional BI: 6.3 Weeks
Petabytes of Data
Potential BI
Users
Traditional
BI Users
<1%

Innovations are Remaking Markets
BISmartPhone CRMSearch
SIMPLICITYSIMPLICITY SIMPLICITY SIMPLICITY
PageRankSearch
iPhone SAAS-basedCRM
What Do These Companies Have in Common?
Associative BI
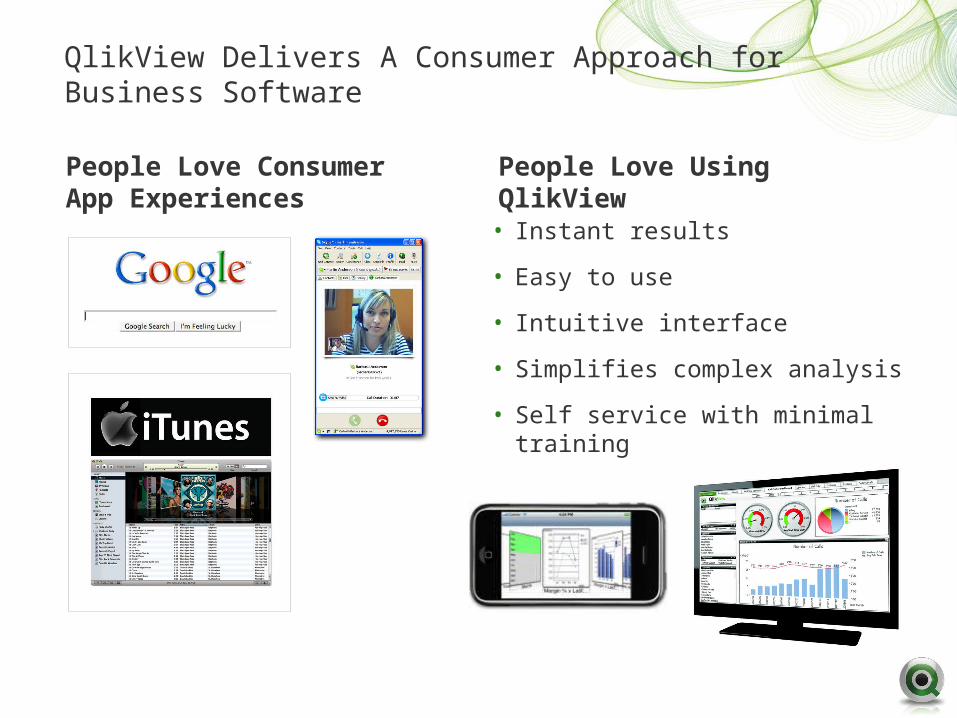
QlikView Delivers A Consumer Approach for Business Software
People Love Consumer App Experiences
People Love Using QlikView
• Instant results
• Easy to use
• Intuitive interface
• Simplifies complex analysis
• Self service with minimal training
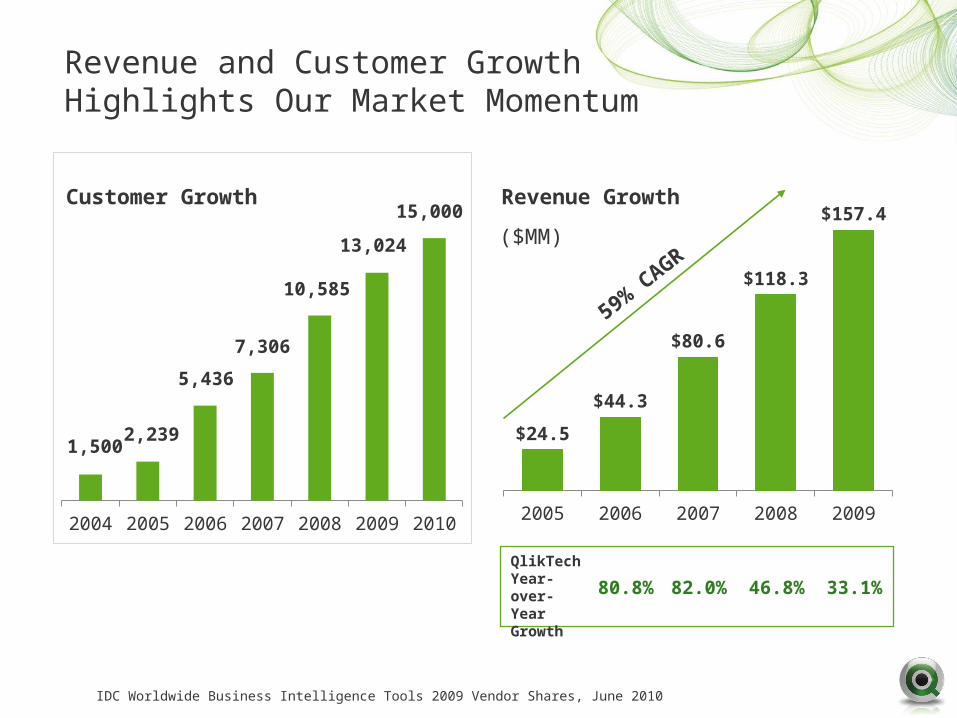
Revenue and Customer Growth Highlights Our Market Momentum
2004 2005 2006 2007 2008 2009 2010
1,5002,239
5,436
7,306
10,585
13,024
15,000
2005 2006 2007 2008 2009
$24.5
$44.3
$80.6
$118.3
$157.4
59% CAGR
($MM)
Revenue Growth
33.1%80.8% 82.0% 46.8%
QlikTech Year-over-Year Growth
IDC Worldwide Business Intelligence Tools 2009 Vendor Shares, June 2010
Customer Growth
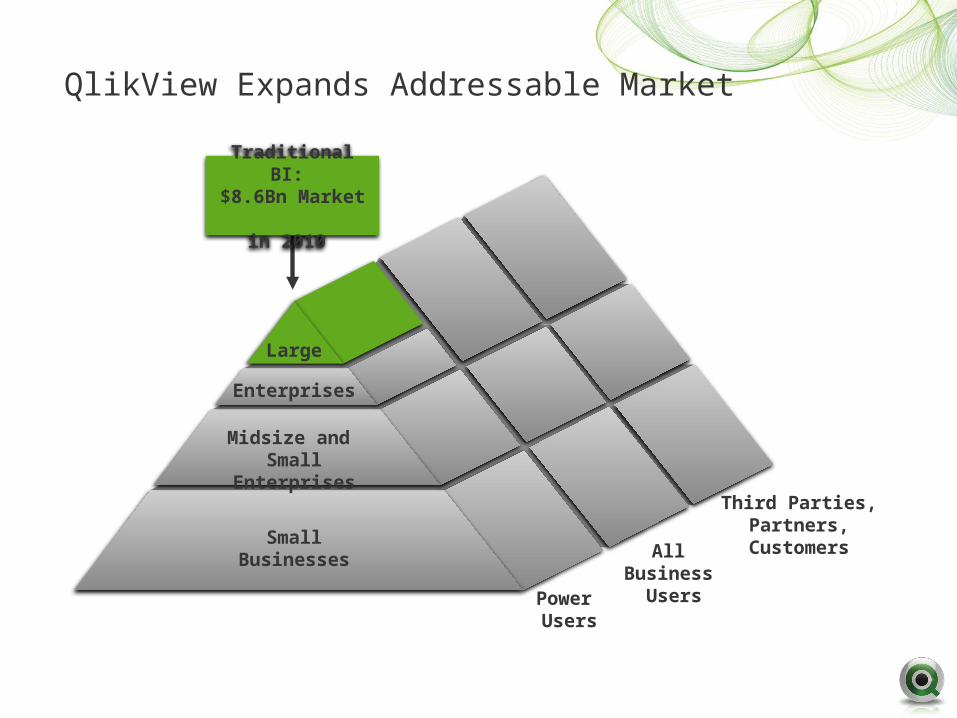
QlikView Expands Addressable Market
Large
Enterprises
Power Users
All Business
Users
Midsize and Small Enterprises
Small Businesses
Third Parties, Partners,
Customers
Traditional BI: $8.6Bn Market
in 2010

Disruptive Technology, Power and Simplicity
IT Dependent Business User Driven
An
alyt
ic C
ap
abi
lity
Low
Hig
h
®
User Type

Making the Complex Simple
• Consolidate informationrapidly from any data source
• Search data withGoogle-like ease
• Visualize data withstate-of-the art graphics

Associative Search Puts Users in Control
Region
State
Product
Sales Person
IT Driven• Linear, pre-defined thinking• Insights missed in hidden data• Months to change• Data-centric
User Driven• Follows the user• All data, always visible• Minutes to change• Insight driven
Traditional Associative
Region
Product
StateSales Person

Empowering Business Users
• “Pull model” gives users what they need when they need it
• Easily analyze and drill down into key elementsof the business
• Forecast, trend and createWhat-If? Scenarios
• Create self-service custom apps and dashboards
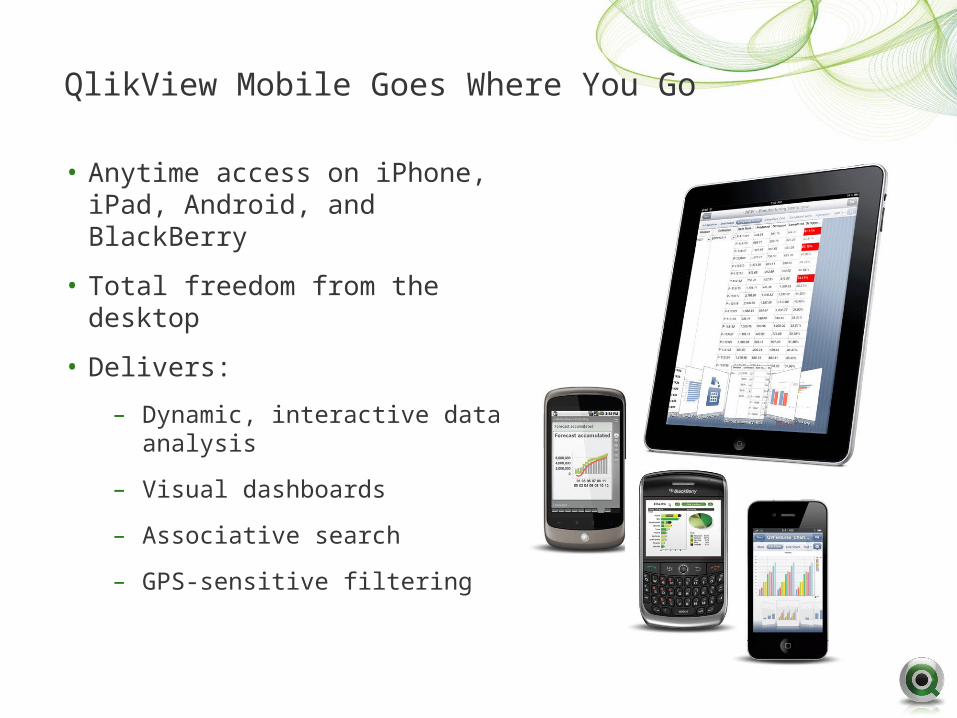
QlikView Mobile Goes Where You Go
• Anytime access on iPhone, iPad, Android, and BlackBerry
• Total freedom from the desktop
• Delivers:
– Dynamic, interactive data analysis
– Visual dashboards
– Associative search
– GPS-sensitive filtering

Collaborative BI: Think It, Build It, Share It
• Any business user can create a QlikView app
• Mash them up into complementary apps like Google Maps or SharePoint
• Use QlikView Extensions to integrate third-party visualizations into QlikView

Maximum Scalability
• Scales to meet the requirements of the largest global enterprises, including:
• Supports tens of thousands of connected users and billions of records
• Perfect linear scalability
• Virtualization and cloud deployments

Deep Manageability
• Powerful, flexible and easy consoles for measuring, monitoring and deploying QlikView applications and data
• Gives IT a single view into deployment status for single or multiple servers
• Centralized management capabilities including load balancing, administration, and refresh scheduling

Complementary To Existing BI and CRM Systems
• Purpose-built connectors for popular applications, including SAP and Salesforce.com
• Eases access and analysis of business data
• Better leverage investments in existing business and warehousing assets
• Enables business users to take advantage of complex systems
• Higher ROI on entire enterprise stack investment
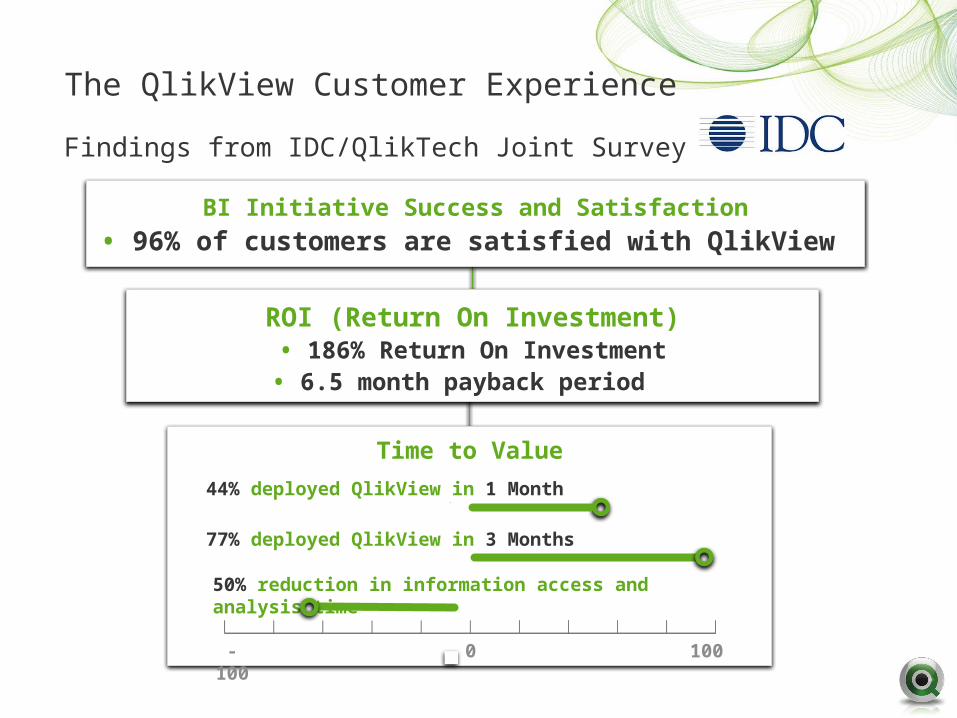
Findings from IDC/QlikTech Joint Survey
BI Initiative Success and Satisfaction
• 96% of customers are satisfied with QlikView
ROI (Return On Investment)• 186% Return On Investment• 6.5 month payback period
Time to Value
44% deployed QlikView in 1 Month
77% deployed QlikView in 3 Months
50% reduction in information access and analysis time
-100 0 100
The QlikView Customer Experience

QlikView: Number One in Ease of Use
*Gartner: BI Platforms User Survey, 2010
is #1 in: Ease of use
Scorekeeping to KPIs
Dashboard Satisfaction and Usage

QlikView: Number One in BI Customer Loyalty
*BARC: BI Survey 9, September 2010
is #1 in: Customer loyalty
Intention to buy more licenses
Query performance

Aberdeen: QlikView Dashboards Outperform Best-in-Class
• QlikView rates above Best-in-Class in dashboard accuracy
*Aberdeen: QlikView Customers Outperform the Best-in-Class with Dashboards, August 2010
Others
Best-in-Class
QlikView
$0.00 $20.00 $40.00
Others
Best-in-Class
QlikView
0% 20% 40% 60% 80%
% Driven by Line of Business UserYearly Dashboard Cost Per User
$22.41
$28.53
$35.58
62%
48%
41%

Global Enterprise Deployments

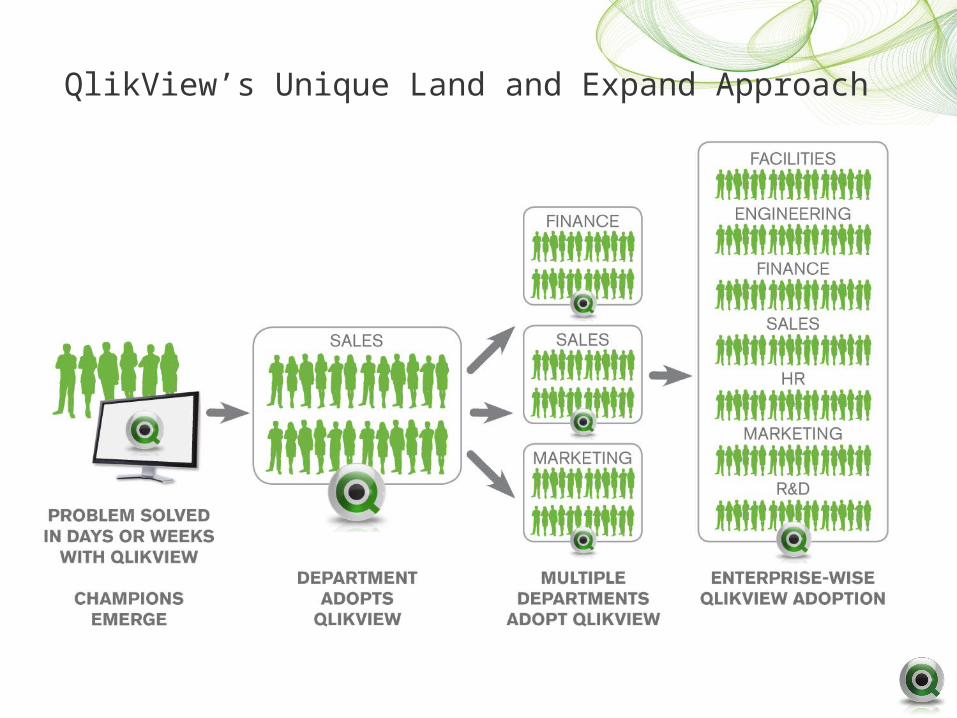
QlikView’s Unique Land and Expand Approach
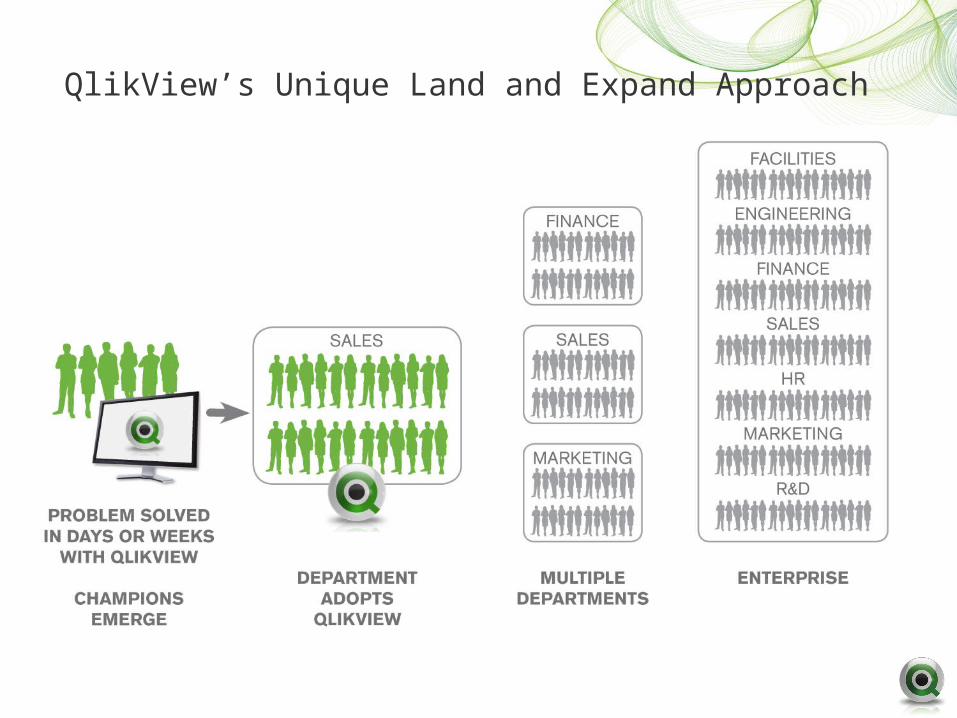
QlikView’s Unique Land and Expand Approach

QlikView’s Unique Land and Expand Approach
QlikView’s Unique Land and Expand Approach

QlikCommunity:Strength In Numbers
• Vibrant, thriving online global forum at community.qlikview.com
• Most-visited and active user community in the BI
• Tens of thousands of users
• Free apps and best practices
• Significant QlikView employee participation
QlikCommunityMembership Through July 2010
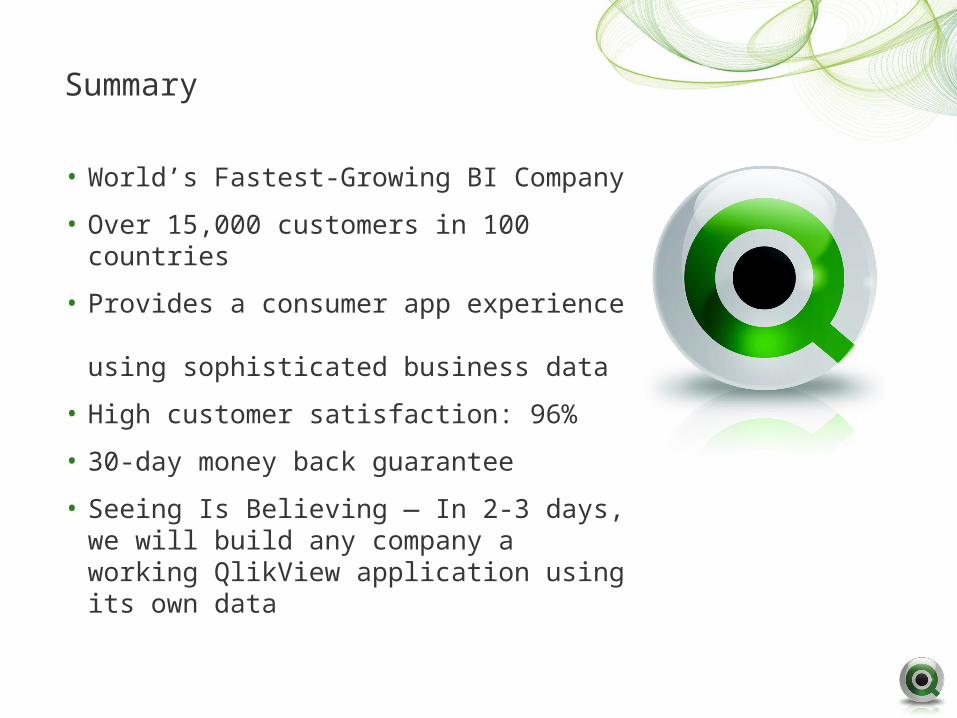
Summary
• World’s Fastest-Growing BI Company
• Over 15,000 customers in 100 countries
• Provides a consumer app experience using sophisticated business data
• High customer satisfaction: 96%
• 30-day money back guarantee
• Seeing Is Believing — In 2-3 days, we will build any company a working QlikView application using its own data
Appendix 1: What’s New in QlikView 10
• Easier to Use
• More Open and Extensible
• Faster Performance
• Enterprise Manageability

Easier to Use
• Groundbreaking advances in search
• New UI objects
• Usability for end-user and developers
MULTIPLEVIEWPOINTS
SIMPLEUSER EXPERIENCE
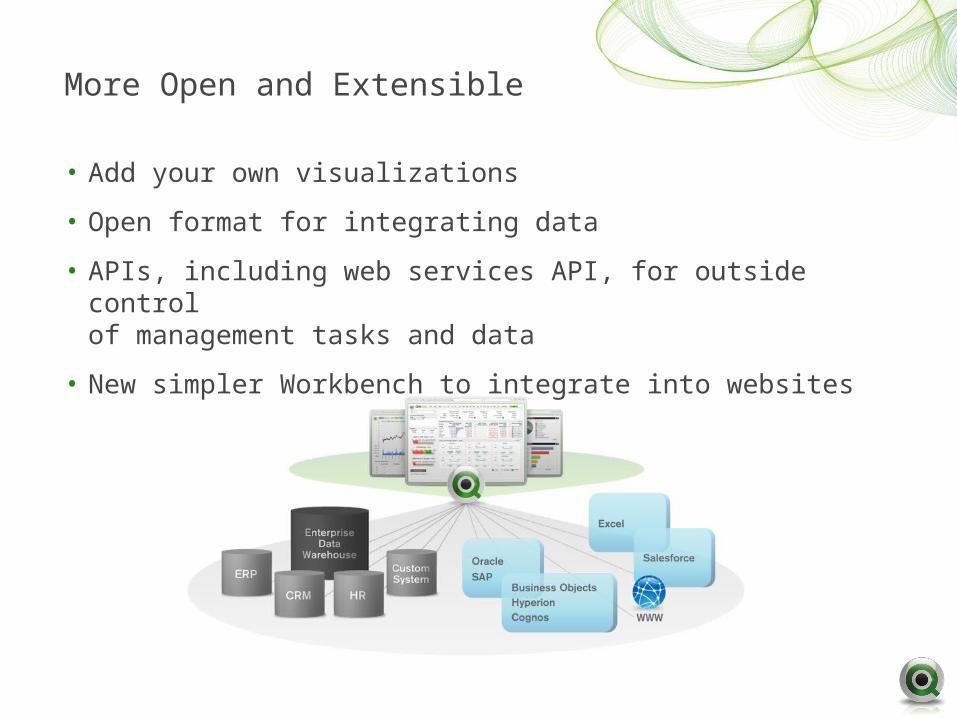
More Open and Extensible
• Add your own visualizations
• Open format for integrating data
• APIs, including web services API, for outside control of management tasks and data
• New simpler Workbench to integrate into websites

Faster Performance
• AJAX with C-client interactivity
• Reloads 2-10x faster on multi-core machines
• Core calculation enhancements
Multi-Core
Core
Core Core
Core Core
In-Memory
4000
3500
3000
2500
2000
1500
1000
500
100
Per
form
ance
Ind
ex(N
ocon
a =
100
)
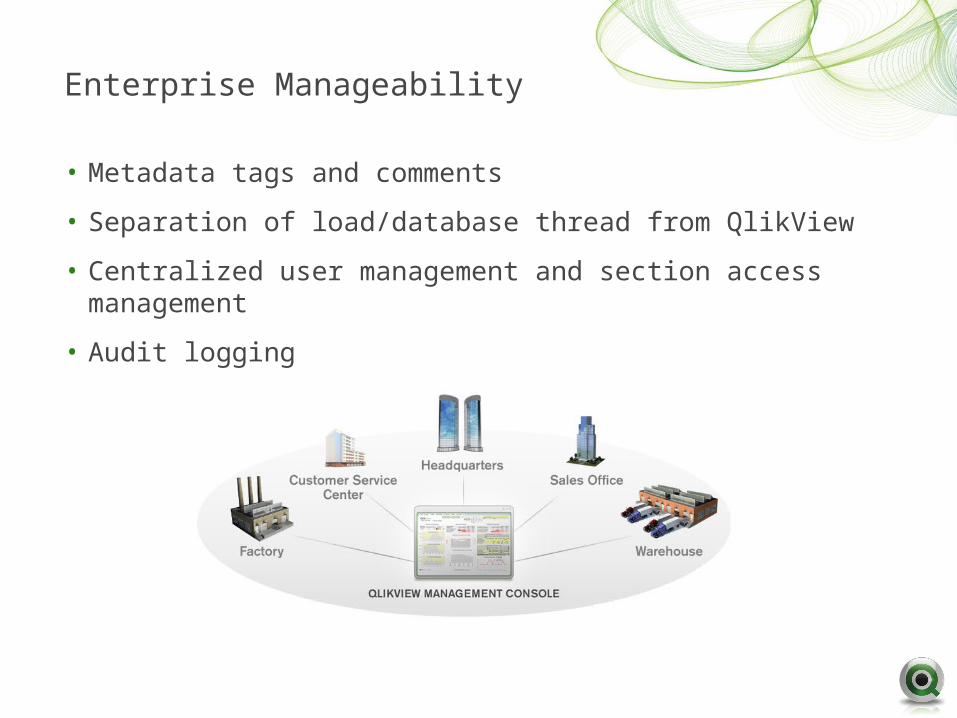
Enterprise Manageability
• Metadata tags and comments
• Separation of load/database thread from QlikView
• Centralized user management and section access management
• Audit logging
QlikView 10: Availability
• Available to all customers as a download through community.qlikview.com and QlikTech partner network
• QlikView Personal Edition also available as a download at www.qlikview.com
Appendix 2: Customer Case Studies/Template

U.S. health insurer covering 131,000 members in 14 states
Challenges
• Required performance trends and KPI analysis on 140 million subscriber and provider records
• Needed to integrate Oracle, SQL Server, Access, and Paradox data
Solution
Deployed QlikView for:
• Claims processing and provider reimbursement analysis
• Claims representative customer satisfaction tracking
Results
• Deployed in under two weeks
• Improved profitability through dramatic data accuracy improvements
• Increased customer satisfaction
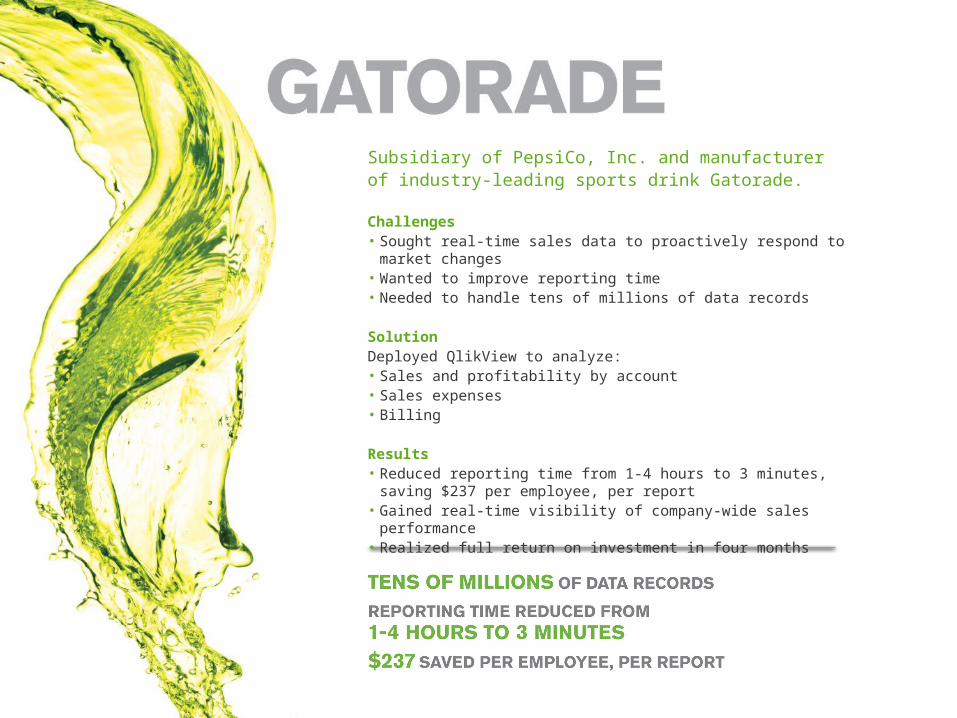
Subsidiary of PepsiCo, Inc. and manufacturerof industry-leading sports drink Gatorade.
Challenges• Sought real-time sales data to proactively respond to market changes• Wanted to improve reporting time• Needed to handle tens of millions of data records
SolutionDeployed QlikView to analyze:• Sales and profitability by account• Sales expenses• Billing
Results• Reduced reporting time from 1-4 hours to 3 minutes,
saving $237 per employee, per report• Gained real-time visibility of company-wide sales performance• Realized full return on investment in four months

Leading manufacturer of sheet fed offset printing machines for commercial and industrial customers.
Challenges• Couldn’t handle new reporting demands and ad hoc analysis• Needed complementary analysis capabilities for SAP BW data
SolutionDeployed more than 200 QlikView applications, including:• Sales analysis• Financial analysis• IT analysis
Results• Business users make better, more informed decisions through
flexible, ad hoc analysis on SAP BW data• Complete integration of SAP BW, Access, Excel, Navision,
and Sage data

The publicly-funded healthcare system of England, providing the majority of healthcare in the country.
Challenges• Needed to consolidate, visualize and analyze financial data across all
regional NHS hubs• Wanted to reduce contract spend throughout NHS supply chain
SolutionDeployed QlikView to regional hubs and financial personnel nationwide for:• Benefits reporting• Spend vs. cost analysis• Supplier and purchaser analysis• Organizational benchmarking analysis
Results• $66 million in procurement cost savings over two years• Improved regional hub performance through better data insight• Significant reduction in management time spent on reporting and analysis

Sub-title copy
Challenges
• Bullet copy
• Bullet copy
Solution
Deployed QlikView for:
• Bullet copy
• Bullet copy
Results
• Bullet copy
• Bullet copy
COMPANY NAME
DATA POINT DATA POINT COPY
Area for graphic

Appendix 3: In-Memory Technology vs. Traditional BI

QlikView’s Unique, In-Memory, Associative Technology
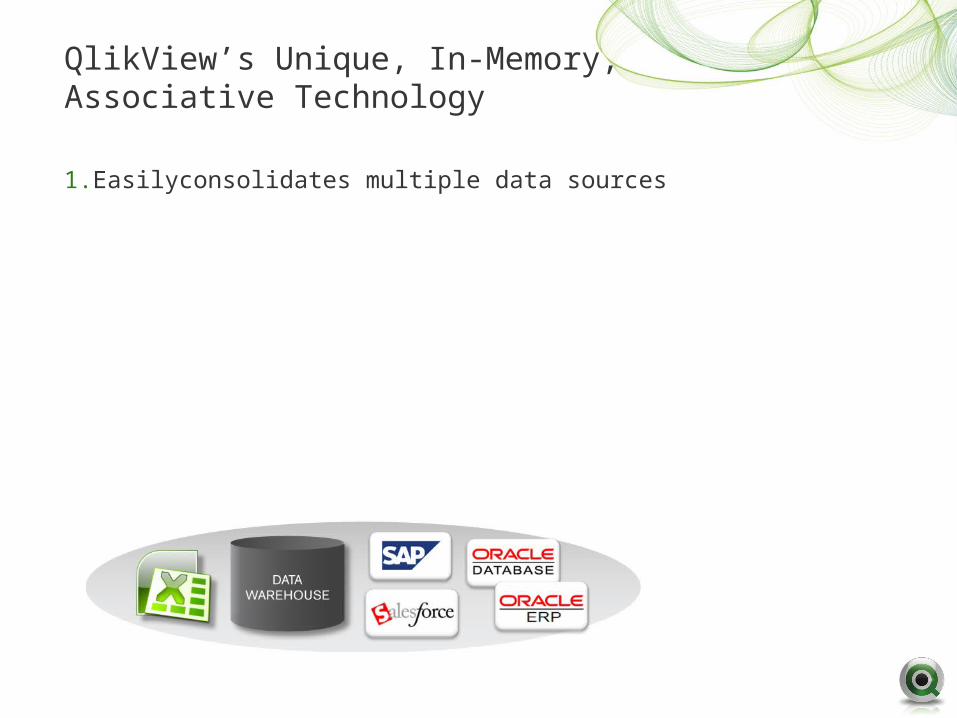
1. Easilyconsolidates multiple data sources
QlikView’s Unique, In-Memory, Associative Technology
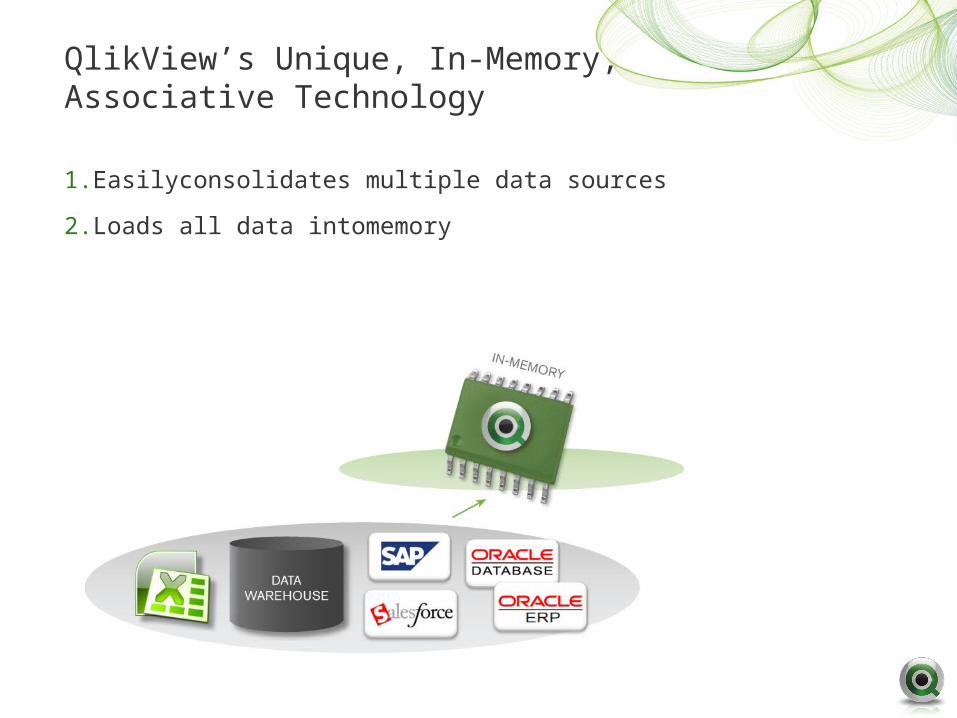
1. Easilyconsolidates multiple data sources
2. Loads all data intomemory
QlikView’s Unique, In-Memory, Associative Technology

1. Easilyconsolidates multiple data sources
2. Loads all data intomemory
3. Enablesreal-time associative search and analysis
QlikView’s Unique, In-Memory, Associative Technology

The Traditional BI Data Approach
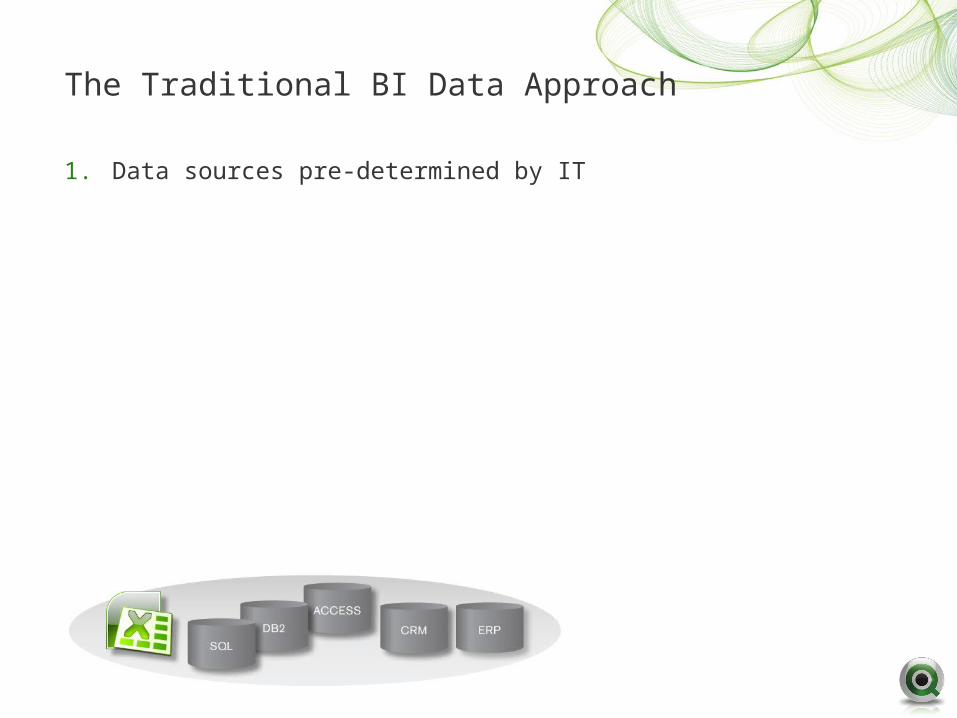
The Traditional BI Data Approach
1. Data sources pre-determined by IT

The Traditional BI Data Approach
1. Data sources pre-determined by IT
2. Data goes through ETL (Extract, Transform, Load) process

The Traditional BI Data Approach
1. Data sources pre-determined by IT
2. Data goes through ETL (Extract, Transform, Load) process
3. Data loaded into data warehouse and modeled intocubes
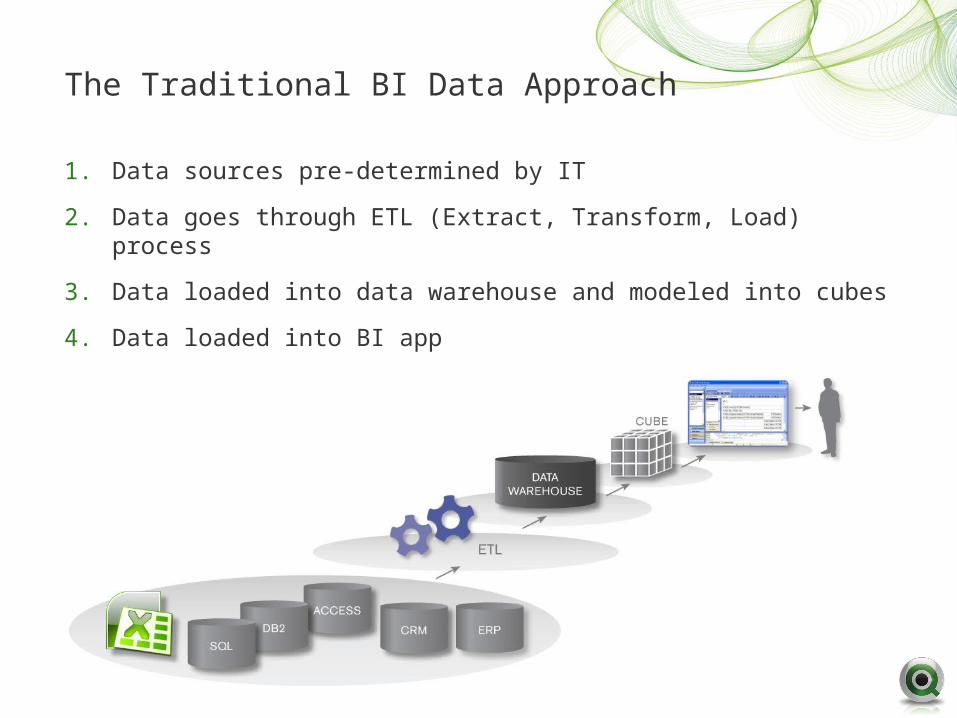
The Traditional BI Data Approach
1. Data sources pre-determined by IT
2. Data goes through ETL (Extract, Transform, Load) process
3. Data loaded into data warehouse and modeled into cubes
4. Data loaded into BI app
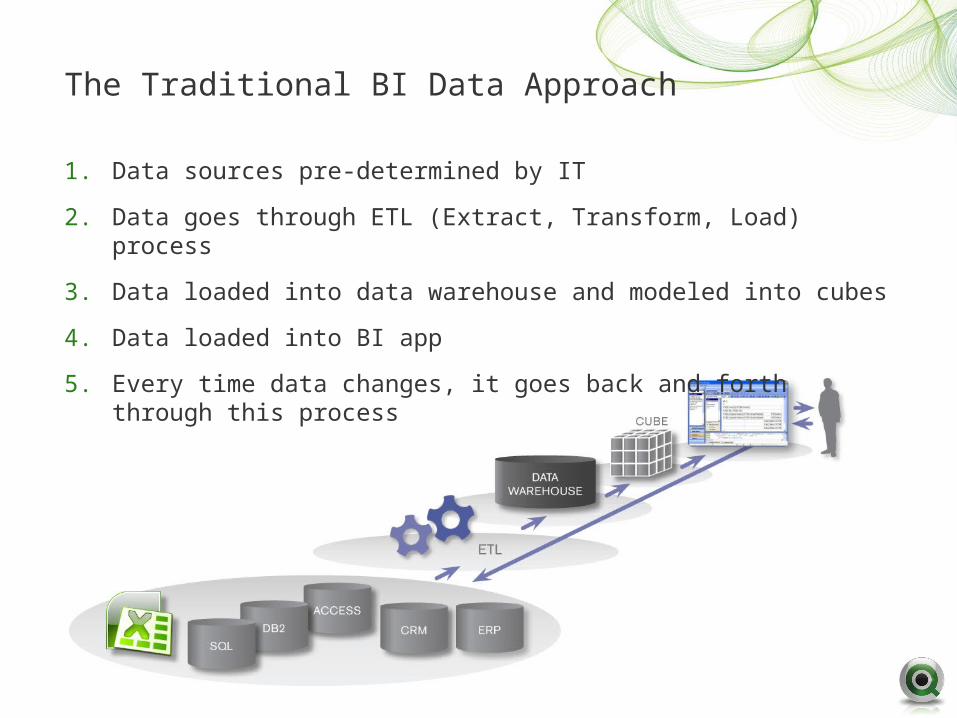
The Traditional BI Data Approach
1. Data sources pre-determined by IT
2. Data goes through ETL (Extract, Transform, Load) process
3. Data loaded into data warehouse and modeled into cubes
4. Data loaded into BI app
5. Every time data changes, it goes back and forth through this process
Appendix 4: Change Their World
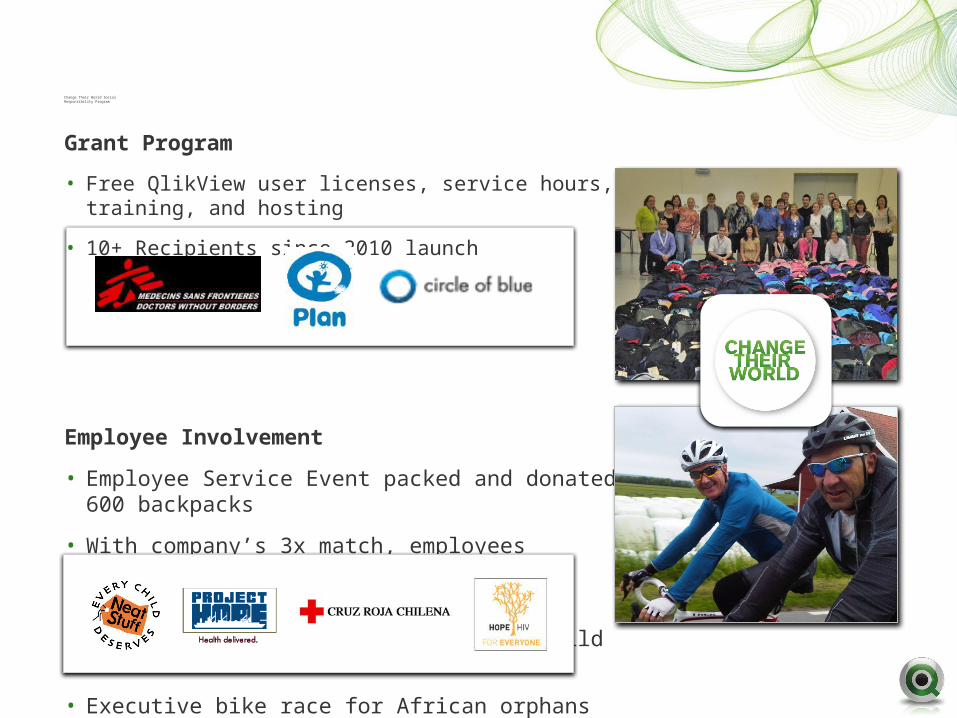
Change Their World Social Responsibility Program
Grant Program
• Free QlikView user licenses, service hours, training, and hosting
• 10+ Recipients since 2010 launch
Employee Involvement
• Employee Service Event packed and donated 600 backpacks
• With company’s 3x match, employees donated over $60,000 to Haiti Relief
• Latin American partners unite to rebuild Chile
• Executive bike race for African orphans
Thank you!


