22
Henrik Steen 8-13-2014 QlikView Full Browser User Manual User Manual
Henrik Steen 8-13-2014
QlikView Full Browser User Manual User Manual
CREATE DATE CHANGE DATE OWNER REVISION PAGE . 2014-08-13 2014-09-16 Henrik Steen 01 1
Endeavor AB, 411 18 GÖTEBORG, Norra Liden 2A +46 31 40 68 80, [email protected], www.endeavor.se
Table of Content
1 Introduction ............................................................................................................................................. 3
2 QlikView AccessPoint ........................................................................................................................... 3
3 Interface ..................................................................................................................................................... 3
3.1 Object .................................................................................................................................................. 4
3.2 Working with Objects ................................................................................................................... 4
3.3 Help ..................................................................................................................................................... 4
4 Tool Bars ................................................................................................................................................... 4
4.1 Navigation Toolbar ........................................................................................................................ 4
5 Sheet ............................................................................................................................................................ 5
6 Container ................................................................................................................................................... 5
7 Charts .......................................................................................................................................................... 6
8 Drill-down and Cyclic Groups (Dimensions) ............................................................................... 6
9 Cyclic Groups (Expressions) .............................................................................................................. 7
10 Selections .................................................................................................................................................. 7
10.1 Filters .................................................................................................................................................. 7
10.2 Right-click on Filters ..................................................................................................................... 8
10.3 Associative Search ......................................................................................................................... 9
10.4 Select in Chart .................................................................................................................................. 9
10.5 Search Object ................................................................................................................................ 10
11 Bookmarks ............................................................................................................................................. 10
11.1 Add Bookmark ............................................................................................................................. 10
11.2 Bookmark Administration ....................................................................................................... 11
12 Pivot Table ............................................................................................................................................. 12
12.1 Horizontal and Vertical Columns in a Pivot Table ......................................................... 12
12.2 Expand all/Collapse all in a Pivot Table ............................................................................. 14
13 Notes and Comments ......................................................................................................................... 14
14 Object Menu (Export Data, etc.) .................................................................................................... 14
14.1 Export Data .................................................................................................................................... 15
CREATE DATE CHANGE DATE OWNER REVISION PAGE . 2014-08-13 2014-09-16 Henrik Steen 01 2
Endeavor AB, 411 18 GÖTEBORG, Norra Liden 2A +46 31 40 68 80, [email protected], www.endeavor.se
14.2 Copy .................................................................................................................................................. 15
15 Chart Types ........................................................................................................................................... 15
15.1 Bar chart (incl. trellis chart) ................................................................................................... 15
15.2 Line chart ....................................................................................................................................... 16
15.3 Combo chart .................................................................................................................................. 16
15.4 Radar chart .................................................................................................................................... 17
15.5 Gauge chart .................................................................................................................................... 17
15.6 Scatter chart .................................................................................................................................. 17
15.7 Grid chart ....................................................................................................................................... 18
15.8 Pie chart .......................................................................................................................................... 18
15.9 Funnel chart .................................................................................................................................. 19
15.10 Block chart ..................................................................................................................................... 19
15.11 Straight table (incl. mini chart).............................................................................................. 19
15.12 Pivot table ...................................................................................................................................... 20
15.13 Mekko Chart .................................................................................................................................. 20
15.14 Container (contains several charts) .................................................................................... 20
15.15 List Box (with expressions) .................................................................................................... 21
CREATE DATE CHANGE DATE OWNER REVISION PAGE . 2014-08-13 2014-09-16 Henrik Steen 01 3
Endeavor AB, 411 18 GÖTEBORG, Norra Liden 2A +46 31 40 68 80, [email protected], www.endeavor.se
1 Introduction This document is a brief manual for QlikView Full Browser client, first and foremost written for
QlikView business users.
2 QlikView AccessPoint QlikView is accessed through a web browser (Internet Explorer, Chrome, Safari, etc.) or the QlikView
iOS application. The QlikView Plugin is only available for Internet Explorer, but the Ajax client is
available on all browser, including mobile devices.
The Full Browser client requires no installation on the client machine.
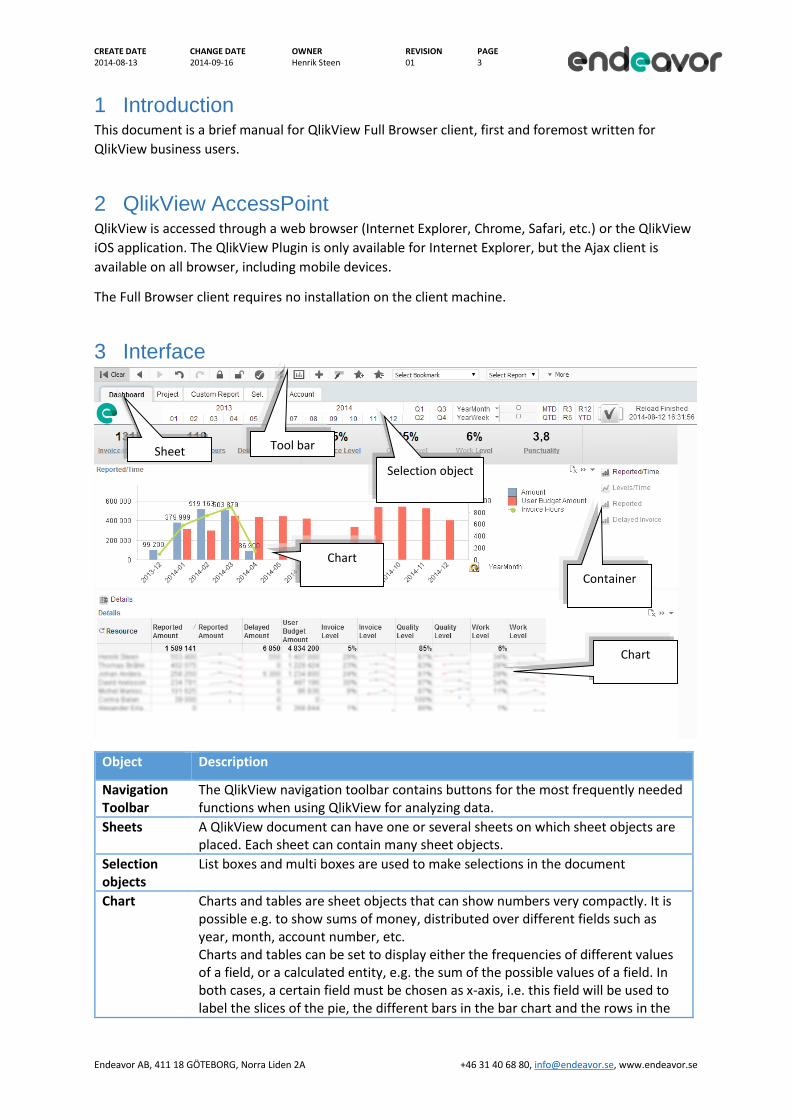
3 Interface
Object Description
Navigation Toolbar
The QlikView navigation toolbar contains buttons for the most frequently needed functions when using QlikView for analyzing data.
Sheets A QlikView document can have one or several sheets on which sheet objects are placed. Each sheet can contain many sheet objects.
Selection objects
List boxes and multi boxes are used to make selections in the document
Chart Charts and tables are sheet objects that can show numbers very compactly. It is possible e.g. to show sums of money, distributed over different fields such as year, month, account number, etc. Charts and tables can be set to display either the frequencies of different values of a field, or a calculated entity, e.g. the sum of the possible values of a field. In both cases, a certain field must be chosen as x-axis, i.e. this field will be used to label the slices of the pie, the different bars in the bar chart and the rows in the
Sheet Tool bar
Container
Selection object
Chart
Chart
CREATE DATE CHANGE DATE OWNER REVISION PAGE . 2014-08-13 2014-09-16 Henrik Steen 01 4
Endeavor AB, 411 18 GÖTEBORG, Norra Liden 2A +46 31 40 68 80, [email protected], www.endeavor.se
pivot table, respectively.
Container Containers can be used to group objects on the same sheet.
3.1 Object
Object is a central QlikView terms. Everything that’s visible on the sheet is an object.
List boxes, charts, icons and graphics are all objects, but different types of objects.
3.2 Working with Objects
Each object has a menu with commands, accessed by right-clicking the object. For some objects
there is more than one menu. The menu displayed depends on where in the object you right-click.
Right-click on the caption to access the standard object menu.
3.3 Help
QlikView has a built-in help where object descriptions can be found. Right-click an object and choose
“Help” to have a look at the specific help content.
4 Tool Bars There are several toolbars available in QlikView Plugin. The toolbars are shown in the top of the web
page. The user can add and remove toolbars. The most important toolbar is the navigation toolbar.
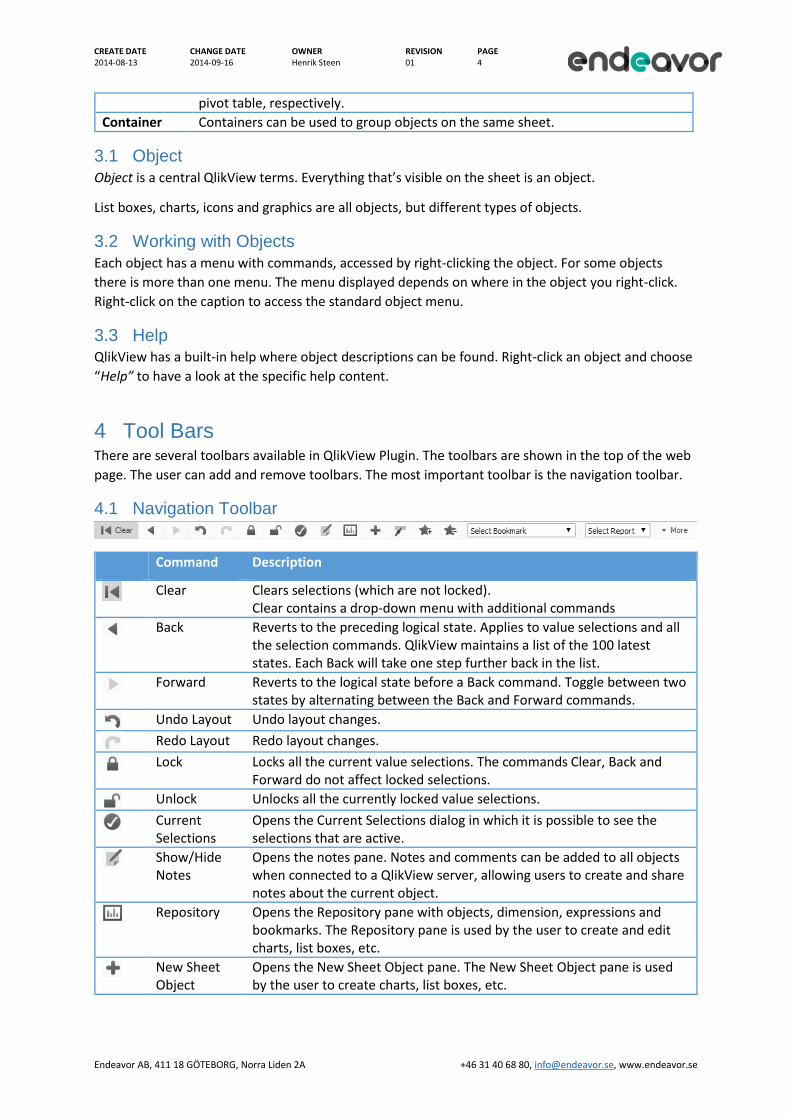
4.1 Navigation Toolbar
Command Description
Clear Clears selections (which are not locked). Clear contains a drop-down menu with additional commands
Back Reverts to the preceding logical state. Applies to value selections and all the selection commands. QlikView maintains a list of the 100 latest states. Each Back will take one step further back in the list.
Forward Reverts to the logical state before a Back command. Toggle between two states by alternating between the Back and Forward commands.
Undo Layout Undo layout changes.
Redo Layout Redo layout changes.
Lock Locks all the current value selections. The commands Clear, Back and Forward do not affect locked selections.
Unlock Unlocks all the currently locked value selections.
Current Selections
Opens the Current Selections dialog in which it is possible to see the selections that are active.
Show/Hide Notes
Opens the notes pane. Notes and comments can be added to all objects when connected to a QlikView server, allowing users to create and share notes about the current object.
Repository Opens the Repository pane with objects, dimension, expressions and bookmarks. The Repository pane is used by the user to create and edit charts, list boxes, etc.
New Sheet Object
Opens the New Sheet Object pane. The New Sheet Object pane is used by the user to create charts, list boxes, etc.
CREATE DATE CHANGE DATE OWNER REVISION PAGE . 2014-08-13 2014-09-16 Henrik Steen 01 5
Endeavor AB, 411 18 GÖTEBORG, Norra Liden 2A +46 31 40 68 80, [email protected], www.endeavor.se
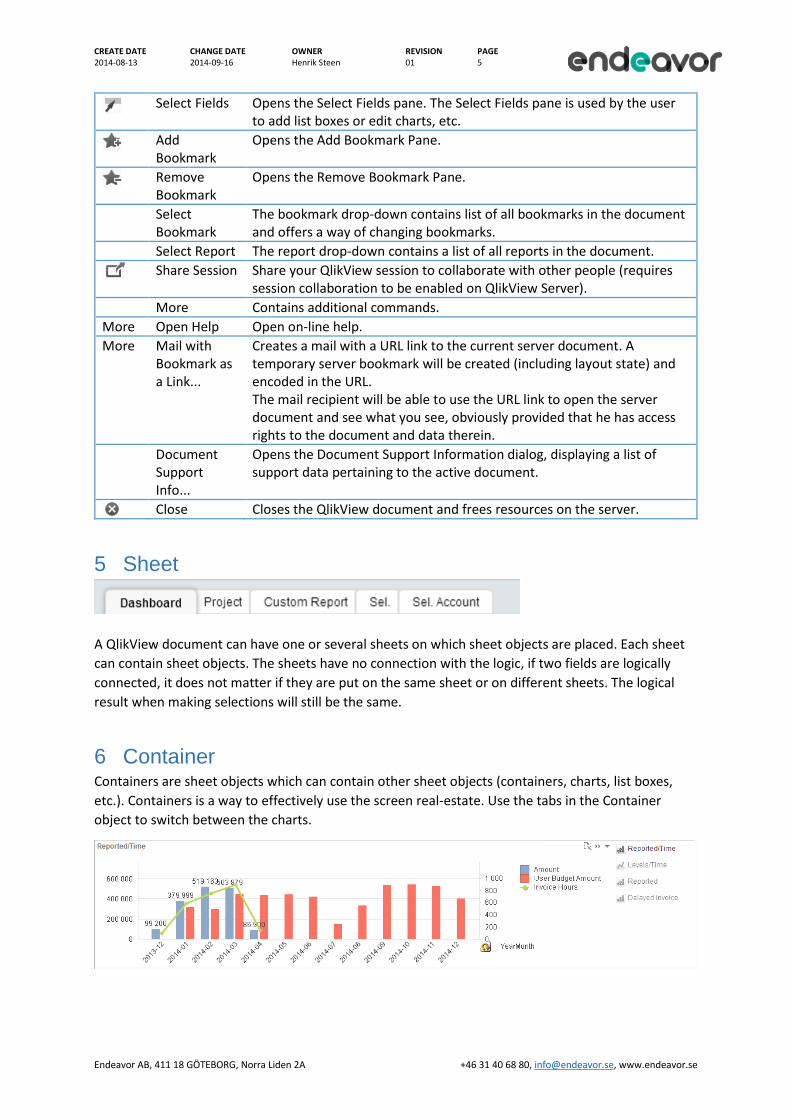
Select Fields Opens the Select Fields pane. The Select Fields pane is used by the user to add list boxes or edit charts, etc.
Add Bookmark
Opens the Add Bookmark Pane.
Remove Bookmark
Opens the Remove Bookmark Pane.
Select Bookmark
The bookmark drop-down contains list of all bookmarks in the document and offers a way of changing bookmarks.
Select Report The report drop-down contains a list of all reports in the document.
Share Session Share your QlikView session to collaborate with other people (requires session collaboration to be enabled on QlikView Server).
More Contains additional commands.
More Open Help Open on-line help.
More Mail with Bookmark as a Link...
Creates a mail with a URL link to the current server document. A temporary server bookmark will be created (including layout state) and encoded in the URL. The mail recipient will be able to use the URL link to open the server document and see what you see, obviously provided that he has access rights to the document and data therein.
Document Support Info...
Opens the Document Support Information dialog, displaying a list of support data pertaining to the active document.
Close Closes the QlikView document and frees resources on the server.
5 Sheet
A QlikView document can have one or several sheets on which sheet objects are placed. Each sheet
can contain sheet objects. The sheets have no connection with the logic, if two fields are logically
connected, it does not matter if they are put on the same sheet or on different sheets. The logical
result when making selections will still be the same.
6 Container Containers are sheet objects which can contain other sheet objects (containers, charts, list boxes,
etc.). Containers is a way to effectively use the screen real-estate. Use the tabs in the Container
object to switch between the charts.
CREATE DATE CHANGE DATE OWNER REVISION PAGE . 2014-08-13 2014-09-16 Henrik Steen 01 6
Endeavor AB, 411 18 GÖTEBORG, Norra Liden 2A +46 31 40 68 80, [email protected], www.endeavor.se
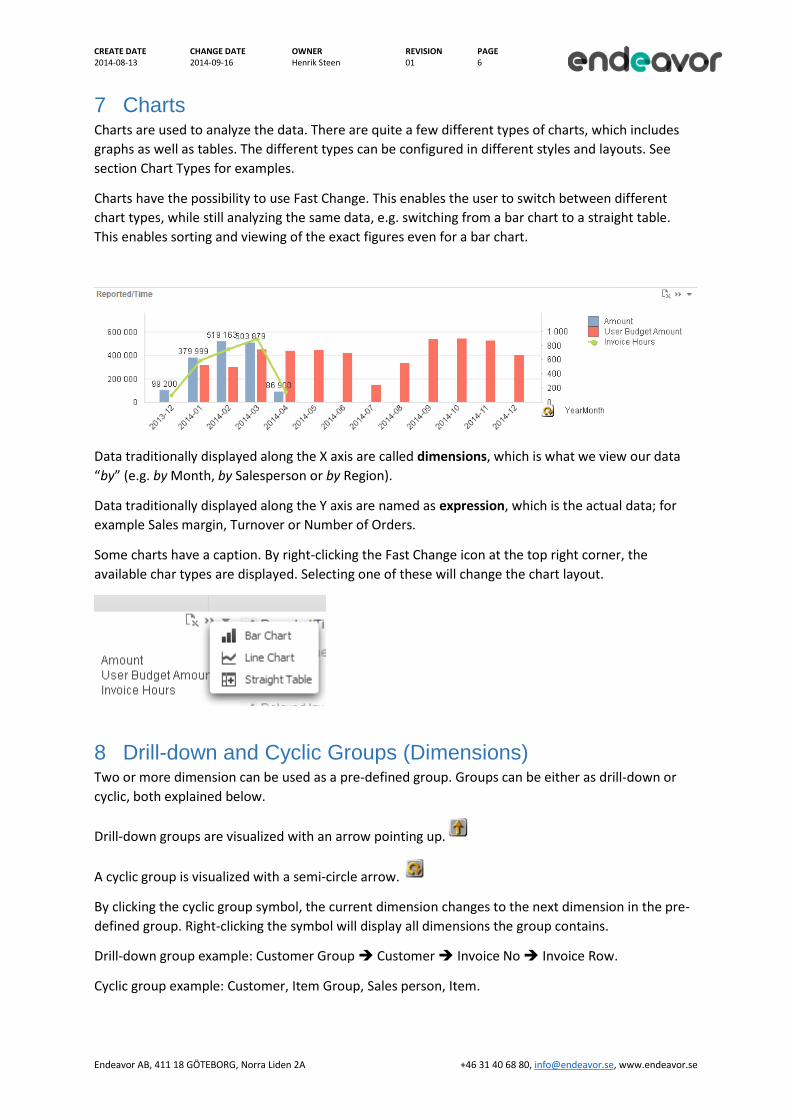
7 Charts Charts are used to analyze the data. There are quite a few different types of charts, which includes
graphs as well as tables. The different types can be configured in different styles and layouts. See
section Chart Types for examples.
Charts have the possibility to use Fast Change. This enables the user to switch between different
chart types, while still analyzing the same data, e.g. switching from a bar chart to a straight table.
This enables sorting and viewing of the exact figures even for a bar chart.
Data traditionally displayed along the X axis are called dimensions, which is what we view our data
“by” (e.g. by Month, by Salesperson or by Region).
Data traditionally displayed along the Y axis are named as expression, which is the actual data; for
example Sales margin, Turnover or Number of Orders.
Some charts have a caption. By right-clicking the Fast Change icon at the top right corner, the
available char types are displayed. Selecting one of these will change the chart layout.
8 Drill-down and Cyclic Groups (Dimensions) Two or more dimension can be used as a pre-defined group. Groups can be either as drill-down or
cyclic, both explained below.
Drill-down groups are visualized with an arrow pointing up.
A cyclic group is visualized with a semi-circle arrow.
By clicking the cyclic group symbol, the current dimension changes to the next dimension in the pre-
defined group. Right-clicking the symbol will display all dimensions the group contains.
Drill-down group example: Customer Group Customer Invoice No Invoice Row.
Cyclic group example: Customer, Item Group, Sales person, Item.
CREATE DATE CHANGE DATE OWNER REVISION PAGE . 2014-08-13 2014-09-16 Henrik Steen 01 7
Endeavor AB, 411 18 GÖTEBORG, Norra Liden 2A +46 31 40 68 80, [email protected], www.endeavor.se
A drill-down enables a logic drill through the data as a hierarchy, while the cyclic group enables a
large variety of dimension but the same expression(s) instead of creating multiple objects.
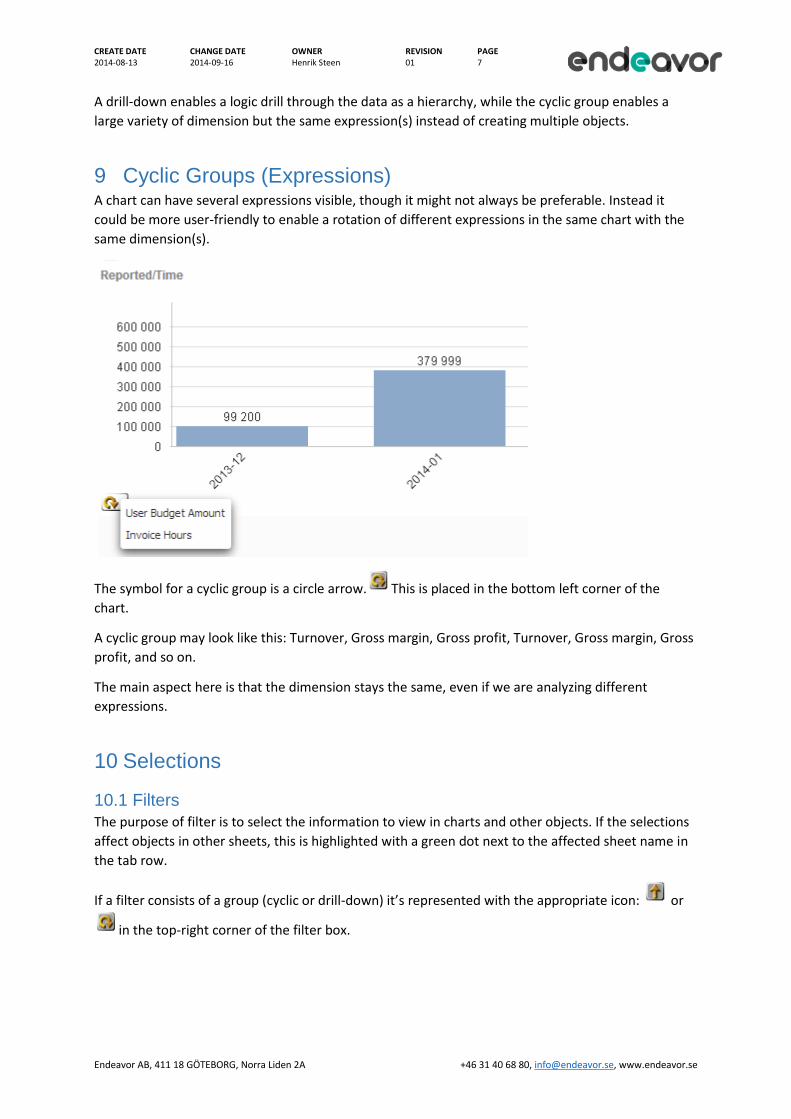
9 Cyclic Groups (Expressions) A chart can have several expressions visible, though it might not always be preferable. Instead it
could be more user-friendly to enable a rotation of different expressions in the same chart with the
same dimension(s).
The symbol for a cyclic group is a circle arrow. This is placed in the bottom left corner of the
chart.
A cyclic group may look like this: Turnover, Gross margin, Gross profit, Turnover, Gross margin, Gross
profit, and so on.
The main aspect here is that the dimension stays the same, even if we are analyzing different
expressions.
10 Selections
10.1 Filters
The purpose of filter is to select the information to view in charts and other objects. If the selections
affect objects in other sheets, this is highlighted with a green dot next to the affected sheet name in
the tab row.
If a filter consists of a group (cyclic or drill-down) it’s represented with the appropriate icon: or
in the top-right corner of the filter box.
CREATE DATE CHANGE DATE OWNER REVISION PAGE . 2014-08-13 2014-09-16 Henrik Steen 01 8
Endeavor AB, 411 18 GÖTEBORG, Norra Liden 2A +46 31 40 68 80, [email protected], www.endeavor.se
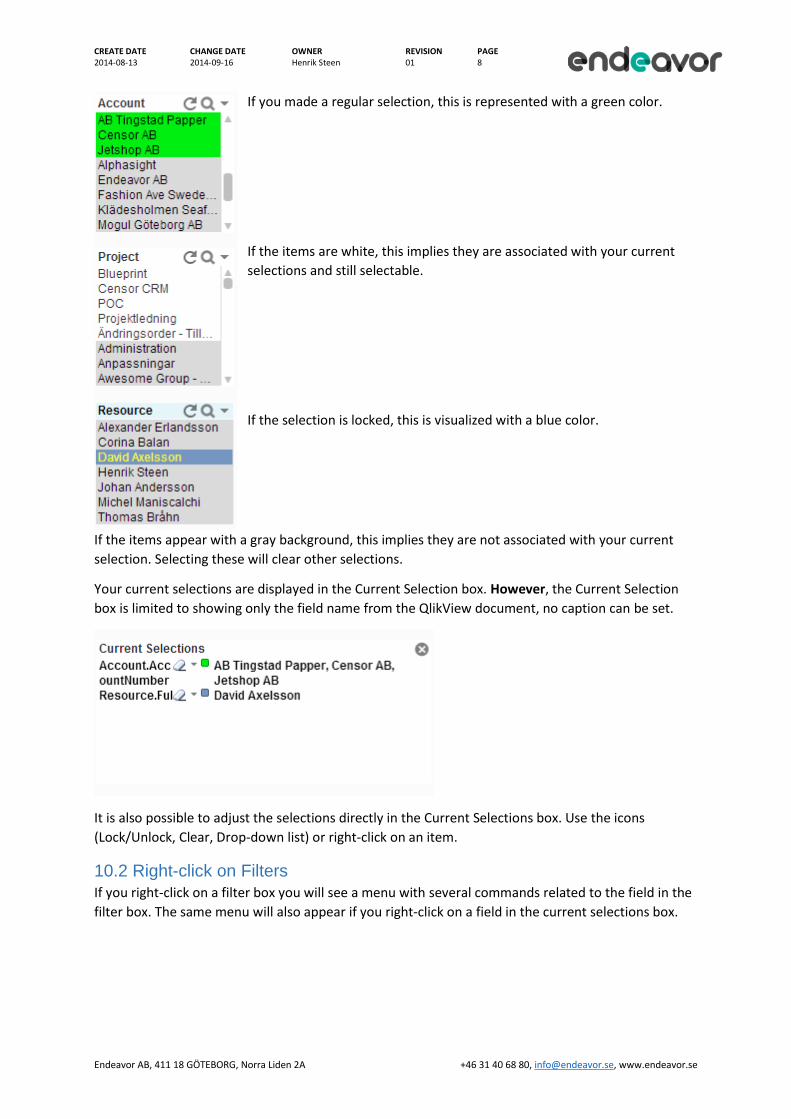
If you made a regular selection, this is represented with a green color.
If the items are white, this implies they are associated with your current
selections and still selectable.
If the selection is locked, this is visualized with a blue color.
If the items appear with a gray background, this implies they are not associated with your current
selection. Selecting these will clear other selections.
Your current selections are displayed in the Current Selection box. However, the Current Selection
box is limited to showing only the field name from the QlikView document, no caption can be set.
It is also possible to adjust the selections directly in the Current Selections box. Use the icons
(Lock/Unlock, Clear, Drop-down list) or right-click on an item.
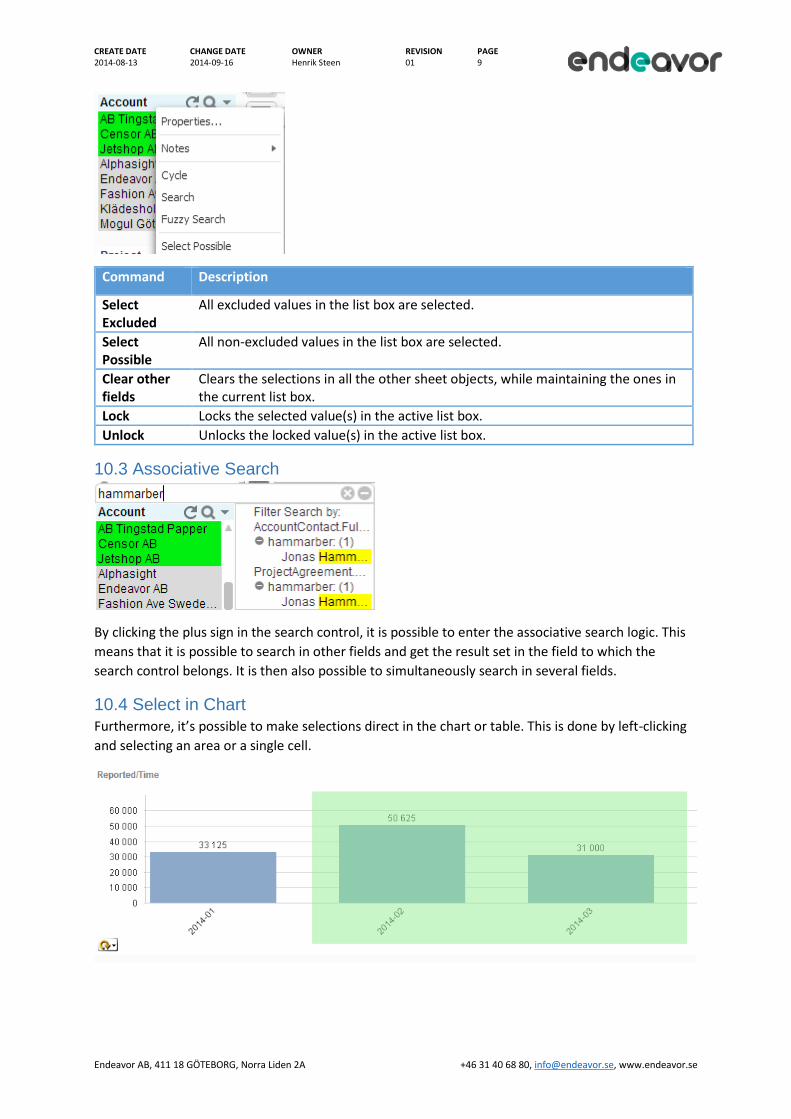
10.2 Right-click on Filters
If you right-click on a filter box you will see a menu with several commands related to the field in the
filter box. The same menu will also appear if you right-click on a field in the current selections box.
CREATE DATE CHANGE DATE OWNER REVISION PAGE . 2014-08-13 2014-09-16 Henrik Steen 01 9
Endeavor AB, 411 18 GÖTEBORG, Norra Liden 2A +46 31 40 68 80, [email protected], www.endeavor.se
Command Description
Select Excluded
All excluded values in the list box are selected.
Select Possible
All non-excluded values in the list box are selected.
Clear other fields
Clears the selections in all the other sheet objects, while maintaining the ones in the current list box.
Lock Locks the selected value(s) in the active list box.
Unlock Unlocks the locked value(s) in the active list box.
10.3 Associative Search
By clicking the plus sign in the search control, it is possible to enter the associative search logic. This
means that it is possible to search in other fields and get the result set in the field to which the
search control belongs. It is then also possible to simultaneously search in several fields.
10.4 Select in Chart
Furthermore, it’s possible to make selections direct in the chart or table. This is done by left-clicking
and selecting an area or a single cell.
CREATE DATE CHANGE DATE OWNER REVISION PAGE . 2014-08-13 2014-09-16 Henrik Steen 01 10
Endeavor AB, 411 18 GÖTEBORG, Norra Liden 2A +46 31 40 68 80, [email protected], www.endeavor.se
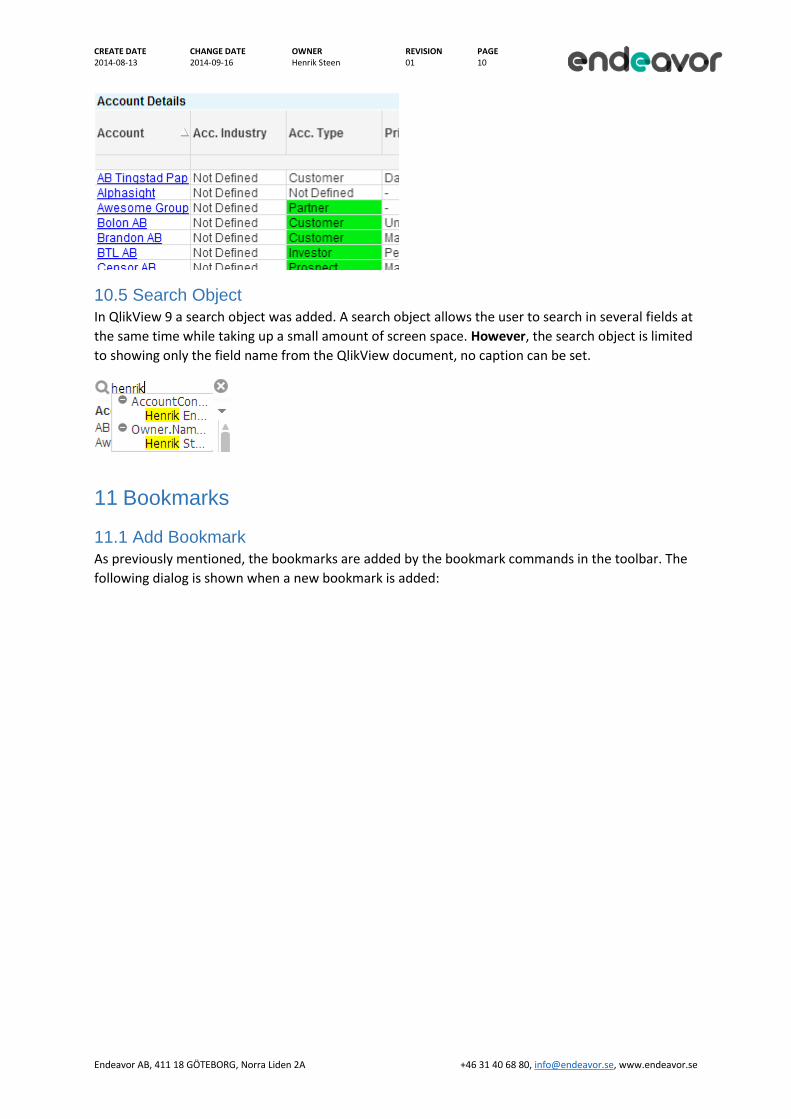
10.5 Search Object
In QlikView 9 a search object was added. A search object allows the user to search in several fields at
the same time while taking up a small amount of screen space. However, the search object is limited
to showing only the field name from the QlikView document, no caption can be set.
11 Bookmarks
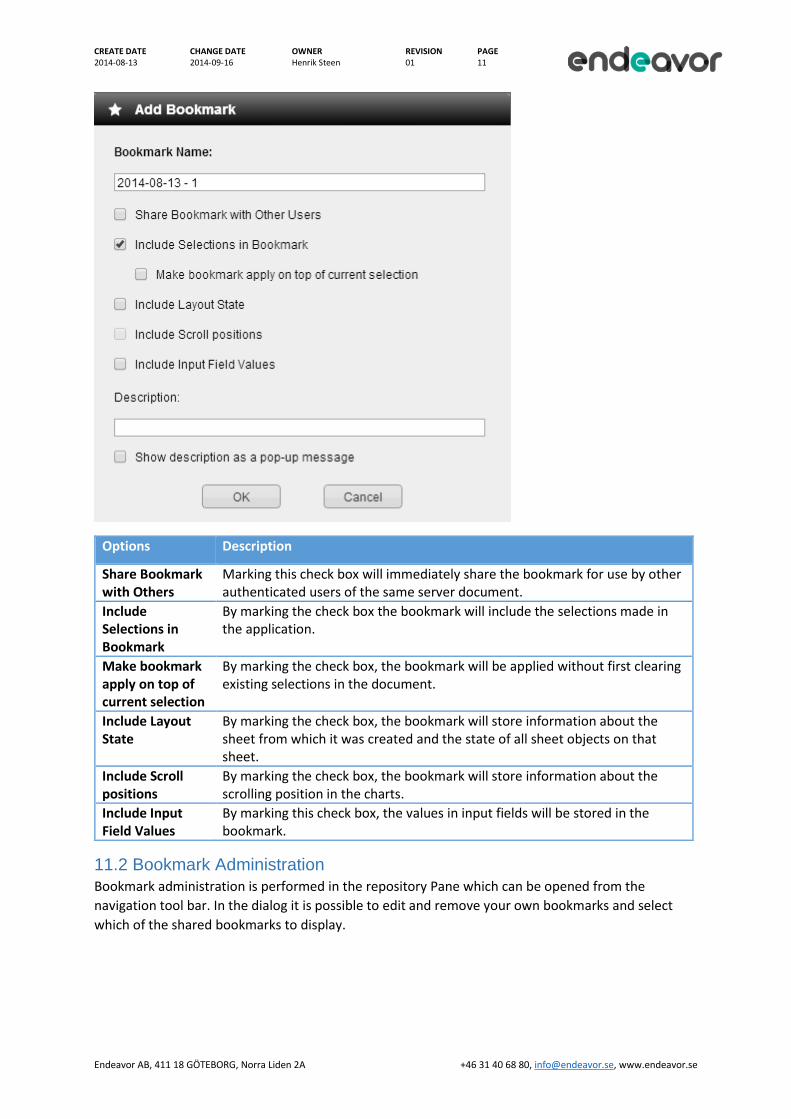
11.1 Add Bookmark
As previously mentioned, the bookmarks are added by the bookmark commands in the toolbar. The
following dialog is shown when a new bookmark is added:
CREATE DATE CHANGE DATE OWNER REVISION PAGE . 2014-08-13 2014-09-16 Henrik Steen 01 11
Endeavor AB, 411 18 GÖTEBORG, Norra Liden 2A +46 31 40 68 80, [email protected], www.endeavor.se
Options Description
Share Bookmark with Others
Marking this check box will immediately share the bookmark for use by other authenticated users of the same server document.
Include Selections in Bookmark
By marking the check box the bookmark will include the selections made in the application.
Make bookmark apply on top of current selection
By marking the check box, the bookmark will be applied without first clearing existing selections in the document.
Include Layout State
By marking the check box, the bookmark will store information about the sheet from which it was created and the state of all sheet objects on that sheet.
Include Scroll positions
By marking the check box, the bookmark will store information about the scrolling position in the charts.
Include Input Field Values
By marking this check box, the values in input fields will be stored in the bookmark.
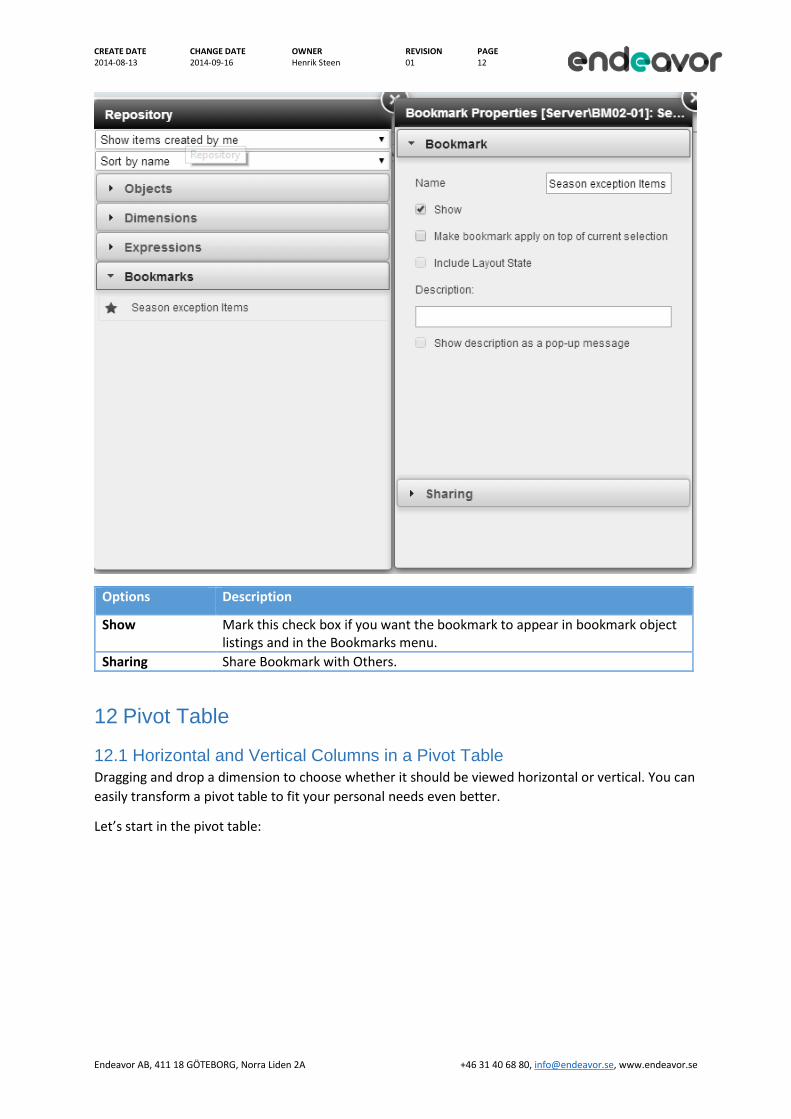
11.2 Bookmark Administration
Bookmark administration is performed in the repository Pane which can be opened from the
navigation tool bar. In the dialog it is possible to edit and remove your own bookmarks and select
which of the shared bookmarks to display.
CREATE DATE CHANGE DATE OWNER REVISION PAGE . 2014-08-13 2014-09-16 Henrik Steen 01 12
Endeavor AB, 411 18 GÖTEBORG, Norra Liden 2A +46 31 40 68 80, [email protected], www.endeavor.se
Options Description
Show Mark this check box if you want the bookmark to appear in bookmark object listings and in the Bookmarks menu.
Sharing Share Bookmark with Others.
12 Pivot Table
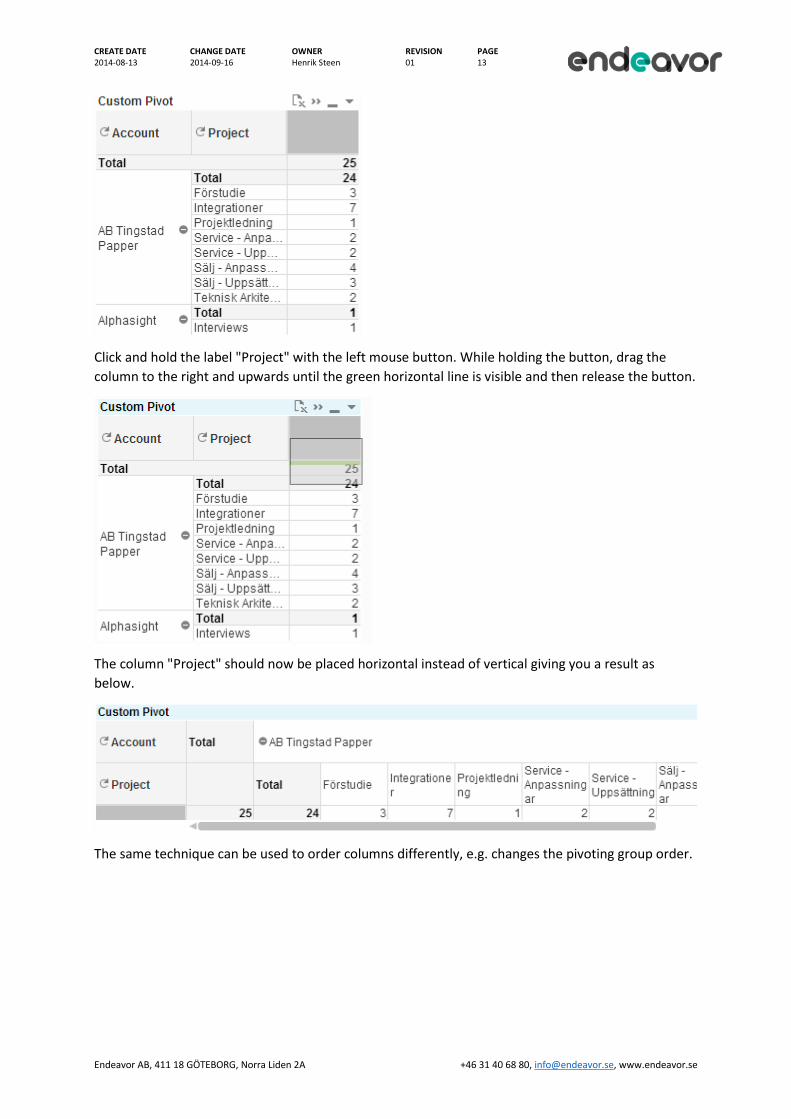
12.1 Horizontal and Vertical Columns in a Pivot Table
Dragging and drop a dimension to choose whether it should be viewed horizontal or vertical. You can
easily transform a pivot table to fit your personal needs even better.
Let’s start in the pivot table:
CREATE DATE CHANGE DATE OWNER REVISION PAGE . 2014-08-13 2014-09-16 Henrik Steen 01 13
Endeavor AB, 411 18 GÖTEBORG, Norra Liden 2A +46 31 40 68 80, [email protected], www.endeavor.se
Click and hold the label "Project" with the left mouse button. While holding the button, drag the
column to the right and upwards until the green horizontal line is visible and then release the button.
The column "Project" should now be placed horizontal instead of vertical giving you a result as
below.
The same technique can be used to order columns differently, e.g. changes the pivoting group order.
CREATE DATE CHANGE DATE OWNER REVISION PAGE . 2014-08-13 2014-09-16 Henrik Steen 01 14
Endeavor AB, 411 18 GÖTEBORG, Norra Liden 2A +46 31 40 68 80, [email protected], www.endeavor.se
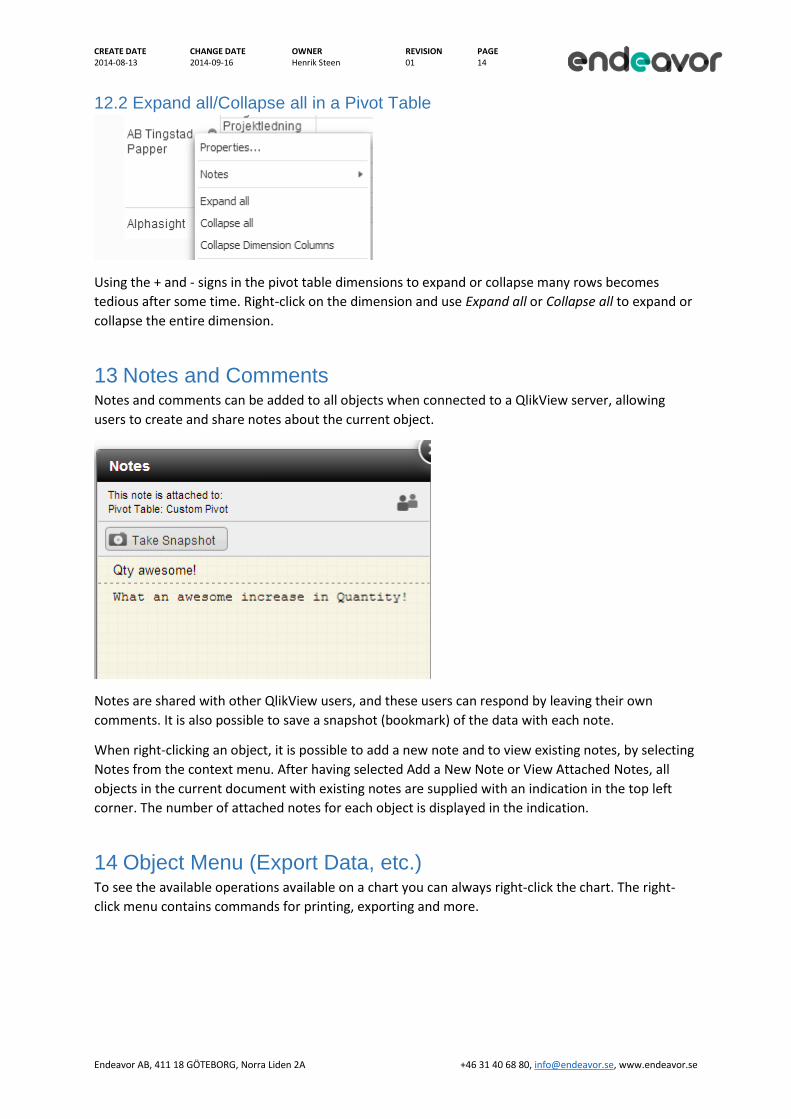
12.2 Expand all/Collapse all in a Pivot Table
Using the + and - signs in the pivot table dimensions to expand or collapse many rows becomes
tedious after some time. Right-click on the dimension and use Expand all or Collapse all to expand or
collapse the entire dimension.
13 Notes and Comments Notes and comments can be added to all objects when connected to a QlikView server, allowing
users to create and share notes about the current object.
Notes are shared with other QlikView users, and these users can respond by leaving their own
comments. It is also possible to save a snapshot (bookmark) of the data with each note.
When right-clicking an object, it is possible to add a new note and to view existing notes, by selecting
Notes from the context menu. After having selected Add a New Note or View Attached Notes, all
objects in the current document with existing notes are supplied with an indication in the top left
corner. The number of attached notes for each object is displayed in the indication.
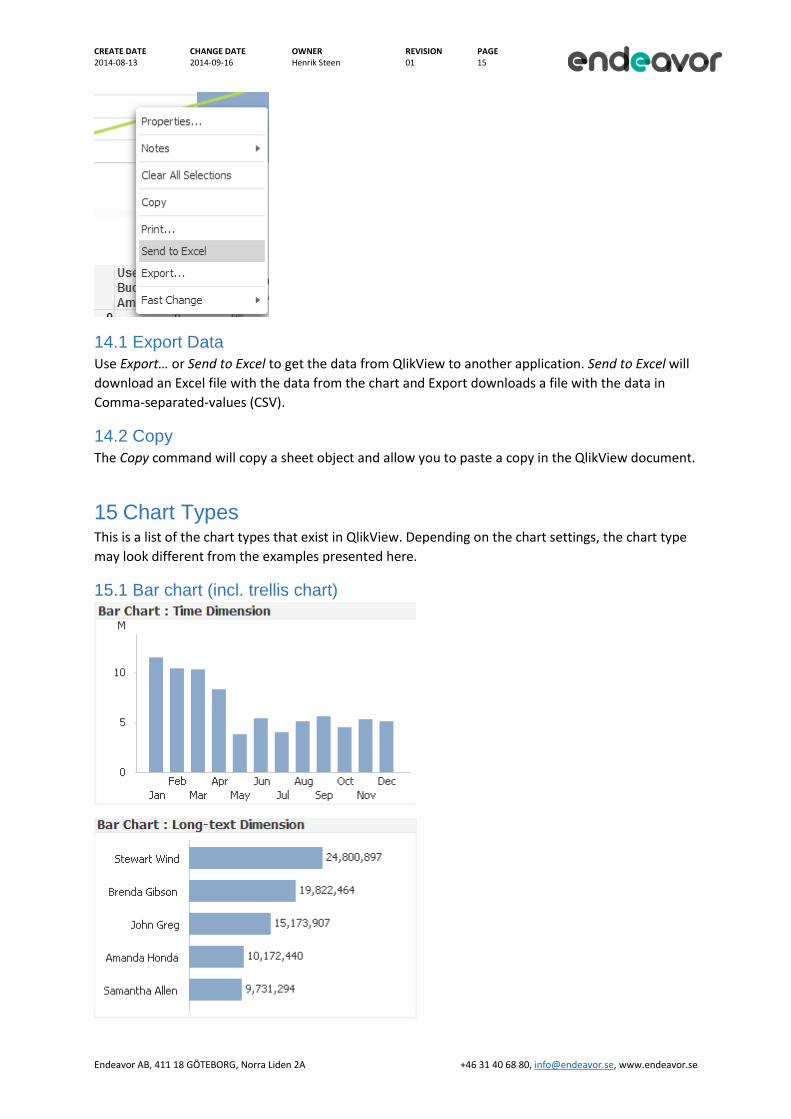
14 Object Menu (Export Data, etc.) To see the available operations available on a chart you can always right-click the chart. The right-
click menu contains commands for printing, exporting and more.
CREATE DATE CHANGE DATE OWNER REVISION PAGE . 2014-08-13 2014-09-16 Henrik Steen 01 15
Endeavor AB, 411 18 GÖTEBORG, Norra Liden 2A +46 31 40 68 80, [email protected], www.endeavor.se
14.1 Export Data
Use Export… or Send to Excel to get the data from QlikView to another application. Send to Excel will
download an Excel file with the data from the chart and Export downloads a file with the data in
Comma-separated-values (CSV).
14.2 Copy
The Copy command will copy a sheet object and allow you to paste a copy in the QlikView document.
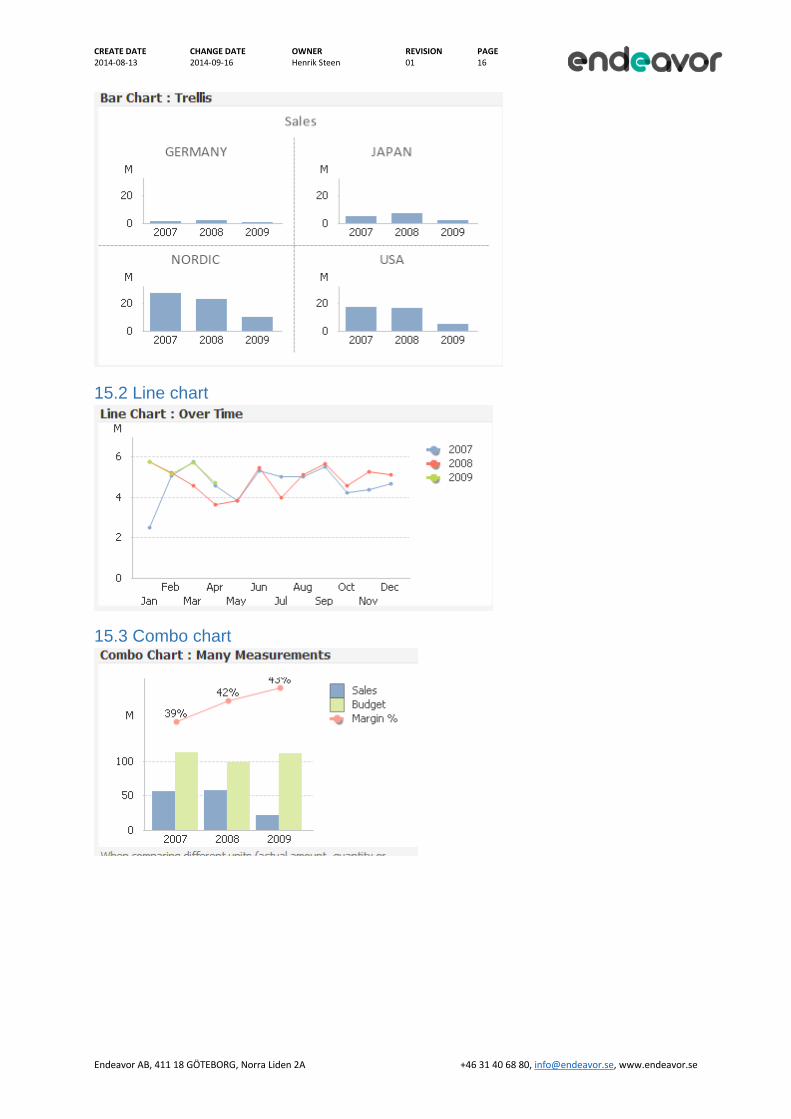
15 Chart Types This is a list of the chart types that exist in QlikView. Depending on the chart settings, the chart type
may look different from the examples presented here.
15.1 Bar chart (incl. trellis chart)
CREATE DATE CHANGE DATE OWNER REVISION PAGE . 2014-08-13 2014-09-16 Henrik Steen 01 16
Endeavor AB, 411 18 GÖTEBORG, Norra Liden 2A +46 31 40 68 80, [email protected], www.endeavor.se
15.2 Line chart
15.3 Combo chart
CREATE DATE CHANGE DATE OWNER REVISION PAGE . 2014-08-13 2014-09-16 Henrik Steen 01 17
Endeavor AB, 411 18 GÖTEBORG, Norra Liden 2A +46 31 40 68 80, [email protected], www.endeavor.se
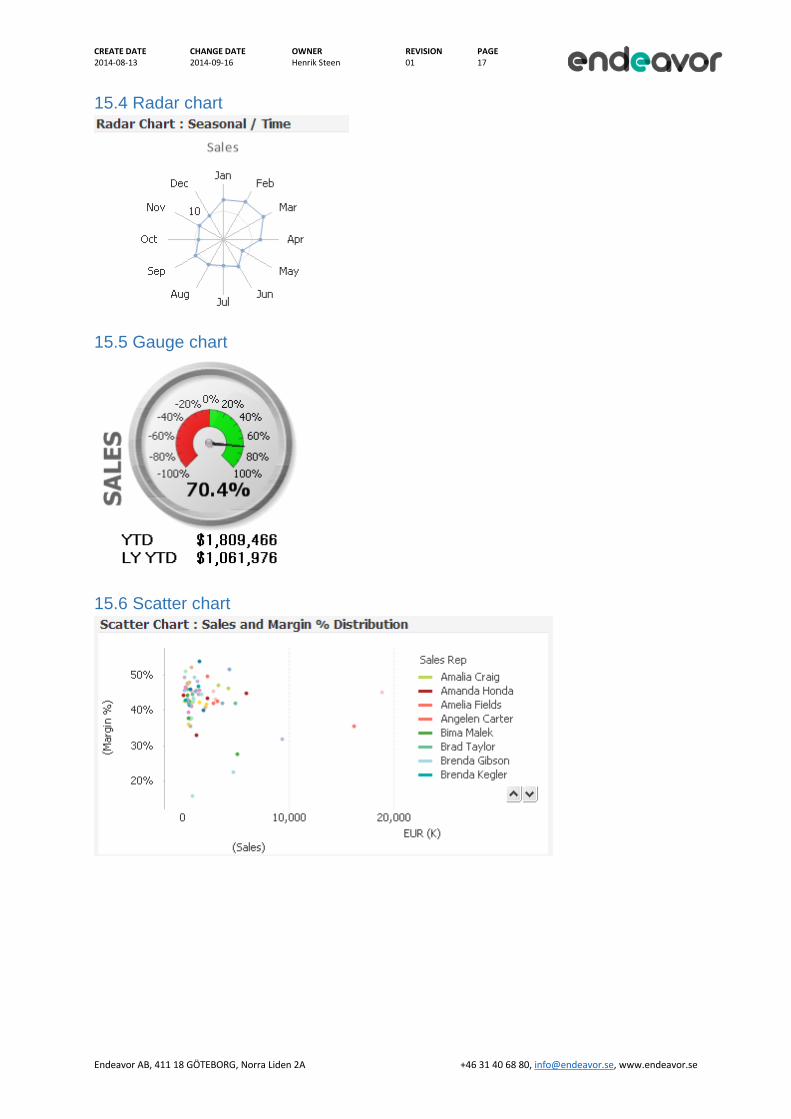
15.4 Radar chart
15.5 Gauge chart
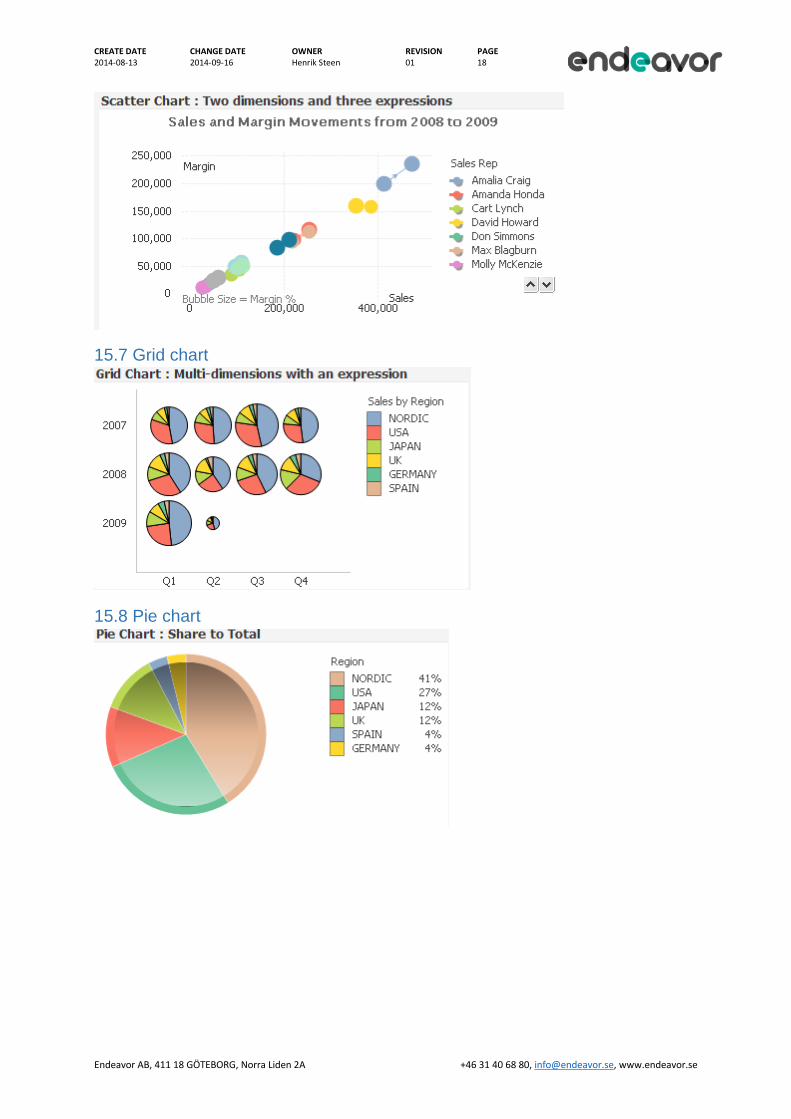
15.6 Scatter chart
CREATE DATE CHANGE DATE OWNER REVISION PAGE . 2014-08-13 2014-09-16 Henrik Steen 01 18
Endeavor AB, 411 18 GÖTEBORG, Norra Liden 2A +46 31 40 68 80, [email protected], www.endeavor.se
15.7 Grid chart
15.8 Pie chart
CREATE DATE CHANGE DATE OWNER REVISION PAGE . 2014-08-13 2014-09-16 Henrik Steen 01 19
Endeavor AB, 411 18 GÖTEBORG, Norra Liden 2A +46 31 40 68 80, [email protected], www.endeavor.se
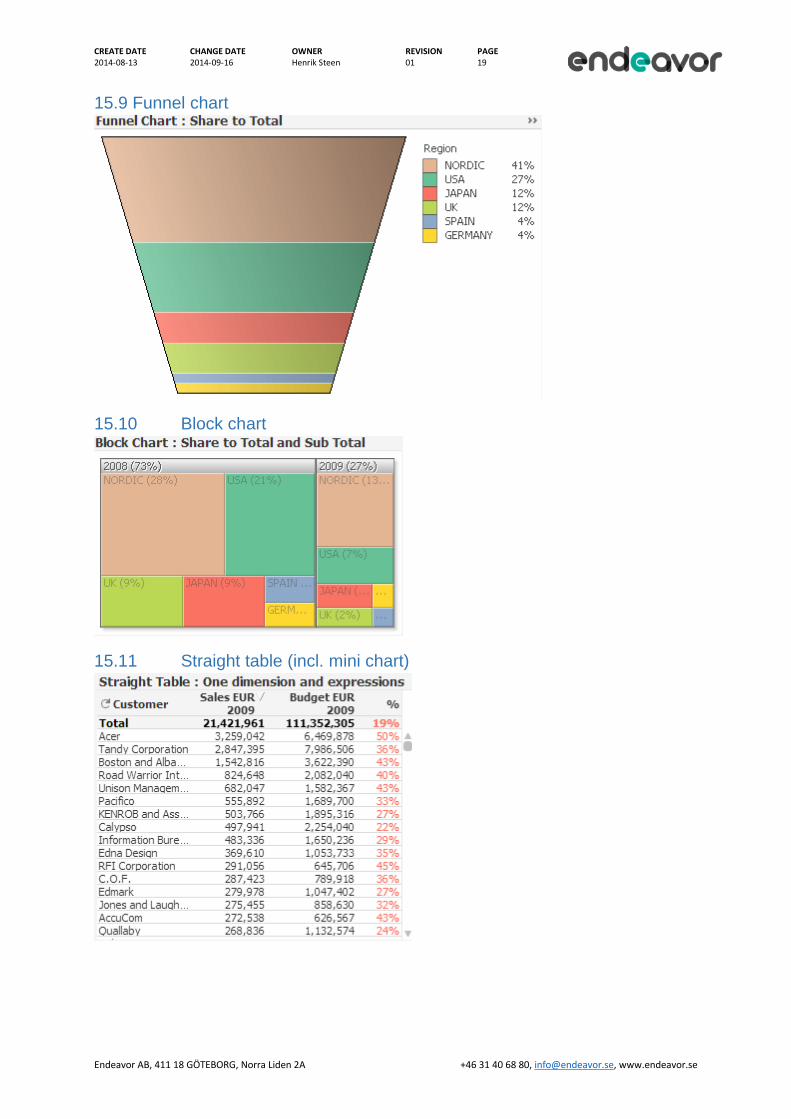
15.9 Funnel chart
15.10 Block chart
15.11 Straight table (incl. mini chart)
CREATE DATE CHANGE DATE OWNER REVISION PAGE . 2014-08-13 2014-09-16 Henrik Steen 01 20
Endeavor AB, 411 18 GÖTEBORG, Norra Liden 2A +46 31 40 68 80, [email protected], www.endeavor.se
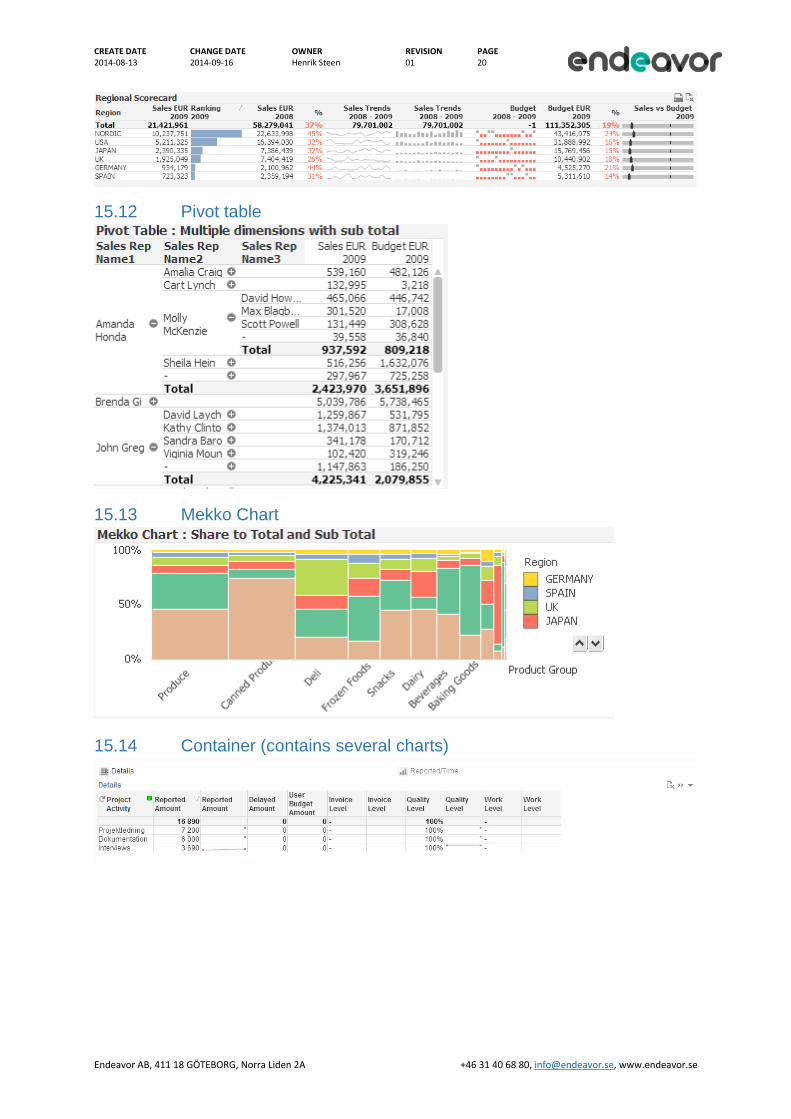
15.12 Pivot table
15.13 Mekko Chart
15.14 Container (contains several charts)
CREATE DATE CHANGE DATE OWNER REVISION PAGE . 2014-08-13 2014-09-16 Henrik Steen 01 21
Endeavor AB, 411 18 GÖTEBORG, Norra Liden 2A +46 31 40 68 80, [email protected], www.endeavor.se
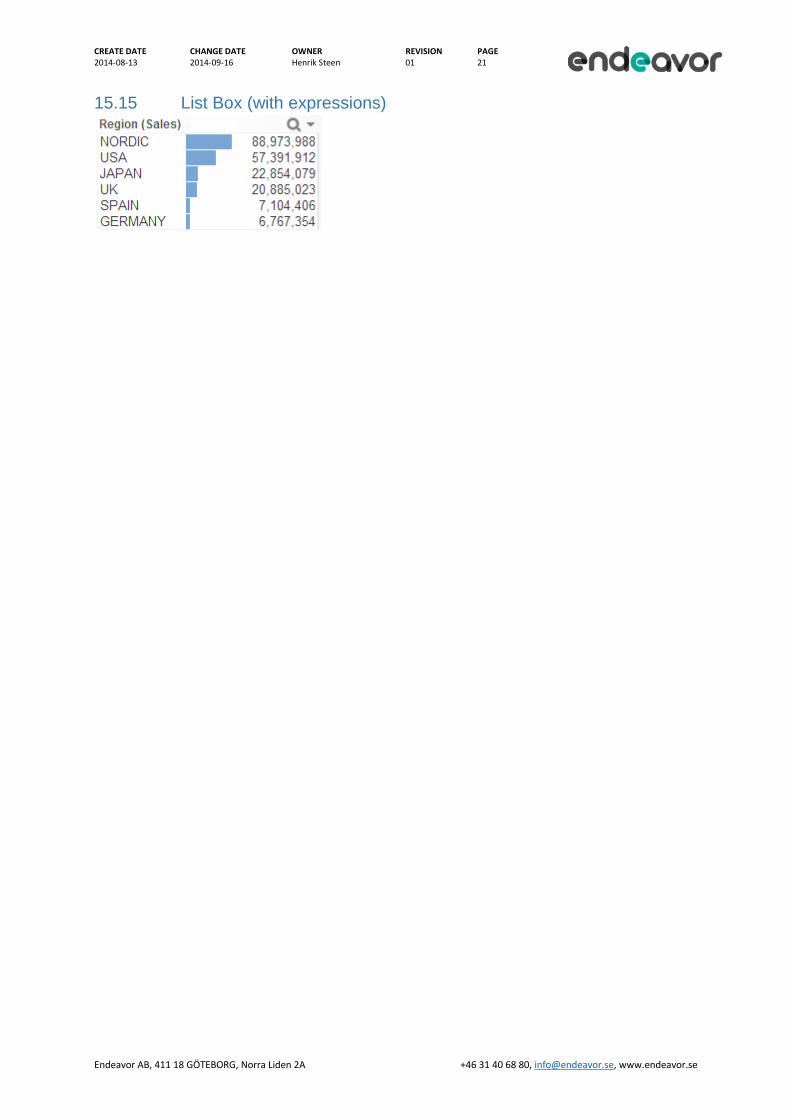
15.15 List Box (with expressions)


