QSARinCatalysis~InSilicoCatalystDesign~ Lit.Sem.2010/6/30 TatsuhikoYoshino(M2) C o n t e n t s 1.Introduction:WhatisQSAR? 2.PioneerWork:PredictingModelforTsuji-TrostAllylation 3.CoMFA:AnalysisofAsymmetricDiels-AlderReaction 4.QM-QSAR:WorkofProf.MarizaC.Kozlowski 5.NeuralNetwork:Non-LinearRegressionMethodology 6.Summary 1.Introduction:WhatisQSAR? 1.1Concept QSAR=Q uantitativeS tructureA ctivityR elationships Methodtopredict"activity"oftargetcompound"quantitatively"fromcaluculatedparameters. Majorconceptindrugdesign.(Activity=IC 50 etc..) QSAR=Q uantitativeS tructureA symmetryR elationships QSSR=Q uantitativeS tructureS electivityR elationships 1.2Descriptor Descriptor:Variables(parameteres)whichdescribethefeatureofmolecules. Descriptorsshouldbeobtainedbyexperimentorcalculation. Examples:Meltingpoint,LogP,Dipole-moment,Bond-length,Dihedral-angle,numberoffunctionalgroup... Q S A R m o d e l c o r r e l a t e s D e s c r i p t o r a n d A c t i v i t y i n q u a n t i t a t i v e m a n n e r . 1.3Training/Prediction FittingfromExperimentalResults(Training) Compound1 Compound2 Compound3 D 1 100 50 75 D 2 1 0 2 D 3 0.15 0.60 1.00 IC 50 30 3 0.5 log(1/IC 50 )=c 0 +c 1 D 1 +c 2 D 2 +c 3 D 3 +... L i n e a r C o r r e l a t i o n M o d e l Coefficients(c m )canbeobtainedbymathematicalmethod. (Multi-regressionbyleastsquare,PLSanalysisandsoon) Validation CrossvalidationbyLOO(leaveoneout)orLSO(leaveseveralout)isusuallyemployedforvalidation. L O O ( L e a v e O n e O u t ) Correlationmodelisre-calculatedwithtraningsetwhereonecompoundisexclueded. Then,activityofexcludedcompoundispredictedusingthenewmodelandcomparedwithrealvalue. L S O ( L e a v e S e r e r a l O u t ) AlmostsameasLOO.Severalcompoundswereexcludedinthiscase. Prediction Activityofothercompoundscanbecalculatedusingmodelequation. 1/15
Transcript
QSAR in Catalysis ~ In Silico Catalyst Design ~
Lit. Sem. 2010/6/30Tatsuhiko Yoshino (M2)
Contents 1. Introduction : What is QSAR ?2. Pioneer Work : Predicting Model for Tsuji-Trost Allylation3. CoMFA : Analysis of Asymmetric Diels-Alder Reaction4. QM-QSAR : Work of Prof. Mariza C. Kozlowski5. Neural Network : Non-Linear Regression Methodology6. Summary
Descriptor : Variables (parameteres) which describe the feature of molecules.Descriptors should be obtained by experiment or calculation.
Examples : Melting point, Log P, Dipole-moment, Bond-length, Dihedral-angle, number of functional group...
QSAR model correlates Descriptor and Activity in quantitative manner.
1.3 Training/Prediction
Fitting from Experimental Results (Training)
Compound 1Compound 2Compound 3
D11005075
D2102
D30.150.601.00
IC50303
0.5
log (1/IC50) = c0 + c1D1 + c2D2 + c3D3 + ...
Linear Correlation Model
Coefficients (cm) can be obtained by mathematical method.(Multi-regression by least square, PLS analysis and so on)
Validation
Cross validation by LOO (leave one out) or LSO (leave several out) is usually employed for validation.
LOO (Leave One Out)
Correlation model is re-calculated with traning set where one compound is exclueded.Then, activity of excluded compound is predicted using the new model and compared with real value.
LSO (Leave Sereral Out)
Almost same as LOO. Several compounds were excluded in this case.
Prediction Activity of other compounds can be calculated using model equation. 1/15
1.4 What is Important ?
The most important point is to select the appropriate descriptors to describe molecular structre.For drug discovery, CoMFA is one of the most general method.
Application of QSAR methodology to predict enantio-selectivity is main topic in this seminar.
2. Pioneer Work : Predicting Model for Tsuji-Trost Allylation
Norrby, P-O. et. al. "Steric Influences on the Selectivity in Palladium-Catalyzed Allylation"Organometallics, 1997, 16, 3015.
1.5 Advantages and Disadvantages
Compared with Ab initio Transition State Calculation
Advantages : Rapid calculation for prediction.Easy to understand what is important for selectivity.
Disadvantages : There is no theoretical, chemical guarantee. It is only statistical result.
R1 R2
Pd
EtOOC COOEt
R1
Nu
R2 R2
Nu
R1
or
2.1 Regio-Selectivity in Tsuji-Trost Allylation
2.2 Reaction Conditions
Ligands
Allyls
ProductsE,Z-IsomerizationIn catalytic reaction : fast (Boltzmann distribution by calculation)stoichiometric reaction : slow
Catalytic and stoichiometric (using isolated -allyls)readtions are performed.
2/15
Sodium diethyl malonate + E-allylic acetate in DMF
2.3 QSAR Model with Molecular Mechanics (MM2)
Final Selected Discriptors of Steric Feature of -allyl Pd
(Structures of -allyl Pd were generated by MM2 method)
"Selectivity" was conveted to Gibbs energy.
(Reaction Rate = K*exp(-Ea/RT) )
Linear model
Discriptors
1) Breaking Pd-C bond length2) Dihedrals N1-N2-Pd-Ct3) Dihedrals Du-Pd-Cc-Ct4) Steric Interaction with Nu
Steric Interaction with Nu : Set Ar probe atom to Nu position (figure) and calculate the increased energy
2.4 Results and Discussion
Regression was performed with Levenberg-Marquardt algorithm (normal multi-regression)
·The most important factor (descriptorw that coefficient has largest absolute value) is Pd-C bond.
Cross Validation Value : LOO Q2 = 0.86
LSO Q2 = 0.87
·About result of cross validation of 1f which has unsymmetrical allyls and chiral ligand
1) Error occured because the fact that crossover between enantiometric path cannot take place.2) Error occured because asymmetrical electronic effect was neglected.
Modification for these problem did not give better models.
Just a possible Error in MM2 system ?
3/15
3. CoMFA : Analysis of Asymmetric Diels-Alder Reaction
3.1 Method
Lipkowitz, K. B. et. al."Computational Studies of Chiral Catalysts: A Comparative Molecular Field Analysis of an Asymmetric Diels-Alder
Reaction with Catalysts Containing Bisoxazoline or Phosphinooxazoline Ligands"J. Org. Chem. 2003, 68, 4648.
Comparative Molecular Field Analysis (= CoMFA) is now widely used method for drug design.This method was first reported in 1988 in JACS.
Ref) Cramer, R. D. III et. al. "Comparative Molecular Field Analysis (CoMFA). 1. Effect of Shape on Binding ofSteroids to Carrier Proteins" J. Am. Chem. Soc. 1988, 110, 5959.
Key for CoMFA
1) All the analyzed compounds are set in grid space in appropriate manner.Then interaction energy between "probe" and each coumpound at all grid points.These energy values are used as descriptors.
2) Generated huge number of descriptors are analyzed by "PLS-regression" technique.
Grid-based Descriptor
Probe : sp3 C+ atom is often utilized. (Other probes can be also utilized.)Interaction energy is calculated as sum of van der Waals energy and Coulombic energy.
van der Waals Energy : Tripos Force Field ( 1/r6 1/r12)Coulombic energy : 1/r, Atomic charge by *Gasteiger-Marsili method (from orbital electronegativity)
* Tetrahedron 1980, 36, 3219.
Grid Point
·Enough range to cover all atoms of target compounds·Grid points with too high steric energy is cut-off.·Grid points with too small standard deviation is eliminated.·Grid space is usually 1.0-2.0 Å.
PLS-Regression
PLS = Partial Least Square is a regression methodsuitable for models with...
·No clear reasonable relation of variables and property.·Large number of variables (descriptors), often larger thannumber of samples.Overfitting is a big problem in such a case, if normal multi-regression is employed.
Other calculation methods can be used.
4/15
PLS-Regression : m variables (descriptors), n samples, 1 output models
yi : outputxij : variables j of sample itik : latent variables (LC of x)
w : weight coefficients for X to Tc : coefficients
Calculation of w1) For ti1, {w1j} is obtained to maximizecovariance (colinearlity) of {yi} and {ti1}.
2) For ti2, {w2j} is obtained to maximizecovariance (colinearlity) of {yi-c1ti1} and {ti2}.
3) For ti3, {w3j} is obtained to maximizecovariance (colinearlity) of {yi-c1ti1-c2ti2} and {ti3}.
4) This procedure is repeated to reach r.Ref) http://cse.naro.affrc.go.jp/iwatah/index_j.html
PLS
Taget Reaction and Reaction Conditions
ON
OOcatalyst
+O N
OO
Experimental results were extrated from repotedpapers.The most optimized reaction conditions were used.Differeces in temperature, solvent etc were notconsidered.
Catalysts
Counter anions are not described,but considered in structure optimizing calculation.
Catalyst Structure
Initial Structures : CSD or Built in Spartan
Optimized by PM3tm method (semiempirical MO)
Alignment
Least-square fitting of oxazoline rings.
Validation
1) Internal Cross Validation by LOO.In some cases, only internal validation is not enough.Ref) Golbraikh, A; Tropsha, A. J. Mol. Graphics
Modell. 2002, 20, 269.
2) External ValidationAt ramdom, 10,15,18,22 were excluded and used asexternal prediction set (LSO).
Best model
Field : both (Steric and Electronic)Energy cut-off : S/E =30/20 kcal/moldielectric functions 1/r2
Probe : C+sp3
Latent variables : 6
1) All catalysts model : r2cv = 0.8332) LSO catalysts model : r2cv = 0.785, external r2 = 0.94
Golbraikh Tropsha Criteria : fullfilled
3.2 Application to Asymmetric Catalysis
5/15
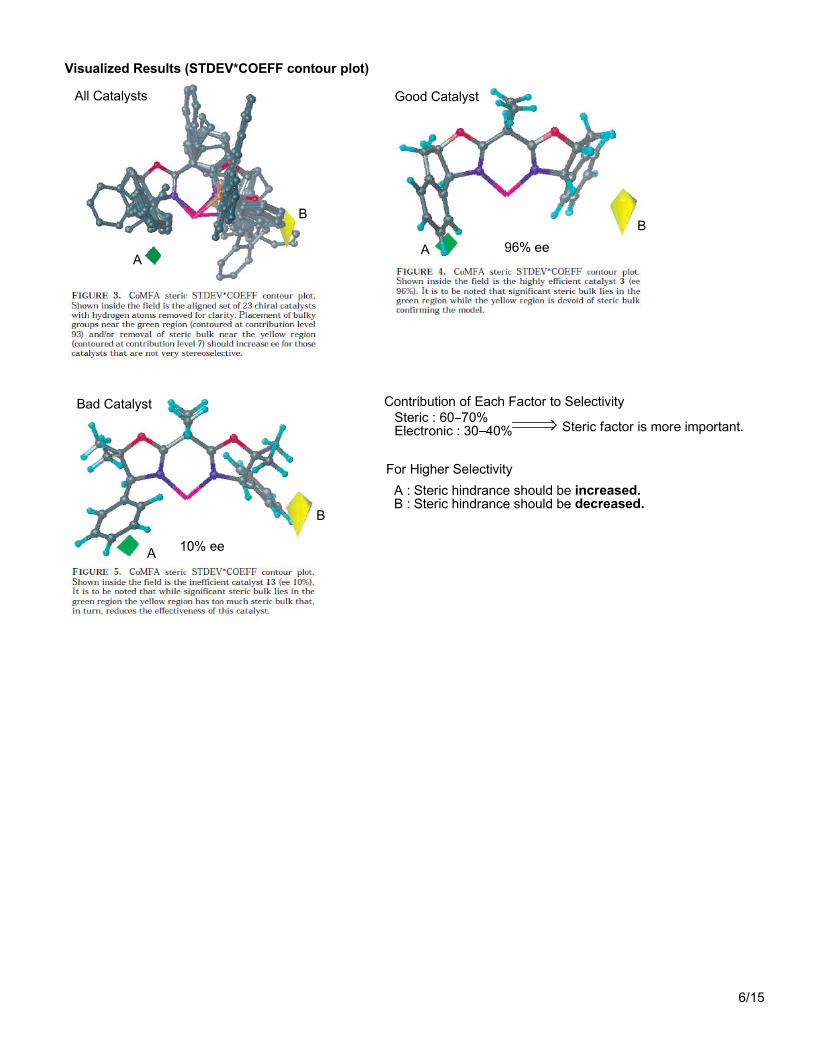
Visualized Results (STDEV*COEFF contour plot)
All Catalysts Good Catalyst
Bad Catalyst
A : Steric hindrance should be increased.B : Steric hindrance should be decreased.
For Higher Selectivity
Steric : 60 70%Electronic : 30 40%
Contribution of Each Factor to Selectivity
Steric factor is more important.
96% ee
10% ee
A
B
A
B
A
B
6/15
4. QM-QSAR : Works of Prof. Marisa C. Kozlowski
4.1 MethodDixon, S. L.; Merz, K. M. Jr. et. al. "QMQSAR: Utilization of a Semiempirical Probe Potential
in a Field-Based QSAR Method" J. Comp. Chem. 2004, 26, 23.
Compared with CoMFA...
Similar Point : Energy values at grid points are calculated and used as descriptors.
Different Points : Energy is calculated as Probe Interaction Energies (PIE) by quantum mechanical method.Regression is performed using n-variables regressions by simulated-annealing.
Probe Interaction Energies (PIE)
Probe : a positively charged carbon 2s electron
M : Considered atoms: nucleus
si : wave functions of probe: wave functions of basis in
c : coeffiecents of LCAO
Potential from nucleus
Potential from electrons All calculations are performed PM3 (semiempirical MO) method.
Regression
From several thousands of descr iptors, n (2,3,4,5...) descriptors which give good f itting are selected.
Solutions for optimization problems in NP-hard class.(impossible to solve in polynomial-time by deterministic algorithmm, if N NP)Solution time is polinomial, but there is no guarantee to always give the right answer.Mimic of annealing process.
How to select optimal descpriptors
1) T (Temperature) and initial state is set.2) "State" is changed to another neighbour state "stochastically" as following.If next state is better than now, state transition occured.If next state is worse and temperature is enough high, state transition occured. (A)These operations are repeated.
3) Temperature is decreased.4) Repeat 2)-3)
By process (A), probability of wrong answerwhich is "local minimum" decreased. (Think of start from P.)
E
local minimum(wrong)
right answer
P
SO
(A)
7/15
4.2 QM-QSAR Approach for Predicting the Selectivity of Asymmetric Alkylation
Kozlowski, M. C. et. al. "Quantum Mechanical Models Correlating Structure with Selectivity: Predicting theEnantioselectivity of -Amino Alcohol Catalysts in Aldehydee Alkylation" J. Am. Chem. Soc. 2003, 125, 6614.
Target Reaction
O
Ph H
catalyst
Et2Zn Ph H
OHEt
DAIB
99% ee Noyori, R. et. al. J. Am. Chem. Soc. 1986, 108, 6071.
Transition State Calculated TS (using Me2Zn) at the RHF/3-21G/Zn level.
Noyori, R. et. al. Organometallics 1999, 18, 128.
Among possible 4 TS (syn/anti, R, S),anti S is the most favored.
Catalysts Structure Optimization
Optimized Ground States : planar Zn
not suitable
Transition States (PM3)
Catalysts Set
Method
·PIEs (descriptors) are correlated with G values which can be converted to ee.G = RT ln K, where K is enatio metric ratio.
·2 PIEs are selected to give the best fitting model by simulated annealing and normal least-square is used.G = a + c1(PIE1) + c2(PIE2)
Or all acceptable PIEs pairs are weight averaged.
Effect of Grid Space
Describe how well the prediction set selectivityorder is calculated.
CC = Correlation Coefficients
0.7 Å grid space show good convergence.
Aligned fitting Zn-O-Zn atoms
8/15
Best Individual Model
Averaged Model
Results
best modelaveraged model
For good Selectivity.... A: more PIEsB: less PIEs
BB
A A
PIEs : Electron rich area : decreasedNear Nucleus : inceased
Only minutes of computing gave good models!
M. C. Kozlowski et. al. "A Priori Theoretical Prediction of Selectivity in Asymmetric Catalysis: Design of ChiralCatalysts by Using Quantum Molecular Interaction Field" Angew. Chem., Int. Ed. 2006, 45, 5502.
4.3 Further Prediction for New Catalysts
Method Improvement : Ground states of dimeric catalysts gave a good model.
Monomer : Trigonal Zn ... Bad modelDimer : Tetrahedral Zn ... Good model
Training Set
Trans amino alcohols with tetrasubstituted chiralcenters were included.
9/15
Prediction Set
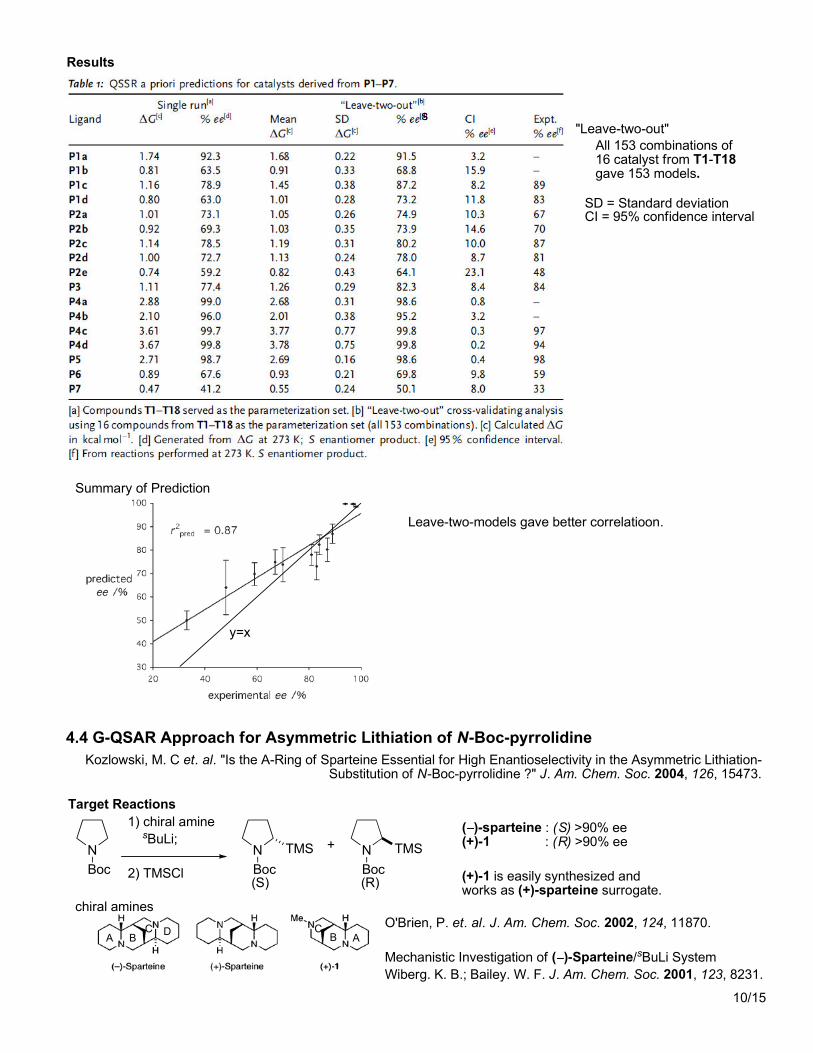
Results
Summary of Prediction
SD = Standard deviationCI = 95% confidence interval
"Leave-two-out"All 153 combinations of16 catalyst from T1-T18gave 153 models.
s
Leave-two-models gave better correlatioon.
y=x
4.4 G-QSAR Approach for Asymmetric Lithiation of N-Boc-pyrrolidine
Kozlowski, M. C et. al. "Is the A-Ring of Sparteine Essential for High Enantioselectivity in the Asymmetric Lithiation-Substitution of N-Boc-pyrrolidine ?" J. Am. Chem. Soc. 2004, 126, 15473.
Target Reactions
N
Boc
1) chiral aminesBuLi;
2) TMSCl
N
Boc
N
Boc
TMS TMS+
chiral amines
( )-sparteine : (S) >90% ee(+)-1 : (R) >90% ee
(S) (R) (+)-1 is easily synthesized andworks as (+)-sparteine surrogate.
O'Brien, P. et. al. J. Am. Chem. Soc. 2002, 124, 11870.
Mechanistic Investigation of ( )-Sparteine/sBuLi SystemWiberg. K. B.; Bailey. W. F. J. Am. Chem. Soc. 2001, 123, 8231.
A BC D C
B A
10/15
Training Set
Is A ring essential ?
(S) 21% ee(S) 95%ee (R) 35% ee
What is important for selectivity ?
Results
No good correlation model was obtained byQM-QSAR with PM3 calculation.
More precise calculation of PIEs was necessary.
G-QSAR : PIEs can be calculated using...appropriate method (HF, MP2, B3LYP)appropriate basis set (3-21G, 6-31G*, 6-31+G**...)
Serra, J. M. et. al. "Can artificial neural networks help the experimentation in catalysis?" Catalysis Today 2003, 81, 393.
Input
Artificial Neural Network
Output
General Concept
Artificial Neural Network (ANN) works as "black box",which gives "Output" from "Input"even if the correlation is extremely complex and unknown."Black box" is programed to mimic a neural network(brain).
Artificial Neuron Model
input x output y
Linear model : y = x
Non-linear model : y = 1/(1+e-x )
y = (ex e-x)/(ex e-x)
Network Model : Multi-Layer Perceptrons
Weighted sums of previous layers' outputs are used as next inputs.
xi = wi1y1prev + wi2y2
prev + wi3y3prev + ... + wijyj
prev
next input of neuron (i)
Weight matricW should be optimized to give good correlation.(N-1) Matrixes exist in N layers model.
input for next neurons : X = t{x1, x2, ... , xi}
previous out put : Yprev = t{y1prev, y2
prev, ... , yjprev}
weight matrixW = {wij}
X = WYprev
This calculations are performed for all next neourons.
These are called "activation function".
next output Y = g(X) (g : activation function)
12/15
Backpropagation - Concept
x1
x2
x3
x4
x5
x6
y1
y2
Error
y'1
y'2
Teaching signal
Training signal
When a teaching signal (X, Y)is given, weight matrixesW aremodified to minimize errors.
Advantage ·Applicable to many problems where theoretical anaysis or linear-regression is difficult.
Disadvantage ·It it impossible to obtain theoretical or qualitative information from the results.