International Journal of PharmTech Research CODEN (USA): IJPRIF ISSN : 0974-4304 Vol.4, No.3, pp 1110-1121, July-Sept 2012 QSAR Studies of N-(2-Aminophenyl)-Benzamide derivatives as Histone deacetylase2 Inhibitors Naresh Kandakatla 1,2,* , Geetha Ramakrishnan 2 , S. Vadivelan 1 and SarmaJagarlapudi 1 1 GVK Biosciences Pvt. Ltd., 443, Guna complex, 9th Floor, Annexe I Building, Anna salai, Teynampet, Chennai – 600 018, India 2 Department of Chemistry, Sathyabama university, Jeppiaar Nagar, Chennai-600119, India *Corres.author: [email protected], Tel., +919003069189, +91 44 66293000; fax: +91 44 66293299. Abstract: Histone deacetylase 2 is a promising target for drug intervention and its inhibitors are useful in treating cancer. QSAR (2D and 3D) studies were performed on a series of N-(2-Aminophenyl)-Benzamide derivatives using Cerius2 software (accelrys). QSAR study performed on 25 analogues of which 21 were used in the training set and the rest 4 considered for the test set. 2D- QSAR study performed using Partial least squares (PLS), Genetic function approximation (GFA), Genetic partial least squares (G/PLS). Among these three methods GFA method came out with good correlation coefficient r 2 0.794, cross-validated coefficient r 2 CV 0.634 and r 2 pred of 0.6343. 3D-QSAR studies using Molecular field analysis (MFA), Regression analysis were carried out using GFA method. A highly predictive and statistically significant model was generated. The analyzed MFA model demonstrated a good fit, having r 2 value of 0.927, cross-validated coefficient r 2 CV value of 0.815 and r 2 pred of 0.845.The QSAR models were found to accurately predict the Histone deacetylase2 inhibitory activity of structurally diverse test set compounds and to yield reliable clues for further optimization of the N- (2-Aminophenyl)-Benzamide derivatives in the data set. Key words: Histone deacetylase 2; Genetic Function Approximation; Molecular field analysis; N-(2- Aminophenyl)-Benzamide derivatives. 1. Introduction: Histone deacetylase (HDACs) represent a family of enzymes that compete with histone acetyltransferases (HATs) to modulate chromatin structure and transcriptional activity via change in acetylation status of nucleosomal histones. HDACs are deacetylating the ε-amino groups of lysine located near the amino termini of core histone proteins [1-2] . Mammalian HDACs have been classified into three classes. Class I (HDACs 1, 2, 3 and 8) are homologs of yeast RPD3 and localize to the nucleus; Class II (HDACs 4, 5, 6, 7, 9 & 10) are homologs of yeast Hda1 and are found in both the nucleus and cytoplasm; Class III (Sirt1 - Sirt7). Class I and II HDACs operate by zinc-dependent mechanisms and Class III by NAD [3] . HDAC2 highly homologous to HDAC1 is a class I HDAC
Transcript
International Journal of PharmTech ResearchCODEN (USA): IJPRIF ISSN : 0974-4304Vol.4, No.3, pp 1110-1121, July-Sept 2012
QSAR Studies of N-(2-Aminophenyl)-Benzamidederivatives as Histone deacetylase2 Inhibitors
Naresh Kandakatla1,2,*, Geetha Ramakrishnan2,S. Vadivelan1 and SarmaJagarlapudi1
1GVK Biosciences Pvt. Ltd., 443, Guna complex, 9th Floor, Annexe I Building, Annasalai, Teynampet, Chennai – 600 018, India
2Department of Chemistry, Sathyabama university, Jeppiaar Nagar,Chennai-600119, India
Abstract: Histone deacetylase 2 is a promising target for drug intervention and its inhibitors are useful intreating cancer. QSAR (2D and 3D) studies were performed on a series of N-(2-Aminophenyl)-Benzamidederivatives using Cerius2 software (accelrys). QSAR study performed on 25 analogues of which 21 were usedin the training set and the rest 4 considered for the test set. 2D- QSAR study performed using Partial leastsquares (PLS), Genetic function approximation (GFA), Genetic partial least squares (G/PLS). Among thesethree methods GFA method came out with good correlation coefficient r2 0.794, cross-validated coefficient r2
CV
0.634 and r2pred of 0.6343. 3D-QSAR studies using Molecular field analysis (MFA), Regression analysis were
carried out using GFA method. A highly predictive and statistically significant model was generated. Theanalyzed MFA model demonstrated a good fit, having r2 value of 0.927, cross-validated coefficient r2
CV value of0.815 and r2
pred of 0.845.The QSAR models were found to accurately predict the Histone deacetylase2 inhibitoryactivity of structurally diverse test set compounds and to yield reliable clues for further optimization of the N-(2-Aminophenyl)-Benzamide derivatives in the data set.Key words: Histone deacetylase 2; Genetic Function Approximation; Molecular field analysis; N-(2-Aminophenyl)-Benzamide derivatives.
1. Introduction:
Histone deacetylase (HDACs) represent a family ofenzymes that compete with histoneacetyltransferases (HATs) to modulate chromatinstructure and transcriptional activity via change inacetylation status of nucleosomal histones. HDACsare deacetylating the ε-amino groups of lysinelocated near the amino termini of core histoneproteins [1-2]. Mammalian HDACs have been
classified into three classes. Class I (HDACs 1, 2, 3and 8) are homologs of yeast RPD3 and localize tothe nucleus; Class II (HDACs 4, 5, 6, 7, 9 & 10) arehomologs of yeast Hda1 and are found in both thenucleus and cytoplasm; Class III (Sirt1 - Sirt7).Class I and II HDACs operate by zinc-dependentmechanisms and Class III by NAD [3]. HDAC2highly homologous to HDAC1 is a class I HDAC
Naresh Kandakatla et al /Int.J.PharmTech Res.2012,4(3) 1111
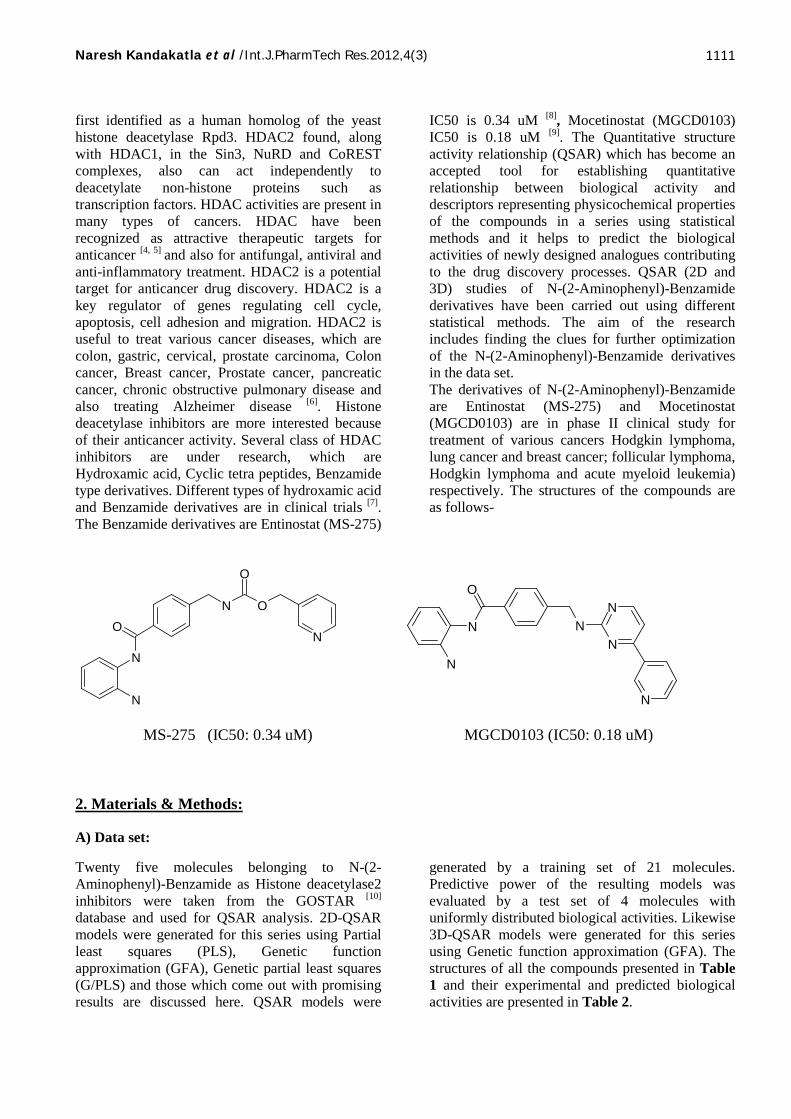
first identified as a human homolog of the yeasthistone deacetylase Rpd3. HDAC2 found, alongwith HDAC1, in the Sin3, NuRD and CoRESTcomplexes, also can act independently todeacetylate non-histone proteins such astranscription factors. HDAC activities are present inmany types of cancers. HDAC have beenrecognized as attractive therapeutic targets foranticancer [4, 5] and also for antifungal, antiviral andanti-inflammatory treatment. HDAC2 is a potentialtarget for anticancer drug discovery. HDAC2 is akey regulator of genes regulating cell cycle,apoptosis, cell adhesion and migration. HDAC2 isuseful to treat various cancer diseases, which arecolon, gastric, cervical, prostate carcinoma, Coloncancer, Breast cancer, Prostate cancer, pancreaticcancer, chronic obstructive pulmonary disease andalso treating Alzheimer disease [6]. Histonedeacetylase inhibitors are more interested becauseof their anticancer activity. Several class of HDACinhibitors are under research, which areHydroxamic acid, Cyclic tetra peptides, Benzamidetype derivatives. Different types of hydroxamic acidand Benzamide derivatives are in clinical trials [7].The Benzamide derivatives are Entinostat (MS-275)
IC50 is 0.34 uM [8], Mocetinostat (MGCD0103)IC50 is 0.18 uM [9]. The Quantitative structureactivity relationship (QSAR) which has become anaccepted tool for establishing quantitativerelationship between biological activity anddescriptors representing physicochemical propertiesof the compounds in a series using statisticalmethods and it helps to predict the biologicalactivities of newly designed analogues contributingto the drug discovery processes. QSAR (2D and3D) studies of N-(2-Aminophenyl)-Benzamidederivatives have been carried out using differentstatistical methods. The aim of the researchincludes finding the clues for further optimizationof the N-(2-Aminophenyl)-Benzamide derivativesin the data set.The derivatives of N-(2-Aminophenyl)-Benzamideare Entinostat (MS-275) and Mocetinostat(MGCD0103) are in phase II clinical study fortreatment of various cancers Hodgkin lymphoma,lung cancer and breast cancer; follicular lymphoma,Hodgkin lymphoma and acute myeloid leukemia)respectively. The structures of the compounds areas follows-
N
NO
O
O
N
N
NN
NN
O
N
N
MS-275 (IC50: 0.34 uM) MGCD0103 (IC50: 0.18 uM)
2. Materials & Methods:
A) Data set:
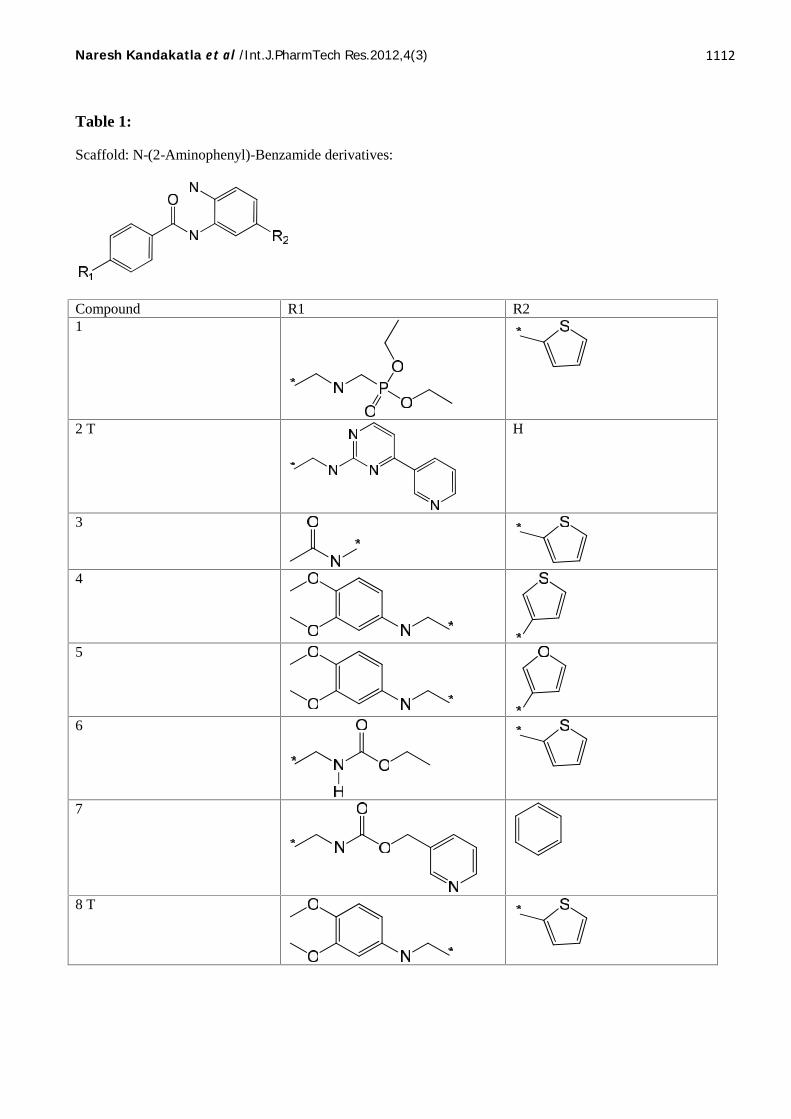
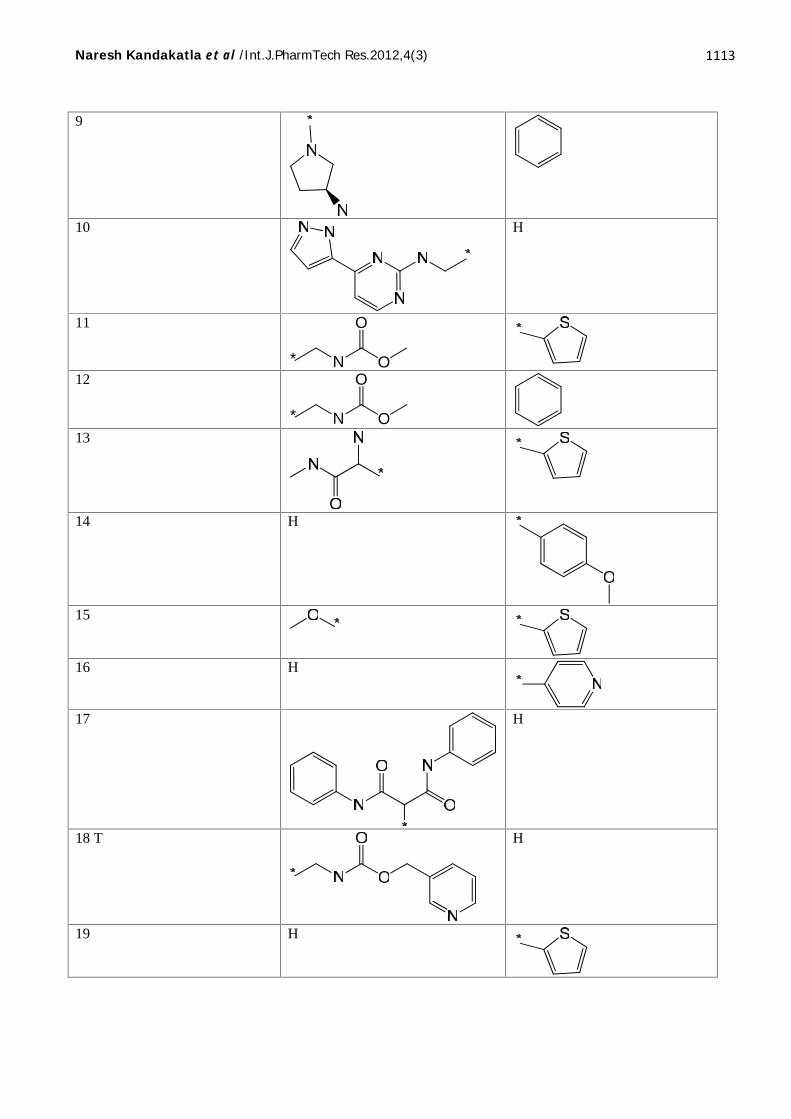
Twenty five molecules belonging to N-(2-Aminophenyl)-Benzamide as Histone deacetylase2inhibitors were taken from the GOSTAR [10]
database and used for QSAR analysis. 2D-QSARmodels were generated for this series using Partialleast squares (PLS), Genetic functionapproximation (GFA), Genetic partial least squares(G/PLS) and those which come out with promisingresults are discussed here. QSAR models were
generated by a training set of 21 molecules.Predictive power of the resulting models wasevaluated by a test set of 4 molecules withuniformly distributed biological activities. Likewise3D-QSAR models were generated for this seriesusing Genetic function approximation (GFA). Thestructures of all the compounds presented in Table1 and their experimental and predicted biologicalactivities are presented in Table 2.
Naresh Kandakatla et al /Int.J.PharmTech Res.2012,4(3) 1112
Naresh Kandakatla et al /Int.J.PharmTech Res.2012,4(3) 1113
9
10 H
11
N
O
O*12
N
O
O*13
14 H
15
16 H
17 H
18 T H
19 H
Naresh Kandakatla et al /Int.J.PharmTech Res.2012,4(3) 1114
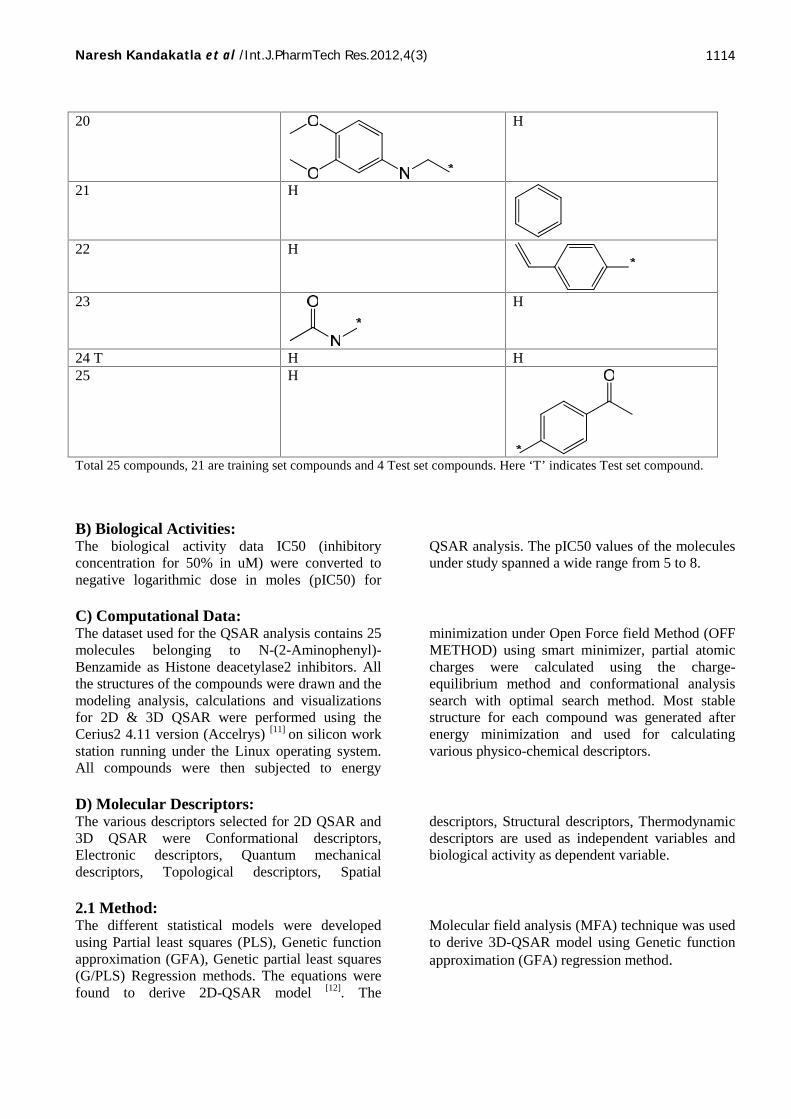
20 H
21 H
22 H
23 H
24 T H H25 H
Total 25 compounds, 21 are training set compounds and 4 Test set compounds. Here ‘T’ indicates Test set compound.
B) Biological Activities:The biological activity data IC50 (inhibitoryconcentration for 50% in uM) were converted tonegative logarithmic dose in moles (pIC50) for
QSAR analysis. The pIC50 values of the moleculesunder study spanned a wide range from 5 to 8.
C) Computational Data:The dataset used for the QSAR analysis contains 25molecules belonging to N-(2-Aminophenyl)-Benzamide as Histone deacetylase2 inhibitors. Allthe structures of the compounds were drawn and themodeling analysis, calculations and visualizationsfor 2D & 3D QSAR were performed using theCerius2 4.11 version (Accelrys) [11] on silicon workstation running under the Linux operating system.All compounds were then subjected to energy
minimization under Open Force field Method (OFFMETHOD) using smart minimizer, partial atomiccharges were calculated using the charge-equilibrium method and conformational analysissearch with optimal search method. Most stablestructure for each compound was generated afterenergy minimization and used for calculatingvarious physico-chemical descriptors.
D) Molecular Descriptors:The various descriptors selected for 2D QSAR and3D QSAR were Conformational descriptors,Electronic descriptors, Quantum mechanicaldescriptors, Topological descriptors, Spatial
descriptors, Structural descriptors, Thermodynamicdescriptors are used as independent variables andbiological activity as dependent variable.
2.1 Method:The different statistical models were developedusing Partial least squares (PLS), Genetic functionapproximation (GFA), Genetic partial least squares(G/PLS) Regression methods. The equations werefound to derive 2D-QSAR model [12]. The
Molecular field analysis (MFA) technique was usedto derive 3D-QSAR model using Genetic functionapproximation (GFA) regression method.
Naresh Kandakatla et al /Int.J.PharmTech Res.2012,4(3) 1115
A) Statistical Parameters:Statistical measures used for the evaluation ofmodels were the number of compounds inRegression (n), the correlation coefficient (r),square of correlation coefficient (r2), sequentialFischer test (F), the cross–validated correlationcoefficient r2
CV and the Boot strap r2. The regressioncoefficient r2 is a relative measure of fit by theregression equation. It represents the part of thevariation in the observed data that is explained by
the regression. The F–test reflects ratio of thevariance explained by the model and the variancedue to the error in the regression. High values of theF-test indicate that the model is statisticallysignificant. Validation parameter, predictive r2
(r2pred) was calculated for evaluating the predictive
capacity of the model. The value of r2pred greater
0.5 indicates the good predictive capacity of theQSAR model [13].
B) Model Validation:For the validation of QSAR models “Leave-one-out(Loo)” Cross-validation method was used, the bestmodel was selected on the basis of variousstatistical parameters such as correlation coefficient(r), square of correlation coefficient (r2), sequentialFischer test (F), quality of the each model wasestimated from the cross-validated squared
correlation coefficient (r2CV), PRESS (Predicted
sum of squared residuals), Sum of squareddeviations from the mean (SD), and boot-strappingsquare BS correlation coefficient (r2 ), whichconfirm the robustness and applicability of QSARequation.
A) Alignment of molecules:Molecular alignment is a crucial step in 3D-QSARstudy to obtain meaningful results. This Method isbased on moving of molecules in 3D space, whichis related to the conformational Flexibility ofmolecule, the goal is to obtain optimal alignmentbetween the molecular structures necessary forligand–receptor interactions. All molecules in thedata set were aligned by shape reference molecule
using higher activity of molecule as shape reference[14]. A highly bioactive energetically stableconformation in this class of compounds is chosenas a reference molecule on which other moleculesin the data set are aligned, considering shapereference molecule as a basis for the alignment, infigure 2.
B) Computation of steric and electrostatic fields:The aligned biologically active conformations of N-(2-Aminophenyl)-Benzamide derivatives are usedfor the calculation of molecular fields. Molecularfields are the steric and electrostatic interactionenergies which are used to formulate a relationshipbetween steric and electrostatic properties togetherwith the biological activities of compounds. MFA isa method implemented in the Cerius2 program.Its formalism calculates probe interactionenergies on a rectangular grid around a bundleof active molecules. The surface is generatedfrom a “shape field.” The atomic coordinates ofthe contributing models are used to computefield values on each point of a 3D grid. MFAthen evaluates the energy between a probe(H+ and CH3) and a molecular model at aseries of points defined by a rectangular grid.Fields of molecules are represented with gridsin MFA and corresponding energy associatedwith an MFA grid point can serve as input for
the calculation of a QSAR. These energies areadded to the study table to form new columnsheaded according to the probe type, which areused as independent variable. GFA was appliedto obtain a 3D-QSAR model based on steric andelectrostatic descriptors [15]. Many of the spatial andstructural descriptors such as polarizability, dipolemoment, radius of gyration, molecular area,molecular dimensions, density, principal momentsof inertia, molecular volume, molecular weight,number of rotatable bonds, hydrogen bond donorsand acceptors, log P, molar refractivity and otherswere also considered along with field values [16].Only 10% of the total variables whose variance ishighest were considered as independent variables.The negative logarithm of the biological activitywas chosen as the dependent variable in thegeneration of QSAR equations using the GFAregression method (with only linear terms involvedin the equations) [17].
Naresh Kandakatla et al /Int.J.PharmTech Res.2012,4(3) 1116
3. Results and Discussion:3.1 2D QSAR modeling and its validation:In QSAR modeling, the first goal was to establish apredictive model with a reasonable number of inputfeatures to ensure good generalization performance.While correlating various descriptors, biologicalactivity is the most important means to studystructure activity relationships. PLS, GFA andG/PLS techniques were used in the present studyfor selecting a significant set of descriptors in orderto build the significant models. In this section, theprediction performances of the method proposed bythree different models (PLS, GFA and G/PLS) wereevaluated. The PLS, GFA and G/PLS models
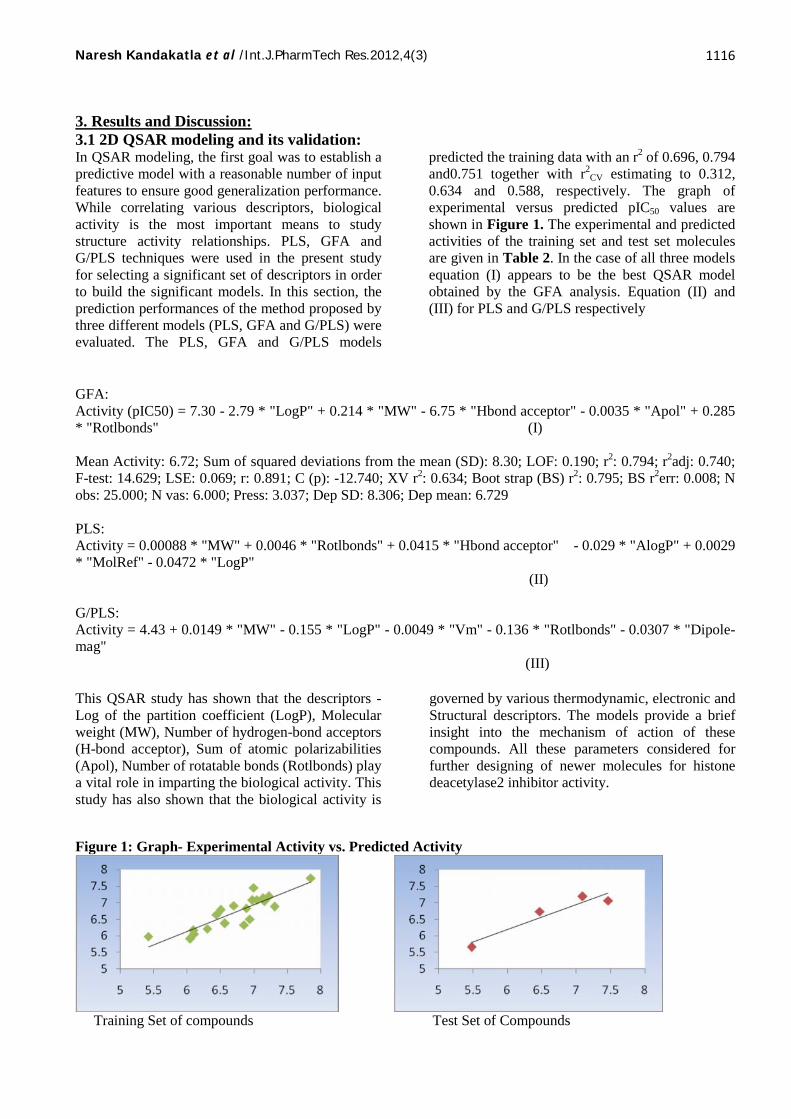
predicted the training data with an r2 of 0.696, 0.794and0.751 together with r2
CV estimating to 0.312,0.634 and 0.588, respectively. The graph ofexperimental versus predicted pIC50 values areshown in Figure 1. The experimental and predictedactivities of the training set and test set moleculesare given in Table 2. In the case of all three modelsequation (I) appears to be the best QSAR modelobtained by the GFA analysis. Equation (II) and(III) for PLS and G/PLS respectively
Mean Activity: 6.72; Sum of squared deviations from the mean (SD): 8.30; LOF: 0.190; r2: 0.794; r2adj: 0.740;F-test: 14.629; LSE: 0.069; r: 0.891; C (p): -12.740; XV r2: 0.634; Boot strap (BS) r2: 0.795; BS r2err: 0.008; Nobs: 25.000; N vas: 6.000; Press: 3.037; Dep SD: 8.306; Dep mean: 6.729
This QSAR study has shown that the descriptors -Log of the partition coefficient (LogP), Molecularweight (MW), Number of hydrogen-bond acceptors(H-bond acceptor), Sum of atomic polarizabilities(Apol), Number of rotatable bonds (Rotlbonds) playa vital role in imparting the biological activity. Thisstudy has also shown that the biological activity is
governed by various thermodynamic, electronic andStructural descriptors. The models provide a briefinsight into the mechanism of action of thesecompounds. All these parameters considered forfurther designing of newer molecules for histonedeacetylase2 inhibitor activity.
Figure 1: Graph- Experimental Activity vs. Predicted Activity
Training Set of compounds Test Set of Compounds
Naresh Kandakatla et al /Int.J.PharmTech Res.2012,4(3) 1117
3.1.2 Randomization Test:To evaluate the statistical significance of the QSARmodel for an actual data set, we have employed aone-tail hypothesis testing. The robustness of theQSAR models for experimental training sets wasexamined by comparing these models to thosederived for random data sets. Random sets weregenerated by rearranging biological activities of thetraining set molecules.
Randomization test results: Test results from 19trails, r from non-random: 0.8909, Confidencelevel: 90%, Mean value of r from random trails:0.706, Standard deviation of random trails: 0.0785,Standard deviation from non-random r to mean:2.35, r2: 0.691, r: 0.831, LSE: 0.103, LOF: 0.285.
3.1.3 Cross-validation:The cross-validation process repeats yourregression many times on subsets of your data.Usually each molecule is left out in turn, and the r2
is computed using the predicted values of themissing molecules (the cross-validated r2). Cross-validation is often used to determine how large a
model (number of terms) can be used for a givendataset.Leave-one out cross-validation test results -PRESS:2.136, Sum of Squared deviation: 8.305, Trails: 1,r2
CV: 0.743, r2: 0.789, F-test: 13.496.
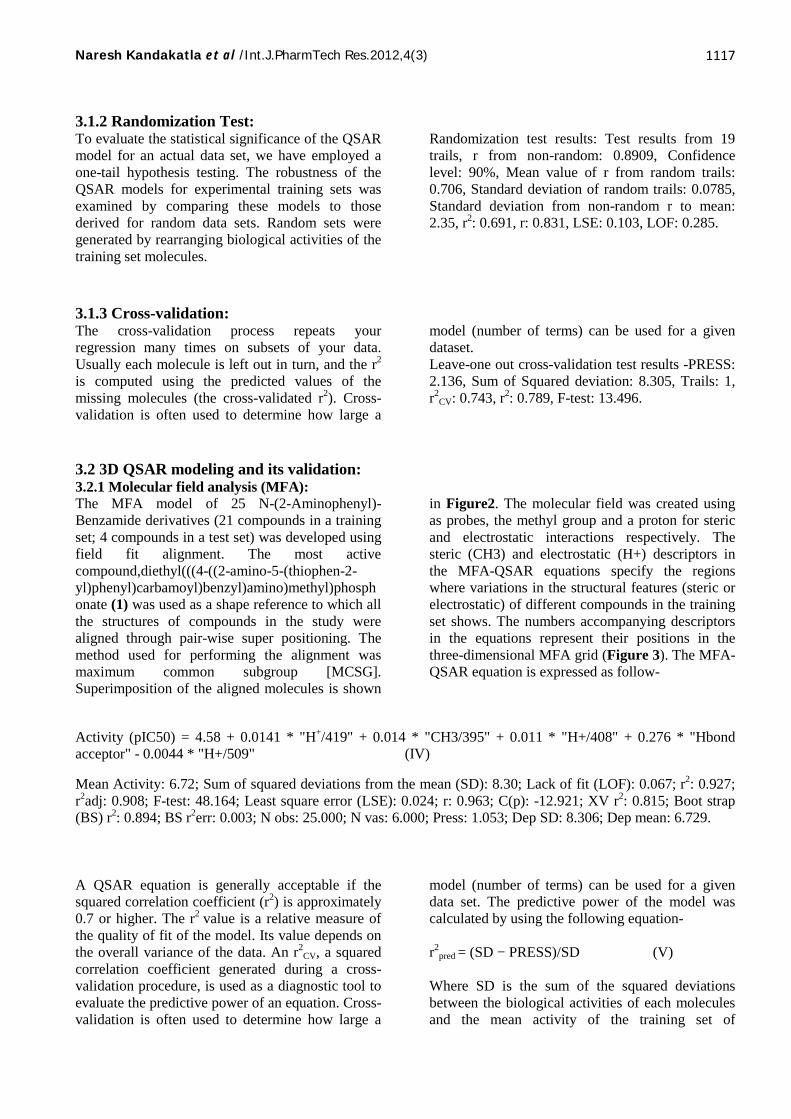
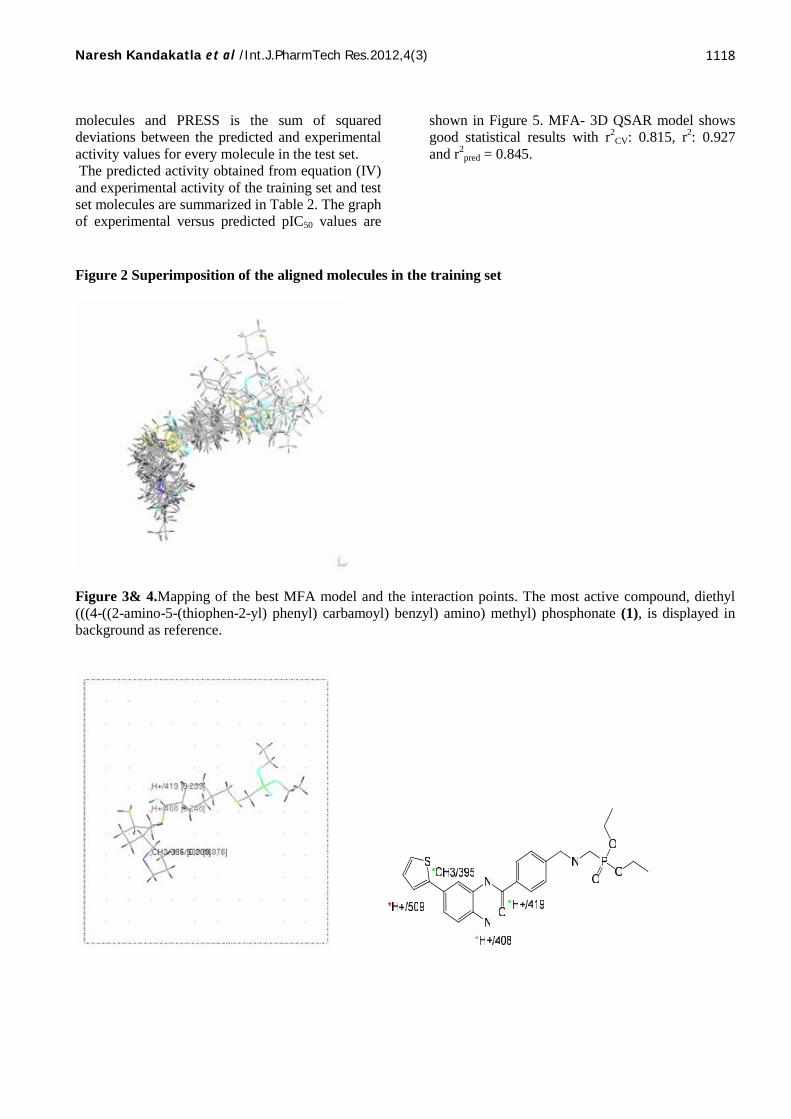
3.2 3D QSAR modeling and its validation:3.2.1 Molecular field analysis (MFA):The MFA model of 25 N-(2-Aminophenyl)-Benzamide derivatives (21 compounds in a trainingset; 4 compounds in a test set) was developed usingfield fit alignment. The most activecompound,diethyl(((4-((2-amino-5-(thiophen-2-yl)phenyl)carbamoyl)benzyl)amino)methyl)phosphonate (1) was used as a shape reference to which allthe structures of compounds in the study werealigned through pair-wise super positioning. Themethod used for performing the alignment wasmaximum common subgroup [MCSG].Superimposition of the aligned molecules is shown
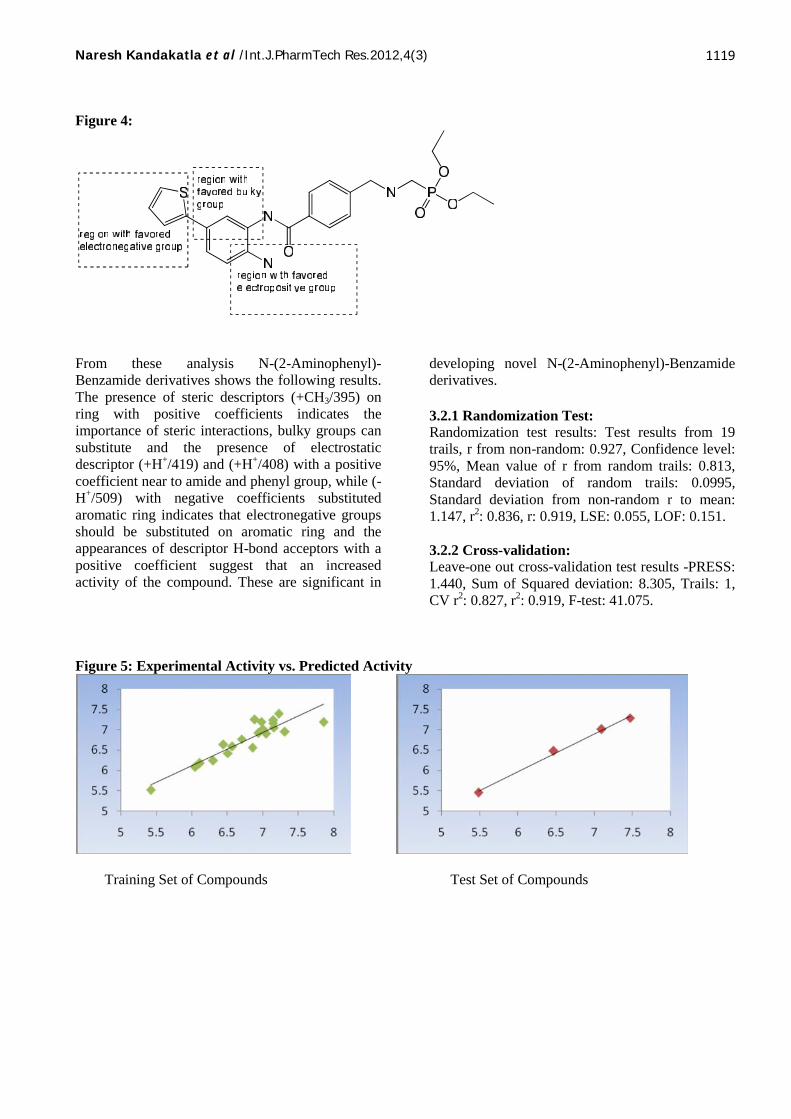
in Figure2. The molecular field was created usingas probes, the methyl group and a proton for stericand electrostatic interactions respectively. Thesteric (CH3) and electrostatic (H+) descriptors inthe MFA-QSAR equations specify the regionswhere variations in the structural features (steric orelectrostatic) of different compounds in the trainingset shows. The numbers accompanying descriptorsin the equations represent their positions in thethree-dimensional MFA grid (Figure 3). The MFA-QSAR equation is expressed as follow-
Mean Activity: 6.72; Sum of squared deviations from the mean (SD): 8.30; Lack of fit (LOF): 0.067; r2: 0.927;r2adj: 0.908; F-test: 48.164; Least square error (LSE): 0.024; r: 0.963; C(p): -12.921; XV r2: 0.815; Boot strap(BS) r2: 0.894; BS r2err: 0.003; N obs: 25.000; N vas: 6.000; Press: 1.053; Dep SD: 8.306; Dep mean: 6.729.
A QSAR equation is generally acceptable if thesquared correlation coefficient (r2) is approximately0.7 or higher. The r2 value is a relative measure ofthe quality of fit of the model. Its value depends onthe overall variance of the data. An r2
CV, a squaredcorrelation coefficient generated during a cross-validation procedure, is used as a diagnostic tool toevaluate the predictive power of an equation. Cross-validation is often used to determine how large a
model (number of terms) can be used for a givendata set. The predictive power of the model wascalculated by using the following equation-
r2pred = (SD − PRESS)/SD (V)
Where SD is the sum of the squared deviationsbetween the biological activities of each moleculesand the mean activity of the training set of
Naresh Kandakatla et al /Int.J.PharmTech Res.2012,4(3) 1118
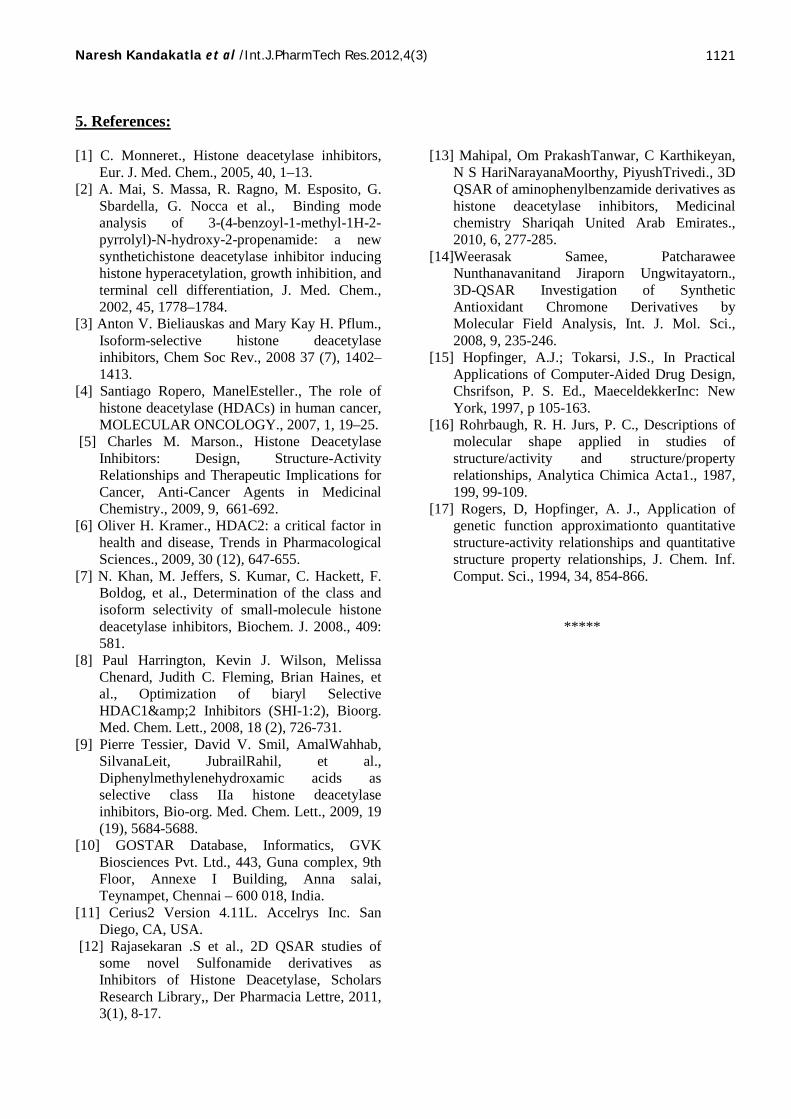
molecules and PRESS is the sum of squareddeviations between the predicted and experimentalactivity values for every molecule in the test set. The predicted activity obtained from equation (IV)and experimental activity of the training set and testset molecules are summarized in Table 2. The graphof experimental versus predicted pIC50 values are
shown in Figure 5. MFA- 3D QSAR model showsgood statistical results with r2
CV: 0.815, r2: 0.927and r2
pred = 0.845.
Figure 2 Superimposition of the aligned molecules in the training set
Figure 3& 4.Mapping of the best MFA model and the interaction points. The most active compound, diethyl(((4-((2-amino-5-(thiophen-2-yl) phenyl) carbamoyl) benzyl) amino) methyl) phosphonate (1), is displayed inbackground as reference.
Naresh Kandakatla et al /Int.J.PharmTech Res.2012,4(3) 1119
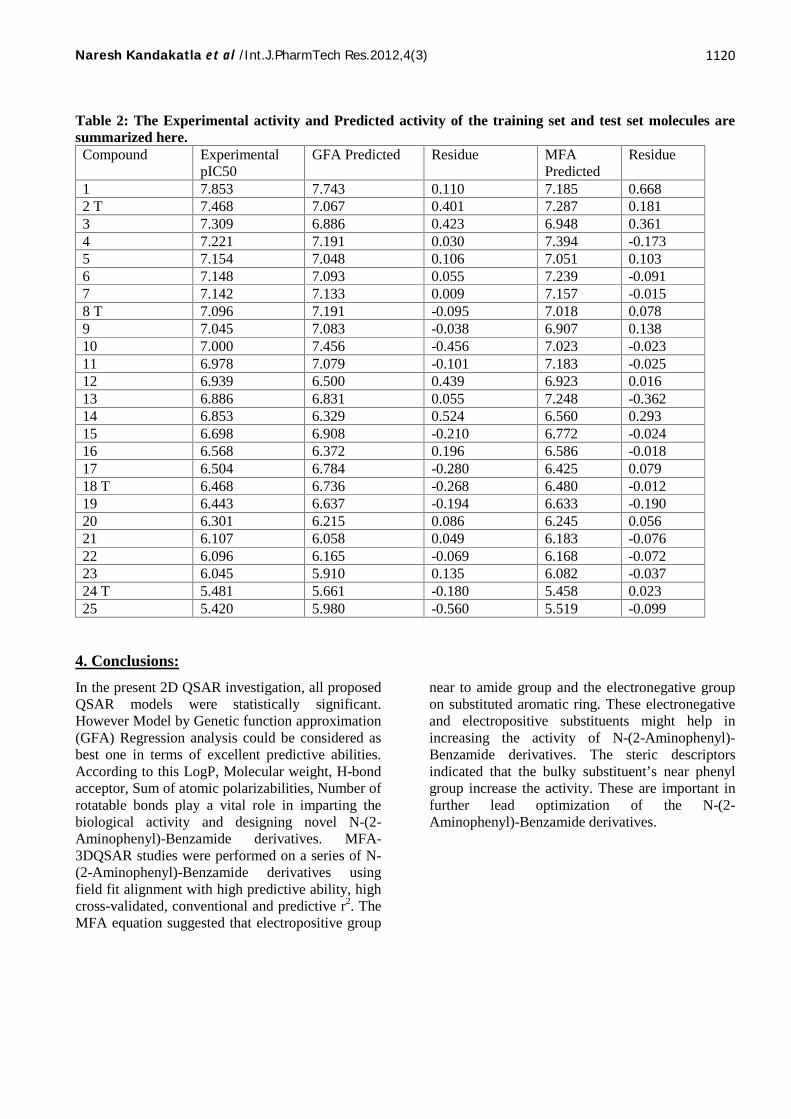
Figure 4:
From these analysis N-(2-Aminophenyl)-Benzamide derivatives shows the following results.The presence of steric descriptors (+CH3/395) onring with positive coefficients indicates theimportance of steric interactions, bulky groups cansubstitute and the presence of electrostaticdescriptor (+H+/419) and (+H+/408) with a positivecoefficient near to amide and phenyl group, while (-H+/509) with negative coefficients substitutedaromatic ring indicates that electronegative groupsshould be substituted on aromatic ring and theappearances of descriptor H-bond acceptors with apositive coefficient suggest that an increasedactivity of the compound. These are significant in
3.2.1 Randomization Test:Randomization test results: Test results from 19trails, r from non-random: 0.927, Confidence level:95%, Mean value of r from random trails: 0.813,Standard deviation of random trails: 0.0995,Standard deviation from non-random r to mean:1.147, r2: 0.836, r: 0.919, LSE: 0.055, LOF: 0.151.
3.2.2 Cross-validation:Leave-one out cross-validation test results -PRESS:1.440, Sum of Squared deviation: 8.305, Trails: 1,CV r2: 0.827, r2: 0.919, F-test: 41.075.
Figure 5: Experimental Activity vs. Predicted Activity
Training Set of Compounds Test Set of Compounds
Naresh Kandakatla et al /Int.J.PharmTech Res.2012,4(3) 1120
Table 2: The Experimental activity and Predicted activity of the training set and test set molecules aresummarized here.Compound Experimental
In the present 2D QSAR investigation, all proposedQSAR models were statistically significant.However Model by Genetic function approximation(GFA) Regression analysis could be considered asbest one in terms of excellent predictive abilities.According to this LogP, Molecular weight, H-bondacceptor, Sum of atomic polarizabilities, Number ofrotatable bonds play a vital role in imparting thebiological activity and designing novel N-(2-Aminophenyl)-Benzamide derivatives. MFA-3DQSAR studies were performed on a series of N-(2-Aminophenyl)-Benzamide derivatives usingfield fit alignment with high predictive ability, highcross-validated, conventional and predictive r2. TheMFA equation suggested that electropositive group
near to amide group and the electronegative groupon substituted aromatic ring. These electronegativeand electropositive substituents might help inincreasing the activity of N-(2-Aminophenyl)-Benzamide derivatives. The steric descriptorsindicated that the bulky substituent’s near phenylgroup increase the activity. These are important infurther lead optimization of the N-(2-Aminophenyl)-Benzamide derivatives.
Naresh Kandakatla et al /Int.J.PharmTech Res.2012,4(3) 1121
5. References:
[1] C. Monneret., Histone deacetylase inhibitors,Eur. J. Med. Chem., 2005, 40, 1–13.
[2] A. Mai, S. Massa, R. Ragno, M. Esposito, G.Sbardella, G. Nocca et al., Binding modeanalysis of 3-(4-benzoyl-1-methyl-1H-2-pyrrolyl)-N-hydroxy-2-propenamide: a newsynthetichistone deacetylase inhibitor inducinghistone hyperacetylation, growth inhibition, andterminal cell differentiation, J. Med. Chem.,2002, 45, 1778–1784.
[3] Anton V. Bieliauskas and Mary Kay H. Pflum.,Isoform-selective histone deacetylaseinhibitors, Chem Soc Rev., 2008 37 (7), 1402–1413.
[4] Santiago Ropero, ManelEsteller., The role ofhistone deacetylase (HDACs) in human cancer,MOLECULAR ONCOLOGY., 2007, 1, 19–25.
[5] Charles M. Marson., Histone DeacetylaseInhibitors: Design, Structure-ActivityRelationships and Therapeutic Implications forCancer, Anti-Cancer Agents in MedicinalChemistry., 2009, 9, 661-692.
[6] Oliver H. Kramer., HDAC2: a critical factor inhealth and disease, Trends in PharmacologicalSciences., 2009, 30 (12), 647-655.
[7] N. Khan, M. Jeffers, S. Kumar, C. Hackett, F.Boldog, et al., Determination of the class andisoform selectivity of small-molecule histonedeacetylase inhibitors, Biochem. J. 2008., 409:581.
[8] Paul Harrington, Kevin J. Wilson, MelissaChenard, Judith C. Fleming, Brian Haines, etal., Optimization of biaryl SelectiveHDAC1&2 Inhibitors (SHI-1:2), Bioorg.Med. Chem. Lett., 2008, 18 (2), 726-731.
[9] Pierre Tessier, David V. Smil, AmalWahhab,SilvanaLeit, JubrailRahil, et al.,Diphenylmethylenehydroxamic acids asselective class IIa histone deacetylaseinhibitors, Bio-org. Med. Chem. Lett., 2009, 19(19), 5684-5688.
[10] GOSTAR Database, Informatics, GVKBiosciences Pvt. Ltd., 443, Guna complex, 9thFloor, Annexe I Building, Anna salai,Teynampet, Chennai – 600 018, India.
[11] Cerius2 Version 4.11L. Accelrys Inc. SanDiego, CA, USA.
[12] Rajasekaran .S et al., 2D QSAR studies ofsome novel Sulfonamide derivatives asInhibitors of Histone Deacetylase, ScholarsResearch Library,, Der Pharmacia Lettre, 2011,3(1), 8-17.
[13] Mahipal, Om PrakashTanwar, C Karthikeyan,N S HariNarayanaMoorthy, PiyushTrivedi., 3DQSAR of aminophenylbenzamide derivatives ashistone deacetylase inhibitors, Medicinalchemistry Shariqah United Arab Emirates.,2010, 6, 277-285.
[14]Weerasak Samee, PatcharaweeNunthanavanitand Jiraporn Ungwitayatorn.,3D-QSAR Investigation of SyntheticAntioxidant Chromone Derivatives byMolecular Field Analysis, Int. J. Mol. Sci.,2008, 9, 235-246.
[15] Hopfinger, A.J.; Tokarsi, J.S., In PracticalApplications of Computer-Aided Drug Design,Chsrifson, P. S. Ed., MaeceldekkerInc: NewYork, 1997, p 105-163.
[16] Rohrbaugh, R. H. Jurs, P. C., Descriptions ofmolecular shape applied in studies ofstructure/activity and structure/propertyrelationships, Analytica Chimica Acta1., 1987,199, 99-109.
[17] Rogers, D, Hopfinger, A. J., Application ofgenetic function approximationto quantitativestructure-activity relationships and quantitativestructure property relationships, J. Chem. Inf.Comput. Sci., 1994, 34, 854-866.