UNITED STATES SECURITIES AND EXCHANGE COMMISSION Washington, D.C. 20549 FORM 10-K È ANNUAL REPORT PURSUANT TO SECTION 13 OR 15(d) OF THE SECURITIES EXCHANGE ACT OF 1934 For the fiscal year ended December 31, 2015 or ‘ TRANSITION REPORT PURSUANT TO SECTION 13 OR 15(d) OF THE SECURITIES EXCHANGE ACT OF 1934 For the transition period from to Commission file number 001-12019 QUAKER CHEMICAL CORPORATION (Exact name of Registrant as specified in its charter) A Pennsylvania Corporation No. 23-0993790 (State or other jurisdiction of incorporation or organization) (I.R.S. Employer Identification No.) One Quaker Park, 901 E. Hector Street, Conshohocken, Pennsylvania 19428-2380 (Address of principal executive offices) (Zip Code) Registrant’s telephone number, including area code: (610) 832-4000 Securities registered pursuant to Section 12(b) of the Act: Title of each class Name of each Exchange on which registered Common Stock, $1.00 par value New York Stock Exchange Securities registered pursuant to Section 12(g) of the Act: None Indicate by check mark if the Registrant is a well-known seasoned issuer, as defined in Rule 405 of the Securities Act. Yes È No ‘ Indicate by check mark if the Registrant is not required to file reports pursuant to Section 13 or Section 15(d) of the Act. Yes ‘ No È Indicate by check mark whether the Registrant (1) has filed all reports required to be filed by Section 13 or 15(d) of the Securities Exchange Act of 1934 during the preceding 12 months (or for such shorter period that the registrant was required to file such reports), and (2) has been subject to such filing requirements for the past 90 days. Yes È No ‘ Indicate by check mark whether the Registrant has submitted electronically and posted on its corporate Web site, if any, every Interactive Data File required to be submitted and posted pursuant to Rule 405 of Regulation S-T (§ 232.405 of this chapter) during the preceding 12 months (or for such shorter period that the Registrant was required to submit and post such files). Yes È No ‘ Indicate by check mark if disclosure of delinquent filers pursuant to Item 405 of Regulation S-K (§ 229.405 of this chapter) is not contained herein, and will not be contained, to the best of Registrant’s knowledge, in definitive proxy or information statements incorporated by reference in Part III of this Form 10-K or any amendment to this Form 10-K. È Indicate by check mark whether the Registrant is a large accelerated filer, an accelerated filer, a non-accelerated filer, or a smaller reporting company. See the definitions of “large accelerated filer,” “accelerated filer” and “smaller reporting company” in Rule 12b-2 of the Exchange Act. Large accelerated filer È Accelerated filer ‘ Non-accelerated filer ‘ (Do not check if smaller reporting company) Smaller reporting company ‘ Indicate by check mark whether the Registrant is a shell company (as defined in Rule 12b-2 of the Act). Yes ‘ No È State the aggregate market value of voting and non-voting common equity held by non-affiliates of the Registrant. (The aggregate market value is computed by reference to the last reported sale on the New York Stock Exchange on June 30, 2015): $1,170,356,128 Indicate the number of shares outstanding of each of the Registrant’s classes of common stock as of the latest practicable date: 13,207,137 shares of Common Stock, $1.00 Par Value, as of January 31, 2016. DOCUMENTS INCORPORATED BY REFERENCE Portions of the Registrant’s definitive Proxy Statement relating to the Annual Meeting of Shareholders to be held on May 4, 2016 are incorporated by reference into Part III.
Transcript
UNITED STATESSECURITIES AND EXCHANGE COMMISSION
Washington, D.C. 20549
FORM 10-KÈ ANNUAL REPORT PURSUANT TO SECTION 13 OR 15(d) OF THE SECURITIES
EXCHANGE ACT OF 1934For the fiscal year ended December 31, 2015
or
‘ TRANSITION REPORT PURSUANT TO SECTION 13 OR 15(d) OF THE SECURITIESEXCHANGE ACT OF 1934
For the transition period from to
Commission file number 001-12019
QUAKER CHEMICAL CORPORATION(Exact name of Registrant as specified in its charter)
A Pennsylvania Corporation No. 23-0993790(State or other jurisdiction of
incorporation or organization)(I.R.S. Employer
Identification No.)
One Quaker Park, 901 E. Hector Street,Conshohocken, Pennsylvania 19428-2380
(Address of principal executive offices) (Zip Code)
Registrant’s telephone number, including area code: (610) 832-4000
Securities registered pursuant to Section 12(b) of the Act:Title of each class Name of each Exchange on which registered
Common Stock, $1.00 par value New York Stock Exchange
Securities registered pursuant to Section 12(g) of the Act:
None
Indicate by check mark if the Registrant is a well-known seasoned issuer, as defined in Rule 405 of the Securities Act. Yes È No ‘
Indicate by check mark if the Registrant is not required to file reports pursuant to Section 13 or Section 15(d) of theAct. Yes ‘ No È
Indicate by check mark whether the Registrant (1) has filed all reports required to be filed by Section 13 or 15(d) of the SecuritiesExchange Act of 1934 during the preceding 12 months (or for such shorter period that the registrant was required to file such reports), and(2) has been subject to such filing requirements for the past 90 days. Yes È No ‘
Indicate by check mark whether the Registrant has submitted electronically and posted on its corporate Web site, if any, every InteractiveData File required to be submitted and posted pursuant to Rule 405 of Regulation S-T (§ 232.405 of this chapter) during the preceding 12months (or for such shorter period that the Registrant was required to submit and post such files). Yes È No ‘
Indicate by check mark if disclosure of delinquent filers pursuant to Item 405 of Regulation S-K (§ 229.405 of this chapter) is notcontained herein, and will not be contained, to the best of Registrant’s knowledge, in definitive proxy or information statements incorporatedby reference in Part III of this Form 10-K or any amendment to this Form 10-K. È
Indicate by check mark whether the Registrant is a large accelerated filer, an accelerated filer, a non-accelerated filer, or a smallerreporting company. See the definitions of “large accelerated filer,” “accelerated filer” and “smaller reporting company” in Rule 12b-2 of theExchange Act.
Large accelerated filer È Accelerated filer ‘
Non-accelerated filer ‘ (Do not check if smaller reporting company) Smaller reporting company ‘
Indicate by check mark whether the Registrant is a shell company (as defined in Rule 12b-2 of the Act). Yes ‘ No È
State the aggregate market value of voting and non-voting common equity held by non-affiliates of the Registrant. (The aggregate marketvalue is computed by reference to the last reported sale on the New York Stock Exchange on June 30, 2015): $1,170,356,128
Indicate the number of shares outstanding of each of the Registrant’s classes of common stock as of the latest practicable date:13,207,137 shares of Common Stock, $1.00 Par Value, as of January 31, 2016.
DOCUMENTS INCORPORATED BY REFERENCE
Portions of the Registrant’s definitive Proxy Statement relating to the Annual Meeting of Shareholders to be held on May 4, 2016 areincorporated by reference into Part III.
PART I
As used in this Report, the terms “Quaker,” the “Company,” “we” and “our” refer to Quaker ChemicalCorporation, its subsidiaries, and associated companies, unless the context otherwise requires.
Item 1. Business.
General Description
Quaker develops, produces, and markets a broad range of formulated chemical specialty products and offerschemical management services (“CMS”) for various heavy industrial and manufacturing applications in a globalportfolio throughout its four regions: the North America region, the Europe, Middle East and Africa (“EMEA”)region, the Asia/Pacific region and the South America region. The principal products and services in Quaker’sglobal portfolio include: (i) rolling lubricants (used by manufacturers of steel in the hot and cold rolling of steeland by manufacturers of aluminum in the hot rolling of aluminum); (ii) corrosion preventives (used by steel andmetalworking customers to protect metal during manufacture, storage, and shipment); (iii) metal finishingcompounds (used to prepare metal surfaces for special treatments such as galvanizing and tin plating and toprepare metal for further processing); (iv) machining and grinding compounds (used by metalworking customersin cutting, shaping, and grinding metal parts which require special treatment to enable them to tolerate themanufacturing process, achieve closer tolerance, and improve tool life); (v) forming compounds (used tofacilitate the drawing and extrusion of metal products); (vi) bio-lubricants (mainly used in machinery in theforestry and construction industries); (vii) hydraulic fluids (used by steel, metalworking, and other customers tooperate hydraulic equipment); (viii) chemical milling maskants for the aerospace industry; (ix) temporary andpermanent coatings for metal and concrete products; (x) construction products, such as flexible sealants andprotective coatings, for various applications; (xi) specialty greases; (xii) die casting lubricants; and(xiii) programs to provide CMS. Individual product lines representing more than 10% of consolidated revenuesfor any of the past three years are as follows:
2015 2014 2013
Rolling lubricants 18.6% 20.1% 20.7%Machining and grinding compounds 15.3% 16.3% 17.7%Hydraulic fluids 12.6% 13.0% 12.9%Corrosion preventives 12.0% 12.5% 12.5%
A substantial portion of Quaker’s sales worldwide are made directly through its own employees and itsCMS programs with the balance being handled through distributors and agents. Quaker employees visit theplants of customers regularly, actually work on site, and, through training and experience, identify productionneeds which can be resolved or alleviated either by adapting Quaker’s existing products or by applying newformulations developed in Quaker’s laboratories. Quaker relies less on the use of advertising, and more heavilyupon its reputation in the markets which it serves. Generally, separate manufacturing facilities of a singlecustomer are served by different personnel.
As part of the Company’s CMS, certain third-party product sales to customers are managed by theCompany. Where the Company acts as principal, revenues are recognized on a gross reporting basis at the sellingprice negotiated with its customers. Where the Company acts as an agent, such revenue is recorded using the netreporting method as service revenues at the amount of the administrative fee earned by the Company for orderingthe goods. Third-party products transferred under arrangements resulting in net reporting revenue totaled $48.6million, $46.8 million and $41.6 million for 2015, 2014 and 2013, respectively.
The Company recognizes revenue in accordance with the terms of the underlying agreements, when title andrisk of loss have been transferred, when collectability is reasonably assured, and when pricing is fixed ordeterminable. This generally occurs for product sales when products are shipped to customers; for consignment-
1
type arrangements, upon usage by the customer; and for services, when they are performed. Related to otherincome generation, Quaker receives license fees and royalties and includes them in other income when theamounts are recognized in accordance with their agreed-upon terms, when performance obligations are satisfied,when the amount is fixed or determinable, and when collectability is reasonably assured.
During 2015, the Company expanded its business through the July 2015 acquisition of Verkol S.A.(“Verkol”) for approximately $26.0 million, net of cash acquired and a post-closing adjustment settled in January2016. Verkol is a leading specialty grease and other lubricants manufacturer based in northern Spain. Verkol is amarket leader with world-class grease manufacturing capabilities and state-of-the-art research and developmentfacilities, selling products into industrial end markets with a particular strength serving the steel industry. Also,Verkol brings a unique technology in continuous casting products that will provide the Company with cross-selling opportunities to its global steel customer base.
Competition
The chemical specialty industry comprises a number of companies of similar size as well as companieslarger and smaller than Quaker. Quaker cannot readily determine its precise position in every industry it serves.Based on information available to Quaker, however, it is estimated that Quaker holds a leading global position(among a group in excess of 25 other suppliers) in the market for process fluids to produce sheet steel. It is alsobelieved that Quaker holds significant global positions in the markets for process fluids in portions of theautomotive and industrial markets. The offerings of many of our competitors differ from those of Quaker; someoffer a broad portfolio of fluids, including general lubricants, while others have a more specialized product range.All competitors provide different levels of technical services to individual customers. Competition in the industryis based primarily on the ability to provide products that meet the needs of the customer, render technicalservices and laboratory assistance to the customer and, to a lesser extent, on price.
Major Customers and Markets
In 2015, Quaker’s five largest customers (each composed of multiple subsidiaries or divisions with semi-autonomous purchasing authority) accounted for approximately 18% of our consolidated net sales, with thelargest customer (Arcelor-Mittal Group) accounting for approximately 8% of our consolidated net sales. Asignificant portion of Quaker’s revenues are realized from the sale of process fluids and services tomanufacturers of steel, automobiles, aircraft, appliances, and durable goods, and, therefore, Quaker is subject tothe same business cycles as those experienced by these manufacturers and their customers. Quaker’s financialperformance is generally correlated to the volume of global production within the industries it serves, rather thandiscretely related to financial performance in such industries. Furthermore, steel customers typically have limitedmanufacturing locations compared to metalworking customers and generally use higher volumes of products at asingle location.
Raw Materials
Quaker uses over 1,000 various raw materials including mineral oils and derivatives, animal fats andderivatives, vegetable oils and derivatives, ethylene derivatives, solvents, surface active agents, and a widevariety of other organic and inorganic compounds. In 2015, three raw material groups (mineral oils andderivatives, animal fats and derivatives, and vegetable oils and derivatives) each accounted for approximately10% or more of the total cost of Quaker’s raw material purchases. The price of mineral oil and its derivatives canbe affected by the price of crude oil and industry refining capacity. In addition, animal fat and vegetable oilprices are impacted by biodiesel consumption which is affected by the price of crude oil. Accordingly, significantfluctuations in the price of crude oil could have a material effect upon certain products used in the Company’sbusiness. Many of the raw materials used by Quaker are “commodity” chemicals which can have volatile prices.Accordingly, Quaker’s earnings could be affected by market changes in raw material prices. Reference is madeto the disclosure contained in Item 7A of this Report.
2
Patents and Trademarks
Quaker has a limited number of patents and patent applications, including patents issued, applied for, oracquired in the United States and in various foreign countries, some of which may prove to be material to itsbusiness. Principal reliance is placed upon Quaker’s proprietary formulae and the application of its skills andexperience to meet customer needs. Quaker’s products are identified by trademarks that are registered throughoutits marketed area.
Research and Development – Laboratories
Quaker’s research and development laboratories are directed primarily toward applied research anddevelopment since the nature of Quaker’s business requires continual modification and improvement offormulations to provide chemical specialties to satisfy customer requirements. Quaker maintains quality controllaboratory facilities in each of its manufacturing locations. In addition, Quaker maintains facilities inConshohocken, Pennsylvania; Santa Fe Springs, California; Batavia, New York; Aurora, Illinois; Dayton, Ohio;Uithoorn, The Netherlands; Karlshamn, Sweden; Navarra, Spain; Rio de Janiero, Brazil; and Qingpu, China that,in addition to quality control, are devoted primarily to applied research and development.
Research and development costs are expensed as incurred. Research and development expenses during2015, 2014 and 2013 were $22.1 million, $22.1 million and $21.6 million, respectively.
Most of Quaker’s subsidiaries and associated companies also have laboratory facilities. Although not ascomplete as the laboratories mentioned above, these facilities are generally sufficient for the requirements of thecustomers being served. If problems are encountered which cannot be resolved by local laboratories, suchproblems are generally referred to the laboratory staff in Conshohocken, Santa Fe Springs, Uithoorn or Qingpu.
Regulatory Matters
In order to facilitate compliance with applicable federal, state, and local statutes and regulations relating tooccupational health and safety and protection of the environment, the Company has an ongoing program of siteassessment for the purpose of identifying capital expenditures or other actions that may be necessary to complywith such requirements. The program includes periodic inspections of each facility by Quaker and/or independentexperts, as well as ongoing inspections and training by on-site personnel. Such inspections address operationalmatters, record keeping, reporting requirements and capital improvements. Capital expenditures directed solelyor primarily to regulatory compliance amounted to approximately $2.3 million, $0.8 million and $0.6 million in2015, 2014 and 2013, respectively. In 2016, the Company expects to incur approximately $2.1 million for capitalexpenditures directed primarily to regulatory compliance.
Number of Employees
On December 31, 2015, Quaker’s consolidated companies had approximately 2,040 full-time employees ofwhom approximately 630 were employed by the parent company and its U.S. subsidiaries and approximately1,410 were employed by its non-U.S. subsidiaries. Associated companies of Quaker (in which it owns less than50% and has significant influence) employed approximately 70 people on December 31, 2015.
Company Segmentation
The Company’s reportable operating segments evidence the structure of the Company’s internalorganization, the method by which the Company’s resources are allocated and the manner by which theCompany assesses its performance. The Company’s reportable operating segments are organized by geographyas follows: North America, EMEA, Asia/Pacific and South America. See Note 5 of Notes to ConsolidatedFinancial Statements included in Item 8 of this Report.
3
Non-U.S. Activities
Since significant revenues and earnings are generated by non-U.S. operations, Quaker’s financial results areaffected by currency fluctuations, particularly between the U.S. dollar and the euro, the Brazilian real, theMexican peso, the Chinese renminbi and the Indian rupee, and the impact of those currency fluctuations on theunderlying economies. Incorporated by reference is (i) the foreign exchange risk information contained inItem 7A of this Report, (ii) the geographic information in Note 5 of Notes to Consolidated Financial Statementsincluded in Item 8 of this Report and (iii) information regarding risks attendant to foreign operations included inItem 1A of this Report.
Quaker on the Internet
Financial results, news and other information about Quaker can be accessed from the Company’s website athttp://www.quakerchem.com. This site includes important information on the Company’s locations, products andservices, financial reports, news releases and career opportunities. The Company’s periodic and current reportson Forms 10-K, 10-Q, 8-K, and other filings, including exhibits and supplemental schedules filed therewith, andamendments to those reports, filed with the Securities and Exchange Commission (“SEC”) are available on theCompany’s website, free of charge, as soon as reasonably practicable after they are electronically filed with orfurnished to the SEC. Information contained on, or that may be accessed through, the Company’s website is notincorporated by reference in this Report and, accordingly, you should not consider that information part of thisReport.
Factors that May Affect Our Future Results
(Cautionary Statements under the Private Securities Litigation Reform Act of 1995)
Certain information included in this Report and other materials filed or to be filed by Quaker with the SEC(as well as information included in oral statements or other written statements made or to be made by us) containor may contain forward-looking statements within the meaning of Section 27A of the Securities Act of 1933, asamended, and Section 21E of the Securities Exchange Act of 1934, as amended. These statements can beidentified by the fact that they do not relate strictly to historical or current facts. We have based these forward-looking statements on our current expectations about future events. These forward-looking statements includestatements with respect to our beliefs, plans, objectives, goals, expectations, anticipations, intentions, financialcondition, results of operations, future performance, and business, including:
• statements relating to our business strategy;
• our current and future results and plans; and
• statements that include the words “may,” “could,” “should,” “would,” “believe,” “expect,”“anticipate,” “estimate,” “intend,” “plan” or similar expressions.
Such statements include information relating to current and future business activities, operational matters,capital spending, and financing sources. From time to time, oral or written forward-looking statements are alsoincluded in Quaker’s periodic reports on Forms 10-K, 10-Q and 8-K, press releases, and other materials releasedto, or statements made to, the public.
Any or all of the forward-looking statements in this Report, in Quaker’s Annual Report to Shareholders for2015 and in any other public statements we make may turn out to be wrong. This can occur as a result ofinaccurate assumptions or as a consequence of known or unknown risks and uncertainties. Many factorsdiscussed in this Report will be important in determining our future performance. Consequently, actual resultsmay differ materially from those that might be anticipated from our forward-looking statements.
We undertake no obligation to publicly update any forward-looking statements, whether as a result of newinformation, future events or otherwise. However, any further disclosures made on related subjects in Quaker’s
4
subsequent reports on Forms 10-K, 10-Q, 8-K and other related filings should be consulted. Our forward-lookingstatements are subject to risks, uncertainties and assumptions about us and our operations that are subject tochange based on various important factors, some of which are beyond our control. A major risk is that thedemand for the Company’s products and services is largely derived from the demand for its customers’ products,which subjects the Company to uncertainties related to downturns in a customer’s business and unanticipatedcustomer production shutdowns. Other major risks and uncertainties include, but are not limited to, significantincreases in raw material costs, customer financial stability, worldwide economic and political conditions,foreign currency fluctuations, future terrorist attacks and other acts of violence, each of which is discussed ingreater detail in Item 1A of this Report. Furthermore, the Company is subject to the same business cycles asthose experienced by steel, automobile, aircraft, appliance, and durable goods manufacturers. These risks,uncertainties, and possible inaccurate assumptions relevant to our business could cause our actual results to differmaterially from expected and historical results. Other factors beyond those discussed in this Report could alsoadversely affect us. Therefore, we caution you not to place undue reliance on our forward-looking statements.This discussion is provided as permitted by the Private Securities Litigation Reform Act of 1995.
Item 1A. Risk Factors.
Changes to the industries and markets that Quaker serves could have a material adverse effect on theCompany’s liquidity, financial position and results of operations.
The business environment in which the Company operates remains uncertain. The Company is subject to thesame business cycles as those experienced by steel, automobile, aircraft, appliance, and durable goodsmanufacturers. A major risk is that the Company’s demand is largely derived from the global demand for itscustomers’ products, which subjects the Company to uncertainties related to downturns in our customers’business and unanticipated customer production shutdowns or curtailments. The Company has limited ability toadjust its cost level contemporaneously with changes in sales and gross margins. Thus, a significant downturn insales or gross margins due to reductions in global production within the industries the Company serves, weakend-user markets, loss of a significant customer, and/or rising raw material costs could have a material adverseeffect on the Company’s liquidity, financial position, and results of operations.
The specialty chemical industry comprises a number of companies of similar size as well as companieslarger and smaller than Quaker. It is estimated that Quaker holds a leading and significant global position in themarkets for process fluids to produce sheet steel, and significant global positions in portions of the automotiveand industrial markets. The industry is highly competitive, and a number of companies with significant financialresources and/or customer relationships compete with us to provide similar products and services. Ourcompetitors may be positioned to offer more favorable pricing and service terms, potentially resulting in reducedprofitability and/or a loss of market share for us. In addition, several competitors could potentially consolidatetheir businesses to gain scale to better position their product offerings, which could have a negative impact onour profitability and market share. Historically, competition in the industry has been based primarily on theability to provide products that meet the needs of the customer and render technical services and laboratoryassistance to the customer and, to a lesser extent, on price. Factors critical to the Company’s business includesuccessfully differentiating the Company’s offering from its competition, operating efficiently and profitably as aglobally integrated whole, and increasing market share and customer penetration through internally developedbusiness programs and strategic acquisitions.
Our business depends on attracting and retaining qualified management and other key personnel.
The unanticipated departure of any key member of our management team or other key personnel could havean adverse effect on our business. Given the relative size of the Company and the breadth of its global operations,there are a limited number of qualified personnel to assume the responsibilities of management level or other keyemployees. In addition, because of the specialized and technical nature of our business, our future performance isdependent on our ability to attract and retain qualified management, commercial, technical, or other key
5
personnel. Competition for such personnel is intense, and we may be unable to continue to attract or retain suchpersonnel. In an effort to mitigate such risks, the Company utilizes retention bonuses, offers competitive pay andmaintains continued succession planning, but there can be no assurance that these mitigating factors will beadequate to attract or retain qualified management or other key personnel.
Inability to obtain sufficient price increases or contract concessions to offset increases in the costs of rawmaterials could result in a loss of sales, gross margin, and/or market share and could have a material adverseeffect on the Company’s liquidity, financial position and results of operations. Conversely, an inability toimplement timely price decreases to compensate for changes in raw material costs could result in a loss ofsales, gross margin, and/or market share and could have a material adverse effect on the Company’s liquidity,financial position and results of operations.
Quaker uses over 1,000 various raw materials, including mineral oils and derivatives, animal fats andderivatives, vegetable oils and derivatives, ethylene derivatives, solvents, surface active agents, and a widevariety of other organic and inorganic compounds. In 2015, three raw material groups (mineral oils andderivatives, animal fats and derivatives, and vegetable oils and derivatives) each accounted for approximately10% or more of the total cost of Quaker’s raw material purchases. The price of mineral oils and derivatives canbe affected by crude oil pricing and industry refining capacity. Animal fat and vegetable oil prices also can beimpacted by biodiesel consumption which is affected by the price of crude oil. In addition, many of the rawmaterials used by Quaker are “commodity” chemicals, which can experience significant price volatility.Accordingly, Quaker’s earnings can be impacted by market changes in raw material prices.
Although the Company has been successful in the past in recovering a substantial amount of the rawmaterial cost increases while retaining its customers, there can be no assurance that the Company can continue torecover higher raw material costs or retain customers in the future. Conversely, the Company has been successfulin maintaining acceptable levels of margin in periods of raw material price decline, but there can be no assurancethat the Company can continue to maintain its margins through appropriate price and contract concessions, whileretaining all customers in the future. As a result of the Company’s past pricing actions, in periods of rising anddeclining costs, customers may become more likely to consider competitors’ products, some of which may beavailable at a lower cost. A significant loss of customers could result in a material adverse effect on theCompany’s liquidity, financial position, and results of operations.
Lack of availability of raw materials and issues associated with sourcing from some single suppliers and somesuppliers in volatile economic environments could have a material adverse effect on the Company’s liquidity,financial position and results of operations.
The chemical specialty industry can experience some tightness of supply for certain raw materials. Inaddition, in some cases, we source from a single supplier and/or suppliers in economies that have experiencedinstability. Any significant disruption in supply could affect our ability to obtain raw materials, which could havea material adverse effect on our liquidity, financial position and results of operations. In addition, certain of theCompany’s raw materials are subject to various regulatory laws, and a change in the ability to legally use suchraw materials may impact Quaker’s liquidity, financial position and results of operations.
Loss of a significant manufacturing facility may materially and adversely affect the Company’s liquidity,financial position and results of operations.
Quaker has multiple manufacturing facilities throughout the world. In certain countries, such as Brazil andChina, there is only one such facility. If one of the Company’s facilities is damaged to such extent thatproduction is halted for an extended period, the Company may not be able to timely supply its customers. Thiscould result in a loss of sales over an extended period, or permanently. The Company does take steps to mitigateagainst this risk, including contingency planning and procuring property and casualty insurance (including
6
business interruption insurance). Nevertheless, the loss of sales in any one region over any extended period oftime could have a significant material adverse effect on Quaker’s liquidity, financial position and results ofoperations.
Bankruptcy of a significant customer or a closure of a customer’s major site could have a material adverseeffect on our liquidity, financial position and results of operations.
A significant portion of Quaker’s revenues is derived from sales to customers in the steel and automotiveindustries; including some of our larger customers, where a number of bankruptcies have occurred in the past andwhere companies have experienced financial difficulties. As part of the bankruptcy process, the Company’s pre-petition receivables may not be realized and customer manufacturing sites may be closed or contracts voided.The bankruptcy of a major customer could have a material adverse effect on the Company’s liquidity, financialposition and results of operations. Also, steel customers typically have limited manufacturing locations comparedto metalworking customers and generally use higher volumes of products at a single location. The loss or closureof one or more steel mills or other major sites of a significant customer could have a material adverse effect onQuaker’s business.
During 2015, our five largest customers (each composed of multiple subsidiaries or divisions with semi-autonomous purchasing authority) together accounted for approximately 18% of our consolidated net sales, withthe largest customer (Arcelor-Mittal Group) accounting for approximately 8% of our consolidated net sales.
Impairment evaluations of goodwill, intangible assets, investments or other long-lived assets could result in areduction in our recorded asset values, which could have a material adverse effect on the Company’s liquidity,financial position and results of operation.
The Company performs reviews of goodwill and indefinite-lived intangible assets on an annual basis, ormore frequently if triggering events indicate a possible impairment. The Company tests goodwill at the reportingunit level by comparing the carrying value of the net assets of the reporting unit, including goodwill, to the unit’sfair value. Similarly, the Company tests indefinite-lived intangible assets by comparing the fair value of theassets to their carrying values. If the carrying values of goodwill or indefinite-lived intangible assets exceed theirfair value, the goodwill or indefinite-lived intangible assets may be considered impaired. In addition, theCompany will perform a review of a definite-lived intangible asset or other long-lived asset when changes incircumstances or events indicate a possible impairment. An estimate of undiscounted cash flows produced by theasset or appropriate group of assets is compared with its carrying value to determine if an impairment charge iswarranted. If any impairment or related charge is warranted, then Quaker’s liquidity, financial position andresults of operations could be materially affected.
Fluctuations in our effective tax rate could have a material effect on the Company’s liquidity, financialposition and results of operation.
The Company is subject to income taxes in both the U.S. and various foreign jurisdictions, and our domesticand international tax liabilities are subject to the allocation of income among these different jurisdictions. Oureffective tax rate is derived from a combination of local tax rates, applicable to the Company, in the variouscountries, states and other jurisdictions in which we operate. Our effective tax rate and respective tax liabilitiescould, therefore, be materially affected by changes in the mix of earnings in countries with differing statutory taxrates, changes in tax rates, expiration or lapses of tax credits or incentives, changes in uncertain tax positions,changes in the valuation of deferred tax assets and liabilities, or changes in tax laws, including matters such astransfer pricing. In addition, we are regularly under audit by tax authorities, and the final decisions of such auditscould materially affect our current tax estimates and tax positions. Any of these factors, or similar tax-relatedrisks, could cause the Company to experience an effective tax rate and tax-related payments that significantlydiffer from previous periods or current expectations, which could have a significant material effect on Quaker’sliquidity, financial position and results of operations.
7
Failure to comply with any material provision of our primary credit facility or other debt agreements couldhave a material adverse effect on our liquidity, financial position and results of operations.
The Company’s primary credit line is a $300 million unsecured multicurrency credit agreement with agroup of lenders, which matures in June 2018. The amount available under this facility can be increased to $400million at the Company’s option if lenders agree to increase their commitments and the Company satisfies certainconditions. This facility provides the availability of revolving credit borrowings, and, in general, bears interest ateither a base rate or LIBOR plus a margin based on the Company’s consolidated leverage ratio.
The facility contains covenants that impose certain restrictions, including limitations on investments,acquisitions and liens, as well as default provisions customary for facilities of its type. While these covenants andrestrictions are not currently considered to be overly restrictive, they could become more difficult to comply withas our business or financial conditions change. In addition, deterioration in the Company’s results of operationsor financial position could significantly increase borrowing costs.
Quaker is exposed to market rate risk for changes in interest rates, due to the variable interest rate applied tothe Company’s borrowings under its credit facilities. Accordingly, if interest rates rise significantly, the cost ofdebt to Quaker will increase, perhaps significantly, depending on the extent and timing of Quaker’s borrowingsunder the credit facilities. At December 31, 2015, the Company had $62.9 million in outstanding borrowingsunder its credit facilities. Incorporated by reference is the interest rate risk information contained in Item 7A ofthis Report.
Environmental laws and regulations and/or pending and future legal proceedings may materially andadversely affect the Company’s liquidity, financial position, and results of operations, as well as its reputationin the markets it serves.
The Company is a party to proceedings, cases, and requests for information from, and negotiations with,various claimants and federal and state agencies relating to various matters, including environmental matters. Anadverse result in one or more pending or on-going matters or any potential future matter of a similar nature couldmaterially and adversely affect the Company’s liquidity, financial position, and results of operations, as well asits reputation in the markets it serves. Incorporated herein by reference is the information concerning pendingasbestos-related litigation against an inactive subsidiary, amounts accrued associated with certain environmental,non-capital remediation costs and other potential commitments or contingencies highlighted in Note 23 of Notesto Consolidated Financial Statements, which appears in Item 8 of this Report.
Failure to comply with the complex global regulatory environment in which the Company operates could havean adverse impact on the Company’s reputation and/or a material adverse effect on the Company’s liquidity,financial position and results of operations.
Changes in the regulatory environment in which the Company operates, particularly, but not limited to, theUnited States, Brazil, China, India and the European Union, could lead to heightened regulatory scrutiny, couldadversely impact our ability to continue selling certain products in our domestic or foreign markets and/or couldincrease the cost of doing business. For instance, the European Union’s Registration, Authorization andRestriction of Chemicals (“REACH”), and analogous non-E.U. laws and regulations or other similar laws andregulations, could result in fines, ongoing monitoring and other future business activity, which could have amaterial adverse effect on the Company’s liquidity, financial position and results of operations. In addition, non-compliance with applicable laws and regulations, particularly the U.S. Foreign Corrupt Practices Act (“FCPA”),the U.K. Bribery Act and other similar laws and regulations, could result in a negative impact to the Company’sreputation, potential fines or ongoing monitoring, which could also have a material adverse effect on theCompany’s liquidity, financial position, and results of operations.
8
Potential product, service or other related liability claims could have a material adverse effect on theCompany’s liquidity, financial position and results of operations.
The development, manufacture and sale of specialty chemical products and other related services involveinherent exposure to potential product liability claims, service level claims, product recalls and related adversepublicity. Any of these potential product or service risks could also result in substantial and unexpectedexpenditures and affect customer confidence in our products and services, which could have a material adverseeffect on the Company’s liquidity, financial position and results of operations. Although the Company maintainsproduct and other general liability insurance, there can be no assurance that the types or levels of coveragemaintained are adequate to cover these potential risks. In addition, the Company may not be able to continue tomaintain its existing insurance coverage or obtain comparable or additional insurance coverage at a reasonablecost, if at all, in the event a significant product or service claim arises.
We may be unable to adequately protect our proprietary rights and trade brands, which may limit theCompany’s ability to compete in its markets.
Quaker has a limited number of patents and patent applications, including patents issued, applied for, oracquired in the United States and in various foreign countries, some of which may prove to be material to itsbusiness. Principal reliance is placed upon Quaker’s proprietary formulae and the application of its skills andexperience to meet customer needs. Also, Quaker’s products are identified by trademarks that are registeredthroughout its marketed area. Despite our efforts to protect such proprietary information through patent andtrademark filings, through the use of appropriate trade secret protections and through the inability of certainproducts to be effectively replicated by others, it is possible that competitors or other unauthorized third partiesmay obtain, copy, use or disclose our technologies, products, and processes. In addition, the laws and/or judicialsystems of foreign countries in which we design, manufacture, market and sell our products may afford little orno effective protection of our proprietary technology or trade brands. These potential risks to our proprietaryinformation and trade brands could subject the Company to increased competition and negatively impact ourliquidity, financial position and results of operations.
We might not be able to timely develop, manufacture and gain market acceptance of new and enhancedproducts required to maintain or expand our business.
We believe that our continued success depends on our ability to continuously develop and manufacture newproducts and product enhancements on a timely and cost-effective basis, in response to customers’ demands forhigher performance process chemicals, coatings, greases and other chemical products. Our competitors maydevelop new products or enhancements to their products that offer performance, features and lower prices thatmay render our products less competitive or obsolete, and, as a consequence, we may lose business and/orsignificant market share. The development and commercialization of new products require significantexpenditures over an extended period of time, and some products that we seek to develop may never becomeprofitable. In addition, we may not be able to develop and introduce products incorporating new technologies in atimely manner that will satisfy our customers’ future needs or achieve market acceptance.
An inability to appropriately capitalize on growth, including prior acquisitions, organic growth, or futureacquisitions, may adversely affect the Company’s liquidity, financial position and results of operations.
Quaker has completed several acquisitions recently and in the past several years and, also, may continue toseek acquisitions to grow its business in the future. The success of the Company’s growth depends on its abilityto successfully integrate these acquisitions, including, but not limited to its ability to do the following:
• successfully execute the integration or consolidation of the acquired or additional business into existingprocesses and operations;
• develop or modify financial reporting, information systems and other related financial tools to ensureoverall financial integrity and adequacy of internal control procedures;
9
• identify and take advantage of potential cost reduction opportunities, while maintaining legacybusiness and other related attributes; and
• further penetrate existing, and expand into new, markets with the product capabilities acquired inacquisitions.
In addition, the Company continues to grow organically through increased end-market growth, incrementalmarket share gains, and extending past acquisitions of adjacent technologies through its existing channels. Suchgrowth is dependent on prevailing market conditions and the Company’s ability to execute over time.
Therefore, the Company may fail to derive significant benefits or may not create the appropriateinfrastructure to support such additional growth from organic or acquired businesses, which could have amaterial adverse effect on Quaker’s liquidity, financial position, and results of operations.
The scope of our international operations subjects the Company to risks including, but not limited to, risksfrom currency fluctuations, changes in trade regulations, political and economic instability, and complex localtax environments.
Since significant revenues and earnings are generated by non-U.S. operations, Quaker’s financial results areaffected by currency fluctuations, particularly between the U.S. dollar and the euro, the Brazilian real, theMexican peso, the Chinese renminbi, and the Indian rupee, and the impact of those currency fluctuations on theunderlying economies. During the past three years, sales by non-U.S. subsidiaries accounted for approximately60% of our consolidated net sales. Generally, all of the Company’s operations use their local currency as theirfunctional currency. The Company generally does not use financial instruments that expose it to significant riskinvolving foreign currency transactions; however, the relative size of its non-U.S. activities has a significantimpact on reported operating results and the Company’s net assets. Therefore, as exchange rates vary, Quaker’sresults can be materially affected. Incorporated by reference is the foreign exchange risk information contained inItem 7A of this Report and the geographic information in Note 5 of Notes to Consolidated Financial Statementsincluded in Item 8 of this Report.
The Company often sources inventory among its worldwide operations. This practice can give rise toforeign exchange risk resulting from the varying cost of inventory to the receiving location, as well as from therevaluation of intercompany balances. The Company mitigates this risk through local sourcing efforts.
Additional risks associated with the Company’s international operations include, but are not limited to:instability in economic conditions from country to country; changes in a country’s political condition; tradeprotection measures; longer payment cycles; licensing and other legal requirements; restrictions on therepatriation of our assets, including cash; the difficulties of staffing and managing dispersed internationaloperations; less protective foreign intellectual property laws; legal systems that may be less developed andpredictable than those in the United States; and complex and dynamic local tax regulations.
The breadth of Quaker’s international operations subjects the Company to various local non-income taxes,including value-added-taxes (“VAT”). With VAT and other similar taxes, the Company essentially operates as anagent for various jurisdictions by collecting VAT-related taxes from customers and remitting those amounts tothe taxing authorities on the goods it sells. The laws and regulations regarding VAT-related taxes can be complexand vary widely among countries, as well as among individual jurisdictions within a given country, and for thesame products, making full compliance difficult. As VAT and other similar taxes are often charged as apercentage of the selling price of the goods sold, the amounts involved can be material. Should there be non-compliance by the Company, it may need to remit funds to the tax authorities prior to collecting the appropriateamounts from the customers or jurisdictions, which may have been incorrectly paid. In addition, the Companymay choose for commercial reasons not to seek repayment from certain customers. This could have a materialadverse effect on the Company’s liquidity, financial position and results of operations. See Note 23 of Notes toConsolidated Financial Statements, included in Item 8 of this Report, which is incorporated herein by thisreference, for further discussion.
10
Disruption of critical information systems or material breaches in the security of our systems may adverselyaffect our business and our customer relationships.
Quaker relies on information technology systems to process, transmit, and store electronic information inour day-to-day operations. The Company also relies on its technology infrastructure, among other functions, tointeract with customers and suppliers, fulfill orders and bill, collect and make payments, ship products, providesupport to customers, fulfill contractual obligations and otherwise conduct business. Our information technologysystems are subject to potential disruptions, including significant power outages, cyberattacks, computer viruses,other malicious codes, and/or unauthorized access attempts, any of which, if successful, could result in data leaksor otherwise compromise our confidential or proprietary information and disrupt our operations. Cybersecurityincidents, such as these, are becoming more sophisticated and frequent, and there can be no assurance that ourprotective measures will prevent security breaches that could have a significant impact on our business,reputation and financial results. Failure to monitor, maintain or protect our information technology systems anddata integrity effectively or, to anticipate, plan for and recover from significant disruptions to these systems couldhave a material adverse effect on our business, results of operations or financial condition.
Terrorist attacks, other acts of violence or war, natural disasters or other uncommon global events may affectthe markets in which we operate and our profitability.
Terrorist attacks, other acts of violence or war, natural disasters or other uncommon global events maynegatively affect our operations. There can be no assurance that there will not be further terrorist attacks againstthe U.S. or other locations where we do business. Also, other uncommon global events, such as earthquakes, firesand tsunami, cannot be predicted. Terrorist attacks, other acts of violence or armed conflicts, and natural disastersmay directly impact our physical facilities and/or those of our suppliers or customers. Additional terrorist attacksor natural disasters may disrupt the global insurance and reinsurance industries with the result that we may not beable to obtain insurance at historical terms and levels, if at all, for all of our facilities. Furthermore, any of theseevents may make travel and the transportation of our supplies and products more difficult and more expensiveand ultimately affect the sales of our products. The consequences of terrorist attacks, other acts of violence orarmed conflicts, natural disasters or other uncommon global events can be unpredictable, and we may not be ableto foresee events, such as these, that could have a material adverse effect on our business.
Item 1B. Unresolved Staff Comments.
None.
Item 2. Properties.
Quaker’s corporate headquarters and a laboratory facility are located in its North American segment’sConshohocken, Pennsylvania location. The Company’s other principal facilities in its North American segmentare located in Aurora, Illinois; Detroit, Michigan; Middletown, Ohio; Santa Fe Springs, California; Batavia, NewYork; Dayton, Ohio; and Monterrey, N.L., Mexico. The Company’s EMEA segment has principal facilities inUithoorn, The Netherlands; Barcelona, Spain; Navarra, Spain; Karlshamn, Sweden; and Tradate, Italy. TheCompany’s Asia/Pacific segment operates out of its principal facilities located in Qingpu, China; Kolkata, India;and Sydney, Australia, while its South American segment operates out of its principal facility in Rio de Janeiro,Brazil. With the exception of the Conshohocken, Santa Fe Springs, Aurora, Karlshamn, and Sydney sites, whichare leased, the remaining principal facilities are owned by Quaker and, as of December 31, 2015, were mortgagefree. Quaker also leases sales, laboratory, manufacturing, and warehouse facilities in other locations.
Quaker’s principal facilities (excluding Conshohocken) consist of various manufacturing, administrative,warehouse, and laboratory buildings. Substantially all of the buildings (including Conshohocken) are of fire-resistant construction and are equipped with sprinkler systems. All facilities are primarily of masonry and/or steelconstruction and are adequate and suitable for Quaker’s present operations. The Company has a program to
11
identify needed capital improvements that are implemented as management considers necessary or desirable.Most locations have various numbers of raw material storage tanks, ranging from 2 to 58, at each location with acapacity ranging from 1,000 to 82,000 gallons, and processing or manufacturing vessels ranging in capacity from7 to 16,000 gallons.
Each of Quaker’s non-U.S. associated companies (in which it owns less than 50% interest and hassignificant influence) owns or leases a plant and/or sales facilities in various locations, with the exception ofPrimex, Ltd.
Item 3. Legal Proceedings.
The Company is a party to proceedings, cases, and requests for information from, and negotiations with,various claimants and Federal and state agencies relating to various matters, including environmental matters.For information concerning pending asbestos-related litigation against an inactive subsidiary, amounts accruedassociated with certain environmental non-capital remediation costs and the Company’s value-added tax disputesettlements, reference is made to Note 23 of Notes to Consolidated Financial Statements, included in Item 8 ofthis Report, which is incorporated herein by this reference. The Company is a party to other litigation whichmanagement currently believes will not have a material adverse effect on the Company’s results of operations,cash flow or financial condition.
Item 4. Mine Safety Disclosures.
Not Applicable
Item 4(a). Executive Officers of the Registrant.
Set forth below is information regarding the executive officers of the Company, each of whom (with theexception of Ms. Hall and Mr. Hostetter) have been employed by the Company for more than five years,including the respective positions and offices with the Company held by each over the respective periodsindicated. Each of the executive officers, with the exception of Mr. Hostetter, is elected annually to a one-yearterm. Mr. Hostetter is considered an executive officer in his capacity as principal accounting officer for purposesof this Item.
Name, Age, and PresentPosition with the Company
Business Experience During the Past FiveYears and Period Served as an Officer
Michael F. Barry, 57Chairman of the Board, Chief Executive Officer andPresident and Director
Mr. Barry, who has been employed by the Companysince 1998, has served as Chairman of the Boardsince May 2009, in addition to his position as ChiefExecutive Officer and President held since October2008. He served as interim Chief Financial Officerfrom October 22, 2015 until November 29, 2015. Heserved as Senior Vice President and ManagingDirector – North America from January 2006 toOctober 2008. He served as Senior Vice Presidentand Global Industry Leader – Metalworking andCoatings from July through December 2005. Heserved as Vice President and Global IndustryLeader – Industrial Metalworking and Coatings fromJanuary 2004 through June 2005 and Vice Presidentand Chief Financial Officer from 1998 to August2004.
12
Name, Age, and PresentPosition with the Company
Business Experience During the Past FiveYears and Period Served as an Officer
Mary Dean Hall, 58Vice President, Chief Financial Officer and Treasurer
Ms. Hall has served as Vice President, ChiefFinancial Officer and Treasurer since she joined theCompany on November 30, 2015. Prior to joining theCompany, Ms. Hall served as the Vice President andTreasurer of Eastman Chemical Company from April2009 until October 2015. Prior to that role, she heldvarious senior-level financial positions of increasingresponsibility with Eastman from 1995 until April2009, including Treasurer, Vice President andController, and Vice President, Finance.
D. Jeffry Benoliel, 57Vice President and Global Leader – Metalworking,Can and Mining
Mr. Benoliel, who has been employed by theCompany since 1995, has served as Global Leader –Mining since May 2014, in addition to his position asVice President and Global Leader – Metalworkingand Can since July 2013 and his role as CorporateSecretary, a position held from 1998 through March2015. He served as Vice President – GlobalMetalworking and Fluid Power from June 2011through June 2013 and served as General Counselfrom 2001 to March 2012. He served as VicePresident – Global Strategy from October 2008 toJune 2011.
Joseph A. Berquist, 44Vice President and Managing Director –North America
Mr. Berquist, who has been employed by theCompany since 1997, has served as Vice Presidentand Managing Director – North America since April2010. He served as Senior Director, North AmericaCommercial from October 2008 through March2010.
Ronald S. Ettinger, 63Vice President – Human Resources
Mr. Ettinger, who has been employed by theCompany since 2002, has served as Vice President-Human Resources since December 2011. He servedas Director-Global Human Resources from August2005 through November 2011.
Shane W. Hostetter, 34Global Controller
Mr. Hostetter, who has been employed by theCompany since July 2011, has served as GlobalController since September 2014. He served asCorporate Controller from May 2013 to August 2014.He served as Assistant Global Controller from July2011 to May 2013. Prior to joining the Company, Mr.Hostetter led the financial reporting department forPulse Electronics Corporation (formerly Technitrol,Inc.) from May 2008 to June 2011.
Dieter Laininger, 52Vice President and ManagingDirector – South America andGlobal Leader – Primary Metals
Mr. Laininger, who has been employed by theCompany since 1991, has served as Vice Presidentand Managing Director – South America, sinceJanuary 2013, in addition to his position as VicePresident and Global Leader – Primary Metals, towhich he was appointed in June 2011. He served asIndustry Business Director for Steel andMetalworking – EMEA from March 2001 throughJuly 2011.
13
Name, Age, and PresentPosition with the Company
Business Experience During the Past FiveYears and Period Served as an Officer
Joseph F. Matrange, 73Vice President and Global Leader – Coatings
Mr. Matrange, who has been employed by theCompany since 2000, has served as Vice Presidentand Global Leader – Coatings since October 2008.He has also served as President of AC Products, Inc.,a California subsidiary, since October 2000, andEpmar Corporation, a California subsidiary, sinceApril 2002.
Jan F. Nieman, 54Vice President and Global Leader – Grease andFluid Power, Global Strategy and Marketing
Mr. Nieman, who has been employed by theCompany since 1992, has served as Vice President –Global Strategy and Marketing since May 2014, inaddition to his position as Global Leader – Greaseand Fluid Power since August 2013. He also servedas Global Leader – Mining from August 2013through April 2014. He served as Vice President andManaging Director – Asia/Pacific from February2005 through July 2013.
Wilbert Platzer, 54Vice President and ManagingDirector – EMEA
Mr. Platzer, who has been employed by the Companysince 1995, has served as Vice President andManaging Director – EMEA since January 2006.
Adrian Steeples, 55Vice President and ManagingDirector – Asia/Pacific
Mr. Steeples, who has been employed by theCompany since 2010, has served as Vice Presidentand Managing Director – Asia/Pacific since July2013. He served as Industry Business Director –Metalworking from March 2011 through June 2013,and Manager, European and Global Special Projects,from May 2010 through February 2011. Prior tojoining the Company, he worked for the BP Groupserving as BP/Castrol European and Asian PacificSales Director in Industrial Lubricants and Servicesfrom January 2009 through December 2009.
14
PART II
Item 5. Market for Registrant’s Common Equity, Related Stockholder Matters and Issuer Purchases ofEquity Securities.
The Company’s common stock is listed on the New York Stock Exchange (“NYSE”) under the tradingsymbol KWR. The following table sets forth, for the calendar quarters during the two most recent fiscal years,the range of high and low sales prices for the common stock as reported on the NYSE composite tape (amountsrounded to the nearest penny), and the quarterly dividends declared and paid:
There are no restrictions that currently limit the Company’s ability to pay dividends or that the Companybelieves are likely to materially limit the payment of future dividends. If a default under the Company’s primarycredit facility were to occur and continue, the payment of dividends would be prohibited. Reference is made tothe “Liquidity and Capital Resources” disclosure contained in Item 7 of this Report.
As of January 15, 2016, there were 919 shareholders of record of the Company’s common stock, its onlyoutstanding class of equity securities.
Every holder of Quaker common stock is entitled to one vote or ten votes for each share held of record onany record date depending on how long each share has been held. As of January 15, 2016, 13,263,626 shares ofQuaker common stock were issued and outstanding. Based on the information available to the Company onJanuary 15, 2016, we estimate as of that date the holders of record of 758,390 shares of Quaker common stockwould have been entitled to cast ten votes for each share, or approximately 38% of the total votes that wouldhave been entitled to be cast as of that record date, and the holders of record of 12,505,236 shares of Quakercommon stock would have been entitled to cast one vote for each share, or approximately 62% of the total votesthat would have been entitled to be cast as of that date. The number of shares that are indicated as entitled to onevote includes those shares presumed to be entitled to only one vote. Because the holders of these shares mayrebut this presumption, the total number of votes entitled to be cast as of January 15, 2016 could be more than20,089,136.
Reference is made to the information in Item 12 of this Report under the caption “Equity CompensationPlans,” which is incorporated herein by this reference.
The following table sets forth information concerning shares of the Company’s common stock acquired bythe Company during the fourth quarter of the fiscal year covered by this Report:
Issuer Purchases of Equity Securities
Period
(a)Total Number
of SharesPurchased (1)
(b)Average
Price PaidPer Share
(c)Total Number of
SharesPurchased as
part of PubliclyAnnounced
Plans orPrograms
(d)Approximate DollarValue of Shares that
May Yet bePurchased Under
the Plans orPrograms (1)
October 1 – October 31 13,838 $80.17 13,838 $93,901,217November 1 – November 30 12,580 $81.08 12,580 $92,881,217December 1 – December 31 1,858 $84.66 1,858 $92,723,918
Total 28,276 $80.87 28,276 $92,723,918
15
(1) On May 6, 2015, the Company’s Board of Directors approved, and the Company announced, a new sharerepurchase program, pursuant to which the Company is authorized to repurchase up to $100,000,000 ofQuaker Chemical Corporation common stock (the “2015 Share Repurchase Program”). The 2015 ShareRepurchase Program has no expiration date. All of the shares acquired by the Company during theapplicable respective periods were acquired pursuant to the 2015 Share Repurchase Program.
The following graph compares the cumulative total return (assuming reinvestment of dividends) fromDecember 31, 2010 to December 31, 2015 for (i) Quaker’s common stock, (ii) the S&P SmallCap 600 Index (the“SmallCap Index”), and (iii) the S&P 600 Materials Group Index (the “Materials Group Index”). The graphassumes the investment of $100 on December 31, 2010 in each of Quaker’s common stock, the stockscomprising the SmallCap Index and the stocks comprising the Materials Group Index.
Dec 10 Dec 11 Dec 12 Dec 13 Dec 14 Dec 15
$0
$50
$100
$150
$200
$250
$300
Quaker Chemical Corporation S&P Small Cap 600 Index S&P 600 Materials Group Index
(1) The results of operations for 2015 include equity income from a captive insurance company of $2,078 aftertax; offset by an after-tax charge of $2,806 related to a currency conversion charge at the Company’s 50%owned equity affiliate in Venezuela; $2,813 of one-time transaction expenses related to the Company’s July2015 acquisition of Verkol S.A.; $173 of charges related to cost streamlining initiatives in the Company’sSouth American segment; $328 of charges related to certain U.S. customer bankruptcies; and $6,790 ofcharges related to a global restructuring program.
(2) The results of operations for 2014 include equity income from a captive insurance company of $2,412 aftertax; offset by an after-tax charge of $321 related to a currency conversion charge at the Company’s 50%owned equity affiliate in Venezuela; $1,166 of charges related to cost streamlining initiatives in theCompany’s EMEA and South American segments; a $902 charge related to a U.K. pension planamendment; and $825 of charges related to certain customer bankruptcies.
(3) The results of operations for 2013 include equity income from a captive insurance company of $5,451 aftertax; an increase to other income of $2,540 related to a mineral oil excise tax refund; and an increase to otherincome of $497 related to a change in an acquisition-related earnout liability; partially offset by an after-taxcharge of $357 related to a currency conversion charge at the Company’s 50% owned equity affiliate inVenezuela; $1,419 of charges related to cost streamlining initiatives in the Company’s EMEA and SouthAmerican segments; and a $796 net charge related to a non-income tax contingency.
(4) The results of operations for 2012 include equity income from a captive insurance company of $1,812 aftertax; and an increase to other income of $1,737 related to a change in an acquisition-related earnout liability;partially offset by a charge of $1,254 related to the bankruptcy of certain customers in the U.S.; and a chargeof $609 related to CFO transition costs.
(5) The results of operations for 2011 include equity income from a captive insurance company of $2,323 aftertax; an increase to other income of $2,718 related to the revaluation of the Company’s previously heldownership interest in Tecniquimia Mexicana S.A de C.V. to its fair value; and an increase to other incomeof $595 related to a change in an acquisition-related earnout liability.
17
Item 7. Management’s Discussion and Analysis of Financial Condition and Results of Operations.
Executive Summary
Quaker Chemical Corporation is a leading global provider of process fluids, chemical specialties, andtechnical expertise to a wide range of industries, including steel, aluminum, automotive, mining, aerospace, tubeand pipe, cans, and others. For nearly 100 years, Quaker has helped customers around the world achieveproduction efficiency, improve product quality, and lower costs through a combination of innovative technology,process knowledge, and customized services. Headquartered in Conshohocken, Pennsylvania USA, Quakerserves businesses worldwide with a network of dedicated and experienced professionals whose mission is tomake a difference.
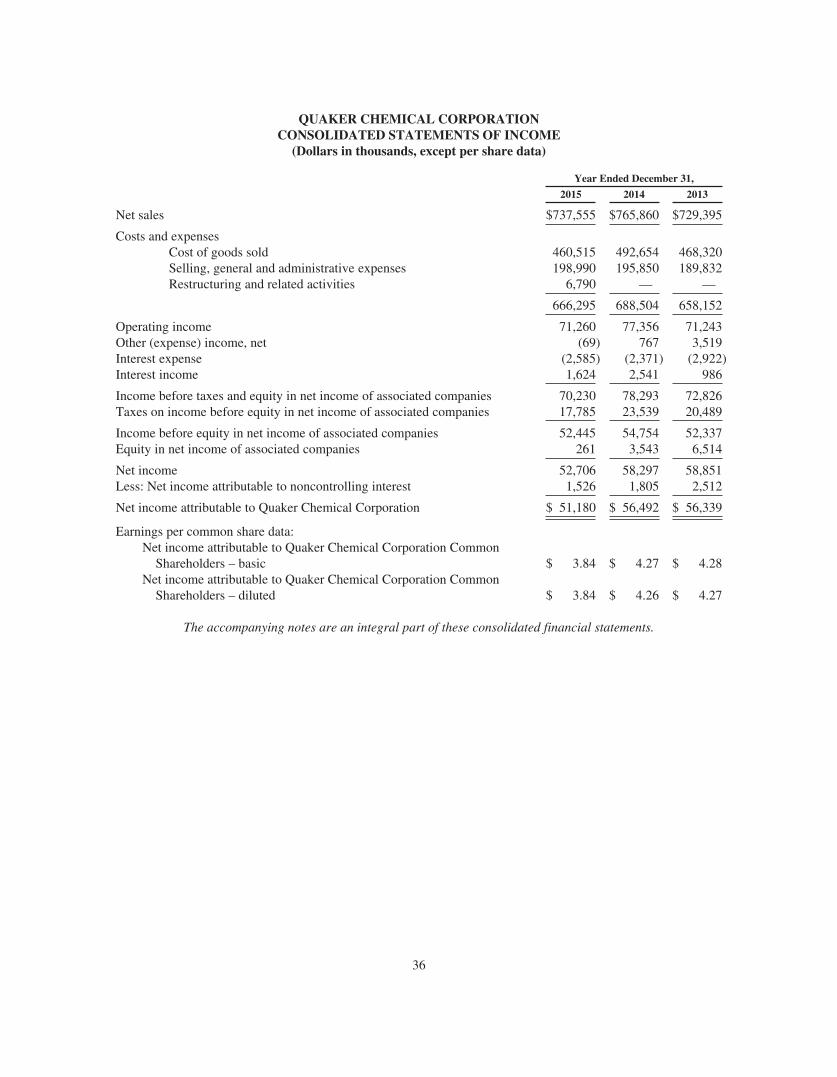
The Company delivered solid operating results in 2015, despite significant foreign exchange headwinds andchallenging market conditions, most notably, lower global steel production. Net sales were $737.6 million for2015 compared to $765.9 million for 2014. The 4% decrease in net sales was primarily driven by the negativeimpact of foreign currency translation of $53.6 million, or 7%, and declines in selling price and product mix of1%, which offset the Company’s product volume and acquisition-related growth of 4% in 2015. Gross profitimproved year-over-year primarily as a result of higher gross margin of 37.6% for 2015 compared to 35.7% for2014, due to timing of certain raw material cost decreases in 2015 compared to 2014. Selling, general andadministrative expenses (“SG&A”) increased $3.1 million from 2014, due to several factors, including higherlabor-related costs and incremental costs associated with the Company’s recent acquisitions, including certainone-time transaction expenses of $2.8 million incurred with the Company’s third quarter of 2015 Verkol S.A.(“Verkol”) acquisition, partially offset by the impact of foreign currency translation. Also, the Company incurredexpenses of $6.8 million in 2015 related to a global restructuring program, which included costs to reduce totalheadcount by approximately 65 employees globally and to close certain non-manufacturing locations. TheCompany expects to substantially complete this program in 2016 and currently projects pre-tax cost savings as aresult of this program to be approximately $3 million in 2016 and approximately $6 million annually insubsequent years. The net result of the Company’s operating performance in 2015, supplemented by a lower taxrate compared to 2014, was earnings per diluted share of $3.84 for 2015 compared to $4.26 for 2014. With thefourth quarter of 2015 restructuring expenses and other uncommon items excluded, the Company’s non-GAAPearnings per diluted share increased 4% to $4.43 for 2015 compared to $4.26 for 2014. The Company was able toachieve these reported and non-GAAP results despite a negative impact of $0.31 per diluted share, or 7%, fromchanges in foreign exchange rates and, also, lower global steel production. As a result of this non-GAAPearnings growth, the Company’s adjusted EBITDA increased 2% to $101.6 million for 2015 compared to $99.8million in 2014. See the Non-GAAP Measures section of this Item, below, as well as other items discussed in theCompany’s Consolidated Operations Review, in the Operations section of this Item, below.
From a regional perspective, the Company’s 2015 operating performance was driven primarily by its NorthAmerica and Asia/Pacific regions, which experienced increased volumes and higher gross margins. Notably,North America included contributions from a full year of the 2014 acquisition of ECLI Products, LLC (“ECLI”).However, both regions were negatively impacted by foreign currency translation, due to the weakening againstthe U.S. dollar of the Mexican peso and the Chinese renminbi, Indian rupee and Australian dollar, respectively.Related to Europe, Middle East and Africa (“EMEA”), the region’s results decreased from 2014 mainly due tothe weakening of the euro against the U.S. dollar, as well as declines in selling price and product mix, whichoffset higher product volumes, including contributions from the Company’s 2015 and 2014 acquisitions ofVerkol and Binol AB (“Binol”), respectively. Finally, South America’s performance continued to be negativelyimpacted by the economic downturn and related effects on end-user production in Brazil. In addition, foreignexchange continued to negatively impact South America’s results, due to the weakening of the Brazilian real andthe Argentinian peso against the U.S. dollar. These decreases to the region’s performance were partially offset bythe positive effects of selling price and product mix and lower labor-related costs as a result of the coststreamlining initiatives taken in this segment during 2013 and 2014. See the Reportable Operating SegmentReview, in the Operations section of this Item, below.
18
The Company’s solid operating performance, coupled with lower cash invested in the Company’s workingcapital, increased its net operating cash flow by $18.7 million, or 34%, to $73.4 million for 2015 compared to$54.7 million for 2014. The most notable driver of the Company’s working capital improvement was thedecrease of cash outflow from accounts receivable, primarily due to the levels of sales at each year-end and, also,better timing of cash receipts. These working capital changes are further discussed in the Company’s Liquidityand Capital Resources section of this Item, below.
Overall, the Company is pleased with its 2015 operating performance. Specifically, the Company was ableto grow its non-GAAP earnings by 4% and deliver strong cash flow despite significant foreign exchangeheadwinds, weak economic conditions in several regions, especially in South America, and lower globalproduction in the Company’s largest market, steel. In addition, the Company’s sales continued to be impacted bydownward price adjustments due to lower raw material costs. The Company’s performance, despite theseheadwinds, was highlighted by further market share gains, leveraging of past acquisitions, improved grossmargin, and controlled SG&A levels which fell to the bottom line and produced the Company’s sixth consecutiveyear of non-GAAP earnings and adjusted EBITDA growth. Looking forward to 2016, while the Companyanticipates a continued strong U.S. dollar, further pricing pressure to adjust to a lower raw material costenvironment, and continued uncertain economic conditions in South America and China, the Company believesits track record of market share gains and leveraging of past acquisitions will continue to offset these marketchallenges. Also, the Company’s restructuring program will allow it to further gain SG&A leverage and yieldmeaningful cost savings into 2016. Finally, the Company’s strong cash flow generation and balance sheetcontinue to be strengths that will allow for future key strategic initiatives and acquisitions. The Company’s 2016plans indicate growth in its top and bottom lines despite currency headwinds. Overall, the Company remainsconfident in its future and expects 2016 to be another good year for Quaker, as the Company expects to increasenon-GAAP earnings and adjusted EBITDA for a seventh consecutive year.
Critical Accounting Policies and Estimates
Quaker’s discussion and analysis of its financial condition and results of operations are based upon Quaker’sconsolidated financial statements, which have been prepared in accordance with accounting principles generallyaccepted in the United States. The preparation of these financial statements requires Quaker to make estimatesand judgments that affect the reported amounts of assets, liabilities, revenues and expenses, and relateddisclosure of contingent assets and liabilities. On an ongoing basis, Quaker evaluates its estimates, includingthose related to customer sales incentives, product returns, bad debts, inventories, property, plant and equipment,investments, goodwill, intangible assets, income taxes, financing operations, business combinations,restructuring, incentive compensation plans (including equity-based compensation), pensions and otherpostretirement benefits, and contingencies and litigation. Quaker bases its estimates on historical experience andon various other assumptions that are believed to be reasonable under such circumstances, the results of whichform the basis for making judgments about the carrying values of assets and liabilities that are not readilyapparent from other sources. However, actual results may differ from these estimates under different assumptionsor conditions.
Quaker believes the following critical accounting policies describe the more significant judgments andestimates used in the preparation of its consolidated financial statements:
1. Accounts receivable and inventory exposures – Quaker establishes allowances for doubtful accounts forestimated losses resulting from the inability of its customers to make required payments. If the financialcondition of Quaker’s customers were to deteriorate, resulting in an impairment of their ability to makepayments, additional allowances may be required. As part of its terms of trade, Quaker may custom manufactureproducts for certain large customers and/or may ship products on a consignment basis. Further, a significantportion of Quaker’s revenues is derived from sales to customers in industries where a number of bankruptcieshave occurred in past years and where companies have experienced financial difficulties. When a bankruptcyoccurs, Quaker must judge the amount of proceeds, if any, that may ultimately be received through the
19
bankruptcy or liquidation process. These matters may increase the Company’s exposure, should a bankruptcyoccur, and may require a write down or a disposal of certain inventory due to its estimated obsolescence orlimited marketability. Reserves for customers filing for bankruptcy protection are generally established at 75-100% of the amount outstanding at the bankruptcy filing date. However, initially establishing a reserve and theamount thereto is dependent on the Company’s evaluation of likely proceeds to be received from the bankruptcyprocess, which could result in the Company recognizing minimal or no reserve at the date of bankruptcy. Largeand/or financially distressed customers are generally reserved for on a specific review basis, while a generalreserve is maintained for other customers based on historical experience. The Company’s consolidated allowancefor doubtful accounts was $7.8 million and $6.5 million at December 31, 2015 and 2014, respectively. TheCompany recorded an increase in its provision for doubtful accounts of $1.5 million in 2015, compared to areduction of $0.3 million in 2014 and an increase to its provision for doubtful accounts of $1.1 million in 2013.Changing the recorded provisions by 10% would have increased or decreased the Company’s pre-tax earnings byapproximately $0.2 million, less than $0.1 million, and $0.1 million in 2015, 2014 and 2013, respectively. SeeNote 10 of Notes to Consolidated Financial Statements, which appears in Item 8 of this Report.
2. Environmental and litigation reserves – Accruals for environmental and litigation matters are recordedwhen it is probable that a liability has been incurred and the amount of the liability can be reasonably estimated.Accrued liabilities are exclusive of claims against third parties and are not discounted. Environmental costs andremediation costs are capitalized if the costs extend the life, increase the capacity or improve the safety orefficiency of the property from the date acquired or constructed, and/or mitigate or prevent contamination in thefuture. Estimates for accruals for environmental matters are based on a variety of potential technical solutions,governmental regulations and other factors, and are subject to a wide range of potential costs for remediation andother actions. A considerable amount of judgment is required in determining the most likely estimate within therange of total costs, and the factors determining this judgment may vary over time. Similarly, reserves forlitigation and similar matters are based on a range of potential outcomes and require considerable judgment indetermining the most probable outcome. If no amount within the range is considered more probable than anyother amount, the Company accrues the lowest amount in that range in accordance with generally acceptedaccounting principles. See Note 23 of Notes to Consolidated Financial Statements, which appears in Item 8 ofthis Report.
3. Realizability of equity investments – Quaker holds equity investments in various foreign companies,where it has the ability to influence, but not control, the operations of the entity and its future results. Quakerwould record an impairment charge to an investment if it believed a decline in value that was other thantemporary occurred. Future adverse changes in market conditions, poor operating results of underlyinginvestments, devaluation of foreign currencies or other events or circumstances could result in losses or aninability to recover the carrying value of the investments. These indicators may result in an impairment charge inthe future. The carrying amount of the Company’s equity investments at December 31, 2015 was $20.4 million,which included four investments: approximately $14.9 million, or a 32.8% interest, in Primex, Ltd. (Barbados);$5.0 million, or a 50% interest, in Nippon Quaker Chemical, Ltd. (Japan); $0.2 million, or a 50% interest, inKelko Quaker Chemical, S.A. (Venezuela); and $0.2 million, or a 50% interest, in Kelko Quaker Chemical, S.A.(Panama), respectively. See Note 14 of Notes to Consolidated Financial Statements, which appears in Item 8 ofthis Report.
4. Tax exposures, valuation allowances and uncertain tax positions – Quaker records expenses and liabilitiesfor taxes based on estimates of amounts that will be ultimately determined to be deductible in tax returns filed invarious jurisdictions. The filed tax returns are subject to audit, which often occur several years subsequent to thedate of the financial statements. Disputes or disagreements may arise during audits over the timing or validity ofcertain items or deductions, which may not be resolved for extended periods of time. Quaker applies theprovisions of FASB’s guidance regarding uncertain tax positions. The guidance applies to all income taxpositions taken on previously filed tax returns or expected to be taken on a future tax return. The FASB’sguidance regarding accounting for uncertainty in income taxes prescribes the recognition threshold andmeasurement attributes for financial statement recognition and measurement of tax positions taken or expected to
20
be taken on a tax return. The guidance further requires the determination of whether the benefits of tax positionswill be more likely than not sustained upon audit based upon the technical merits of the tax position. For taxpositions that are determined to be more likely than not sustained upon audit, a company recognizes the largestamount of benefit that is greater than 50% likely of being realized upon ultimate settlement in the financialstatements. For tax positions that are not determined to be more likely than not sustained upon audit, a companydoes not recognize any portion of the benefit in the financial statements. Additionally, the guidance provides forderecognition, classification, penalties and interest, accounting in interim periods, disclosure and transition. Theguidance also requires that the amount of interest expense and income to be recognized related to uncertain taxpositions be computed by applying the applicable statutory rate of interest to the difference between the taxposition recognized, including timing differences, and the amount previously taken or expected to be taken in atax return. The Company’s continuing practice is to recognize interest and/or penalties related to income taxmatters in income tax expense. Also, the Company would net its liability for unrecognized tax benefits againstdeferred tax assets related to net operating losses or other tax credit carryforwards if the uncertain tax positionwere settled for the presumed amount at the balance sheet date. Quaker also records valuation allowances whennecessary to reduce its deferred tax assets to the amount that is more likely than not to be realized. While Quakerhas considered future taxable income and employs prudent and feasible tax planning strategies in assessing theneed for a valuation allowance, in the event we were to determine that it would be able to realize its deferred taxassets in the future in excess of its net recorded amount, an adjustment to the deferred tax asset would increaseincome in the period such determination was made. Likewise, should Quaker determine that it would not be ableto realize all or part of its net deferred tax assets in the future, an adjustment to the deferred tax asset would becharged to income in the period such determination was made. Both determinations could have a material impacton the Company’s financial statements. In addition, U.S. income taxes have not been provided on theundistributed earnings of non-U.S. subsidiaries since it is the Company’s intention to continue to reinvest theseearnings in those foreign subsidiaries for working capital needs and certain other growth initiatives. The amountof such undistributed earnings at December 31, 2015 was approximately $203 million. However, U.S. andforeign income taxes that would be payable if such earnings were distributed may be lower than the amountcomputed at the U.S. statutory rate due to the availability of foreign tax credits. See Note 8 of Notes toConsolidated Financial Statements, which appears in Item 8 of this Report.
5. Goodwill and other intangible assets – The Company accounts for business combinations under theacquisition method of accounting. This method requires the recording of acquired assets, including separatelyidentifiable intangible assets, at their acquisition date fair values. Any excess of the purchase price over theestimated fair value of the identifiable net assets acquired is recorded as goodwill. The determination of theestimated fair value of assets acquired requires management’s judgment and often involves the use of significantestimates and assumptions, including assumptions with respect to future cash inflows and outflows, discount rates,royalty rates, asset lives and market multiples, among other items. When necessary, we consult with externaladvisors to help determine fair value. For non-observable market values, the Company may determine fair valueusing acceptable valuation principles, such as the excess earnings, relief from royalty, lost profit or cost methods.
The Company amortizes definite-lived intangible assets on a straight-line basis over the useful lives of theintangible assets. Goodwill and intangible assets which have indefinite lives are not amortized and are required tobe assessed at least annually for impairment. The Company compares the assets’ fair value to their carryingvalue, primarily based on future discounted cash flows, in order to determine if an impairment charge iswarranted. The estimates of future cash flows involve considerable management judgment and are based uponassumptions about expected future operating performance. Assumptions used in these forecasts are consistentwith internal planning, but the actual cash flows could differ from management’s estimates due to changes inbusiness conditions, operating performance, and economic conditions. The Company’s assumption of weightedaverage cost of capital (“WACC”) and estimated future net operating profit after tax (“NOPAT”) are particularlyimportant in determining estimated future cash flows.
The Company completed its annual impairment assessment as of the end of the third quarter of 2015, and noimpairment charge was warranted. Furthermore, the estimated fair value of each of the Company’s reporting
21
units substantially exceeded its carrying value, with none of the Company’s reporting units at risk for failing stepone of the goodwill impairment test. The Company’s consolidated goodwill and indefinite-lived intangible assetsat December 31, 2015 and 2014 were $80.2 million and $79.0 million, respectively. The Company used a WACCof approximately 11% and, at September 30, 2015, this assumption would have had to increase by more than 9percentage points to a WACC of approximately 20% before any of the Company’s reporting units would fail stepone of the impairment analysis. Further, at September 30, 2015, the Company’s estimate of future NOPAT wouldhave had to decrease by more than 36% before any of the Company’s reporting units would be consideredpotentially impaired. See Note 13 of Notes to Consolidated Financial Statements, which appears in Item 8 of thisReport.
6. Postretirement benefits – The Company provides certain defined benefit pension and other postretirementbenefits to current employees, former employees and retirees. Independent actuaries, in accordance withaccounting principles generally accepted in the United States, perform the required valuations to determinebenefit expense and, if necessary, non-cash charges to equity for additional minimum pension liabilities. Criticalassumptions used in the actuarial valuation include the weighted average discount rate, rates of increase incompensation levels, and expected long-term rates of return on assets. If different assumptions were used,additional pension expense or charges to equity might be required. As of December 31, 2015, the Company haselected to use a split discount rate (spot-rate approach) for the U.S. plans and certain foreign plans. Under thespot rate approach, benefit obligations have been determined based on application of the spot rates on a givenyield curve at each future year to each plan’s projected cash flows. The use of the spot-rate approach did not havean impact on the Company’s 2015 Consolidated Financial Statements, which appear in Item 8 of this Report. Theuse of the spot-rate approach differs from the historical approach of deriving a single equivalent discount ratefrom the calculation of the projected benefit obligation and utilizing that average rate to calculate the componentsof net benefit cost. Depending on the slope of a given yield curve, the Company expects that beginning in 2016,the use of the spot-rate approach may result in lower interest and service costs, which are components of netperiodic benefit costs and will be included in pre-tax earnings. The Company’s U.S. pension plan year-end isNovember 30, and the measurement date is December 31. See Note 18 of Notes to Consolidated FinancialStatements, which appears in Item 8 of this Report. The following table highlights the potential impact on theCompany’s pre-tax earnings, due to changes in these assumptions with respect to the Company’s pension plans,based on assets and liabilities at December 31, 2015:
1/2 Percentage Point Increase 1/2 Percentage Point Decrease
(Amounts in millions) Foreign Domestic Total Foreign Domestic Total
Discount rate (1) $0.4 $0.1 $0.5 $(0.5) $(0.1) $(0.6)Expected rate of return on plan assets (2) 0.4 0.2 0.6 (0.4) (0.2) (0.6)
(1) The weighted-average discount rate used to determine net periodic benefit costs for the year endedDecember 31, 2015 was 2.51% for Foreign plans and 3.72% for Domestic plans.
(2) The weighted average expected rate of return on plan assets used to determine net periodic benefit costs forthe year ended December 31, 2015 was 2.55% for Foreign plans and 7.30% for Domestic plans.
7. Restructuring and other related liabilities – A restructuring and related activities program may consist ofcharges for employee severance, rationalization of manufacturing facilities and other related expenses. Toaccount for such, the Company applies FASB’s guidance regarding exit or disposal cost obligations. Thisguidance requires that a liability for a cost associated with an exit or disposal activity be recognized when theliability is incurred, is estimable, and payment is probable. See Note 4 of Notes to Consolidated FinancialStatements, which appears in Item 8 of this Report.
Recently Issued Accounting Standards
See Note 2 of Notes to the Consolidated Financial Statements, which appears in Item 8 of this Report for adiscussion regarding recently issued accounting standards.
22
Liquidity and Capital Resources
Quaker’s cash and cash equivalents increased to $81.1 million at December 31, 2015 from $64.7 million atDecember 31, 2014. The approximate $16.3 million increase was the net result of $73.4 million of cash providedby operating activities, $34.2 million of cash used in investing activities, $16.9 million of cash used in financingactivities and a $6.0 million negative impact due to the effect of exchange rates on cash. At December 31, 2015,the Company held approximately $77.2 million of its total cash and cash equivalents among its foreignsubsidiaries, which is subject to possible limitations on repatriation to the United States.
Net cash flow provided by operating activities increased $18.7 million to $73.4 million in 2015 compared to$54.7 million in 2014, due to strong operating performance and lower cash invested in the Company’s workingcapital during 2015. Specifically, the Company’s cash flow from its accounts receivables increased due to thelevels of sales at the end of 2015 compared to 2014, and, also, improvements in collection efforts and timing ofreceipts. In addition to its receivables, the Company had higher cash inflows from inventory due to more stablelevels during 2015 compared to 2014, when the Company re-established safety stock levels that were low atyear-end 2013. Partially offsetting these increases to net operating cash flow in 2015 were higher cash outflowsfrom prepaid expenses and other current assets, primarily related to higher tax-related payments, and higher cashoutflows due to timing of payments related to the Company’s trade accounts payable and other accruedliabilities. In addition, the Company received a $0.6 million dividend distribution in the third quarter of 2015from its captive insurance equity affiliate, which also impacted the 2014 comparison of the Company’s operatingcash flow.
Net cash flow used in investing activities decreased $50.3 million to $34.2 million in 2015 compared to$84.5 million in 2014, which was primarily the result of lower payments for acquisitions and property, plant andequipment. During 2015, the Company used $24.6 million to purchase Verkol for its EMEA segment, comparedto $73.5 million in 2014, primarily related to the purchase of ECLI for its North American segment and Binol forits EMEA segment. In January 2016, the Company paid $1.4 million as part of a post-closing adjustment relatedto the Verkol acquisition, which was accrued for as of December 31, 2015. See Note 21 of Notes to ConsolidatedFinancial Statements, which appears in Item 8 of this Report. In addition, the Company had a cash inflow of $0.5million during 2015 due to a post-closing adjustment related to its acquisition of Binol. Related to property, plantand equipment, the decrease in cash used in investing activities was primarily related to lower spending oninformation technology development and other related initiatives primarily in the Company’s EMEA segment.These decreases were partially offset by lower cash inflows from changes in the Company’s restricted cash in2015, which is dependent upon the timing of claims and payments associated with a subsidiary’s asbestoslitigation.
Net cash flow used in financing activities was $16.9 million in 2015 compared to $30.2 million of cashprovided by financing activities in 2014. The $47.1 million decrease in cash provided by financing activities wasdue to the net impact of several factors. Specifically, proceeds from long-term debt, net of repayments, were $5.7million in 2015 compared to $57.4 million in 2014, primarily due to lower borrowings in 2015 on the Company’srevolving credit line. The lower borrowings year-over-year were primarily the result of lower fundingrequirements for the acquisition of Verkol in 2015 compared to the 2014 requirements for the purchase of ECLIand Binol, the purchase of the remaining interest in the Company’s Australia affiliate, a payment of anacquisition-related earnout liability and dividends to noncontrolling affiliate shareholders. The Company had$2.0 million higher cash outflow from dividend payments in 2015 compared to 2014, due to a larger number ofshares outstanding during the year and increased dividends declared per share. Also, the Company had cashoutflows of $7.3 million in 2015 to repurchase 87,386 shares of the Company’s common stock in connectionwith the Company’s share repurchase program. In May 2015, the Company’s Board of Directors authorized ashare repurchase program for the repurchase of up to $100 million of Quaker common stock (the “2015 ShareRepurchase Program”), which provides a framework of conditions under which management can repurchaseshares of the Company’s common stock. The Company intends to repurchase shares to at least offset the dilutiveimpact of shares issued each year as part of its employee benefit and share-based compensation plans, and could
23
repurchase more if the Company considers the share price to be an amount that is an advantageous return for itsshareholders. The Company has continued these share repurchases during the first quarter of 2016, withrepurchases of approximately 84,000 shares at an average price of $69.8 per share for approximately $5.9 millionto date.
The Company’s primary credit line is a $300 million syndicated multicurrency credit agreement, with agroup of lenders, which matures in June 2018. The maximum amount available under this facility can beincreased to $400 million at the Company’s option if the lenders agree and the Company satisfies certainconditions. Borrowings under this facility generally bear interest at a base rate or LIBOR rate plus a margin. AtDecember 31, 2015 and 2014, the Company had borrowings outstanding of approximately $62.9 million and$58.4 million primarily under this credit facility, at weighted average borrowing rates of 1.38% and 1.16%,respectively. Access to this credit facility is dependent on meeting certain financial, acquisition and othercovenants, but primarily depends on the Company’s consolidated leverage ratio calculation, which cannot exceed3.50 to 1. As of December 31, 2015 and 2014, the Company’s consolidated leverage ratio was below 1.0 to 1,and the Company was also in compliance with all of the other covenants.
In the fourth quarter of 2015, Quaker’s management approved a global restructuring program to reduceoperating costs. This program includes restructuring and associated severance costs to reduce total headcount byapproximately 65 people globally and to close certain non-manufacturing locations. As a result of this program,the Company recognized a $6.8 million, or $0.36 per diluted share, restructuring charge and made $0.5 million ofoperating cash payments related to this program during the fourth quarter of 2015. The Company expects tosubstantially complete this program in 2016, including operating cash flows for the settlement of its remainingrestructuring liabilities. The Company currently projects pre-tax savings as a result of this program to beapproximately $3 million in 2016 and approximately $6 million annually in subsequent years. See Note 4 ofNotes to Consolidated Financial Statements, which appears in Item 8 of this Report.
At December 31, 2015, the Company’s gross liability for uncertain tax positions, including interest andpenalties, was $14.4 million. The Company cannot determine a reliable estimate of the timing of cash flows byperiod related to its uncertain tax position liability. However, should the entire liability be paid, the amount of thepayment may be reduced by up to $9.9 million as a result of offsetting benefits in other tax jurisdictions.
The Company believes it is capable of supporting its operating requirements and funding its businessobjectives, including but not limited to, pension plan contributions, payments of dividends to shareholders,potential share repurchases, possible acquisitions and other business opportunities, capital expenditures andpossible resolution of contingencies, through internally generated funds supplemented with debt or equity asneeded.
24
The following table summarizes the Company’s contractual obligations at December 31, 2015, and theeffect such obligations are expected to have on its liquidity and cash flows in future periods. Pension and otherpostretirement plan contributions beyond 2016 are not determinable since the amount of any contribution isheavily dependent on the future economic environment and investment returns on pension trust assets. Thetiming of payments related to other long-term liabilities, which consist primarily of deferred compensationagreements, also cannot be readily determined due to their uncertainty. Interest obligations on the Company’slong-term debt and capital leases assume the current debt levels will be outstanding for the entire respectiveperiod and apply the interest rates in effect at December 31, 2015.
Payments due by period
Contractual Obligations(Amounts in millions) Total 2016 2017 2018 2019 2020
Included in this Form 10-K filing are non-GAAP (unaudited) financial measures of non-GAAP earnings perdiluted share and adjusted EBITDA. The Company believes these non-GAAP financial measures providemeaningful supplemental information as they enhance a reader’s understanding of the financial performance ofthe Company, are more indicative of the future operating performance of the Company, and facilitate a bettercomparison among fiscal periods, as the non-GAAP financial measures exclude items that are not consideredcore to the Company’s operations. These non-GAAP results are presented for supplemental informationalpurposes only and should not be considered a substitute for the financial information presented in accordancewith GAAP.
The following are reconciliations between the non-GAAP (unaudited) financial measures of non-GAAPearnings per diluted share and adjusted EBITDA to their most directly comparable GAAP financial measures:
For the years ended December 31,
2015 2014 2013
GAAP earnings per diluted share attributable to Quaker Chemical CorporationCommon Shareholders $ 3.84 $ 4.26 $ 4.27
Equity income in a captive insurance company per diluted share (0.16) (0.18) (0.41)Restructuring expenses per diluted share 0.36 — —Verkol transaction-related expenses per diluted share 0.15 — —U.K. pension plan amendment per diluted share — 0.05 —Customer bankruptcy costs per diluted share 0.02 0.05 —Mineral oil excise tax refund per diluted share — — (0.14)Change in an acquisition-related earnout liability per diluted share — — (0.03)Cost streamlining initiatives per diluted share 0.01 0.06 0.08Non-income tax contingency charge per diluted share — — 0.04Currency conversion impact of the Venezuelan bolivar fuerte per diluted share 0.21 0.02 0.03
Net income attributable to Quaker Chemical Corporation $ 51,180 $56,492 $56,339Depreciation and amortization 19,206 16,631 15,784Interest expense 2,585 2,371 2,922Taxes on income before equity in net income of associated companies 17,785 23,539 20,489Equity income in a captive insurance company (2,078) (2,412) (5,451)Restructuring expenses 6,790 — —Verkol transaction-related expenses 2,813 — —U.K. pension plan amendment — 902 —Customer bankruptcy costs 328 825 —Mineral oil excise tax refund — — (2,540)Change in an acquisition-related earnout liability — — (497)Cost streamlining initiatives 173 1,166 1,419Non-income tax contingency charge — — 796Currency conversion impact of the Venezuelan bolivar fuerte 2,806 321 357
Adjusted EBITDA $101,588 $99,835 $89,618
Out-of-Period Adjustment (2012)
During 2012, the Company reassessed its ability to significantly influence the operating and financialpolicies of its captive insurance equity affiliate, Primex Ltd. (“Primex”). Based on its ownership percentage andother factors, the Company determined that, during 2012, the Company obtained the ability to significantlyinfluence Primex and, as a result, changed its method of accounting from the cost to equity method. During thefirst quarter of 2013, the Company identified errors in Primex’s estimated 2012 financial statements, whichprimarily related to a reinsurance contract held by Primex. The identified errors resulted in a cumulative $1.0million understatement of the Company’s equity in net income from associated companies for the year endedDecember 31, 2012. The Company corrected the errors related to Primex in the first quarter of 2013, which hadthe net effect of increasing equity in net income from associated companies by $1.0 million for the three monthsended March 31, 2013 and the year ended December 31, 2013. The Company did not believe this adjustment wasmaterial to its consolidated financial statements for the year ended December 31, 2012 or to the Company’sresults for the year ended December 31, 2013 and, therefore, did not restate any prior period amounts. See Note 3of Notes to Consolidated Financial Statements, which appears in Item 8 of this Report.
Operations
Consolidated Operations Review – Comparison of 2015 with 2014
Net sales for 2015 of $737.6 million decreased 4% from $765.9 million for 2014. This decrease in theCompany’s net sales was primarily due to the negative impact of foreign currency translation of $53.6 million, or7%, and declines in selling price and product mix of 1%, which collectively offset a 4% increase in productvolume, including $39.1 million of sales attributed to the Company’s 2015 and 2014 acquisitions.
Cost of goods sold for 2015 of $460.5 million decreased 7% from $492.7 million for 2014. This decreasewas primarily due to the impact of foreign currency translation, a decrease in raw material costs and product mixand a one-time 2014 charge of $0.3 million, or $0.02 per diluted share, related to finalizing a manufacturing coststreamlining initiative in EMEA that began in 2013. These decreases to cost of goods sold were partially offsetby increases in product volume, including additional cost of goods sold attributed to the Company’s 2015 and2014 acquisitions.
Gross profit for 2015 increased $3.8 million, or 1%, compared to 2014, driven by an expansion of grossmargin to 37.6% for 2015 compared to 35.7% for 2014, partially offset by the negative impact of foreigncurrency translation. The increase in gross margin was mainly due to the timing of certain raw material costdecreases in 2015 compared to 2014.
26
SG&A increased $3.1 million from 2014, which was due to the net impact of several factors, includinghigher overall labor-related costs, incremental costs associated with the Company’s recent acquisitions, includingcertain one-time transaction-related expenses of $2.8 million, or $0.15 per diluted share, incurred in the thirdquarter of 2015 related to the Verkol acquisition, and certain other one-time 2015 charges, which include $0.3million, or $0.02 per diluted share, related to certain customer bankruptcies, $0.2 million, or $0.01 per dilutedshare, related to a cost streamlining initiative in South America, and $0.2 million, or $0.01 per diluted share,related to events at the Company’s Venezuela affiliate. These increases to SG&A were partially offset bydecreases from foreign currency translation and certain one-time 2014 charges, which include $0.9 million, or$0.05 per diluted share, related to an amendment to the Company’s pension plan in the U.K., $0.8 million, or$0.05 per diluted share, related to certain customer bankruptcies, and $0.9 million, or $0.04 per diluted share,related to the Company’s cost streamlining activities in South America.
In the fourth quarter of 2015, the Company had restructuring expenses of $6.8 million, or $0.36 per dilutedshare, related to the initiation of a global restructuring program. This program includes restructuring andassociated costs to reduce total headcount by approximately 65 people globally and to close certain non-manufacturing locations. There were no analogous restructuring expenses in 2014. See Note 4 of Notes toConsolidated Financial Statements, which appears in Item 8 of this Report.
Other income decreased $0.8 million in 2015 compared to 2014. The decrease was primarily due to lowerreceipts of annual government-related grants in one of the Company’s regions, lower third party license fees, andhigher foreign exchange transaction losses incurred during 2015 compared to 2014.
Interest expense was $0.2 million higher in 2015 compared to 2014, primarily due to higher averageborrowings outstanding during 2015 to fund the Company’s recent acquisition activity. Interest income was $0.9million lower in 2015 compared to 2014, primarily due to a decrease in the level of cash invested in certainregions with higher returns and interest received on certain tax-related credits in 2014.
The Company’s effective tax rates for 2015 and 2014 were 25.3% and 30.1%, respectively. The primarycontributors to the decrease in the 2015 effective tax rate were the mix of earnings between higher and lower taxjurisdictions in 2015, accelerated recognition of certain tax-related credits due to changes in local tax regulations,adjustments related to previous years’ tax estimates, and certain one-time items that inflated the 2014 effectivetax rate. The Company has experienced and expects to continue to experience volatility in its effective tax ratesdue to several factors, including the timing of tax audits and the expiration of applicable statutes of limitations asthey relate to uncertain tax positions, and the unpredictability of the timing and amount of certain incentives invarious tax jurisdictions, among other factors. Going into 2016, we expect the full year effective tax rate willincrease to between 28% and 30%. In addition, the Company expects its quarterly effective tax rates will behigher in the first three quarters of 2016, similar to the 2013 quarterly effective tax rate trend, as the Companywill book earnings in one of its subsidiaries at the statutory tax rate of 25% while it awaits recertification of aconcessionary 15% tax rate. We currently estimate our first quarter of 2016 effective tax rate will be between31% and 33%.
Equity income decreased $3.3 million in 2015 compared to 2014. The decrease was primarily due to a firstquarter of 2015 currency conversion charge of $2.6 million, or $0.20 per diluted share, at the Company’sVenezuela affiliate, and lower related earnings from this affiliate. See Note 14 of Notes to Consolidated FinancialStatements, which appears in Item 8 of this Report. This 2015 charge was partially offset by a similar 2014expense related to the conversion of Venezuelan bolivar fuerte to the U.S. dollar of $0.3 million, or $0.02 perdiluted share. Excluding these charges, the primary component of equity income is the Company’s interest in acaptive insurance company. Earnings attributable to this equity interest were $2.1 million, or $0.16 per dilutedshare, in 2015 compared to $2.4 million, or $0.18 per diluted share, in 2014.
The $0.3 million decrease in net income attributable to noncontrolling interest in 2015 compared to 2014was primarily due to the Company’s June 2014 acquisition of the noncontrolling interest in its Australia affiliate.
27
Outside the one-time transaction-related expenses mentioned above, the Company realized a minimalimpact to net income from its 2015 Verkol acquisition, as its operating results were offset by normal acquisition-related costs and initial adjustments related to fair value accounting.
Changes in foreign exchange rates, excluding the currency conversion effects of the Venezuelan bolivarfuerte, noted above, negatively impacted 2015 net income by approximately 7%, or $0.31 per diluted share.
Consolidated Operations Review – Comparison of 2014 with 2013
Net sales for 2014 of $765.9 million increased 5% from $729.4 million for 2013. This increase in theCompany’s net sales was primarily due to a 5% increase in product volumes. Included in the Company’s netsales growth in 2014 was approximately $12.8 million of additional sales from acquisitions, which was largelyoffset by a decrease of $10.3 million, or 1%, due to the negative impact of foreign currency translation. Theeffects on net sales related to selling price and product mix were generally consistent in 2014 compared to 2013.
Cost of goods sold for 2014 of $492.7 million increased 5% from $468.3 million for 2014. This increasewas primarily due to increases in product volume, including additional cost of goods sold attributed to theCompany’s acquisitions, and, also, a one-time 2014 charge of $0.3 million, or $0.02 per diluted share, related tofinalizing a manufacturing cost streamlining initiative in EMEA that began in 2013. These increases werepartially offset by impacts related to foreign currency translation. The impact of raw material costs and productmix on cost of goods sold were relatively consistent in 2014 compared to 2013.
Gross profit increased $12.1 million, or 5%, from 2013, which was driven by the increase in sales volumes,noted above, on relatively flat gross margins of 35.7% and 35.8% for 2014 and 2013, respectively.
SG&A increased $6.0 million from 2013, which was due to the net impact of several factors, includingadditional costs acquired with the Company’s 2014 acquisitions, higher overall labor-related costs, and certainone-time 2014 charges, which include $0.9 million, or $0.05 per diluted share, related to an amendment to theCompany’s pension plan in the U.K., $0.8 million, or $0.05 per diluted share, related to certain customerbankruptcies, and $0.9 million, or $0.04 per diluted share, related to the Company’s cost streamlining activitiesin South America. These increases to SG&A for 2014 were partially offset by decreases in foreign currencytranslation and certain one-time 2013 charges, which include $0.8 million, or $0.04 per diluted share, related to anon-income tax contingency and $1.2 million, or $0.07 per diluted share, related to the Company’s coststreamlining activities in South America and EMEA.
Other income decreased $2.8 million in 2014 compared to 2013. This decrease was primarily related to the2013 refund of $2.5 million, or $0.14 per diluted share, related to past excise taxes paid on certain Italian mineraloil sales and, also, $0.5 million, or $0.03 per diluted share, related to 2013 changes in an acquisition-relatedearnout liability, net of a 2013 charge of $0.2 million or $0.01 per diluted share, related to cost streamlininginitiatives in EMEA.
Interest expense was $0.6 million lower in 2014 compared to 2013, primarily due to interest accretion of anacquisition-related earnout liability in 2013, discussed above, which was settled early in the second quarter of2014. This decrease to interest expense was net of additional expense from higher average borrowings due to theCompany’s 2014 acquisition activity.
Interest income was $1.6 million higher in 2014 compared to 2013, primarily due to interest received onseveral non-income tax-related credits and an increase in the level of the Company’s invested cash in regionswith higher returns.
The Company’s effective tax rates for 2014 and 2013 were 30.1% and 28.1%, respectively. The primarycontributors to the Company’s higher effective tax rate in 2014 was an increase in reserves related to uncertaintax positions and certain other one-time items that impacted the 2014 effective tax rate.
28
The decrease in the Company’s equity income of $3.0 million in 2014 compared to 2013 was primarilycaused by lower earnings related to the Company’s equity interest in a captive insurance company. Earningsattributable to this equity interest were $2.4 million, or $0.18 per diluted share, in 2014 compared to $5.5 million,or $0.41 per diluted share, in 2013, including a $1.0 million out-of-period adjustment. See the Out-of-PeriodAdjustment section in this Item, above. In addition, the Company’s equity income includes comparable currencycharges related to the conversion of the Venezuelan bolivar fuerte to the U.S. dollar of $0.3 million, or $0.02 perdiluted share, in 2014, and $0.4 million, or $0.03 per diluted share, in 2013.
The primary component of the $0.7 million decrease in net income attributable to noncontrolling interest in2014 compared to 2013 was the Company’s second quarter of 2014 acquisition of its noncontrolling interest in itsAustralia affiliate.
The Company’s 2014 acquisitions generally performed in line with their expected positive operating results;however, the Company realized a minimal impact to net income from these acquisitions as their operating resultswere largely offset by the acquisition-related costs, noted above, and initial adjustments related to fair valueaccounting.
Changes in foreign exchange rates negatively impacted 2014 net income, compared to 2013, byapproximately $1.2 million, or $0.09 per diluted share.
Reportable Operating Segment Review – Comparison of 2015 with 2014
The Company sells its industrial process fluids, chemical specialties and technical expertise to a wide rangeof industries in a global product portfolio throughout its four segments: (i) North America, (ii) EMEA, (iii) Asia/Pacific and (iv) South America.
North America
North America represented approximately 47% of the Company’s consolidated net sales in 2015, andincreased $9.8 million, or 3%, compared to 2014. The increase in net sales was generally due to higher productvolumes, including acquisitions, of 5%, partially offset by the negative impact of foreign currency translation of2%. The foreign exchange impact was primarily due to a weaker Mexican peso against the U.S. dollar, as thisexchange rate averaged 15.83 in 2015 compared to 13.29 in 2014. This reportable segment’s operating earnings,excluding indirect expenses, increased $11.5 million, or 17%, compared to 2014. The 2015 increase was mainlydue to the increase in net sales, noted above, and an increase in gross margin due to the timing of certain rawmaterial cost decreases and product mix. These increases to operating earnings were partially offset by higheroverall labor-related costs on improved segment performance and incremental SG&A from 2014 acquisitionactivity.
EMEA
EMEA represented approximately 24% of the Company’s consolidated net sales in 2015, and decreasedapproximately $15.6 million, or 8%, compared to 2014. The decrease in net sales was primarily due to thenegative impact of foreign currency translation of 16% and a decrease in selling price and product mix of 2%,partially offset by higher product volumes, including acquisitions, of 10%. The foreign exchange impact wasprimarily due to a weakening of the euro against the U.S. dollar, as this exchange rate averaged 1.11 in 2015compared to 1.33 in 2014. This reportable segment’s operating earnings, excluding indirect expenses, decreased$4.6 million, or 14%, compared to 2014. The 2015 decrease was mainly driven by lower gross profit on thedecrease in net sales, noted above, on relatively flat gross margin, and, also, incremental SG&A from 2015 and2014 acquisition activity. These decreases to operating earnings were partially offset by the impact of the weakereuro on the segment’s operating costs.
29
Asia/Pacific
Asia/Pacific represented approximately 25% of the Company’s consolidated net sales in 2015, anddecreased approximately $4.9 million, or 3%, compared to 2014. The decrease in net sales was primarily due tothe negative impact of foreign currency translation of 3% and a decrease in selling price and product mix of 2%,partially offset by higher product volumes of 2%. The foreign exchange impact was primarily due to a weakeningof the Chinese renminbi, Indian rupee and Australian dollar against the U.S. dollar, as these exchange ratesaveraged 6.23, 64.07 and 0.75 in 2015 compared to 6.15, 60.95 and 0.90 in 2014, respectively. This reportablesegment’s operating earnings, excluding indirect expenses, increased $1.3 million, or 3%, compared to 2014. Theincrease in 2015 was mainly driven by higher gross profit on increased product volumes and higher grossmargins due to the timing of certain raw material cost decreases and product mix, and lower costs due to theweaker Chinese renminbi, Indian rupee and Australian dollar to U.S. dollar exchange rates. These increases tooperating earnings were partially offset by higher overall labor-related costs.
South America
South America represented approximately 4% of the Company’s consolidated net sales in 2015, anddecreased $17.6 million, or 35%, compared to 2014. The decrease in net sales was generally attributable to thenegative impact of foreign currency translation of 22% and lower product volumes of approximately 16%,partially offset by an increase in selling price and product mix of 3%. The foreign exchange impact was primarilydue to a weakening of the Brazilian real and Argentinian peso against the U.S. dollar, as these exchange ratesaveraged 3.28 and 9.19 in 2015 compared to 2.35 and 8.09 in 2014, respectively. This reportable segment’soperating earnings, excluding indirect expenses, decreased $2.5 million, or 58%, compared to 2014. The 2015decrease was mainly due to the decrease in net sales, noted above, and lower gross margin due to raw materialcost increases and product mix, partially offset by lower labor-related costs. The decrease in labor-related costs isprimarily due to the segment’s lower performance, the positive effects from the cost streamlining initiativestaken in this segment during 2013, 2014, and 2015, and the weaker Brazilian real and Argentinian peso to U.S.dollar exchange rates.
Reportable Operating Segment Review – Comparison of 2014 with 2013
North America
North America represented approximately 44% of the Company’s consolidated net sales in 2014, andincreased approximately $26.0 million, or 8%, compared to 2013. The increase in net sales was generallyattributable to higher product volumes, including acquisitions, of 9%, partially offset by a 1% decrease related toselling price and product mix. This reportable segment’s operating earnings, excluding indirect expenses,increased approximately $7.0 million, or 11%, from 2013. The increase in 2014 was mainly due to the increasesto net sales, noted above, and a slight margin improvement on a change in raw material costs and product mix,partially offset by higher labor-related costs on improved segment performance.
EMEA
EMEA represented approximately 26% of the Company’s consolidated net sales in 2014, and increasedapproximately $7.5 million, or 4%, compared to 2013. The increase in net sales was generally attributable tohigher product volumes, including acquisitions, of 5%, partially offset by decreases related to selling price andproduct mix of 1%. Effects on net sales from foreign currency translation were generally comparable in 2014 and2013. This reportable segment’s operating earnings, excluding indirect expenses, increased approximately $2.9million, or 10%, from 2013. This increase in 2014 was mainly due to the increases to net sales, noted above, theincremental 2013 costs related to EMEA’s streamlining initiatives and a decrease in 2014’s SG&A due to theimpacts from the same initiatives, partially offset by higher labor-related costs on improved segmentperformance.
30
Asia/Pacific
Asia/Pacific represented approximately 24% of the Company’s consolidated net sales in 2014, and increasedapproximately $16.5 million, or 10%, compared to 2013. The increase in net sales was primarily due to higherproduct volumes of 9% and an increase due to selling price and product mix of 2%, partially offset by thenegative impact of foreign currency translation of 1%. The foreign currency translation impact was primarily dueto a weaker Australian dollar against the U.S. dollar, as this exchange rate averaged 0.90 in 2014 compared to0.97 in 2013. This reportable segment’s operating earnings, excluding indirect expenses, increased approximately$1.5 million, or 3%, from 2013. The increase in 2014 was mainly due to the increases to net sales, noted above,partially offset by lower gross margins due to changes in raw material costs and product mix and, also, higherlabor-related costs on improved segment performance.
South America
South America represented approximately 6% of the Company’s consolidated net sales in 2014, anddecreased approximately $13.6 million, or 21%, compared to 2013. The decrease in net sales was generallyattributable to lower product volumes of 15% and the negative impact of foreign currency translation of 11%,partially offset by an increase in selling price and product mix of 5%. The foreign currency translation impactwas primarily due to a weakening in the Brazilian real and Argentinian peso against the U.S. dollar, as theseexchange rates averaged 2.35 and 8.09 in 2014 compared to 2.15 and 5.44 in 2013, respectively. This reportablesegment’s operating earnings, excluding indirect expenses, decreased approximately $4.9 million, or 53%, from2013. The decrease in 2014 was mainly due to the decreases to net sales, noted above, a gross margin decline onchanges in raw material costs and product mix, incremental costs related to South America’s streamlininginitiatives and higher labor-related costs, partially offset by the positive impacts from cost streamlining initiativestaken in this segment during 2013 and the impacts on SG&A related to lower segment performance.
Environmental Clean-up Activities
The Company is involved in environmental clean-up activities in connection with an existing plant locationand former waste disposal sites. In 1992, the Company identified certain soil and groundwater contamination atAC Products, Inc. (“ACP”), a wholly owned subsidiary. In voluntary coordination with the Santa Ana CaliforniaRegional Water Quality Board (“SACRWQB”), ACP has been remediating the contamination. In 2007, ACPagreed to operate two groundwater treatment systems, so as to hydraulically contain groundwater contaminationemanating from ACP’s site until such time as the concentrations of contaminants are below the current Federalmaximum contaminant level for four consecutive quarterly sampling events. In February 2014, ACP ceasedoperation at one of its two groundwater treatment systems, as it had met the above condition for closure. AtDecember 31, 2015, the Company believes that the remaining potential-known liabilities associated with theACP contamination, namely estimated future cost of the water remediation program, is approximately $0.4million to $1.0 million, for which the Company has sufficient reserves. Notwithstanding the foregoing, theCompany cannot be certain that future liabilities in the form of remediation expenses and damages will not be inexcess of the amount reserved. See Note 23 of Notes to Consolidated Financial Statements, which appears inItem 8 of this Report.
General
See Item 7A of this Report for further discussion of certain quantitative and qualitative disclosures aboutmarket risk.
Factors that May Affect Our Future Results
(Cautionary Statements Under the Private Securities Litigation Reform Act of 1995)
31
Certain information included in this Report and other materials filed or to be filed by Quaker with the SEC(as well as information included in oral statements or other written statements made or to be made by us) containor may contain forward-looking statements within the meaning of Section 27A of the Securities Act of 1933, asamended, and Section 21E of the Securities Exchange Act of 1934, as amended. These statements can beidentified by the fact that they do not relate strictly to historical or current facts. We have based these forward-looking statements on our current expectations about future events. These forward-looking statements includestatements with respect to our beliefs, plans, objectives, goals, expectations, anticipations, intentions, financialcondition, results of operations, future performance, and business, including:
• statements relating to our business strategy;
• our current and future results and plans; and
• statements that include the words “may,” “could,” “should,” “would,” “believe,” “expect,”“anticipate,” “estimate,” “intend,” “plan” or similar expressions.
Such statements include information relating to current and future business activities, operational matters,capital spending, and financing sources. From time to time, oral or written forward-looking statements are alsoincluded in Quaker’s periodic reports on Forms 10-Q and 8-K, press releases and other materials released to, orstatements made to, the public.
Any or all of the forward-looking statements in this Report, in Quaker’s Annual Report to Shareholders for2015 and in any other public statements we make may turn out to be wrong. This can occur as a result ofinaccurate assumptions or as a consequence of known or unknown risks and uncertainties. Many factorsdiscussed in this Report will be important in determining our future performance. Consequently, actual resultsmay differ materially from those that might be anticipated from our forward-looking statements.
We undertake no obligation to publicly update any forward-looking statements, whether as a result of newinformation, future events or otherwise. However, any further disclosures made on related subjects in Quaker’ssubsequent reports on Forms 10-K, 10-Q and 8-K should be consulted. Our forward-looking statements aresubject to risks, uncertainties and assumptions about us and our operations that are subject to change based onvarious important factors, some of which are beyond our control. A major risk is that the demand for theCompany’s products and services is largely derived from the demand for its customers’ products, which subjectsthe Company to uncertainties related to downturns in a customer’s business and unanticipated customerproduction shutdowns. Other major risks and uncertainties include, but are not limited to, significant increases inraw material costs, customer financial stability, worldwide economic and political conditions, foreign currencyfluctuations, future terrorist attacks and other acts of violence, each of which is discussed in greater detail inItem 1A of this Report. Furthermore, the Company is subject to the same business cycles as those experienced bysteel, automobile, aircraft, appliance, and durable goods manufacturers. These risks, uncertainties, and possibleinaccurate assumptions relevant to our business could cause our actual results to differ materially from expectedand historical results. Other factors beyond those discussed in this Report could also adversely affect us.Therefore, we caution you not to place undue reliance on our forward-looking statements. This discussion isprovided as permitted by the Private Securities Litigation Reform Act of 1995.
Item 7A. Quantitative and Qualitative Disclosures About Market Risk.
Quaker is exposed to the impact of interest rates, foreign currency fluctuations, changes in commodityprices, and credit risk.
Interest Rate Risk. Quaker’s exposure to changes in interest rates relates primarily to its credit facilities.Interest rates for Quaker’s credit facilities are generally based on a base rate or LIBOR plus a spread.Accordingly, if interest rates rise significantly, the cost of debt to Quaker will increase. This can have an adverseeffect on Quaker, depending on the extent of Quaker’s borrowings throughout a given year. As of December 31,2015, Quaker had $62.9 million outstanding under its credit facilities at a weighted average borrowing rate ofapproximately 1.38%. If interest rates had changed by 10%, the Company’s interest expense would have
32
correspondingly increased or decreased by approximately $0.1 million. Quaker’s other long-term and short-termdebt consists primarily of fixed rate bonds and loans which are not exposed to interest rate fluctuations. TheCompany previously used derivative financial instruments primarily for the purposes of hedging exposures tofluctuations in interest rates. The Company did not use any similar instruments in 2015 or 2014, and has notentered into derivative contracts for trading or speculative purposes. See the information included under thecaption “Derivatives” in Note 1 of Notes to Consolidated Financial Statements, which appears in Item 8 of thisReport and is incorporated herein by reference.
Foreign Exchange Risk. A significant portion of Quaker’s revenues and earnings are generated by itsforeign operations. These foreign operations also represent a significant portion of Quaker’s assets and liabilities.Generally, all of these foreign operations use the local currency as their functional currency. Accordingly,Quaker’s financial results are affected by foreign currency fluctuations, particularly between the U.S. dollar andthe euro, the Brazilian real, the Mexican peso, the Chinese renminbi and the Indian rupee. Quaker’s results canbe materially affected depending on the volatility and magnitude of foreign exchange rate changes. If the euro,the Brazilian real, the Mexican peso, the Chinese renminbi and the Indian rupee had all strengthened orweakened by 10% against the U.S. dollar, the Company’s 2015 revenues and pre-tax earnings would havecorrespondingly increased or decreased approximately $35.7 million and $5.0 million, respectively.
The Company generally does not use financial instruments that expose it to significant risk involvingforeign currency transactions. However, the size of its non-U.S. activities has a significant impact on reportedoperating results and the attendant net assets. During the past three years, sales by its non-U.S. subsidiariesaccounted for approximately 60% of our consolidated net sales.
In addition, the Company often sources inventory among its worldwide operations. This practice can giverise to foreign exchange risk resulting from the varying cost of inventory to the receiving location, as well asfrom the revaluation of intercompany balances. The Company primarily mitigates this risk through local sourcingefforts.
Commodity Price Risk. Many of the raw materials used by Quaker are commodity chemicals, and, therefore,Quaker’s earnings can be materially affected by market changes in raw material prices. At times, Quaker hasentered into fixed-price purchase contracts to manage this risk. These contracts provide protection to Quaker ifthe prices for the contracted raw materials rise; however, in certain limited circumstances, Quaker will not realizethe benefit if such prices decline. If the Company’s gross margin had changed by one percentage point, theCompany’s 2015 pre-tax earnings would have correspondingly increased or decreased by approximately $7.4million.
Credit Risk. Quaker establishes allowances for doubtful accounts for estimated losses resulting from theinability of its customers to make required payments. If the financial condition of Quaker’s customers were todeteriorate, resulting in an impairment of their ability to make payments, additional allowances might berequired. Downturns in the overall economic climate may also exacerbate specific customer financial issues. Asignificant portion of Quaker’s revenues is derived from sales to customers in the U.S. steel and automotiveindustries, including some of our larger customers, where a number of bankruptcies have occurred in past yearsand where companies have experienced financial difficulty. When a bankruptcy occurs, Quaker must judge theamount of proceeds, if any, that may ultimately be received through the bankruptcy or liquidation process. Inaddition, as part of its terms of trade, Quaker may custom manufacture products for certain large customers and/or may ship product on a consignment basis. These practices may increase the Company’s exposure should abankruptcy occur, and may require a write-down or disposal of certain inventory due to its estimatedobsolescence or limited marketability. Customer returns of products or disputes may also result in similar issuesrelated to the realizability of recorded accounts receivable or returned inventory. The Company recorded anincrease in its provision for doubtful accounts of $1.5 million in 2015, compared to a reduction of $0.3 million in2014 and an increase of $1.1 million in 2013. A change of 10% to the recorded provision would have increasedor decreased the Company’s pre-tax earnings by approximately $0.2 million, less than $0.1 million, and $0.1million in 2015, 2014 and 2013, respectively.
33
Item 8. Financial Statements and Supplementary Data.
INDEX TO CONSOLIDATED FINANCIAL STATEMENTS
Page
Financial Statements:
Report of Independent Registered Public Accounting Firm 35Consolidated Statements of Income 36Consolidated Statements of Comprehensive Income 37Consolidated Balance Sheets 38Consolidated Statements of Cash Flows 39Consolidated Statements of Changes in Equity 40Notes to Consolidated Financial Statements 41
34
Report of Independent Registered Public Accounting Firm
To the Shareholders and Board of Directorsof Quaker Chemical Corporation:
In our opinion, the accompanying consolidated balance sheets and the related consolidated statements of income,comprehensive income, changes in equity, and cash flows present fairly, in all material respects, the financialposition of Quaker Chemical Corporation and its subsidiaries (the “Company”) at December 31, 2015 and 2014, andthe results of their operations and their cash flows for each of the three years in the period ended December 31, 2015in conformity with accounting principles generally accepted in the United States of America. Also in our opinion,the Company maintained, in all material respects, effective internal control over financial reporting as ofDecember 31, 2015, based on criteria established in Internal Control—Integrated Framework (2013) issued by theCommittee of Sponsoring Organizations of the Treadway Commission (COSO). The Company’s management isresponsible for these financial statements, for maintaining effective internal control over financial reporting and forits assessment of the effectiveness of internal control over financial reporting, included in Management’s Report onInternal Control over Financial Reporting appearing under Item 9A. Our responsibility is to express opinions onthese financial statements and on the Company’s internal control over financial reporting based on our integratedaudits. We conducted our audits in accordance with the standards of the Public Company Accounting OversightBoard (United States). Those standards require that we plan and perform the audits to obtain reasonable assuranceabout whether the financial statements are free of material misstatement and whether effective internal control overfinancial reporting was maintained in all material respects. Our audits of the financial statements includedexamining, on a test basis, evidence supporting the amounts and disclosures in the financial statements, assessingthe accounting principles used and significant estimates made by management, and evaluating the overall financialstatement presentation. Our audit of internal control over financial reporting included obtaining an understanding ofinternal control over financial reporting, assessing the risk that a material weakness exists, and testing andevaluating the design and operating effectiveness of internal control based on the assessed risk. Our audits alsoincluded performing such other procedures as we considered necessary in the circumstances. We believe that ouraudits provide a reasonable basis for our opinions.
A company’s internal control over financial reporting is a process designed to provide reasonable assuranceregarding the reliability of financial reporting and the preparation of financial statements for external purposes inaccordance with generally accepted accounting principles. A company’s internal control over financial reportingincludes those policies and procedures that (i) pertain to the maintenance of records that, in reasonable detail,accurately and fairly reflect the transactions and dispositions of the assets of the company; (ii) provide reasonableassurance that transactions are recorded as necessary to permit preparation of financial statements in accordancewith generally accepted accounting principles, and that receipts and expenditures of the company are being madeonly in accordance with authorizations of management and directors of the company; and (iii) provide reasonableassurance regarding prevention or timely detection of unauthorized acquisition, use, or disposition of the company’sassets that could have a material effect on the financial statements.
Because of its inherent limitations, internal control over financial reporting may not prevent or detect misstatements.Also, projections of any evaluation of effectiveness to future periods are subject to the risk that controls maybecome inadequate because of changes in conditions, or that the degree of compliance with the policies orprocedures may deteriorate.
As described in Management’s Report on Internal Control over Financial Reporting appearing under Item 9A,management has excluded Verkol S.A. from its assessment of internal control over financial reporting as of December 31,2015 because this entity was acquired by the Company in a purchase business combination in July 2015. We have alsoexcluded Verkol S.A. from our audit of internal control over financial reporting. Verkol S.A. is a wholly owned subsidiaryof the Company, whose total assets and total revenues represent 6% and 2%, respectively, of the related consolidatedfinancial statement amounts as of and for the year ended December 31, 2015.
QUAKER CHEMICAL CORPORATIONCONSOLIDATED STATEMENTS OF INCOME
(Dollars in thousands, except per share data)
Year Ended December 31,
2015 2014 2013
Net sales $737,555 $765,860 $729,395
Costs and expensesCost of goods sold 460,515 492,654 468,320Selling, general and administrative expenses 198,990 195,850 189,832Restructuring and related activities 6,790 — —
666,295 688,504 658,152
Operating income 71,260 77,356 71,243Other (expense) income, net (69) 767 3,519Interest expense (2,585) (2,371) (2,922)Interest income 1,624 2,541 986
Income before taxes and equity in net income of associated companies 70,230 78,293 72,826Taxes on income before equity in net income of associated companies 17,785 23,539 20,489
Income before equity in net income of associated companies 52,445 54,754 52,337Equity in net income of associated companies 261 3,543 6,514
Net income 52,706 58,297 58,851Less: Net income attributable to noncontrolling interest 1,526 1,805 2,512
Net income attributable to Quaker Chemical Corporation $ 51,180 $ 56,492 $ 56,339
Earnings per common share data:Net income attributable to Quaker Chemical Corporation Common
Shareholders – basic $ 3.84 $ 4.27 $ 4.28Net income attributable to Quaker Chemical Corporation Common
Shareholders – diluted $ 3.84 $ 4.26 $ 4.27
The accompanying notes are an integral part of these consolidated financial statements.
36
QUAKER CHEMICAL CORPORATIONCONSOLIDATED STATEMENTS OF COMPREHENSIVE INCOME
(Dollars in thousands)
Year Ended December 31,
2015 2014 2013
Net income $ 52,706 $ 58,297 $58,851
Other comprehensive (loss) income, net of taxCurrency translation adjustments (24,869) (15,701) (3,490)Defined benefit retirement plans
Net gain (loss) arising during the period, other 3,821 (6,210) 6,614Amortization of actuarial loss 2,561 2,162 2,748Amortization of prior service (gain) loss (82) (70) 119
Unrealized loss on available-for-sale securities (978) (124) (142)
Other comprehensive (loss) income (19,547) (19,943) 5,849
Comprehensive income 33,159 38,354 64,700Less: Comprehensive income attributable to noncontrolling interest (889) (1,568) (1,206)
Comprehensive income attributable to Quaker Chemical Corporation $ 32,270 $ 36,786 $63,494
The accompanying notes are an integral part of these consolidated financial statements.
37
QUAKER CHEMICAL CORPORATIONCONSOLIDATED BALANCE SHEETS
(Dollars in thousands, except par value and share amounts)
December 31,
2015 2014
ASSETSCurrent assets
Cash and cash equivalents $ 81,053 $ 64,731Accounts receivable, net 188,297 189,484Inventories, net 75,099 77,708Current deferred tax assets 7,822 8,367Prepaid expenses and other current assets 13,582 11,228
Total current assets 365,853 351,518
Property, plant and equipment, net 87,619 85,763Goodwill 79,111 77,933Other intangible assets, net 73,287 70,408Investments in associated companies 20,354 21,751Non-current deferred tax assets 27,071 24,411Other assets 32,218 33,742
Total assets $685,513 $665,526
LIABILITIES AND EQUITYCurrent liabilities
Short-term borrowings and current portion of long-term debt $ 662 $ 403Accounts payable 67,291 74,987Dividends payable 4,252 3,990Accrued compensation 19,166 19,853Accrued restructuring 6,303 —Accrued pension and postretirement benefits 1,144 1,239Current deferred tax liabilities 41 732Other current liabilities 25,696 23,697
Common stock $1 par value; authorized 30,000,000 shares; issued and outstanding2015 – 13,288,113 shares; 2014 – 13,300,891 shares 13,288 13,301
Capital in excess of par value 106,333 99,056Retained earnings 326,740 299,524Accumulated other comprehensive loss (73,316) (54,406)
Total Quaker shareholders’ equity 373,045 357,475
Noncontrolling interest 8,198 7,660
Total equity 381,243 365,135
Total liabilities and equity $685,513 $665,526
The accompanying notes are an integral part of these consolidated financial statements.
38
QUAKER CHEMICAL CORPORATIONCONSOLIDATED STATEMENTS OF CASH FLOWS
(Dollars in thousands)
Year Ended December 31,
2015 2014 2013
Cash flows from operating activitiesNet income $ 52,706 $ 58,297 $ 58,851Adjustments to reconcile net income to net cash provided by operating activities
Depreciation 12,395 12,306 12,339Amortization 6,811 4,325 3,445Equity in undistributed earnings of associated companies, net of dividends 578 (3,180) (4,162)Deferred income taxes (2,401) 1,007 (30)Uncertain tax positions (non-deferred portion) (1,122) (1,256) (1,826)Acquisition-related fair value adjustments — — 200Deferred compensation and other, net 14 3,174 (259)Stock-based compensation 5,919 5,309 4,161Restructuring and related activities 6,790 — —(Gain) loss on disposal of property, plant and equipment and other assets (12) (86) 200Insurance settlement realized (760) (1,907) (988)Pension and other postretirement benefits 2,591 1,265 862
(Decrease) increase in cash from changes in current assets and current liabilities, net ofacquisitions:
Accounts receivable (188) (24,944) (11,837)Inventories 1,292 (5,484) 406Prepaid expenses and other current assets (721) 2,003 (743)Accounts payable and accrued liabilities (9,040) 2,999 11,301Change in restructuring liabilities (490) — —Estimated taxes on income (930) 862 1,881
Net cash provided by operating activities 73,432 54,690 73,801
Cash flows from investing activitiesInvestments in property, plant and equipment (11,033) (13,052) (11,439)Payments related to acquisitions, net of cash acquired (24,058) (73,527) (2,478)Proceeds from disposition of assets 135 201 513Insurance settlement interest earned 35 44 52Change in restricted cash, net 725 1,863 936
Net cash used in investing activities (34,196) (84,471) (12,416)
Cash flows from financing activitiesProceeds from long-term debt 6,163 58,771 —Repayment of long-term debt (477) (1,368) (12,791)Dividends paid (16,513) (14,562) (13,018)Stock options exercised, other 1,048 804 (307)Payments for repurchase of common stock (7,276) — —Excess tax benefit related to stock option exercises 384 453 815Purchase of noncontrolling interest in affiliates, net — (7,422) —Payment of acquisition-related liabilities (226) (4,709) —Distributions to noncontrolling affiliate shareholders — (1,806) (905)
Net cash (used in) provided by financing activities (16,897) 30,161 (26,206)
Effect of exchange rate changes on cash (6,017) (4,141) 766Net increase (decrease) in cash and cash equivalents 16,322 (3,761) 35,945Cash and cash equivalents at beginning of period 64,731 68,492 32,547
Cash and cash equivalents at end of period $ 81,053 $ 64,731 $ 68,492
Supplemental cash flow disclosures:Cash paid during the year for:
Non-cash activities:Change in accrued purchases of property, plant and equipment, net $ 209 $ (1,158) $ 1,287
The accompanying notes are an integral part of these consolidated financial statements.
39
QUAKER CHEMICAL CORPORATIONCONSOLIDATED STATEMENTS OF CHANGES IN EQUITY
(Dollars in thousands, except per share amounts)
Commonstock
Capital inexcess ofpar value
Retainedearnings
Accumulatedother
comprehensiveloss
Noncontrollinginterest Total
Balance at December 31, 2012 $13,095 $ 94,470 $215,390 $(41,855) $ 8,576 $289,676Net income — — 56,339 — 2,512 58,851Adjustment to prior period earnings — — (335) — — (335)Amounts reported in other
comprehensive income (loss) — — — 7,155 (1,306) 5,849Dividends ($0.995 per share) — — (13,109) — — (13,109)Distributions to noncontrolling affiliate
shareholders — — — — (905) (905)Shares issued upon exercise of stock
options and other 24 (668) — — — (644)Shares issued for employee stock
purchase plan 6 331 — — — 337Equity based compensation plans 71 4,090 — — — 4,161Excess tax benefit from stock option
exercises — 815 — — — 815
Balance at December 31, 2013 13,196 99,038 258,285 (34,700) 8,877 344,696Net income — — 56,492 — 1,805 58,297Amounts reported in other
comprehensive loss — — — (19,706) (237) (19,943)Dividends ($1.15 per share) — — (15,253) — — (15,253)Distributions to noncontrolling affiliate
shareholders — — — — (1,806) (1,806)Acquisition of noncontrolling interests,
net — (6,443) — — (979) (7,422)Shares issued upon exercise of stock
options and other 19 369 — — — 388Shares issued for employee stock
purchase plan 6 410 — — — 416Equity based compensation plans 80 5,229 — — — 5,309Excess tax benefit from stock option
exercises — 453 — — — 453
Balance at December 31, 2014 13,301 99,056 299,524 (54,406) 7,660 365,135Net income — — 51,180 — 1,526 52,706Amounts reported in other
comprehensive loss — — — (18,910) (637) (19,547)Repurchases of common stock (87) — (7,189) — — (7,276)Dividends ($1.26 per share) — — (16,775) — — (16,775)Disposition of noncontrolling interest — — — — (351) (351)Shares issued upon exercise of stock
options and other 17 602 — — — 619Shares issued for employee stock
purchase plan 6 423 — — — 429Equity based compensation plans 51 5,868 — — — 5,919Excess tax benefit from stock option
exercises — 384 — — — 384
Balance at December 31, 2015 $13,288 $106,333 $326,740 $(73,316) $ 8,198 $381,243
The accompanying notes are an integral part of these consolidated financial statements.
40
QUAKER CHEMICAL CORPORATIONNOTES TO CONSOLIDATED FINANCIAL STATEMENTS
(Dollars in thousands, except share and per share amounts)
Note 1 – Significant Accounting Policies
Principles of consolidation: All majority-owned subsidiaries are included in the Company’s consolidatedfinancial statements, with appropriate elimination of intercompany balances and transactions. Investments inassociated companies (less than majority-owned and in which the Company has significant influence) areaccounted for under the equity method. The Company’s share of net income or losses in these investments inassociated companies is included in the Consolidated Statement of Income. The Company periodically reviewsthese investments for impairments and, if necessary, would adjust these investments to their fair value when adecline in market value or other impairment indicators are deemed to be other than temporary. See Note 14 ofNotes to Consolidated Financial Statements.
The Financial Accounting Standards Board’s (“FASB’s”) guidance regarding the consolidation of certainVariable Interest Entities (“VIEs”) generally requires that assets, liabilities and results of the activities of a VIEbe consolidated into the financial statements of the enterprise that is considered the primary beneficiary. Theconsolidated financial statements include the accounts of the Company and all of its subsidiaries in which acontrolling interest is maintained and would include any VIEs if the Company was the primary beneficiarypursuant to the provisions of the applicable guidance.
Translation of foreign currency: Assets and liabilities of non-U.S. subsidiaries and associated companiesare translated into U.S. dollars at the respective rates of exchange prevailing at the end of the year. Income andexpense accounts are translated at average exchange rates prevailing during the year. Translation adjustmentsresulting from this process are recorded directly in equity as accumulated other comprehensive (loss) income(“AOCI”) and will be included as income or expense only upon sale or liquidation of the underlying investment.Generally, all of the Company’s non-U.S. subsidiaries use their local currency as their functional currency.
Cash and cash equivalents: The Company invests temporary and excess funds in money market securitiesand financial instruments having maturities typically within 90 days. The Company considers all highly liquidinvestments with original maturities of three months or less to be cash equivalents. The Company has notexperienced losses from the aforementioned investments.
Inventories: Inventories are valued at the lower of cost or market value, and are valued using the first-in,first-out (“FIFO”) method. See Note 11 of Notes to Consolidated Financial Statements.
Long-lived assets: Property, plant and equipment are stated at cost. Depreciation is computed using thestraight-line method on an individual asset basis over the following estimated useful lives: buildings andimprovements, 10 to 45 years; and machinery and equipment, 1 to 15 years. The carrying values of long-livedassets are evaluated whenever changes in circumstances or current events indicate the carrying amount of suchassets may not be recoverable. An estimate of undiscounted cash flows produced by the asset, or the appropriategroup of assets, is compared with the carrying value to determine whether an impairment exists. If necessary, theCompany recognizes an impairment loss for the difference between the carrying amount of the assets and theirestimated fair value. Fair value is based on current and anticipated future cash flows. Upon sale or otherdispositions of long-lived assets, the applicable amounts of asset cost and accumulated depreciation are removedfrom the accounts and the net amount, less proceeds from disposals, is recorded in the Consolidated Statementsof Income. Expenditures for renewals or improvements that increase the estimated useful life or capacity of theassets are capitalized, whereas expenditures for repairs and maintenance are expensed when incurred. See Note12 of Notes to Consolidated Financial Statements.
Capitalized software: The Company capitalizes certain costs in connection with developing or obtainingsoftware for internal use. These costs are amortized over a period of 3 to 5 years once the assets are ready for
41
QUAKER CHEMICAL CORPORATIONNOTES TO CONSOLIDATED FINANCIAL STATEMENTS – Continued
(Dollars in thousands, except share and per share amounts)
their intended use. In connection with the implementations and upgrades to the Company’s global transaction,consolidation and other related systems, approximately $1,289 and $1,350 of net costs were capitalized inproperty, plant and equipment on the Company’s December 31, 2015 and 2014 Consolidated Balance Sheets,respectively.
Goodwill and other intangible assets: The Company records goodwill, definite-lived intangible assets andindefinite-lived intangible assets at fair value at the date of acquisition. Goodwill and indefinite-lived intangibleassets are not amortized, but tested for impairment at least annually. These tests will be performed morefrequently if triggering events indicate potential impairment. Definite-lived intangible assets are amortized overtheir estimated useful lives, generally for periods ranging from 4 to 20 years. The Company continually evaluatesthe reasonableness of the useful lives of these assets, consistent with the discussion of long-lived assets, above.See Note 13 of Notes to Consolidated Financial Statements.
Revenue recognition: The Company recognizes revenue in accordance with the terms of the underlyingagreements, when title and risk of loss have been transferred, when collectability is reasonably assured, and whenpricing is fixed or determinable. For the Company, this generally occurs when products are shipped to customersor, for consignment-type arrangements, upon usage by the customer and when services are performed. Licensefees and royalties are included in other income when recognized in accordance with their agreed-upon terms,when performance obligations are satisfied, when the amount is fixed or determinable, and when collectability isreasonably assured. As part of the Company’s chemical management services, certain third-party product sales tocustomers are managed by the Company. Where the Company acts as a principal, revenues are recognized on agross reporting basis at the selling price negotiated with its customers. Where the Company acts as an agent, suchrevenue is recorded using net reporting as service revenue at the amount of the administrative fee earned by theCompany for ordering the goods. Third-party products transferred under arrangements resulting in net reportingtotaled $48,580, $46,844 and $41,553 for 2015, 2014 and 2013, respectively.
Accounts receivable and allowance for doubtful accounts: Trade accounts receivable subject theCompany to credit risk. Trade accounts receivable are recorded at the invoiced amount and generally do not bearinterest. The allowance for doubtful accounts is the Company’s best estimate of the amount of probable creditlosses with its existing accounts receivable. Reserves for customers filing for bankruptcy protection are generallyestablished at 75-100% of the amount outstanding at the bankruptcy filing date. However, initially establishing areserve and the amount thereto is dependent on the Company’s evaluation of likely proceeds to be received fromthe bankruptcy process, which could result in the Company recognizing minimal or no reserve at the date ofbankruptcy. Large and/or financially distressed customers are generally reserved for on a specific review basiswhile a general reserve is established for other customers based on historical experience. The Company performsa formal review of its allowance for doubtful accounts quarterly. Account balances are charged off against theallowance when the Company feels it is probable the receivable will not be recovered. The Company does nothave any off-balance-sheet credit exposure related to its customers. During 2015, the Company’s five largestcustomers accounted for approximately 18% of its consolidated net sales with the largest customer (Arcelor-Mittal Group) accounting for approximately 8% of the Company’s consolidated net sales. See Note 10 of Notesto Consolidated Financial Statements.
Research and development costs: Research and development costs are expensed as incurred and areincluded in selling, general and administrative expenses (“SG&A”). Research and development expenses were$22,090, $22,134 and $21,578 in 2015, 2014 and 2013, respectively.
Environmental liabilities and expenditures: Accruals for environmental matters are recorded when it isprobable that a liability has been incurred and the amount of the liability can be reasonably estimated. If there is a
42
QUAKER CHEMICAL CORPORATIONNOTES TO CONSOLIDATED FINANCIAL STATEMENTS – Continued
(Dollars in thousands, except share and per share amounts)
range of estimated liability and no amount in that range is considered more probable than another, then theCompany records the lowest amount in the range in accordance with generally accepted accounting principles.Accrued liabilities are exclusive of claims against third parties and are not discounted. Environmental costs andremediation costs are capitalized if the costs extend the life, increase the capacity or improve safety or efficiencyof the property from the date acquired or constructed, and/or mitigate or prevent contamination in the future. SeeNote 23 of Notes to Consolidated Financial Statements.
Asset retirement obligations: The Company follows the FASB’s guidance regarding asset retirementobligations, which addresses the accounting and reporting for obligations associated with the retirement oftangible long-lived assets and the associated retirement costs. Also, the Company follows the FASB’s guidancefor conditional asset retirement obligations (“CARO”), which relates to legal obligations to perform an assetretirement activity in which the timing and (or) method of settlement are conditional on a future event that mayor may not be within the control of the entity. In accordance with this guidance, the Company records a liabilitywhen there is enough information regarding the timing of the CARO to perform a probability-weighteddiscounted cash flow analysis. At December 31, 2015 and 2014, the Company had limited exposure to suchobligations and had immaterial liabilities recorded for such on its Consolidated Balance Sheets.
Pension and other postretirement benefits: The Company maintains various noncontributory retirementplans, the largest of which is in the U.S., covering substantially all of its employees in the U.S. and certain othercountries. The plans of the Company’s subsidiaries in The Netherlands, the United Kingdom (“U.K.”), Mexicoand Sweden are subject to the provisions of FASB’s guidance regarding employers’ accounting for definedbenefit pension plans. The plans of the remaining non-U.S. subsidiaries are, for the most part, either fully insuredor integrated with the local governments’ plans and are not subject to the provisions of the guidance. Theguidance requires that employers recognize on a prospective basis the funded status of their defined benefitpension and other postretirement plans on their consolidated balance sheet and, also, recognize as a component ofother comprehensive income, net of tax, the gains or losses and prior service costs or credits that arise during theperiod but are not recognized as components of net periodic benefit cost. The Company’s U.S. pension plan yearends on November 30 and the measurement date is December 31. The measurement date for the Company’sother postretirement benefits plan is December 31.
The Company’s pension investment policy is designed to ensure that pension assets are invested in a mannerconsistent with meeting the future benefit obligations of the pension plans and maintaining compliance withvarious laws and regulations including the Employee Retirement Income Security Act of 1974 (“ERISA”). TheCompany establishes strategic asset allocation percentage targets and appropriate benchmarks for significantasset classes with the aim of achieving a prudent balance between return and risk. The Company’s investmenthorizon is generally long term, and, accordingly, the target asset allocations encompass a long-term perspectiveof capital markets, expected risk and return and perceived future economic conditions while also considering theprofile of plan liabilities. To the extent feasible, the short-term investment portfolio is managed to immunize theshort-term obligations, the intermediate portfolio duration is immunized to reduce the risk of volatility inintermediate plan distributions, and the total return portfolio is expected to maximize the long-term real growthof plan assets. The critical investment principles of diversification, assessment of risk and targeting the optimalexpected returns for given levels of risk are applied. The Company’s investment guidelines prohibit use ofsecurities such as letter stock and other unregistered securities, commodities or commodity contracts, short sales,margin transactions, private placements (unless specifically addressed by addendum), or any derivatives, optionsor futures for the purpose of portfolio leveraging.
The target asset allocation is reviewed periodically and is determined based on a long-term projection ofcapital market outcomes, inflation rates, fixed income yields, returns, volatilities and correlation relationships.The interaction between plan assets and benefit obligations is periodically studied to assist in establishing such
43
QUAKER CHEMICAL CORPORATIONNOTES TO CONSOLIDATED FINANCIAL STATEMENTS – Continued
(Dollars in thousands, except share and per share amounts)
strategic asset allocation targets. Asset performance is monitored with an overall expectation that plan assets willmeet or exceed benchmark performance over rolling five-year periods. The Company’s pension committee, asauthorized by the Company’s Board of Directors, has discretion to manage the assets within established assetallocation ranges approved by senior management of the Company. As of December 31, 2015, the plan’sinvestments were in compliance with all approved ranges of asset allocations. See Note 18 of Notes toConsolidated Financial Statements.
Comprehensive income (loss): The Company presents other comprehensive income (loss) in its Statementof Comprehensive Income. The Company follows the FASB’s guidance regarding the disclosure ofreclassifications from AOCI which requires the disclosure of significant amounts reclassified from eachcomponent of AOCI, the related tax amounts and the income statement line items affected by suchreclassifications. The Company elected to present the information in its Notes to the Consolidated FinancialStatements. See Note 20 of Notes to Consolidated Financial Statements.
Income taxes and uncertain tax positions: The provision for income taxes is determined using the assetand liability approach of accounting for income taxes. Under this approach, deferred taxes represent the futuretax consequences expected to occur when the reported amounts of assets and liabilities are recovered or paid. Theprovision for income taxes represents income taxes paid or payable for the current year and the change indeferred taxes during the year. Deferred taxes result from differences between the financial and tax bases of theCompany’s assets and liabilities and are adjusted for changes in tax rates and tax laws when changes are enacted.Valuation allowances are recorded to reduce deferred tax assets when it is more likely than not that a tax benefitwill not be realized. The FASB’s guidance regarding accounting for uncertainty in income taxes prescribes therecognition threshold and measurement attributes for financial statement recognition and measurement of taxpositions taken or expected to be taken on a tax return. The guidance further requires the determination ofwhether the benefits of tax positions will be more likely than not sustained upon audit based upon the technicalmerits of the tax position. For tax positions that are determined to be more likely than not sustained upon audit, acompany recognizes the largest amount of benefit that is greater than 50% likely of being realized upon ultimatesettlement in the financial statements. For tax positions that are not determined to be more likely than notsustained upon audit, a company does not recognize any portion of the benefit in the financial statements.Additionally, the Company monitors and adjusts for derecognition, classification, and penalties and interest ininterim periods, with appropriate disclosure and transition thereto. Also, the amount of interest expense andincome related to uncertain tax positions is computed by applying the applicable statutory rate of interest to thedifference between the tax position recognized, including timing differences, and the amount previously taken orexpected to be taken in a tax return. The Company’s continuing practice is to recognize interest and/or penaltiesrelated to income tax matters in income tax expense. Finally, when applicable, the Company nets its liability forunrecognized tax benefits against deferred tax assets related to net operating losses or other tax creditcarryforwards that would apply if the uncertain tax position were settled for the presumed amount at the balancesheet date. See Note 8 of Notes to Consolidated Financial Statements.
Derivatives: The Company is exposed to the impact of changes in interest rates, foreign currencyfluctuations, changes in commodity prices and credit risk. The Company is currently not using derivativeinstruments to mitigate the risks associated with foreign currency fluctuations, changes in commodity prices orcredit risk, but has used derivative financial instruments primarily for purposes of hedging exposures tofluctuations in interest rates in the past. When used, the Company recognized all derivatives on its balance sheetat fair value. For derivative instruments designated as cash flow hedges, the effective portion of any hedge wouldbe reported in AOCI until it was cleared to earnings during the same period in which the hedged item affectedearnings. The Company currently uses no derivative instruments designated as hedges and, also, has not enteredinto derivative contracts for trading or speculative purposes.
44
QUAKER CHEMICAL CORPORATIONNOTES TO CONSOLIDATED FINANCIAL STATEMENTS – Continued
(Dollars in thousands, except share and per share amounts)
Fair value measurements: The Company utilizes the FASB’s guidance regarding fair value measurements,which establishes a common definition for fair value to be applied to guidance requiring use of fair value,establishes a framework for measuring fair value and expands disclosure about such fair value measurements.Specifically, the guidance utilizes a fair value hierarchy that prioritizes the inputs to valuation techniques used tomeasure fair value into three broad levels. See Note 22 of Notes to Consolidated Financial Statements. Thefollowing is a brief description of those three levels:
• Level 1: Observable inputs such as quoted prices (unadjusted) in active markets for identical assets orliabilities.
• Level 2: Inputs other than quoted prices that are observable for the asset or liability, either directly orindirectly. These include quoted prices for similar assets or liabilities in active markets and quotedprices for identical or similar assets or liabilities in markets that are not active.
• Level 3: Unobservable inputs that reflect the reporting entity’s own assumptions.
Stock-based compensation: The Company applies the FASB’s guidance regarding share-based payments,which requires the recognition of the fair value of stock-based compensation as a component of expense. TheCompany has a long-term incentive program (“LTIP”) for key employees which provides for the granting ofoptions to purchase stock at prices not less than its market value on the date of the grant. Most options becomeexercisable between one and three years after the date of the grant for a period of time determined by theCompany, but not to exceed seven years from the date of grant. Restricted stock awards and restricted stock units(“RSU”) issued under the LTIP program are generally subject to time vesting over a one to five-year period. Inaddition, as part of the Company’s Global Annual Incentive Plan (“GAIP”), nonvested shares may be issued tokey employees, which generally vest over a two to five-year period. Based on historical experience, the Companyhas assumed a forfeiture rate of 13% on its nonvested stock awards. The Company will record additional expenseif the actual forfeiture rate is lower than estimated, and will record a recovery of prior expense if the actualforfeiture is higher than estimated. See Note 6 of Notes to Consolidated Financial Statements.
Earnings per share: The Company follows the FASB’s guidance regarding the calculation of earnings pershare (“EPS”) for nonvested stock awards with rights to non-forfeitable dividends. The guidance requiresnonvested stock awards with rights to non-forfeitable dividends to be included as part of the basic weightedaverage share calculation under the two-class method. See Note 9 of Notes to Consolidated Financial Statements.
Segments: The Company’s reporting segments are the same as the Company’s operating segments. TheCompany’s reportable operating segments evidence the structure of the Company’s internal organization, themethod by which the Company’s resources are allocated and the manner by which the Company assesses itsperformance. The Company’s reportable operating segments are organized by geography as follows: (i) NorthAmerica, (ii) Europe, Middle East and Africa (“EMEA”), (iii) Asia/Pacific and (iv) South America. See Note 5of Notes to Consolidated Financial Statements.
Business combinations: The Company accounts for business combinations under the acquisition method ofaccounting. This method requires the recording of acquired assets, including separately identifiable intangibleassets, and assumed liabilities at their respective acquisition date estimated fair values. Any excess of thepurchase price over the estimated fair value of the identifiable net assets acquired is recorded as goodwill. Thedetermination of the estimated fair value of assets acquired and liabilities assumed requires significant estimatesand assumptions. Based on the assessment of additional information during the measurement period, which maybe up to one year from the acquisition date, the Company may record adjustments to the estimated fair value ofassets acquired and liabilities assumed. See Note 21 of Notes to Consolidated Financial Statements.
45
QUAKER CHEMICAL CORPORATIONNOTES TO CONSOLIDATED FINANCIAL STATEMENTS – Continued
(Dollars in thousands, except share and per share amounts)
Restructuring activities: Restructuring programs consist of employee severance, rationalization ofmanufacturing or other facilities and other related items. To account for such programs, the Company appliesFASB’s guidance regarding exit or disposal cost obligations. This guidance requires that a liability for a costassociated with an exit or disposal activity be recognized when the liability is incurred, is estimable, and paymentis probable. See Note 4 of Notes to Consolidated Financial Statements.
Reclassifications: Certain information has been reclassified to conform to the current year presentation.
Accounting estimates: The preparation of financial statements in conformity with generally acceptedaccounting principles requires management to make estimates and assumptions that affect the reported amountsof assets, liabilities and disclosure of contingencies at the date of the financial statements and the reportedamounts of net sales and expenses during the reporting period. Actual results could differ from such estimates.
Note 2 – Recently Issued Accounting Standards
The FASB issued an accounting standard update in November 2015 regarding the classification of deferredtaxes on the balance sheet. The update requires that all deferred tax assets and liabilities, along with any relatedvaluation allowance, be classified as noncurrent on the balance sheet. The update does not change the existingrequirement that only permits offsetting within a jurisdiction. The guidance within this accounting standardsupdate is effective for annual and interim periods beginning after December 15, 2016, and may be applied eitherprospectively, for all deferred tax assets and liabilities, or retrospectively. Early adoption is permitted. TheCompany has not early adopted and is currently evaluating the effects of this guidance but does not expect amaterial impact.
The FASB issued an accounting standard update in September 2015 regarding the accounting and disclosurefor measurement period adjustments for business combinations. The update requires that the cumulative impactof a measurement period adjustment be recognized in the reporting period in which the adjustment is identified,rather than restating prior period financial statements. The guidance within this accounting standard update iseffective for annual and interim periods beginning after December 15, 2015, and should be applied on aprospective basis to adjustments to provisional amounts that occur after the effective date, with earlierapplication permitted for financial statements that have not been issued. As of and for the year endedDecember 31, 2015 the Company early adopted this guidance without a material impact.
The FASB issued an accounting standard update in July 2015 regarding simplifying the measurement ofinventory. The guidance is applicable for entities that measure inventory using the FIFO or average cost methods.Specifically, the update requires that inventory be measured at lower of cost or net realizable value. Netrealizable value is the estimated selling price in the ordinary course of business, less reasonably predictable costsof completion, disposal and transportation. The amendments in this update are effective for fiscal yearsbeginning after December 15, 2016, including interim periods within those fiscal years. This guidance should beapplied prospectively with early adoption permitted. The Company has not early adopted and is currentlyevaluating the effects of this guidance but does not expect a material impact.
The FASB issued an accounting standard update in May 2015 regarding the required disclosures for entitiesthat elect to measure the fair value of certain investments using the net asset value per share (or its equivalent)practical expedient in accordance with the fair value measurement authoritative guidance. The update removesthe requirement to categorize within the fair value hierarchy, and, also limits the requirement to make certainother disclosures, for all such investments. The amendments in this update are effective for fiscal years beginningafter December 15, 2015, and interim periods within those fiscal years, and should be applied on a retrospectivebasis for the periods presented. Early adoption is permitted. The Company has not early adopted and is currentlyevaluating the effects of this guidance but does not expect a material impact.
46
QUAKER CHEMICAL CORPORATIONNOTES TO CONSOLIDATED FINANCIAL STATEMENTS – Continued
(Dollars in thousands, except share and per share amounts)
The FASB issued an accounting standard update in April 2015 regarding the presentation of debt issuancecosts on the balance sheet. The update requires capitalized debt issuance costs be presented on the balance sheetas a reduction to debt, rather than recorded as a separate asset. The amendments in this update are effective forannual and interim periods beginning after December 15, 2015 and should be applied on a retrospective basis forthe periods presented. Early adoption is permitted. Also, in June 2015, the SEC staff announced that the guidancewithin this accounting standard update was not applicable to revolving debt arrangements or credit facilities. TheCompany has not early adopted and is currently evaluating the effects of this guidance, and the SEC’sannouncement, but does not expect a material impact.
The FASB issued an accounting standard update in May 2014 regarding the accounting for and disclosure ofrevenue recognition. Specifically, the update outlined a single comprehensive model for entities to use inaccounting for revenue arising from contracts with customers, which will be common to both U.S. GAAP andInternational Financial Reporting Standards (“IFRS”). The guidance was effective for annual and interim periodsbeginning after December 15, 2016, which allowed for full retrospective adoption of prior period data or amodified retrospective adoption. Early adoption was not permitted. In August 2015, the FASB issued anaccounting standard update to delay the effective date of the new revenue standard by one year, or, in otherwords, to be effective for annual and interim periods beginning after December 15, 2017. Entities will bepermitted to adopt the new revenue standard early but not before the original effective date. The Company iscurrently evaluating the effects of this guidance.
Note 3 – Out-of-Period Adjustment
During 2012, the Company reassessed its ability to significantly influence the operating and financialpolicies of its captive insurance equity affiliate, Primex, Ltd. (“Primex”). Based on its ownership percentage andother factors, the Company determined that, during 2012, the Company obtained the ability to significantlyinfluence Primex and, as a result, changed its method of accounting from the cost to equity method. During thefirst quarter of 2013, the Company identified errors in Primex’s estimated 2012 financial statements, whichprimarily related to a reinsurance contract held by Primex. The identified errors resulted in a cumulative $1,038understatement of the Company’s equity in net income from associated companies for the year endedDecember 31, 2012. The Company corrected the errors related to Primex in the first quarter of 2013, which hadthe net effect of increasing equity in net income from associated companies by $1,038 for the three months endedMarch 31, 2013 and the year ended December 31, 2013. The Company did not believe this adjustment wasmaterial to its consolidated financial statements for the year ended December 31, 2012 or to the Company’sresults for the year ended December 31, 2013 and, therefore, did not restate any prior period amounts.
Note 4 – Restructuring and Related Activities
In response to continued weak economic conditions and market declines in many regions, Quaker’smanagement approved a global restructuring plan (the “2015 Program”) in the fourth quarter of 2015 to reduceits operating costs. The 2015 Program includes re-organization of certain commercial functions, the closure ofcertain distribution, lab and administrative offices, and other related severances. In addition to these actions, theCompany made a decision to make available for sale certain technology of one of its existing businesses, whichalso resulted in employee severance and $340 of intangible assets being reclassified to other current assets as ofDecember 31, 2015.
The 2015 Program includes provisions for the reduction of total headcount by approximately 65 employeesglobally. As a result of this program, the Company recognized a $6,790, or $0.36 per diluted share, restructuringcharge in the fourth quarter of 2015. Employee separation benefits varied depending on local regulations within
47
QUAKER CHEMICAL CORPORATIONNOTES TO CONSOLIDATED FINANCIAL STATEMENTS – Continued
(Dollars in thousands, except share and per share amounts)
certain foreign countries and included severance and other benefits. The Company expects to substantiallycomplete all of the initiatives under the 2015 Program during 2016 and expects settlement of these charges tooccur primarily in 2016 as well. At this time, there are no material, additional, restructuring expenses expected tobe incurred in connection with the 2015 Program. The restructuring charges have been recorded withinrestructuring and related activities in the Consolidated Statements of Income, with the remaining accruedrestructuring balances recorded as accrued restructuring on the Consolidated Balance Sheets.
Restructuring activity recognized in connection with the 2015 Program is as follows:
Accrued restructuring as of December 31, 2015 $1,867 $4,265 $ 135 $ 36 $6,303
Note 5 – Business Segments
The Company’s reportable operating segments are organized by geography as follows: (i) North America,(ii) EMEA, (iii) Asia/Pacific and (iv) South America. Operating earnings, excluding indirect operating expenses,for the Company’s reportable operating segments are comprised of revenues less costs of goods sold and SG&Adirectly related to the respective regions’ product sales. The indirect operating expenses consist of SG&A relatedexpenses that are not directly attributable to the product sales of each respective reportable operating segment.Other items not specifically identified with the Company’s reportable operating segments include interestexpense, interest income, license fees from non-consolidated affiliates and other (expense) income.
The following tables present information about the performance of the Company’s reportable operatingsegments for the years ended December 31, 2015, 2014 and 2013:
2015 2014 2013
Net salesNorth America $344,248 $334,400 $308,353EMEA 179,717 195,309 187,794Asia/Pacific 181,056 185,974 169,505South America 32,534 50,177 63,743
Total net sales $737,555 $765,860 $729,395
48
QUAKER CHEMICAL CORPORATIONNOTES TO CONSOLIDATED FINANCIAL STATEMENTS – Continued
(Dollars in thousands, except share and per share amounts)
Total operating earnings, excluding indirect operating expenses 154,662 149,024 142,500Non-operating charges (69,602) (67,110) (67,145)Restructuring and related activities (6,790) — —Depreciation of corporate assets and amortization (7,010) (4,558) (4,112)
Consolidated operating income 71,260 77,356 71,243Other (expense) income, net (69) 767 3,519Interest expense (2,585) (2,371) (2,922)Interest income 1,624 2,541 986
Consolidated income before taxes and equity in net income of associatedcompanies $ 70,230 $ 78,293 $ 72,826
The following tables present information regarding the Company’s reportable segments’ assets as ofDecember 31, 2015, 2014 and 2013:
2015 2014 2013
Segment assetsNorth America (including Corporate) $320,312 $340,385 $298,305EMEA 163,787 124,273 103,414Asia/Pacific 181,652 170,580 144,682South America 19,762 30,288 37,745
Total segment assets $685,513 $665,526 $584,146
During 2014, the Company revised its December 31, 2013 segment asset detail, (decreasing) / increasing itspreviously published amounts in North America by ($5,764), in EMEA by ($1,360), in Asia/Pacific by $14,788and in South America by ($7,664). The Company considers such revisions to be immaterial.
Total segment long-lived assets $140,191 $141,256 $141,152
49
QUAKER CHEMICAL CORPORATIONNOTES TO CONSOLIDATED FINANCIAL STATEMENTS – Continued
(Dollars in thousands, except share and per share amounts)
The following tables present information regarding the Company’s reportable segments’ capitalexpenditures and depreciation as of December 31, 2015, 2014 and 2013:
2015 2014 2013
Capital expendituresNorth America (including Corporate) $ 4,166 $ 3,658 $ 2,793EMEA 3,081 4,811 1,391Asia/Pacific 3,169 3,202 6,386South America 617 1,381 869
Total segment capital expenditures $11,033 $13,052 $11,439
2015 2014 2013
DepreciationNorth America $ 5,577 $ 5,231 $ 5,236EMEA 2,975 3,069 3,145Asia/Pacific 2,812 2,713 2,080South America 832 1,060 1,211
Total segment depreciation $12,196 $12,073 $11,672
The following table presents information regarding the Company’s product lines that represent more than10% of consolidated revenues for December 31, 2015, 2014 and 2013, with the remaining product sales beingimpractical to present:
2015 2014 2013
Rolling lubricants 18.6% 20.1% 20.7%Machining and grinding compounds 15.3% 16.3% 17.7%Hydraulic fluids 12.6% 13.0% 12.9%Corrosion preventives 12.0% 12.5% 12.5%
During the years ended December 31, 2015, 2014 and 2013, the North American segment hadapproximately $33,990, $35,532 and $29,002 of net sales, respectively, which were attributable to non-domesticoperations. At December 31, 2015, 2014 and 2013, the North American segment had approximately $2,687,$3,145 and $3,649 of long-lived assets, respectively, which were attributable to non-domestic operations.
Inter-segment revenue for the years ended December 31, 2015, 2014 and 2013 was $9,064, $8,001 and$8,984 for North America, $17,777, $22,321 and $20,135 for EMEA, $1,005, $414 and $504 for Asia/Pacific,and $13, $0 and $0 for South America, respectively. However, all inter-segment transactions have beeneliminated from each reportable operating segment’s net sales and earnings for all periods presented in the abovetables.
50
QUAKER CHEMICAL CORPORATIONNOTES TO CONSOLIDATED FINANCIAL STATEMENTS – Continued
(Dollars in thousands, except share and per share amounts)
Note 6 – Stock-Based Compensation
The Company recognized the following share-based compensation expense in SG&A in its ConsolidatedStatement of Income for the years ended December 31, 2015, 2014 and 2013:
December 31,
2015 2014 2013
Stock options $ 730 $ 663 $ 517Nonvested stock awards and restricted stock units 2,937 2,473 1,900Employee stock purchase plan 75 73 60Non-elective and elective 401(k) matching contribution in stock 2,052 1,975 1,612Director stock ownership plan 125 125 72
Total share-based compensation expense $5,919 $5,309 $4,161
As of December 31, 2015, 2014 and 2013, the Company recorded $384, $453 and $815, respectively, ofexcess tax benefits in capital in excess of par value on its Consolidated Balance Sheets related to stock optionexercises. The Company also recognized these benefits as a cash inflow from financing activities in itsConsolidated Statements of Cash Flows, which represents the Company’s estimate of cash savings during 2015,2014 and 2013, respectively.
Stock option activity under all plans is as follows:
Number ofOptions
WeightedAverageExercise
Price(per option)
WeightedAverage
RemainingContractualTerm (years)
AggregateIntrinsic
Value
Options outstanding at January 1, 2015 87,075 $59.09Options granted 38,698 87.30Options exercised (21,157) 46.61Options forfeited (4,945) 78.42
Options outstanding at December 31, 2015 99,671 $71.73 5.1 $967
Options expected to vest at December 31, 2015 68,214 $78.78 5.6 $286
Options exercisable at December 31, 2015 31,457 $56.46 4.1 $681
The total intrinsic value of options exercised during 2015, 2014 and 2013 was approximately $852, $1,139and $2,237, respectively. Intrinsic value is calculated as the difference between the current market price of theunderlying security and the strike price of a related option.
51
QUAKER CHEMICAL CORPORATIONNOTES TO CONSOLIDATED FINANCIAL STATEMENTS – Continued
(Dollars in thousands, except share and per share amounts)
A summary of the Company’s outstanding stock options at December 31, 2015 is as follows:
As of December 31, 2015, unrecognized compensation expense related to options granted in 2013, 2014 and2015 was $36, $296 and $595, respectively.
Consistent with prior years, the Company granted stock options under its LTIP plan that are subject only totime vesting over a three-year period in the first quarters of 2012, 2013, 2014 and 2015. Also, in connection witha transition of key employees during the second quarter of 2012, stock options were granted that are also onlysubject to time vesting over a three-year period. For the purposes of determining the fair value of stock optionawards, the Company uses the Black-Scholes option pricing model and the assumptions set forth in the tablebelow:
These awards are being amortized on a straight-line basis over the respective vesting period of each award.The compensation expense recorded on each award during 2015, 2014 and 2013, respectively, is as follows:
Nonvested awards, December 31, 2015 113,910 $72.91
The fair value of the nonvested stock is based on the trading price of the Company’s common stock on thedate of grant. The Company adjusts the grant date fair value for expected forfeitures based on historicalexperience for similar awards. As of December 31, 2015, unrecognized compensation expense related to theseawards was $3,784, to be recognized over a weighted average remaining period of 1.73 years.
Activity of nonvested restricted stock units granted under the Company’s LTIP plan is shown below:
The fair value of the nonvested restricted stock units is based on the trading price of the Company’scommon stock on the date of grant. The Company adjusts the grant date fair value for expected forfeitures basedon historical experience for similar awards. As of December 31, 2015, unrecognized compensation expenserelated to these awards was $165 to be recognized over a weighted average remaining period of 1.60 years.
Employee Stock Purchase Plan
In 2000, the Board adopted an Employee Stock Purchase Plan (“ESPP”) whereby employees may purchaseCompany stock through a payroll deduction plan. Purchases are made from the plan and credited to eachparticipant’s account at the end of each month (the “Investment Date”). The purchase price of the stock is 85% ofthe fair market value on the Investment Date. The plan is compensatory and the 15% discount is expensed on theInvestment Date. All employees, including officers, are eligible to participate in this plan. A participant maywithdraw all uninvested payment balances credited to a participant’s account at any time. An employee whosestock ownership of the Company exceeds five percent of the outstanding common stock is not eligible toparticipate in this plan.
2013 Director Stock Ownership Plan
In 2013, the Company adopted the 2013 Director Stock Ownership Plan (the “Plan”), to encourage theDirectors to increase their investment in the Company, which was approved at the Company’s May 2013
53
QUAKER CHEMICAL CORPORATIONNOTES TO CONSOLIDATED FINANCIAL STATEMENTS – Continued
(Dollars in thousands, except share and per share amounts)
shareholders’ meeting. The Plan authorizes the issuance of up to 75,000 shares of Quaker common stock inaccordance with the terms of the Plan in payment of all or a portion of the annual cash retainer payable to each ofthe Company’s non-employee directors in 2013 and subsequent years during the term of the Plan. Under thePlan, each director who, on May 1 of the applicable calendar year, owns less than 400% of the annual cashretainer for the applicable calendar year, divided by the average of the closing price of a share of QuakerCommon Stock as reported by the composite tape of the New York Stock Exchange for the previous calendaryear (the “Threshold Amount”), is required to receive 75% of the annual cash retainer in Quaker common stockand 25% of the retainer in cash, unless the director elects to receive a greater percentage of Quaker commonstock (up to 100%) of the annual cash retainer for the applicable year. Each director who owns more than theThreshold Amount may elect to receive common stock in payment of a percentage (up to 100%) of the annualcash retainer. The annual retainer is $50 and the retainer payment date is June 1.
Note 7 – Other (expense) income, net
The components of other (expense) income, net for the years ended December 31, 2015, 2014 and 2013 areas follows:
2015 2014 2013
Non-income tax refunds and other related credits $ 141 $ 582 $ 2,876Change in fair value of acquisition-related liabilities — — 497Income from third party license fees 875 1,063 1,027Foreign exchange losses, net (1,184) (1,039) (1,076)Asset impairment related to a cost streamlining initiative — — (211)Gain on fixed asset disposals, net 6 128 382Other non-operating income 261 329 247Other non-operating expense (168) (296) (223)
Total other (expense) income, net $ (69) $ 767 $ 3,519
Note 8 – Taxes on Income and Uncertain Tax Positions
Taxes (benefit) on income for the years ended December 31, 2015, 2014 and 2013 are as follows:
The following is a reconciliation of income taxes at the Federal statutory rate with income taxes recorded bythe Company for the years ended December 31, 2015, 2014 and 2013:
2015 2014 2013
Income tax provision at the Federal statutory tax rate $24,578 $27,402 $25,489Differences in tax rates on foreign earnings and
remittances (5,097) (3,025) (2,487)Foreign dividends 2,690 3,278 1,922Excess foreign tax credit utilization (4,141) (5,011) (3,664)Research and development activities credit utilization (245) (226) (200)Uncertain tax positions 226 263 (589)Domestic production activities deduction (910) (567) (560)State income tax provisions, net 133 517 171Non-deductible entertainment and business meals
expense 249 278 229Miscellaneous items, net 302 630 178
Taxes on income $17,785 $23,539 $20,489
At December 31, 2015, the Company domestically had a net deferred tax asset of $8,582. In addition, theCompany has foreign tax loss carryforwards of $10,538 of which $47 expires in 2016, $150 expires in 2017,$479 expires in 2018, $374 expires in 2019, $93 expires in 2020, $354 expires in 2021, $145 expires in 2022, $6expires in 2023, $62 expires in 2024, $103 expires in 2025, $1,510 expires in 2030, and $59 expires in 2035; theremaining foreign tax losses have no expiration dates. A partial valuation allowance has been established withrespect to the tax benefit of these losses for $961.
U.S. income taxes have not been provided on the undistributed earnings of non-U.S. subsidiaries because itis the Company’s intention to continue to reinvest these earnings in those subsidiaries to support growthinitiatives. U.S. and foreign income taxes that would be payable if such earnings were distributed may be lowerthan the amount computed at the U.S. statutory rate due to the availability of tax credits. The amount of suchundistributed earnings at December 31, 2015 was approximately $203,000. Any income tax liability, whichmight result from ultimate remittance of these earnings, is expected to be substantially offset by foreign taxcredits. It is currently impractical to estimate any such incremental tax expense.
As of December 31, 2015, the Company’s cumulative liability for gross unrecognized tax benefits was$11,032. The Company had accrued $1,890 for cumulative penalties and $1,465 for cumulative interest atDecember 31, 2015. As of December 31, 2014, the Company’s cumulative liability for gross unrecognized taxbenefits was $11,845. The Company had accrued $1,845 for cumulative penalties and $1,868 for cumulativeinterest at December 31, 2014.
56
QUAKER CHEMICAL CORPORATIONNOTES TO CONSOLIDATED FINANCIAL STATEMENTS – Continued
(Dollars in thousands, except share and per share amounts)
The Company continues to recognize interest and penalties associated with uncertain tax positions as acomponent of taxes on income before equity in net income of associated companies in its Consolidated Statementof Income. The Company recognized $225 for penalties and ($226) for interest (net of expirations andsettlements) on its 2015 Consolidated Statement of Income, ($26) for penalties and ($31) for interest (net ofexpirations and settlements) on its 2014 Consolidated Statement of Income and $392 for penalties and ($247) forinterest (net of expirations and settlements) on its 2013 Consolidated Statement of Income.
The Company estimates that during the year ending December 31, 2016, it will reduce its cumulativeliability for gross unrecognized tax benefits by approximately $1,900 to $2,000 due to the expiration of thestatute of limitations with regard to certain tax positions. This estimated reduction in the cumulative liability forunrecognized tax benefits does not consider any increase in liability for unrecognized tax benefits with regard toexisting tax positions or any increase in cumulative liability for unrecognized tax benefits with regard to new taxpositions for the year ending December 31, 2016.
The Company and its subsidiaries are subject to U.S. Federal income tax, as well as the income tax ofvarious state and foreign tax jurisdictions. Tax years that remain subject to examination by major taxjurisdictions include Brazil from 2000, Italy from 2007, the Netherlands from 2009, the United Kingdom from2010, Spain from 2011, China and the United States from 2012, and various domestic state tax jurisdictions from1993.
During 2012, the Italian tax authorities initiated a transfer pricing audit of the Company’s Italian subsidiary,Quaker Italia S.r.l., relating to the tax years 2007, 2008, 2009 and 2010. During the second quarter of 2015, theItalian tax authorities completed an audit of the Company’s Italian subsidiary, Quaker Chemical S.r.l. (formerlyNP Coil Dexter Industries, S.r.l.), relating to the tax years 2010, 2011, 2012 and 2013, and proposed adjustmentsfor those years. In the fourth quarter of 2015, the Company paid the tax liability for these proposed adjustmentsin full. In the fourth quarter of 2015, the Dutch tax authorities assessed the Company’s Dutch subsidiary foradditional income taxes related to the 2011 tax year and the Dutch subsidiary filed a protest of the assessment. InJanuary 2016, the French tax authorities gave notice that they were auditing the Company’s French subsidiary. InFebruary 2016, the Italian tax authorities gave notice that they were starting an audit of the 2013 tax year forQuaker Italia S.r.l. As of December 31, 2015, the Company believes it has adequate reserves, where merited, foruncertain tax positions with respect to these audits.
A reconciliation of the beginning and ending amounts of unrecognized tax benefits for the years endedDecember 31, 2015, 2014 and 2013, respectively, is as follows:
2015 2014 2013
Unrecognized tax benefits at January 1 $11,845 $12,596 $12,410(Decrease) increase in unrecognized tax benefits taken in prior periods (416) (93) 83Increase in unrecognized tax benefits taken in current period 2,512 2,678 2,182(Decrease) in unrecognized tax benefits due to lapse of statute of limitations (1,924) (2,078) (2,485)(Decrease) increase due to foreign exchange rates (985) (1,258) 406
Unrecognized tax benefits at December 31 $11,032 $11,845 $12,596
The amount of unrecognized tax benefits above that, if recognized, would impact the Company’s taxexpense and effective tax rate is $1,137, $1,066 and $1,194 in 2015, 2014 and 2013, respectively.
57
QUAKER CHEMICAL CORPORATIONNOTES TO CONSOLIDATED FINANCIAL STATEMENTS – Continued
(Dollars in thousands, except share and per share amounts)
Note 9 – Earnings Per Share
The following table summarizes EPS calculations for the years ended December 31, 2015, 2014 and 2013:
December 31,
2015 2014 2013
Basic earnings per common shareNet income attributable to Quaker Chemical Corporation $ 51,180 $ 56,492 $ 56,339Less: income allocated to participating securities (443) (503) (481)
Net income available to common shareholders $ 50,737 $ 55,989 $ 55,858Basic weighted average common shares outstanding 13,199,630 13,126,759 13,044,842
Basic earnings per common share $ 3.84 $ 4.27 $ 4.28
Diluted earnings per common shareNet income attributable to Quaker Chemical Corporation $ 51,180 $ 56,492 $ 56,339Less: income allocated to participating securities (443) (503) (481)
Net income available to common shareholders $ 50,737 $ 55,989 $ 55,858Basic weighted average common shares outstanding 13,199,630 13,126,759 13,044,842Effect of dilutive securities 15,219 21,309 24,770
Diluted weighted average common shares outstanding 13,214,849 13,148,068 13,069,612Diluted earnings per common share $ 3.84 $ 4.26 $ 4.27
The following number of stock options are not included in diluted earnings per share since the effect wouldhave been anti-dilutive: 6,684 in 2015, 4,714 in 2014 and 2,863 in 2013.
Note 10 – Accounts Receivable and Allowance for Doubtful Accounts
At December 31, 2015 and 2014, the Company had gross trade accounts receivable totaling $196,115 and$195,982 with trade accounts receivable greater than 90 days past due of $15,653 and $10,149, respectively. Thefollowing are changes in the allowance for doubtful accounts during the years ended December 31, 2015, 2014and 2013:
Balance atBeginningof Period
Changesto Costs and
Expenses
Write-OffsCharged toAllowance
Exchange RateChanges
and OtherAdjustments
Balanceat End
of Period
Allowance for Doubtful AccountsYear ended December 31, 2015 $6,498 $1,460 $(261) $121 $7,818Year ended December 31, 2014 $7,133 $ (264) $(296) $ (75) $6,498Year ended December 31, 2013 $6,399 $1,136 $(407) $ 5 $7,133
During 2015, 2014 and 2013, the Company recorded charges of $328, or $0.02 per diluted share, $825, or$0.05 per diluted share and $0, respectively, to its allowance for doubtful accounts and SG&A due to thebankruptcies of certain customers.
Included in exchange rate changes and other adjustments are allowance for doubtful accounts of $380, $77and $0 acquired in 2015, 2014 and 2013 business acquisitions, respectively.
58
QUAKER CHEMICAL CORPORATIONNOTES TO CONSOLIDATED FINANCIAL STATEMENTS – Continued
(Dollars in thousands, except share and per share amounts)
Note 11 – Inventories
Total inventories as of December 31, 2015 and 2014 were as follows:
December 31,
2015 2014
Raw materials and supplies $36,876 $37,961Work in process and finished goods 38,223 39,747
Total inventories $75,099 $77,708
Note 12 – Property, Plant and Equipment
Property, plant and equipment as of December 31, 2015 and 2014 were as follows:
December 31,
2015 2014
Land $ 9,388 $ 7,962Building and improvements 80,110 78,911Machinery and equipment 136,329 142,102Construction in progress 5,337 5,541
The Company currently leases certain equipment under capital leases in its North America segment. During2014, the Company leased certain equipment under capital leases in its North America and EMEA segments.Gross property, plant and equipment includes $460 and $656 of capital leases with $341 and $455 ofaccumulated depreciation at December 31, 2015 and 2014, respectively. The following is a schedule by years offuture minimum lease payments:
2016 $ 642017 592018 —2019 —2020 —2021 and beyond —
Total net minimum lease payments 123Less amount representing interest (4)
Present value of net minimum lease payments $119
Note 13 – Goodwill and Other Intangible Assets
The Company completes its annual impairment test as of the end of the third quarter of each year, or morefrequently if triggering events indicate a possible impairment in one or more of its reporting units. The Companycontinually evaluates the financial performance, economic conditions and other relevant developments in
59
QUAKER CHEMICAL CORPORATIONNOTES TO CONSOLIDATED FINANCIAL STATEMENTS – Continued
(Dollars in thousands, except share and per share amounts)
assessing if an interim period impairment test for one or more of its reporting units is necessary. The Companycompleted its annual impairment assessment as of the end of the third quarter of 2015 and no impairment chargewas warranted. The estimated fair value of each of the Company’s reporting units substantially exceeded itscarrying value, with no reporting unit at risk for failing step one of the goodwill impairment test. In addition, theCompany has recorded no impairment charges in the past.
Changes in the carrying amount of goodwill for the years ended December 31, 2015 and 2014 were asfollows:
NorthAmerica EMEA
Asia/Pacific
SouthAmerica Total
Balance as of December 31, 2013 $28,127 $11,184 $15,018 $ 3,822 $58,151Goodwill additions 14,612 6,130 1,075 — 21,817Currency translation adjustments (62) (1,264) (87) (622) (2,035)
Balance as of December 31, 2014 42,677 16,050 16,006 3,200 77,933Goodwill additions 30 4,761 103 — 4,894Currency translation adjustments (264) (1,531) (865) (1,056) (3,716)
Balance as of December 31, 2015 $42,443 $19,280 $15,244 $ 2,144 $79,111
Gross carrying amounts and accumulated amortization for definite-lived intangible assets as ofDecember 31, 2015 and 2014 were as follows:
Gross CarryingAmount
AccumulatedAmortization
2015 2014 2015 2014
Customer lists and rights to sell $ 67,435 $63,502 $15,806 $12,681Trademarks and patents 23,147 18,944 5,538 4,066Formulations and product technology 5,808 5,808 4,082 3,896Other 5,788 6,647 4,565 4,950
Total definite-lived intangible assets $102,178 $94,901 $29,991 $25,593
The Company recorded $6,811, $4,325 and $3,445 of amortization expense in 2015, 2014 and 2013,respectively. Estimated annual aggregate amortization expense for the subsequent five years is as follows:
For the year ended December 31, 2016 $6,785For the year ended December 31, 2017 6,369For the year ended December 31, 2018 6,148For the year ended December 31, 2019 6,047For the year ended December 31, 2020 5,769
The Company has two indefinite-lived intangible assets totaling $1,100 for trademarks at December 31,2015 and 2014.
Note 14 – Investments in Associated Companies
As of December 31, 2015, the Company held a 50% investment in and had significant influence over KelkoQuaker Chemical, S.A. (Venezuela), Nippon Quaker Chemical, Ltd. (Japan) and Kelko Quaker Chemical S.A.(Panama) and held a 33% investment in and had significant influence over Primex, Ltd. (Barbados).
60
QUAKER CHEMICAL CORPORATIONNOTES TO CONSOLIDATED FINANCIAL STATEMENTS – Continued
(Dollars in thousands, except share and per share amounts)
The carrying amount of the Company’s equity investments at December 31, 2015 was $20,354, whichincludes its investments of $14,895 in Primex, Ltd. (Barbados); $5,014 in Nippon Quaker Chemical, Ltd.(Japan); $247 in Kelko Quaker Chemical, S.A. (Panama); and $198 in Kelko Quaker Chemical, S.A.(Venezuela).
In 2003, the Venezuela government suspended the free exchange of bolivar fuerte (“BsF”) for foreigncurrency and implemented certain foreign exchange controls that served to centralize the purchase and sale offoreign currency within the country. As of December 31, 2014, there were three legally available exchange ratesin Venezuela, the CADIVI (or the official rate, 6.3 BsF per U.S. dollar), the SICAD I (approximately 12 BsF perU.S. dollar) and the SICAD II (approximately 52 BsF per U.S. dollar). In the first quarter of 2015, the Venezuelagovernment announced changes to its exchange controls. There continues to be three exchange mechanisms inVenezuela; however, they now consist of the CADIVI, a combined SICAD I and SICAD II auction mechanism(the “SICAD”) and a newly created, marginal currency system (the “SIMADI”). The CADIVI exchange largelyremained the same, except that the government further restricted what products qualify and can, therefore, legallybe imported or traded under this exchange. The government has not fully disclosed who can access or trade onthe newly formed combined SICAD market and minimal related auctions have occurred to date. Finally, thenewly created SIMADI is legally available to all parties, however, at significantly higher exchange rates than theCADIVI or SICAD. As of December 31, 2015, the published rate for the SIMADI is approximately 198 BsF perU.S. dollar.
Venezuela’s economy has been considered hyper inflationary under U.S. GAAP since 2010, at which timethe Company’s Venezuela equity affiliate, Kelko Quaker Chemical, S.A. (“Kelko Venezuela”), changed itsfunctional currency to the U.S. dollar. Accordingly, all gains and losses resulting from the remeasurement ofKelko Venezuela’s monetary assets and liabilities to the CADIVI, SICAD, SIMADI, or other published exchangerates are required to be recorded directly to the Consolidated Statement of Income.
As of December 31, 2014, Kelko Venezuela had access to the CADIVI for imported goods, had not beeninvited to participate in any SICAD I auctions and had limited access to the SICAD II mechanism. Accordingly,the Company measured its equity investment and other related assets with Kelko Venezuela at the CADIVIexchange rate at December 31, 2014. In light of the first quarter of 2015 changes to Venezuela’s foreignexchange controls and the on-going economic challenges in Venezuela, the Company re-assessed KelkoVenezuela’s access to U.S. dollars, the impact on the operations of Kelko Venezuela, and the impact on theCompany’s equity investment and other related assets. During the first quarter of 2015, the Company determinedthat the CADIVI was no longer available to Kelko Venezuela for import transactions. As the government has yetto fully disclose who can access or trade on the SICAD mechanism and minimal related auctions have occurredto date, the Company revalued its equity investment in Kelko Venezuela and other related assets to the SIMADIexchange rate of approximately 193 BsF per U.S. dollar as of March 31, 2015. This resulted in a charge ofapproximately $2,806, or $0.21 per diluted share, recorded in the first quarter of 2015. As of December 31, 2015,the Company’s equity investment in Kelko Venezuela continues to be valued at the SIMADI exchange rate.
During the second quarter of 2014, the Company recorded a charge of $321, or $0.02 per diluted share,related to the conversion of certain BsF to U.S. dollars on the historical SICAD II exchange. During the firstquarter of 2013, the Venezuela Government announced a devaluation of the BsF, which resulted in a charge of$357, or $0.03 per diluted share.
61
QUAKER CHEMICAL CORPORATIONNOTES TO CONSOLIDATED FINANCIAL STATEMENTS – Continued
(Dollars in thousands, except share and per share amounts)
Summarized financial information of Kelko Quaker Chemical, S.A. (Venezuela), Nippon Quaker Chemical,Ltd. (Japan) and Kelko Quaker Chemical S.A. (Panama), in the aggregate, is as follows:
Net Sales $40,282 $48,834 $47,226Gross Margin 12,887 15,698 16,096Income Before Income Taxes (2,843) 3,546 3,687Net Income (3,631) 2,263 2,142
During 2015, the Company identified a correction to the presentation of December 31, 2014 summarizedfinancial information. As a result, the Company revised the December 31, 2014 current assets and currentliabilities by increasing such amounts by $15,149 each, from previously disclosed amounts. The Companyconsiders such revisions to the prior period to be immaterial.
Summarized financial information of Primex, Ltd. is as follows:
December 31,
2015 2014
Total Assets $105,585 $109,259Total Liabilities 54,534 59,773
Year Ended December 31,
2015 2014 2013
Revenue $7,058 $10,755 $20,895Income Before Income Taxes 8,407 10,929 25,625Net Income 6,334 7,352 16,876
During the first quarter of 2013, the Company identified errors in Primex’s estimated 2012 financialstatements, which primarily related to a reinsurance contract held by Primex. The identified errors resulted inincreases to Primex’s revenue of $4,905, income before taxes of $5,240 and net income of $3,422, which areincluded in the 2013 summarized financial information for Primex above. The identified errors resulted in acumulative $1,038 understatement of the Company’s equity in net income from associated companies for theyear ended December 31, 2012, which were corrected in the first quarter of 2013. See Note 3 of Notes toConsolidated Financial Statements for further information.
62
QUAKER CHEMICAL CORPORATIONNOTES TO CONSOLIDATED FINANCIAL STATEMENTS – Continued
(Dollars in thousands, except share and per share amounts)
Note 15 – Other Assets
Other assets as of December 31, 2015 and 2014 were as follows:
December 31,
2015 2014
Restricted insurance settlement $22,874 $23,599Uncertain tax positions 6,054 5,516Supplemental retirement income program 1,336 1,361Deferred compensation assets — 779Other 1,954 2,487
Total other assets $32,218 $33,742
Previously, an inactive subsidiary of the Company executed separate settlement and release agreements withtwo of its insurance carriers for $35,000, of which $22,874 remains. The proceeds of both settlements arerestricted and can only be used to pay claims and costs of defense associated with the subsidiary’s asbestoslitigation. The proceeds of the settlement and release agreements have been deposited into interest bearingaccounts which earned approximately $35 and $44 in 2015 and 2014, respectively, offset by $760 and $1,907 ofnet payments in 2015 and 2014, respectively. Due to the restricted nature of the proceeds, a correspondingdeferred credit was established in “Other non-current liabilities” for an equal and offsetting amount, and willremain until the restrictions lapse or the funds are exhausted via payments of claims and costs of defense. Seealso Notes 19 and 23 of Notes to Consolidated Financial Statements.
Note 16 – Other Current Liabilities
Other current liabilities as of December 31, 2015 and 2014 were as follows:
QUAKER CHEMICAL CORPORATIONNOTES TO CONSOLIDATED FINANCIAL STATEMENTS – Continued
(Dollars in thousands, except share and per share amounts)
Note 17 – Debt
Debt as of December 31, 2015 and 2014 includes the following:
December 31,
2015 2014
Credit facilities $62,884 $58,421Industrial development bonds 15,000 15,000Municipality-related loans 4,098 2,109Other debt obligations (including capital leases) 119 201
82,101 75,731Current portion of long-term debt (662) (403)
$81,439 $75,328
Credit facilities
The Company’s primary credit line is a $300,000 syndicated multicurrency credit agreement with a group oflenders, which matures in June 2018. The maximum amount available under this credit facility can be increasedto $400,000 at the Company’s option if the lenders agree and the Company satisfies certain conditions.Borrowings under this credit facility generally bear interest at a base rate or LIBOR rate plus a margin. AtDecember 31, 2015 and 2014, the Company had approximately $62,884 and $58,421 outstanding, primarily onthis credit facility, at weighted average borrowing rates of 1.38% and 1.16%, respectively. Access to this creditfacility is dependent on meeting certain financial, acquisition and other covenants, but primarily depends on theCompany’s consolidated leverage ratio calculation, which cannot exceed 3.50 to 1. As of December 31, 2015 and2014, the Company’s consolidated leverage ratio was below 1.0 to 1, respectively, and the Company was also incompliance with all of the other covenants.
Industrial development bonds
The Company has two fixed rate, industrial development authority demand bonds, with $5,000 due in 2018,bearing interest at a rate of 5.60%, and $10,000 due in 2028, bearing interest at a rate of 5.26%. These bondshave similar covenants to the credit facilities noted above.
Municipality-related loans
As part of a past expansion project at the Company’s Middletown, Ohio facility, it agreed to a low interestrate $3,500 loan with the Ohio Department of Development. Principal repayment on this loan began inSeptember 2010 with its final maturity being in February 2021. The current interest rate of 2% will rise to 3%beginning March 2019 until final maturity. As of December 31, 2015 and 2014, there was $1,784 and $2,109,respectively, outstanding on this loan.
With the third quarter of 2015 acquisition of Verkol S.A. (“Verkol”), the Company assumed certain loans,issued by the local government, which are either interest-free or bear interest at a subsidized rate. These loansmature periodically, with the last maturity occurring in 2026. The Company recorded these loans at fair valuebased on market interest rates on the date of acquisition and continues to measure the loans at amortized cost,recognizing the implicit interest incurred. As of December 31, 2015, there was $2,314 outstanding for theseloans.
64
QUAKER CHEMICAL CORPORATIONNOTES TO CONSOLIDATED FINANCIAL STATEMENTS – Continued
(Dollars in thousands, except share and per share amounts)
During the next five years, payments on the Company’s debt, including capital lease maturities, are due asfollows:
2016 $ 6622017 7192018 66,9312019 6562020 651
At December 31, 2015 and 2014, the amounts at which the Company’s debt is recorded are not materiallydifferent from their fair market value.
65
QUAKER CHEMICAL CORPORATIONNOTES TO CONSOLIDATED FINANCIAL STATEMENTS – Continued
(Dollars in thousands, except share and per share amounts)
Note 18 – Pension and Other Postretirement Benefits
The following table shows the Company’s plans’ funded status reconciled with amounts reported in theConsolidated Balance Sheets as of December 31, 2015 and 2014:
Pension Benefits
Other Post-Retirement
Benefits
2015 2014 2015 2014
Foreign Domestic Total Foreign Domestic Total Domestic Domestic
Change in benefit obligationGross benefit obligation at beginning of
QUAKER CHEMICAL CORPORATIONNOTES TO CONSOLIDATED FINANCIAL STATEMENTS – Continued
(Dollars in thousands, except share and per share amounts)
The accumulated benefit obligation for all defined benefit pension plans was $157,486 ($66,862 Domesticand $90,624 Foreign) and $175,431 ($70,667 Domestic and $104,764 Foreign) at December 31, 2015 and 2014,respectively.
Information for pension plans with an accumulated benefit obligation in excess of plan assets:
2015 2014
Foreign Domestic Total Foreign Domestic Total
Projected benefit obligation $92,406 $66,862 $159,268 $106,827 $70,667 $177,494Accumulated benefit obligation 90,624 66,862 157,486 104,764 70,667 175,431Fair value of plan assets 76,156 46,701 122,857 86,523 49,689 136,212
Information for pension plans with a projected benefit obligation in excess of plan assets:
2015 2014
Foreign Domestic Total Foreign Domestic Total
Projected benefit obligation $92,406 $66,862 $159,268 $106,827 $70,667 $177,494Fair value of plan assets 76,156 46,701 122,857 86,523 49,689 136,212
Components of net periodic benefit costs – pension plans:
2015 2014
Foreign Domestic Total Foreign Domestic Total
Service cost $ 2,799 $ 250 $ 3,049 $ 2,626 $ 250 $ 2,876Interest cost 2,476 2,541 5,017 3,210 2,823 6,033Expected return on plan assets (2,092) (3,453) (5,545) (2,543) (3,817) (6,360)Settlement loss 170 — 170 — — —Actuarial loss amortization 1,136 2,353 3,489 1,307 1,757 3,064Prior service cost amortization (164) 63 (101) 736 63 799
Service cost $ 2,864 $ 299 $ 3,163Interest cost 3,150 2,437 5,587Expected return on plan assets (2,245) (3,664) (5,909)Actuarial loss amortization 1,486 2,481 3,967Prior service cost amortization 30 148 178
Net periodic benefit cost $ 5,285 $ 1,701 $ 6,986
67
QUAKER CHEMICAL CORPORATIONNOTES TO CONSOLIDATED FINANCIAL STATEMENTS – Continued
(Dollars in thousands, except share and per share amounts)
Other changes recognized in other comprehensive income:
2015 2014
Foreign Domestic Total Foreign Domestic Total
Net (gain) loss arising during the period $(3,537) $ 1,134 $(2,403) $ 4,973 $ 7,290 $12,263Effect of plan amendment — — — 242 — 242Recognition of amortization in net periodic benefit
costPrior service cost 164 (63) 101 (736) (63) (799)Actuarial loss (1,306) (2,353) (3,659) (1,307) (1,757) (3,064)
Effect of exchange rates on amounts included inAOCI (2,353) — (2,353) (3,076) — (3,076)
Total recognized in other comprehensive (income)loss (7,032) (1,282) (8,314) 96 5,470 5,566
Total recognized in net periodic benefit cost andother comprehensive (income) loss $(2,707) $ 472 $(2,235) $ 5,432 $ 6,546 $11,978
2013
Foreign Domestic Total
Net (gain) arising during period $(1,558) $(5,856) $ (7,414)Effect of plan amendment (2,138) — (2,138)Recognition of amortization in net periodic benefit cost
Prior service cost (30) (148) (178)Actuarial loss (1,486) (2,481) (3,967)
Effect of exchange rates on amounts included in AOCI 1,007 — 1,007
Total recognized in other comprehensive (income) (4,205) (8,485) (12,690)
Total recognized in net periodic benefit cost and other comprehensive loss(income) $ 1,080 $(6,784) $ (5,704)
Components of net periodic benefit costs – other postretirement plan:
2015 2014 2013
Service cost $ 17 $ 19 $ 34Interest cost 195 232 185Actuarial loss amortization 83 65 32
Net periodic benefit costs $295 $316 $251
Other changes recognized in other comprehensive income – other postretirement benefit plans:
2015 2014 2013
Net (gain) loss arising during period $(302) $688 $(1,331)Amortization of actuarial loss in net periodic benefit costs (83) (65) (32)Total recognized in other comprehensive (income) loss (385) 623 (1,363)
Total recognized in net periodic benefit cost and other comprehensive (income) loss $ (90) $939 $(1,112)
68
QUAKER CHEMICAL CORPORATIONNOTES TO CONSOLIDATED FINANCIAL STATEMENTS – Continued
(Dollars in thousands, except share and per share amounts)
Estimated amounts that will be amortized from accumulated other comprehensive loss over the nextfiscal year:
Pension Plans Other Post-Retirement
BenefitsForeign Domestic Total
Actuarial loss $ 843 $2,388 $3,231 $ 61Prior service (credit) cost (161) 63 (98) —
$ 682 $2,451 $3,133 $ 61
Weighted-average assumptions used to determine benefit obligations at December 31, 2015 and 2014:
Pension BenefitsOther Postretirement
Benefits
2015 2014 2015 2014
U.S. Plans:Discount rate 4.07% 3.72% 3.88% 3.45%Rate of compensation increase 3.63% 3.63% N/A N/A
Weighted-average assumptions used to determine net periodic benefit costs for the years endedDecember 31, 2015 and 2014:
Pension BenefitsOther Postretirement
Benefits
2015 2014 2015 2014
U.S. Plans:Discount rate 3.72% 4.48% 3.45% 4.05%Expected long-term return on plan assets 7.30% 7.85% N/A N/ARate of compensation increase 3.63% 3.63% N/A N/A
Foreign Plans:Discount rate 2.51% 3.84% N/A N/AExpected long-term return on plan assets 2.55% 3.67% N/A N/ARate of compensation increase 3.05% 3.05% N/A N/A
As of December 31, 2015, the Company has elected to use a split discount rate (spot-rate approach) for theU.S. plans and certain foreign plans. Under the spot rate approach, benefit obligations have been determinedbased on application of the spot rates on a given yield curve at each future year to each plan’s projected cashflows. The use of the spot-rate approach did not have an impact on the Company’s 2015 Consolidated FinancialStatements.
The long-term rates of return on assets were selected from within the reasonable range of rates determinedby (a) historical real returns for the asset classes covered by the investment policy and (b) projections of inflationover the long-term period during which benefits are payable to plan participants. See Note 1 of Notes toConsolidated Financial Statements for further information.
69
QUAKER CHEMICAL CORPORATIONNOTES TO CONSOLIDATED FINANCIAL STATEMENTS – Continued
(Dollars in thousands, except share and per share amounts)
Assumed health care cost trend rates at December 31, 2015 and 2014:
2015 2014
Health care cost trend rate for next year 6.70% 6.90%Rate to which the cost trend rate is assumed to decline (the ultimate trend rate) 4.50% 4.50%Year that the rate reaches the ultimate trend rate 2037 2027
Assumed health care cost trend rates could have a significant effect on the amounts reported for the healthcare plans. A one-percentage-point change in assumed health care cost trend rates would have the followingeffects:
1% PointIncrease
1% PointDecrease
Effect on total service and interest cost $ 20 $ (17)Effect on postretirement benefit obligations 484 (422)
Plan Assets and Fair Value
The Company’s pension plan target asset allocation and the weighted-average asset allocations atDecember 31, 2015 and 2014 by asset category were as follows:
Foreign PlansEquity securities and other 23% 26% 22%Debt securities 77% 74% 78%
Total 100% 100% 100%
As of December 31, 2015 and 2014, “Other” consisted principally of cash and cash equivalents(approximately 1% to 2% of plan assets in each respective period).
The following is a description of the valuation methodologies used for the investments measured at fairvalue, including the general classification of such instruments pursuant to the valuation hierarchy:
Cash and Cash Equivalents
Cash and cash equivalents consist of cash and money market funds and are classified as Level 1investments.
Common Stock
Common stock is valued based on quoted market prices on an exchange in an active market and isclassified as Level 1 investments.
70
QUAKER CHEMICAL CORPORATIONNOTES TO CONSOLIDATED FINANCIAL STATEMENTS – Continued
(Dollars in thousands, except share and per share amounts)
Registered Investment Companies
The shares of registered investment companies, which represent the net asset values of shares held bythe Plan, are valued based on quoted market prices on an exchange in an active market and are classified asLevel 1 investments.
Fixed Income Corporate Securities
Corporate fixed income securities are valued using third party pricing services which are based on acombination of quoted market prices on an exchange in an active market as well as proprietary pricingmodels and inputs using observable market data and are classified as Level 2 investments.
Fixed Income U.S. and Foreign Government Securities
U.S. and foreign government fixed income securities are valued using third party pricing serviceswhich are based on a combination of quoted market prices on an exchange in an active market as well asproprietary pricing models and inputs using observable market data and are classified as Level 2investments.
Pooled Separate Accounts
Investments in the U.S. pension plan pooled separate accounts consist of insurance annuity contractsand are valued based on the reported unit value at year end. Units of the pooled separate accounts are nottraded on an exchange or in an active market; however, valuation is based on the underlying investments ofthe units and are classified as Level 2 investments.
Insurance Contract
Investments in the foreign pension plan insurance contract are valued at the highest value available forthe Company at year end, either the reported cash surrender value of the contract or the vested benefitobligation. Both the cash surrender value and the vested benefit obligation are determined based onunobservable inputs, which are contractually or actuarially determined, regarding returns, fees, the presentvalue of the future cash flows of the contract and benefit obligations. The contract is classified as a Level 3investment.
Investments in the foreign pension plan diversified equity securities of registered investmentcompanies are based upon the quoted redemption value of shares in the fund owned by the plan at year end.The shares of the fund are not available on an exchange or in an active market; however, the fair value isdetermined based on the underlying investments in the fund as traded on an exchange in an active marketand are classified as Level 2 investments.
Fixed Income – Foreign Registered Investment Companies
Investments in the foreign pension plan fixed income securities of foreign registered investmentcompanies are based upon the quoted redemption value of shares in the fund owned by the plan at year end.The shares of the fund are not available on an exchange or in an active market; however, the fair value isdetermined based on the underlying investments in the fund as traded on an exchange in an active marketand are classified as Level 2 investments.
71
QUAKER CHEMICAL CORPORATIONNOTES TO CONSOLIDATED FINANCIAL STATEMENTS – Continued
(Dollars in thousands, except share and per share amounts)
Real Estate
The foreign pension plan’s investment in real estate consists of an investment in a property fund. Thefund’s underlying investments consist of real property, which are valued using unobservable inputs. Theproperty fund is classified as a Level 3 investment.
Commingled Funds
Investments in the foreign pension plan commingled funds represent pooled institutional investments,including primarily investment trusts. As of December 31, 2015, commingled funds included approximately30 percent of investments in equity, 61 percent of investments in fixed income, and 9 percent of other non-related investments. The commingled funds are not available on an exchange or in an active market;however, the fair value is determined based on the underlying pooled investments. Generally, theseunderlying investments are traded on an exchange in an active market and, therefore, the funds are classifiedas Level 2 investments.
As of December 31, 2015 and 2014, the U.S. and foreign plans’ investments measured at fair value on arecurring basis were as follows:
TotalFair Value
Fair Value Measurements at December 31,2015 Using Fair Value Hierarchy
U.S. Pension Assets Level 1 Level 2 Level 3
Cash and cash equivalents $ 753 $ 753 $ — $ —Large capitalization common stock 13,346 13,346 — —Large capitalization registered investment companies 6,363 6,363 — —Small capitalization common stock 773 773 — —Small capitalization registered investment companies 2,333 2,333 — —International developed and emerging markets registered
investment companies 5,166 5,166 — —International developed and emerging markets common
stock 2,519 2,519 — —Fixed income corporate securities 9,601 — 9,601 —Fixed income registered investment companies 4,147 4,147 — —Fixed income U.S. and foreign government securities 308 — 308 —Pooled separate accounts 1,392 — 1,392 —
Total U.S. pension plan assets $ 46,701 $35,400 $11,301 $ —
TotalFair Value
Fair Value Measurements at December 31,2015 Using Fair Value Hierarchy
Balance at December 31, 2015 $62,409 $2,388 $64,797
73
QUAKER CHEMICAL CORPORATIONNOTES TO CONSOLIDATED FINANCIAL STATEMENTS – Continued
(Dollars in thousands, except share and per share amounts)
U.S. pension assets include Company common stock in the amounts of $773 (2% of total U.S. plan assets)and $920 (2% of total U.S. plan assets) at December 31, 2015 and 2014, respectively.
During 2013, it was discovered that the Company’s subsidiary in the U.K. did not appropriately amend atrust for a legacy change in its pension scheme, as it related to a past retirement age equalization law. Given thelack of an official deed to the pension trust, the effective date of the change to the subsidiary’s pension schemediffered from the Company’s historical beliefs, but the extent of the potential exposure was not estimable. In thefirst quarter of 2014, the Company recorded costs of $902, or $0.05 per diluted share, related to prior service costand interest cost, to appropriately reflect the past plan amendment related to the retirement age equalization law.
Cash Flows
Contributions
The Company expects to make minimum cash contributions of $7,504 to its pension plans ($4,775 Domesticand $2,729 Foreign) and $517 to its other postretirement benefit plan in 2016.
Estimated Future Benefit Payments
The following benefit payments, which reflect expected future service, as appropriate, are expected to bepaid:
The Company maintains a plan under which supplemental retirement benefits are provided to certainofficers. Benefits payable under the plan are based on a combination of years of service and existingpostretirement benefits. Included in total pension costs are charges of $927, $826 and $811 in 2015, 2014 and2013, respectively, representing the annual accrued benefits under this plan.
Defined Contribution Plan
The Company has a 401(k) plan with an employer match covering a majority of its domestic employees.The plan allows for and the Company has paid a nonelective contribution on behalf of participants who havecompleted one year of service equal to 3% of the eligible participants’ compensation in the form of Companycommon stock. Total Company contributions were $2,601, $2,498 and $2,027 for 2015, 2014 and 2013,respectively.
74
QUAKER CHEMICAL CORPORATIONNOTES TO CONSOLIDATED FINANCIAL STATEMENTS – Continued
(Dollars in thousands, except share and per share amounts)
Note 19 – Other Non-Current Liabilities
Other non-current liabilities as of December 31, 2015 and 2014 were as follows:
December 31,
2015 2014
Restricted insurance settlement $22,874 $23,599Uncertain tax positions (includes interest and penalties) 13,332 14,607Deferred and other long-term compensation 5,866 6,492Other 512 792
Total other non-current liabilities $42,584 $45,490
See also Notes 15 and 23 of Notes to Consolidated Financial Statements.
Note 20 – Equity and Accumulated Other Comprehensive Loss
In May 2015, the Company’s Board of Directors authorized a share repurchase program for the repurchaseof up to $100,000 of Quaker Chemical Corporation common stock (the “2015 Share Repurchase Program”). The2015 Share Repurchase Program has no expiration date. The 2015 Share Repurchase Program provides aframework of conditions under which management can repurchase shares of the Company’s common stock. TheCompany intends to repurchase shares to at least offset the dilutive impact of shares issued each year as part ofits employee benefit and share-based compensation plans, and could repurchase more if the Company considersthe share price to be an amount that is an advantageous return for its shareholders. The purchases may be made inthe open market or in private and negotiated transactions, in accordance with applicable laws, rules andregulations. In connection with the 2015 Share Repurchase Program, the remaining unutilized 1995 and 2005Board of Directors authorized share repurchase programs were terminated.
In connection with the 2015 Share Repurchase Program, the Company acquired 87,386 shares of commonstock for $7,276, during the year ended December 31, 2015. The Company has elected not to hold treasuryshares, and, therefore, has retired the shares as they are repurchased. It is the Company’s accounting policy torecord the excess paid over par value as a reduction in retained earnings for all shares repurchased.
The Company has 30,000,000 shares of common stock authorized, with a par value of $1, and 13,288,113and 13,300,891 shares issued as of December 31, 2015 and 2014, respectively. The change in shares issued andoutstanding during 2015 was primarily related to 87,386 shares repurchased in connection with the 2015 ShareRepurchase Program offset by 51,848 shares issued for equity-based compensation plans, 6,084 shares issued forthe ESPP and 16,676 shares issued for the exercise of stock options and other employee and director-relatedshare activity.
Holders of record of the Company’s common stock for a period of less than 36 consecutive calendar monthsor less are entitled to one vote per share of common stock. Holders of record of the Company’s common stockfor a period greater than 36 consecutive calendar months are entitled to 10 votes per share of common stock.
The Company is authorized to issue 10,000,000 shares of preferred stock, $1 par value, subject to approvalby the Board of Directors. The Board of Directors may designate one or more series of preferred stock and thenumber of shares, rights, preferences, and limitations of each series. As of December 31, 2015, no preferred stockhad been issued.
75
QUAKER CHEMICAL CORPORATIONNOTES TO CONSOLIDATED FINANCIAL STATEMENTS – Continued
(Dollars in thousands, except share and per share amounts)
The following table shows the reclassifications from and resulting balances of AOCI for the years endedDecember 31, 2015, 2014 and 2013:
CurrencyTranslationAdjustments
DefinedBenefitPensionPlans
UnrealizedGain (Loss) inAvailable-for-
SaleSecurities Total
Balance at December 31, 2012 $ 3,336 $(46,914) $ 1,723 $(41,855)Other comprehensive (loss) income before
Balance at December 31, 2015 $(38,544) $(35,251) $ 479 $(73,316)
Approximately 30% and 70% of the amounts reclassified from accumulated other comprehensive loss to theConsolidated Statement of Income for defined benefit retirement plans during the years ended December 31,2015, 2014 and 2013 were recorded in cost of goods sold and SG&A, respectively. See Note 18 of Notes toConsolidated Financial Statements for further information. All reclassifications related to unrealized gain (loss)in available-for-sale securities relate to the Company’s equity interest in a captive insurance company and arerecorded in equity in net income of associated companies. The amounts reported on the Consolidated Statementof Changes in Equity for non-controlling interest are related to currency translation adjustments.
Note 21 – Business Acquisitions
In July 2015, the Company acquired Verkol, a leading specialty grease and other lubricants manufacturerbased in northern Spain for its EMEA reportable operating segment for approximately 37,737 EUR, orapproximately $41,393, which includes a post-closing adjustment of 1,282 EUR, or approximately $1,384,accrued for by the Company as of December 31, 2015 and subsequently paid in January 2016. The purchaseincluded cash acquired of approximately 14,053 EUR, or approximately $15,423, and assumed long-term debt ofapproximately 2,187 EUR, or approximately $2,400. In addition, the Company incurred approximately $2,813,or $0.15 per diluted share, of one-time transaction expenses in the third quarter of 2015, related to thisacquisition. Verkol is a market leader with world-class grease manufacturing capabilities and state-of-the-artresearch and development facilities, selling products into industrial end markets with a particular strength servingthe steel industry. Also, Verkol brings a unique technology in continuous casting products that will provide theCompany with cross-selling opportunities to its global steel customer base. The Company allocated $11,743 ofthe purchase price to intangible assets, comprised of trademarks and formulations, to be amortized over 15 years;a non-compete agreement, to be amortized over 4 years; and customer relationships, to be amortized over 15
76
QUAKER CHEMICAL CORPORATIONNOTES TO CONSOLIDATED FINANCIAL STATEMENTS – Continued
(Dollars in thousands, except share and per share amounts)
years. In addition, the Company recorded $5,165 of goodwill, including the $1,384 post-closing adjustmentmentioned above, related to expected value not allocated to other acquired assets, none of which will be taxdeductible.
As of December 31, 2015, the allocation of the purchase price for the Verkol acquisition has not beenfinalized and the one-year measurement period has not ended. Further adjustments may be necessary as a resultof the Company’s assessment of additional information related to the fair value of assets acquired and liabilitiesassumed. The following table presents the current allocation of the purchase price of the assets acquired andliabilities assumed:
Verkol Acquisition
Current assets $ 30,998Property, plant and equipment 7,941Intangibles
Customer lists and rights to sell 6,146Trademarks and patents 5,378Other intangibles 219
Goodwill 5,165Other long-term assets 158
Total assets purchased 56,005
Current liabilities (6,681)Long-term debt (2,400)Other long-term liabilities (5,531)
Total liabilities assumed (14,612)
Cash paid for acquisitions $ 41,393
In December 2014, the Company acquired a business that is principally concerned with safety fluidapplications for mining sites in its Asia/Pacific reportable operating segment for net consideration ofapproximately 2,850 Australian dollars, or approximately $2,355. The Company also assumed an additional 300Australian dollars hold-back of consideration, which was paid out and settled during the fourth quarter of 2015.This acquisition provides a strategic opportunity for Quaker in the core Australian mining market. The Companyallocated $1,802 of the purchase price to intangible assets, comprised of trademarks and formulations, to beamortized over 15 years; a non-competition agreement, to be amortized over 5 years; and customer relationships,to be amortized over 15 years. In addition, the Company recorded $1,178 of goodwill, related to expected valuenot allocated to other acquired assets, none of which will be tax deductible.
In November 2014, the Company acquired Binol AB (“Binol”), a leading bio-lubricants producer primarilyserving the Nordic region for its EMEA reportable operating segment for approximately 136,500 SEK, orapproximately $18,536, which is net of 4,400 SEK, or approximately $528, received by the Company as part of apost-closing adjustment in the first quarter of 2015. The post-closing adjustment recorded in the first quarter of2015 adjusted the acquisition’s goodwill. This acquisition provides a strategic opportunity for Quaker to leverageBinol’s environmentally friendly technology and customer-aligned products, including neat oil technology formetalworking applications and biodegradable hydraulic oils, across the Company’s global footprint. TheCompany allocated $11,805 of the purchase price to intangible assets, comprised of trademarks and formulations,to be amortized over 15 years; a non-competition agreement, to be amortized over 5 years; and customerrelationships, to be amortized over 14 years. In addition, the Company recorded $5,726 of goodwill, net of the$528 post-closing adjustment mentioned above, related to expected value not allocated to other acquired assets,none of which will be tax deductible.
77
QUAKER CHEMICAL CORPORATIONNOTES TO CONSOLIDATED FINANCIAL STATEMENTS – Continued
(Dollars in thousands, except share and per share amounts)
In August 2014, the Company acquired ECLI Products, LLC (“ECLI”), a specialty grease manufacturer forits North American reportable operating segment for approximately $53,145, including certain post-closingadjustments. ECLI specializes in greases for OEM first-fill customers across several industry sectors, includingautomotive, industrial, aerospace/military, electronics, office automation and natural resources. This acquisitioncomplements Quaker’s entry into the specialty grease market that began in 2010, and, also, provides anopportunity to leverage Quaker’s global footprint with its current market expertise. The Company allocated$31,050 of the purchase price to intangible assets, comprised of trademarks and formulations, to be amortizedover 10 years; customer relationships, to be amortized over 15 years; and a non-compete agreement, to beamortized over 5 years. In addition, the Company recorded $14,642 of goodwill, related to expected value notallocated to other acquired assets, all of which will be tax deductible.
During 2015, the Company identified and recorded certain adjustments to the allocations of the purchaseprice for certain 2014 acquisitions. These adjustments were the result of the Company assessing additionalinformation related to assets acquired and liabilities assumed during the one-year measurement period followingeach acquisition. As of December 31, 2015, the allocations of the purchase price for all of the Company’s 2014acquisitions have been finalized. The following table presents the final allocation of the purchase price of theassets acquired and liabilities assumed in all of the Company’s acquisitions in 2014:
2014 Acquisitions
Current assets $12,413Property, plant and equipment 4,158Intangibles
Customer lists and rights to sell 30,924Trademarks and patents 12,606Other intangibles 1,127
Goodwill 21,546Other long-term assets 198
Total assets purchased 82,972
Current liabilities (4,562)Long-term liabilities (4,374)
Total liabilities assumed (8,936)
Cash paid for acquisitions $74,036
Included in the 2014 acquisitions was approximately $1,037 of cash acquired.
Additionally, in June 2014, the Company acquired the remaining 49% ownership interest in its Australianaffiliate, Quaker Chemical (Australasia) Pty. Limited (“QCA”) for 8,000 Australian dollars, or approximately$7,577, from its joint venture partner, Nuplex Industries. QCA is a part of the Company’s Asia/Pacific reportableoperating segment. This acquisition further strengthens Quaker’s position in Australia, and allows the Companyto simplify its overall corporate structure and improve its organizational efficiencies. As this acquisition was achange in an existing controlling ownership, the Company recorded $6,450 of excess purchase price over thecarrying value of the noncontrolling interest in Additional Paid in Capital.
In May 2013, the Company acquired a business that primarily related to tin plating for its North Americanreportable operating segment for net consideration of approximately $1,831.
78
QUAKER CHEMICAL CORPORATIONNOTES TO CONSOLIDATED FINANCIAL STATEMENTS – Continued
(Dollars in thousands, except share and per share amounts)
In January 2013, the Company acquired a chemical milling maskants distribution network for netconsideration of approximately $647, which was assigned to the North America reportable operating segment.The Company also assumed a hold-back of consideration for potential indemnity obligations, which was paid tothe former shareholders during the first quarter of 2014.
In December 2010, the Company acquired Summit Lubricants, Inc., which manufactures and distributesspecialty greases and lubricants, for approximately $29,833, including certain post-closing adjustments finalizedin 2011. Liabilities assumed included an earnout to be paid to the former shareholders if certain earnings targetswere met by the end of 2013. During 2013, the Company recorded net increases to other income ofapproximately $497 in its Consolidated Statement of Income to finalize the Company’s estimate of the fair valueof this contingent consideration liability, which was settled and paid during the second quarter of 2014 with apayment to the former shareholder of approximately $4,709.
The results of operations of the acquired businesses and assets are included in the Consolidated Statementsof Income from their respective acquisition dates. Transaction expenses associated with these acquisitions areincluded in SG&A in the Company’s Consolidated Statements of Income. Certain pro forma and otherinformation is not presented, as the operations of the acquired businesses are not material to the overalloperations of the Company for the periods presented.
Note 22 – Fair Value Measures
The Company has valued its company-owned life insurance policies and various deferred compensationassets and liabilities at fair value. The Company’s assets and liabilities subject to fair value measurement were asfollows:
TotalFair Value
Fair Value Measurements at December 31, 2015Using Fair Value Hierarchy
Assets Level 1 Level 2 Level 3
Company-owned life insurance $1,336 $— $1,336 $—
Total $1,336 $— $1,336 $—
TotalFair Value
Fair Value Measurements at December 31, 2014Using Fair Value Hierarchy
Assets Level 1 Level 2 Level 3
Company-owned life insurance $1,361 $— $1,361 $—Company-owned life insurance – Deferred compensation
During the second quarter of 2015, the Company’s Board of Directors authorized the termination of itsExecutive Deferred Compensation Plan. As a result, the Company had no deferred compensation assets orliabilities subject to fair value measurement and accounting related to its Executive Deferred Compensation Planon its Consolidated Balance Sheet as of December 31, 2015. In connection with the termination of the ExecutiveDeferred Compensation Plan, the Company paid out associated liabilities of $1,018 during the third quarter of2015, which were primarily funded by the Company’s previously held deferred compensation assets.
The fair values of Company-owned life insurance (“COLI”) and COLI deferred compensation assets arebased on quotes for like instruments with similar credit ratings and terms. The fair values of other deferredcompensation assets and liabilities are based on quoted prices in active markets. The Company did not holdLevel 3 investments as of December 31, 2015 and 2014, respectively, so related disclosures have not beenincluded.
Note 23 – Commitments and Contingencies
In 1992, the Company identified certain soil and groundwater contamination at AC Products, Inc. (“ACP”),a wholly owned subsidiary. In voluntary coordination with the Santa Ana California Regional Water QualityBoard (“SACRWQB”), ACP has been remediating the contamination, the principal contaminant of which isperchloroethylene (“PERC”). In 2004, the Orange County Water District (“OCWD”) filed a civil complaintagainst ACP and other parties seeking to recover compensatory and other damages related to the investigationand remediation of the contamination in the groundwater. Pursuant to a settlement agreement with OCWD, ACPagreed, among other things, to operate the two groundwater treatment systems to hydraulically containgroundwater contamination emanating from ACP’s site until the concentrations of PERC released by ACP fellbelow the current Federal maximum contaminant level for four consecutive quarterly sampling events. InFebruary 2014, ACP ceased operation at one of its two groundwater treatment systems, as it had met the abovecondition for closure. Based on the most recent modeling, it is estimated that the remaining system will operatefor another one to three years.
As of December 31, 2015, the Company believes that the range of potential-known liabilities associatedwith the balance of ACP water remediation program is approximately $360 to $1,030, for which the Companyhas sufficient reserves. The low and high ends of the range are based on the length of operation of the treatmentsystem as determined by groundwater modeling. Costs of operation include the operation and maintenance of theextraction well, groundwater monitoring and program management.
80
QUAKER CHEMICAL CORPORATIONNOTES TO CONSOLIDATED FINANCIAL STATEMENTS – Continued
(Dollars in thousands, except share and per share amounts)
The Company believes, although there can be no assurance regarding the outcome of other unrelatedenvironmental matters, that it has made adequate accruals for costs associated with other environmental problemsof which it is aware. Approximately $295 and $173 was accrued at December 31, 2015 and 2014, respectively, toprovide for such anticipated future environmental assessments and remediation costs.
An inactive subsidiary of the Company that was acquired in 1978 sold certain products containing asbestos,primarily on an installed basis, and is among the defendants in numerous lawsuits alleging injury due to exposureto asbestos. The subsidiary discontinued operations in 1991 and has no remaining assets other than proceedsreceived from insurance settlements. To date, the overwhelming majority of these claims have been disposed ofwithout payment and there have been no adverse judgments against the subsidiary. Based on a continued analysisof the existing and anticipated future claims against this subsidiary, it is currently projected that the subsidiary’stotal liability over the next 50 years for these claims is less than $3,000 (excluding costs of defense). Althoughthe Company has also been named as a defendant in certain of these cases, no claims have been actively pursuedagainst the Company, and the Company has not contributed to the defense or settlement of any of these casespursued against the subsidiary. These cases were handled by the subsidiary’s primary and excess insurers whohad agreed in 1997 to pay all defense costs and be responsible for all damages assessed against the subsidiaryarising out of existing and future asbestos claims up to the aggregate limits of their policies. A significant portionof this primary insurance coverage was provided by an insurer that is insolvent, and the other primary insurersasserted that the aggregate limits of their policies have been exhausted. The subsidiary challenged theapplicability of these limits to the claims being brought against the subsidiary. In response, two of the threecarriers entered into separate settlement and release agreements with the subsidiary in 2005 and 2007 for $15,000and $20,000, respectively. The proceeds of both settlements are restricted and can only be used to pay claims andcosts of defense associated with the subsidiary’s asbestos litigation. In 2007, the subsidiary and the remainingprimary insurance carrier entered into a Claim Handling and Funding Agreement, under which the carrier ispaying 27% of defense and indemnity costs incurred by or on behalf of the subsidiary in connection withasbestos bodily injury claims. The agreement continues until terminated and can only be terminated by eitherparty by providing a minimum of two years prior written notice. As of December 31, 2015, no notice oftermination has been given under this agreement. At the end of the term of the agreement, the subsidiary maychoose to again pursue its claim against this insurer regarding the application of the policy limits. The Companybelieves that, if the coverage issues under the primary policies with the remaining carrier are resolved adverselyto the subsidiary and all settlement proceeds were used, the subsidiary may have limited additional coveragefrom a state guarantee fund established following the insolvency of one of the subsidiary’s primary insurers.Nevertheless, liabilities in respect of claims may exceed the assets and coverage available to the subsidiary.
If the subsidiary’s assets and insurance coverage were to be exhausted, claimants of the subsidiary mayactively pursue claims against the Company because of the parent-subsidiary relationship. The Company doesnot believe that such claims would have merit or that the Company would be held to have liability for anyunsatisfied obligations of the subsidiary as a result of such claims. After evaluating the nature of the claims filedagainst the subsidiary and the small number of such claims that have resulted in any payment, the potentialavailability of additional insurance coverage at the subsidiary level, the additional availability of the Company’sown insurance and the Company’s strong defenses to claims that it should be held responsible for thesubsidiary’s obligations because of the parent-subsidiary relationship, the Company believes it is not probablethat the Company will incur losses. The Company has been successful to date having any claims naming itdismissed during initial proceedings. Since the Company may be in this stage of litigation for some time, it is notpossible to estimate additional losses or range of loss, if any.
As initially disclosed in 2010, one of the Company’s subsidiaries may have paid certain value-added-taxes(“VAT”) incorrectly and, in certain cases, may not have collected sufficient VAT from certain customers. The
81
QUAKER CHEMICAL CORPORATIONNOTES TO CONSOLIDATED FINANCIAL STATEMENTS – Continued
(Dollars in thousands, except share and per share amounts)
VAT rules and regulations at issue are complex, vary among the jurisdictions and can be contradictory, inparticular as to how they relate to the subsidiary’s products and to sales between jurisdictions. Since its inception,the subsidiary had been consistent in its VAT collection and remittance practices and had never been contactedby any tax authority relative to VAT. The subsidiary later determined that for certain products, a portion of theVAT was incorrectly paid and that the total VAT due exceeded the amount originally collected and remitted bythe subsidiary. In response, the subsidiary modified its VAT invoicing and payment procedures to eliminate ormitigate future exposure.
In 2010, three jurisdictions contacted the subsidiary and, since then, the subsidiary has either participated inan amnesty program or entered into a settlement whereby it paid a reduced portion of the amounts owed inresolution of those jurisdictions’ claims and no related accruals existed as of December 31, 2015 or 2014.
In 2013, an additional jurisdiction issued an assessment against the subsidiary for certain tax years leadingto a net charge of $796, which represented the Company’s best estimate of the amount that may ultimately bepaid. The subsidiary filed an appeal of the assessment alleging certain errors by such jurisdiction related to theassessment. During the fourth quarter of 2015, the subsidiary participated in an amnesty program whereby it paida reduced portion of the amounts owed in resolution of the jurisdictions’ claims, which was materially in linewith the Company’s previous estimate. As a result, the Company has no remaining accrual for this or any otherrelated tax assessment at December 31, 2015.
In analyzing the subsidiary’s exposure, it is difficult to estimate both the probability and the amount of anypotential liabilities due to a number of factors, including: the decrease in exposure over time due to applicablestatutes of limitations and actions taken by the subsidiary, the joint liability of customers and suppliers for aportion of the VAT, the availability of a VAT refund for VAT incorrectly paid through an administrative process,any amounts which may have been or will be paid by customers, as well as the timing and structure of any taxamnesties or settlements. In addition, interest and penalties on any VAT due can be a multiple of the base tax.The subsidiary may contest any tax assessment administratively and/or judicially for an extended period of time,but may ultimately resolve its disputes through participation in tax amnesty programs, which are a commonpractice for settling tax disputes in the jurisdictions in question and which have historically occurred on a regularbasis, resulting in significant reductions of interest and penalties. Also, the timing of payments and refunds ofVAT may not be contemporaneous, and, if additional VAT is owed, it may not be fully recoverable fromcustomers. As of December 31, 2015, the Company believes there is one potentially impacted jurisdictionremaining, and if the jurisdiction were to initiate audits and issue assessments, the remaining exposure, net ofrefunds, could be from $0 to $700, assuming the continued availability of future amnesty programs or settlementsto reduce the interest and penalties. If there are future assessments but no such future amnesty programs orsettlements, the potential exposure could be higher.
The Company is party to other litigation which management currently believes will not have a materialadverse effect on the Company’s results of operations, cash flows or financial condition.
The Company leases certain manufacturing and office facilities and equipment under non-cancelableoperating leases with various terms from 1 to 8 years expiring in 2023. Rent expense for 2015, 2014 and 2013was $5,921, $5,792, and $5,510, respectively.
82
QUAKER CHEMICAL CORPORATIONNOTES TO CONSOLIDATED FINANCIAL STATEMENTS – Continued
(Dollars in thousands, except share and per share amounts)
The Company’s minimum rental commitments under non-cancelable operating leases at December 31, 2015for future years were approximately:
2016 $5,2912017 3,0402018 7792019 4852020 1722021 and beyond 81
Note 24 – Quarterly Results (unaudited)
FirstQuarter (1)
SecondQuarter (2)
ThirdQuarter (3)
FourthQuarter (4)
2015Net sales $181,330 $183,726 $189,224 $183,275Gross profit 66,328 70,617 71,329 68,766Operating income 17,864 21,445 18,728 13,223Net income attributable to Quaker Chemical Corporation 10,378 15,038 14,371 11,393Net income attributable to Quaker Chemical Corporation
Common Shareholders – Basic $ 0.78 $ 1.13 $ 1.08 $ 0.86Net income attributable to Quaker Chemical Corporation
Net sales $181,674 $191,286 $198,867 $194,033Gross profit 65,114 68,216 70,300 69,576Operating income 19,373 20,945 20,553 16,485Net income attributable to Quaker Chemical Corporation 12,730 15,427 15,696 12,639Net income attributable to Quaker Chemical Corporation
Common Shareholders – Basic $ 0.96 $ 1.17 $ 1.18 $ 0.95Net income attributable to Quaker Chemical Corporation
(1) Net income attributable to Quaker Chemical Corporation for both the first quarter of 2015 and 2014includes earnings from the Company’s equity interest in a captive insurance company of approximately$0.06 and $0.06 per diluted share, respectively. Net income attributable to Quaker Chemical Corporation inthe first quarter of 2015 includes a currency conversion charge of approximately $0.21 per diluted sharerelated to the Company’s 50% owned equity affiliate in Venezuela and costs related to streamlining certainoperations in the Company’s South America segment of approximately $0.01 per diluted share. Net incomeattributable to Quaker Chemical Corporation in the first quarter of 2014 includes a pension charge related toan amendment to the Company’s U.K. pension plan of approximately $0.05 per diluted share.
(2) Net income attributable to Quaker Chemical Corporation for both the second quarter of 2015 and 2014includes (losses) earnings from the Company’s equity interest in a captive insurance company ofapproximately ($0.01) and $0.09 per diluted share, respectively. Net income attributable to QuakerChemical Corporation for the second quarter of 2015 includes a charge due to a certain U.S. customerbankruptcy of approximately $0.01 per diluted share. Net income attributable to Quaker ChemicalCorporation in the second quarter of 2014 includes costs related to streamlining certain operations in theCompany’s EMEA segment of approximately $0.02 per diluted share and a currency conversion charge ofapproximately $0.02 per diluted share related to the Company’s 50% owned equity affiliate in Venezuela.
83
QUAKER CHEMICAL CORPORATIONNOTES TO CONSOLIDATED FINANCIAL STATEMENTS – Continued
(Dollars in thousands, except share and per share amounts)
(3) Net income attributable to Quaker Chemical Corporation for both the third quarter of 2015 and 2014includes earnings from the Company’s equity interest in a captive insurance company of approximately$0.04 and $0.01 per diluted share, respectively. Net income attributable to Quaker Chemical Corporation forthe third quarter of 2015 includes charges of approximately $0.15 per diluted share related to certain one-time transaction expenses associated with the Company’s third quarter acquisition of Verkol, S.A. Netincome attributable to Quaker Chemical Corporation for the third quarter of 2014 includes charges due to aU.S. customer bankruptcy of approximately $0.02 per diluted share.
(4) Net income attributable to Quaker Chemical Corporation for both the fourth quarter of 2015 and 2014includes earnings from the Company’s equity interest in a captive insurance company of approximately$0.07 and $0.02 per diluted share, respectively. Net income attributable to Quaker Chemical Corporation forthe fourth quarter of 2015 includes charges of approximately $0.36 per diluted share related to a globalrestructuring plan and approximately $0.01 per diluted share due to a U.S. customer bankruptcy. Net incomeattributable to Quaker Chemical Corporation for the fourth quarter of 2014 includes costs of approximately$0.04 per diluted share related to streamlining certain operations in the Company’s South America segmentand charges due to an EMEA customer bankruptcy of approximately $0.03 per diluted share.
84
Item 9. Changes in and Disagreements With Accountants on Accounting and Financial Disclosure.
Not Applicable.
Item 9A. Controls and Procedures.
Conclusion Regarding the Effectiveness of Disclosure Controls and Procedures
As required by Rule 13a-15(b) under the Securities Exchange Act of 1934, as amended (the “ExchangeAct”), our management, including our principal executive officer and principal financial officer, has evaluatedthe effectiveness of our disclosure controls and procedures as of the end of the period covered by this report.Based on that evaluation, our principal executive officer and our principal financial officer have concluded thatas of the end of the period covered by this report our disclosure controls and procedures (as defined in Rule 13a-15(e) under the Exchange Act) were effective.
Management’s Report on Internal Control over Financial Reporting
The management of Quaker is responsible for establishing and maintaining adequate internal control overfinancial reporting as such term is defined in Rule 13a-15(f) promulgated under the Exchange Act. Internalcontrol over financial reporting is a process designed to provide reasonable assurance regarding the reliability offinancial reporting and the preparation of financial statements for external purposes in accordance with generallyaccepted accounting principles.
Because of its inherent limitations, internal control over financial reporting may not prevent or detectmisstatements. Also, projections of any evaluation of effectiveness to future periods are subject to the risk thatcontrols may become inadequate because of changes in conditions or that the degree of compliance with thepolicies or procedures may deteriorate.
Our management, with the participation of our principal executive officer and principal financial officer,assessed the effectiveness of the Company’s internal control over financial reporting as of December 31, 2015. Inmaking this assessment, our management used the criteria set forth by the Committee of SponsoringOrganizations of the Treadway Commission (“COSO”) in Internal Control – Integrated Framework (2013).Based on its assessment, Quaker’s management has concluded that as of December 31, 2015, the Company’sinternal control over financial reporting is effective based on those criteria.
Management has excluded Verkol S.A. from our assessment of internal control over financial reporting as ofDecember 31, 2015, because this entity was acquired by the Company in a purchase business combination in July2015. This entity is a wholly owned subsidiary, whose total assets and total revenues represent approximately 6%and 2%, respectively, of the related consolidated financial statement amounts as of and for the year endedDecember 31, 2015.
The effectiveness of the Company’s internal control over financial reporting as of December 31, 2015 hasbeen audited by PricewaterhouseCoopers LLP, an independent registered public accounting firm, as stated intheir report which is included in “Item 8. Financial Statements and Supplementary Data.”
Changes in Internal Controls Over Financial Reporting
As required by Rule 13a-15(d) under the Exchange Act, our management, including our principal executiveofficer and principal financial officer, has evaluated our internal control over financial reporting to determinewhether any changes to our internal control over financial reporting occurred during the fourth quarter of the yearended December 31, 2015 that have materially affected, or are reasonably likely to materially affect, our internalcontrol over financial reporting. Based on that evaluation, no such changes to our internal control over financialreporting occurred during the fourth quarter of the year ended December 31, 2015.
Item 9B. Other Information.
None.
85
PART III
Item 10. Directors, Executive Officers and Corporate Governance.
Incorporated by reference is (i) the information beginning with and including the caption “Proposal 1 –Election of Directors and Nominee Biographies” in Quaker’s definitive Proxy Statement relating to the AnnualMeeting of Shareholders to be held May 4, 2016, to be filed with the SEC no later than 120 days after the closeof its fiscal year ended December 31, 2015 (the “2016 Proxy Statement”) to, but not including, the sub-caption“Governance Committee Procedures for Selecting Director Nominees ,” (ii) the information appearing inItem 4(a) of this Report, (iii) the information in the 2016 Proxy Statement beginning with and including thecaption, “Section 16(a) Beneficial Ownership Reporting Compliance” to, but not including, the caption “CertainRelationships and Related Transactions,” (iv) the information in the 2016 Proxy Statement beginning with andincluding the sub-caption “Code of Conduct” to, but not including, the caption “Compensation CommitteeInterlocks and Insider Participation,” and (v) the information in the 2016 Proxy Statement beginning with andincluding the sub-caption “Shareholder Nominations and Recommendations” to, but not including, the sub-caption “Board Oversight of Risk.”
Item 11. Executive Compensation.
Incorporated by reference is (i) the information in the 2016 Proxy Statement beginning with and includingthe caption “Compensation Committee Interlocks and Insider Participation” to, but not including the caption“Proposal 2 – Approval of the Global Annual Incentive Plan” and (ii) the information in the 2016 ProxyStatement beginning with and including the caption “Executive Compensation” to, but not including, the caption“Stock Ownership of Certain Beneficial Owners and Management.”
Item 12. Security Ownership of Certain Beneficial Owners and Management and Related StockholderMatters.
Incorporated by reference is the information in the 2016 Proxy Statement beginning with and including thecaption “Stock Ownership of Certain Beneficial Owners and Management” to, but not including, the caption“Section 16(a) Beneficial Ownership Reporting Compliance.”
Equity Compensation Plans
The following table sets forth certain information relating to the Company’s equity compensation plans asof December 31, 2015. Each number of securities reflected in the table is a reference to shares of Quakercommon stock.
Equity Compensation Plan Information
Plan Category
Number of securitiesto be issued upon
exercise ofoutstanding options,warrants and rights
Weighted-averageexercise price of
outstanding options,warrants and rights
Number of securitiesremaining available forfuture issuance under
equity compensation plans(excluding securities
reflected in column (a))
(a) (b) (c)
Equity compensation plans approved by securityholders 99,671 $71.73 642,116(1)
Equity compensation plans not approved bysecurity holders — — —
Total 99,671 $71.73 642,116
(1) As of December 31, 2015, 304,900 of these shares were available for issuance as restricted stock awardsunder the Company’s 2001 Global Annual Incentive Plan, 266,314 shares were available for issuance upon
86
the exercise of stock options and/or as restricted stock awards and/or restricted stock unit awards under theCompany’s 2011 Long-Term Performance Incentive Plan, and 70,902 shares were available for issuanceunder the 2013 Director Stock Ownership Plan.
Item 13. Certain Relationships and Related Transactions, and Director Independence.
Incorporated by reference is (i) the information in the 2016 Proxy Statement beginning with and includingthe caption “Certain Relationships and Related Transactions” to, but not including, the caption “Proposal 4 –Ratification of Appointment of Independent Registered Public Accounting Firm,” (ii) the information in the 2016Proxy Statement beginning with and including the sub-caption “Director Independence” to, but not including, thesub-caption “Governance Committee Procedures for Selecting Director Nominees,” and (iii) the information inthe 2016 Proxy Statement beginning with and including the caption “Meetings and Committees of the Board” to,but not including, the caption “Compensation Committee Interlocks and Insider Participation.”
Item 14. Principal Accountant Fees and Services.
Incorporated by reference is the information in the 2016 Proxy Statement beginning with and including thesub-caption “Audit Fees” to, but not including, the statement recommending a vote for ratification of theappointment of PricewaterhouseCoopers LLP as the Company’s independent registered public accounting firmfor the year ending December 31, 2016.
87
PART IV
Item 15. Exhibits and Financial Statement Schedules.
(a) Exhibits and Financial Statement Schedules
1. Financial Statements and Supplementary Data.
Page
Financial Statements:Report of Independent Registered Public Accounting Firm 35Consolidated Statements of Income 36Consolidated Statements of Comprehensive Income 37Consolidated Balance Sheets 38Consolidated Statements of Cash Flows 39Consolidated Statements of Changes in Equity 40Notes to Consolidated Financial Statements 41
2. Financial Statement Schedules
All schedules are omitted because they are not applicable or the required information is shown in thefinancial statements or notes thereto. Financial statements of 50% or less owned companies have been omittedbecause none of the companies meets the criteria requiring inclusion of such statements.
3. Exhibits (numbered in accordance with Item 601 of Regulation S-K)
3(i) — Articles of Incorporation (as amended through July 31, 2013). Incorporated by reference toExhibit 3.1 as filed by Registrant with Form 8-K filed on July 31, 2013.
3(ii) — By-laws (as amended and restated, effective May 6, 2015). Incorporated by reference to Exhibit3.2 as filed by Registrant with Form 8-K filed on May 8, 2015.
10.1 — Deferred Compensation Plan as adopted by the Registrant dated December 17, 1999, effectiveJuly 1, 1997. Incorporated by reference to Exhibit 10(ff) as filed by Registrant with Form 10-Kfor the year 1999. *
10.2 — Supplemental Retirement Income Program adopted by the Registrant on November 6, 1984, asamended November 8, 1989. Incorporated by reference to Exhibit 10(gg) as filed by Registrantwith Form 10-K for the year 1999. *
10.3 — 2001 Global Annual Incentive Plan as approved May 9, 2001, effective January 1, 2001.Incorporated by reference to Exhibit 10(hh) as filed by Registrant with Form 10-K for the year2001. *
10.4 — Credit Agreement between Registrant and Bank of America, N.A. and ABN AMRO Bank, N.V.and Banc of America Securities, in the amount of $100,000,000, dated October 14, 2005.Incorporated by reference to Exhibit 10(jjj) as filed by the Registrant with Form 10-Q for thequarter ended September 30, 2005.
10.5 — Settlement Agreement and Release between Registrant, an inactive subsidiary of the Registrant,and Hartford Accident and Indemnity Company dated December 12, 2005. Incorporated byreference to Exhibit 10(nnn) as filed by the Registrant with Form 10-K for the year 2005.
10.6 — Amendment to Registrant’s Deferred Compensation Plan for key officers dated December 20,2005. Incorporated by reference to Exhibit 10 as filed by Registrant with Form 8-K filed onDecember 22, 2005. *
88
10.7 — 2001 Global Annual Incentive Plan, as amended and restated. Incorporated by reference toAppendix D to the Registrant’s definitive proxy statement filed on March 31, 2006. *
10.8 — 2006 Long-Term Performance Incentive Plan. Incorporated by reference to Appendix E to theRegistrant’s definitive proxy statement filed on March 31, 2006. *
10.9 — Form of Stock Option Agreement provided for associates under the Registrant’s 2006 Long-Term Performance Incentive Plan. Incorporated by reference to Exhibit 10.3 as filed byRegistrant with Form 8-K filed on May 12, 2006. *
10.10 — Form of Restricted Stock Award Agreement for executive officers and other employees underRegistrant’s 2006 Long-Term Performance Incentive Plan. Incorporated by reference to Exhibit10 as filed by Registrant with Form 8-K filed on June 27, 2006. *
10.11 — Employment Agreement by and between L. Willem Platzer and Quaker Chemical B.V., aNetherlands corporation and a subsidiary of Registrant, dated August 21, 2006. Incorporated byreference to Exhibit 10 as filed by the Registrant with Form 8-K filed on August 22, 2006. *
10.12 — First Amendment to Syndicated Multicurrency Credit Agreement between Registrant and Bankof America, N.A. and certain other financial institutions dated October 6, 2006. Incorporated byreference to Exhibit 10.30 as filed by the Registrant with Form 10-K for the year ended 2008.
10.13 — 2006 Long-Term Performance Incentive Plan (amended and restated effective November 8,2006). Incorporated by reference to Exhibit 10(www) as filed by the Registrant with Form 10-Kfor the year ended 2006. *
10.14 — Financing Agreement by and among Montgomery County Industrial Development Authorityand Registrant and Brown Brothers Harriman & Co. dated February 1, 2007. Incorporated byreference to Exhibit 10(yyy) as filed by the Registrant with Form 10-K for the year ended 2006.
10.15 — Settlement Agreement and Release between Registrant, an inactive subsidiary of Registrant andFederal Insurance Company dated March 26, 2007. Incorporated by reference to Exhibit10(zzz) as filed by the Registrant with Form 10-Q for the quarter ended March 31, 2007.
10.16 — Change in Control Agreement by and between Registrant and L. Willem Platzer dated April 2,2007, effective January 1, 2007. Incorporated by reference to Exhibit 10(aaaa) as filed by theRegistrant with Form 10-Q for the quarter ended March 31, 2007. *
10.17 — Change in Control Agreement by and between Registrant and Jan F. Nieman dated June 27,2007, effective January 1, 2007. Incorporated by reference to Exhibit 10 (cccc) as filed by theRegistrant with Form 10-Q for the quarter ended June 30, 2007. *
10.18 — Memorandum of Employment dated June 28, 2007 between Registrant and Mark A.Featherstone, effective April 9, 2007. Incorporated by reference to Exhibit 10 as filed by theRegistrant with Form 8-K filed on July 2, 2007. *
10.19 — Second Amendment to Syndicated Multicurrency Credit Agreement between Registrant andBank of America, N.A. and certain other financial institutions dated August 13, 2007.Incorporated by reference to Exhibit 10(eeee) as filed by the Registrant with Form 10-Q for thequarter ended September 30, 2007.
10.20 — Claim Handling and Funding Agreement between SB Decking, Inc., an inactive subsidiary ofRegistrant, and Employers Insurance Company of Wausau dated September 25, 2007.Incorporated by reference to Exhibit 10(ffff) as filed by the Registrant with Form 10-Q for thequarter ended September 30, 2007.
10.21 — Settlement Agreement and Mutual Release entered into between AC Products, Inc., whollyowned subsidiary of Registrant, and Orange County Water District, effective November 8,2007. Incorporated by reference to Exhibit 10.47 as filed by the Registrant with Form 10-K forthe year ended 2007.
89
10.22 — Financing Agreement by and among Butler County Port Authority and Registrant and BrownBrothers Harriman & Co. dated May 15, 2008. Incorporated by reference to Exhibit 10.1 asfiled by the Registrant with Form 10-Q for the quarter ended June 30, 2008.
10.23 — Engineering, Procurement and Construction Contract by and between Registrant and FMCTechnologies, Inc., effective May 14, 2008. Incorporated by reference to Exhibit 10.2 as filedby the Registrant with Form 10-Q for the quarter ended June 30, 2008.
10.24 — Employment Agreement by and between Registrant and Michael F. Barry dated July 1, 2008.Incorporated by reference to Exhibit 10.5 as filed by the Registrant with Form 10-Q for thequarter ended June 30, 2008. *
10.25 — Change in Control Agreement by and between Registrant and Michael F. Barry dated July 1,2008. Incorporated by reference to Exhibit 10.6 as filed by the Registrant with Form 10-Q forthe quarter ended June 30, 2008. *
10.26 — Butler County Port Authority Industrial Development Revenue Bond dated May 15, 2008.Incorporated by reference to Exhibit 10.7 as filed by the Registrant with Form 10-Q for thequarter ended June 30, 2008.
10.27 — Expatriate Agreement by and between Jan F. Nieman and Quaker Chemical Limited (HongKong) and Quaker Chemical B.V., both subsidiaries of Registrant, dated June 3, 2003, effectiveAugust 1, 2003 and Amended Expatriate Agreement by and between Jan F. Nieman and QuakerChemical (China) Co. Ltd., Quaker Chemical Limited (Hong Kong) and Quaker ChemicalB.V., all subsidiaries of Registrant, dated July 27, 2008, effective August 1, 2008. Incorporatedby reference to Exhibit 10.37 as filed by the Registrant with Form 10-K for the year endedDecember 31, 2009. *
10.28 — Memorandum of Employment by and between Registrant and Joseph F. Matrange datedSeptember 30, 2008. Incorporated by reference to Exhibit 10.48 as filed by the Registrant withForm 10-K for the year ended 2008. *
10.29 — Memorandum of Employment by and between Registrant and D. Jeffry Benoliel dated October1, 2008. Incorporated by reference to Exhibit 10.49 as filed by the Registrant with Form 10-Kfor the year ended 2008. *
10.30 — Amendment to Memorandum of Employment by and between Mark A. Featherstone andRegistrant dated November 19, 2008, effective January 1, 2008. Incorporated by reference toExhibit 10.52 as filed by the Registrant with Form 10-K for the year ended 2008. *
10.31 — Change in Control Agreement by and between Registrant and Mark A. Featherstone datedNovember 19, 2008, effective January 1, 2008. Incorporated by reference to Exhibit 10.53 asfiled by the Registrant with Form 10-K for the year ended 2008. *
10.32 — Change in Control Agreement by and between Registrant and D. Jeffry Benoliel datedNovember 19, 2008, effective January 1, 2008. Incorporated by reference to Exhibit 10.54 asfiled by the Registrant with Form 10-K for the year ended 2008. *
10.33 — Change in Control Agreement by and between Registrant and Joseph F. Matrange datedNovember 19, 2008, effective October 1, 2008. Incorporated by reference to Exhibit 10.55 asfiled by the Registrant with Form 10-K for the year ended 2008. *
10.34 — Change in Control Agreement by and between Registrant and Ronald S. Ettinger datedNovember 19, 2008, effective October 1, 2008. Incorporated by reference to Exhibit 10.56 asfiled by the Registrant with Form 10-K for the year ended 2008. *
10.35 — Change in Control Agreement by and between Registrant and George H. Hill dated November19, 2008, effective October 1, 2008. Incorporated by reference to Exhibit 10.57 as filed by theRegistrant with Form 10-K for the year ended 2008. *
90
10.36 — Supplemental Retirement Income Program (as amended and restated effective January 1, 2008),approved November 19, 2008. Incorporated by reference to Exhibit 10.58 as filed by theRegistrant with Form 10-K for the year ended 2008. *
10.37 — Amendment No. 1 to the 2001 Global Annual Incentive Plan (as amended and restated effectiveJanuary 1, 2006), approved November 19, 2008. Incorporated by reference to Exhibit 10.60 asfiled by the Registrant with Form 10-K for the year ended 2008. *
10.38 — Amendment No. 1 to the 2006 Long-Term Performance Incentive Plan (as amended andrestated effective November 8, 2006), approved November 19, 2008. Incorporated by referenceto Exhibit 10.61 as filed by the Registrant with Form 10-K for the year ended 2008. *
10.39 — Third Amendment to Syndicated Multicurrency Credit Agreement between Registrant and Bankof America, N.A. and certain other financial institutions dated February 13, 2009, effectiveFebruary 17, 2009. Incorporated by reference to Exhibit 10.62 as filed by the Registrant withForm 10-K for the year ended 2008.
10.40 — Amended Expatriate Agreement by and between Jan F. Nieman and Quaker Chemical (China)Ltd., Quaker Chemical Limited (Hong Kong) and Quaker Chemical B.V., all subsidiaries ofRegistrant, dated April 6, 2010, effective March 1, 2010. Incorporated by reference to Exhibit10.1 as filed by the Registrant with Form 10-Q for the quarter ended March 31, 2010. *
10.41 — Employment Agreement by and between Registrant and Joseph Berquist dated April 1, 2010.Incorporated by reference to Exhibit 10.2 as filed by the Registrant with Form 10-Q for thequarter ended March 31, 2010. *
10.42 — Change in Control Agreement by and between Registrant and Joseph Berquist dated April 1,2010. Incorporated by reference to Exhibit 10.3 as filed by the Registrant with Form 10-Q forthe quarter ended March 31, 2010. *
10.43 — Fourth Amendment to Syndicated Multicurrency Credit Agreement between Registrant andBank of America, N.A. and certain other financial institutions dated June 21, 2010.Incorporated by reference to Exhibit 10.1 as filed by the Registrant with Form 10-Q for thequarter ended June 30, 2010.
10.44 — Stock Purchase Agreement by and among Registrant, Summit Lubricants Inc., Ronald Krol,Brian Caputi, Dale M. Perry and Anthony Musilli, dated December 31, 2010. Incorporated byreference to Exhibit 10.54 as filed by the Registrant with Form 10-K for the year ended 2010.
10.45 — Employment Agreement by and between Carlos Claro and Quaker Chemical Industria eComercio Ltda., a Brazilian corporation and a subsidiary of the Registrant, dated January 5,2011. Incorporated by reference to Exhibit 10.56 as filed by the Registrant with Form 10-K forthe year ended 2010. *
10.46 — Employment Agreement by and between Dieter Laininger and Quaker Chemical B.V., asubsidiary of the registrant, dated June 1, 2011, effective June 15, 2011. Incorporated byreference to Exhibit 10.1 as filed by the Registrant with Form 10-Q for the quarter endedJune 30, 2011. *
10.47 — Change in Control Agreement by and between Registrant and Dieter Laininger dated May 31,2011, effective June 15, 2011. Incorporated by reference to Exhibit 10.1 as filed by theRegistrant with Form 10-Q for the quarter ended June 30, 2011. *
10.48 — Global Annual Incentive Plan (as amended and restated effective May 11, 2011). Incorporatedby reference to Appendix B to the Registrant’s definitive proxy statement filed on March 31,2011. *
91
10.49 — 2011 Long-Term Performance Incentive Plan. Incorporated by reference to Appendix C to theRegistrant’s definitive proxy statement filed on March 31, 2011. *
10.50 — Form of Restricted Stock Unit Agreement for executive officers and other employees underRegistrant’s 2011 Long-Term Performance Incentive Plan. Incorporated by reference to Exhibit10.1 as filed by the Registrant with Form 10-Q for the quarter ended March 31, 2012. *
10.51 — Memorandum of Employment by and between Registrant and Margaret M. Loebl, dated May22, 2012, effective June 29, 2012. Incorporated by reference to Exhibit 10.1 as filed by theRegistrant with Form 10-Q for the quarter ended June 30, 2012. *
10.52 — Change in Control Agreement by and between Registrant and Margaret M. Loebl, dated May22, 2012, effective June 29, 2012. Incorporated by reference to Exhibit 10.2 as filed by theRegistrant with Form 10-Q for the quarter ended June 30, 2012. *
10.53 — Amendment to Employment Agreement by and between Jan Nieman and Quaker ChemicalLimited (Hong Kong) and Quaker Chemical, B.V., both subsidiaries of Registrant, datedAugust 2, 2012. Incorporated by reference to Exhibit 10.1 as filed by the Registrant with Form10-Q for the quarter ended September 30, 2012. *
10.54 — Expatriate Agreement by and between the Registrant and Dieter Laininger, dated January 14,2013, effective January 15, 2013. Incorporated by reference to Exhibit 10.59 as filed by theRegistrant with Form 10-K for the year ended 2013. *
10.55 — Expatriate Agreement by and between the Registrant and Adrian Steeples, dated January 29,2013, effective July 1, 2013. Incorporated by reference to Exhibit 10.1 as filed by the Registrantwith Form 10-Q for the quarter ended March 31, 2013. *
10.56 — 2013 Director Stock Ownership Plan as approved May 8, 2013. Incorporated by reference toAppendix B to the Registrant’s definitive proxy statement filed on March 28, 2013. *
10.57 — Amended and Restated Multicurrency Credit Agreement by and between Registrant and Bankof America, N.A. and certain other lenders dated June 14, 2013. Incorporated by reference toExhibit 10.1 as filed by the Registrant with Form 10-Q for the quarter ended June 30, 2013.
10.58 — Memorandum of Employment and Addendum by and between Registrant and Jan F. Nieman,effective August 1, 2013. Incorporated by reference to Exhibit 10.2 as filed by the Registrantwith Form 10-Q for the quarter ended June 30, 2013.*
10.59 — Expatriate Agreement by and between the Registrant and Dieter Laininger, dated and effectiveFebruary 27, 2014. Incorporated by reference to Exhibit 10.1 as filed by the Registrant withForm 10-Q for the quarter ended March 31, 2014. *
10.60 — Memorandum of Employment by and between Registrant and Mary Dean Hall, dated andeffective November 30, 2015.*
10.61 — Change in control agreement by and between Registrant and Mary Dean Hall, dated andeffective November 30, 2015.*
10.62 — Retirement Savings Plan, as amended and restated effective January 1, 2016.*
21 — Subsidiaries and Affiliates of the Registrant
23 — Consent of Independent Registered Public Accounting Firm
31.1 — Certification of Chief Executive Officer of the Company pursuant to Rule 13a-14(a) of theSecurities Exchange Act of 1934.
31.2 — Certification of Chief Financial Officer of the Company pursuant to Rule 13a-14(a) of theSecurities Exchange Act of 1934.
32.1 — Certification of Michael F. Barry pursuant to 18 U.S.C. Section 1350.
92
32.2 — Certification of Mary Dean Hall pursuant to 18 U.S.C. Section 1350.
101.INS — XBRL Instance Document
101.SCH — XBRL Extension Schema Document
101.CAL — XBRL Calculation Linkbase Document
101.DEF — XBRL Definition Linkbase Document
101.LAB — XBRL Label Linkbase Document
101.PRE — XBRL Presentation Linkbase Document
* This exhibit is a management contract or compensation plan or arrangement required to be filed as an exhibitto this Report.
(b) Exhibits required by Regulation 601 S-K
See (a) 3 of this Item 15.
(c) Financial Statement Schedules
See (a) 2 of this Item 15.
93
SIGNATURES
Pursuant to the requirements of Section 13 or 15(d) of the Securities Exchange Act of 1934, theRegistrant has duly caused this Report to be signed on its behalf by the undersigned, thereunto dulyauthorized.
QUAKER CHEMICAL CORPORATIONRegistrant
By: /s/ MICHAEL F. BARRY
Michael F. BarryChairman of the Board, Chief Executive
Officer and President
Date: February 25, 2016
Pursuant to the requirements of the Securities Exchange Act of 1934, this Report has been signedbelow by the following persons on behalf of the Registrant and in the capacities and on the dates indicated.
Signatures Capacity Date
/s/ MICHAEL F. BARRYMichael F. Barry
Chairman of the Board, Chief Executive Officer andPresident
Principal Executive Officer andDirector
February 25, 2016
/s/ MARY DEAN HALLMary Dean Hall
Vice President, Chief Financial Officer and Treasurer
Principal Financial Officer February 25, 2016
/s/ SHANE W. HOSTETTERShane W. HostetterGlobal Controller
Principal Accounting Officer February 25, 2016
/s/ JOSEPH B. ANDERSON, JR.Joseph B. Anderson, Jr
Director February 25, 2016
/s/ PATRICIA C. BARRONPatricia C. Barron
Director February 25, 2016
/s/ DONALD R. CALDWELLDonald R. Caldwell
Director February 25, 2016
/s/ ROBERT E. CHAPPELLRobert E. Chappell
Director February 25, 2016
/s/ WILLIAM R. COOKWilliam R. Cook
Director February 25, 2016
/s/ MARK A. DOUGLASMark A. Douglas
Director February 25, 2016
/s/ JEFFRY D. FRISBYJeffry D. Frisby
Director February 25, 2016
/s/ ROBERT H. ROCKRobert H. Rock
Director February 25, 2016
94
EXHIBIT 21
SUBSIDIARIES AND AFFILIATES OF THE REGISTRANT
NameJurisdiction ofIncorporation
Percentage of Voting Securities OwnedDirectly or Indirectly by Quaker
* Quaker Chemical Corporation Delaware, U.S.A. 100%+* SB Decking, Inc. (formerly Selby, Battersby & Co.) Delaware, U.S.A. 100%
* AC Products, Inc. California, U.S.A. 100%* Epmar Corporation California, U.S.A. 100%* Summit Lubricants, Inc. New York, U.S.A. 100%* G.W. Smith and Sons, Inc. Ohio, U.S.A 100%* Tecniquimia Mexicana S.A. de C.V. Mexico 100%* Unitek Servicios De Asesoiria Especializad S.A. Mexico 100%
+* Quaker Chemical Europe B.V. Holland 100%* Quaker Chemical B.V. Holland 100%
+* Quaker Russia B.V. (formerly KWR Holdings B.V.) Holland 100%* Quaker Chemical (China) Co. Ltd. China 100%
+* Quaker China Holdings B.V. Holland 100%* Quaker Chemical Canada Limited Ontario, Canada 100%* Quaker Chemical Limited United Kingdom 100%* Quaker Chemical S.A. France 100%* Quaker Chemical, S.A. Spain 100%
+* Quaker Denmark ApS Denmark 100%* Quaker Chemical S.A. Argentina 100%
+* Quaker Chemical Participacoes, Ltda. Brazil 100%* Quaker Chemical Limited Hong Kong 100%
+* Quaker Chemical Holdings South Africa (Pty) Limited Republic of South Africa 100%* Quaker Italia S.r.l. Italy 100%* Quaker Chemical S.r.l. Italy 100%
+* Quaker Australia Holdings Pty. Limited Victoria, Australia 100%* Quaker Shanghai Trading Company Limited China 100%* Quaker Chemical Industria e Comercio Ltda. Brazil 100%* Quaker Chemical Operacoes, Ltda. Brazil 100%* Quaker Chemical India Private Limited India 55%* Quaker Chemical (Australasia) Pty. Limited New South Wales, Australia 100%* Quaker (Thailand) Ltd. Thailand 100%* Quaker Chemical South Africa (Pty.) Limited Republic of South Africa 51%* Quaker Chemical Corporation Mexico, S.A. de C.V. Mexico 100%* Quaker Chemical HR Mexico, S.A. de C.V. Mexico 100%* ECLI Products, LLC Illinois, U.S.A. 100%* Engineered Custom Lubricants GmbH Germany 100%* Binol AB Sweden 100%* Binol Biosafe OY Finland 100%* Quaker Chemical MEA FZE Dubai 100%* Verkol S.A. Spain 100%
+ A non-operating company.* Included in the consolidated financial statements.
** Accounted for in the consolidated financial statements under the equity method.
EXHIBIT 23
CONSENT OF INDEPENDENT REGISTERED PUBLIC ACCOUNTING FIRM
We hereby consent to the incorporation by reference in the Registration Statements on Form S-3 (RegistrationNo. 333-155607) and on Form S-8 (Registration Nos. 333-48130, 033-54158, 333-58676, 333-115713,333-136648, 333-159513, 333-174145, 333-208188 and 333-188594) of Quaker Chemical Corporation of ourreport dated February 25, 2016 relating to the financial statements and the effectiveness of internal control overfinancial reporting, which appears in this Form 10-K.
CERTIFICATION OF CHIEF EXECUTIVE OFFICER OF THE COMPANY PURSUANT TO RULE13a-14(a) OF THE SECURITIES EXCHANGE ACT OF 1934
I, Michael F. Barry, certify that:
1. I have reviewed this Annual Report on Form 10-K of Quaker Chemical Corporation;
2. Based on my knowledge, this report does not contain any untrue statement of a material fact or omit tostate a material fact necessary to make the statements made, in light of the circumstances under whichsuch statements were made, not misleading with respect to the period covered by this report;
3. Based on my knowledge, the financial statements, and other financial information included in thisreport, fairly present in all material respects the financial condition, results of operations and cashflows of the registrant as of, and for, the periods presented in this report;
4. The registrant’s other certifying officer and I are responsible for establishing and maintainingdisclosure controls and procedures (as defined in Exchange Act Rules 13a-15(e) and 15d-15(e)) andinternal control over financial reporting (as defined in Exchange Act Rules 13a-15(f) and 15d-15(f)) forthe registrant and have:
(a) Designed such disclosure controls and procedures, or caused such disclosure controls andprocedures to be designed under our supervision, to ensure that material information relating tothe registrant, including its consolidated subsidiaries, is made known to us by others within thoseentities, particularly during the period in which this report is being prepared;
(b) Designed such internal control over financial reporting, or caused such internal control overfinancial reporting to be designed under our supervision, to provide reasonable assuranceregarding the reliability of financial reporting and the preparation of financial statements forexternal purposes in accordance with generally accepted accounting principles;
(c) Evaluated the effectiveness of the registrant’s disclosure controls and procedures and presented inthis report our conclusions about the effectiveness of the disclosure controls and procedures, as ofthe end of the period covered by this report based on such evaluation; and
(d) Disclosed in this report any change in the registrant’s internal control over financial reporting thatoccurred during the registrant’s most recent fiscal quarter (the registrant’s fourth fiscal quarter inthe case of an annual report) that has materially affected, or is reasonably likely to materiallyaffect, the registrant’s internal control over financial reporting; and
5. The registrant’s other certifying officer and I have disclosed, based on our most recent evaluation ofinternal control over financial reporting, to the registrant’s auditors and the audit committee of theregistrant’s board of directors (or persons performing the equivalent functions):
(a) All significant deficiencies and material weaknesses in the design or operation of internal controlover financial reporting which are reasonably likely to adversely affect the registrant’s ability torecord, process, summarize and report financial information; and
(b) Any fraud, whether or not material, that involves management or other employees who have asignificant role in the registrant’s internal control over financial reporting.
Date: February 25, 2016
/s/ MICHAEL F. BARRY
Michael F. BarryChief Executive Officer
EXHIBIT 31.2
CERTIFICATION OF CHIEF FINANCIAL OFFICER OF THE COMPANY PURSUANT TO RULE13a-14(a) OF THE SECURITIES EXCHANGE ACT OF 1934
I, Mary Dean Hall, certify that:
1. I have reviewed this Annual Report on Form 10-K of Quaker Chemical Corporation;
2. Based on my knowledge, this report does not contain any untrue statement of a material fact or omit tostate a material fact necessary to make the statements made, in light of the circumstances under whichsuch statements were made, not misleading with respect to the period covered by this report;
3. Based on my knowledge, the financial statements, and other financial information included in thisreport, fairly present in all material respects the financial condition, results of operations and cashflows of the registrant as of, and for, the periods presented in this report;
4. The registrant’s other certifying officer and I are responsible for establishing and maintainingdisclosure controls and procedures (as defined in Exchange Act Rules 13a-15(e) and 15d-15(e)) andinternal control over financial reporting (as defined in Exchange Act Rules 13a-15(f) and 15d-15(f)) forthe registrant and have:
(a) Designed such disclosure controls and procedures, or caused such disclosure controls andprocedures to be designed under our supervision, to ensure that material information relating tothe registrant, including its consolidated subsidiaries, is made known to us by others within thoseentities, particularly during the period in which this report is being prepared;
(b) Designed such internal control over financial reporting, or caused such internal control overfinancial reporting to be designed under our supervision, to provide reasonable assuranceregarding the reliability of financial reporting and the preparation of financial statements forexternal purposes in accordance with generally accepted accounting principles;
(c) Evaluated the effectiveness of the registrant’s disclosure controls and procedures and presented inthis report our conclusions about the effectiveness of the disclosure controls and procedures, as ofthe end of the period covered by this report based on such evaluation; and
(d) Disclosed in this report any change in the registrant’s internal control over financial reporting thatoccurred during the registrant’s most recent fiscal quarter (the registrant’s fourth fiscal quarter inthe case of an annual report) that has materially affected, or is reasonably likely to materiallyaffect, the registrant’s internal control over financial reporting; and
5. The registrant’s other certifying officer and I have disclosed, based on our most recent evaluation ofinternal control over financial reporting, to the registrant’s auditors and the audit committee of theregistrant’s board of directors (or persons performing the equivalent functions):
(a) All significant deficiencies and material weaknesses in the design or operation of internal controlover financial reporting which are reasonably likely to adversely affect the registrant’s ability torecord, process, summarize and report financial information; and
(b) Any fraud, whether or not material, that involves management or other employees who have asignificant role in the registrant’s internal control over financial reporting.
Date: February 25, 2016
/s/ MARY DEAN HALL
Mary Dean HallChief Financial Officer
EXHIBIT 32.1
CERTIFICATION PURSUANT TO 18 U.S.C. SECTION 1350
The undersigned hereby certifies that the Form 10-K Annual Report of Quaker Chemical Corporation (the“Company”) for the annual period ended December 31, 2015 filed with the Securities and Exchange Commission(the “Report”) fully complies with the requirements of Section 13(a) or 15(d) of the Securities Exchange Act of1934 and that the information contained in the Report fairly presents, in all material respects, the financialcondition and results of operations of the Company.
Dated: February 25, 2016
/s/ MICHAEL F. BARRY
Michael F. BarryChief Executive Officer of Quaker Chemical
Corporation
EXHIBIT 32.2
CERTIFICATION PURSUANT TO 18 U.S.C. SECTION 1350
The undersigned hereby certifies that the Form 10-K Annual Report of Quaker Chemical Corporation (the“Company”) for the annual period ended December 31, 2015 filed with the Securities and Exchange Commission(the “Report”) fully complies with the requirements of Section 13(a) or 15(d) of the Securities Exchange Act of1934 and that the information contained in the Report fairly presents, in all material respects, the financialcondition and results of operations of the Company.
Dated: February 25, 2016
/s/ MARY DEAN HALL
Mary Dean HallChief Financial Officer of Quaker Chemical