QUAKING ASPEN BARK CHLOROPHYLL GENETICS Group 4 (2013) Abstract Quaking aspen (Populus tremuloides) carries a unique adaptation—the ability to photosynthesize in winter due to chloroplasts and chlorophyll in their bark. Also, aspens reproduce asexually via an extensive root system capable of cloning itself by having multiple offshoots from the same root system. Here this study looks into whether the tree’s color caused by the chlorophyll occurs as a response to the tree’s external environment or by the tree regulating itself via genetic circadian rhythms. By looking for consistencies within the coloration of clones, a correlation may appear, suggesting genetic control, or a lack of it, suggesting trees within the clone react independently as a response to stresses in its environment. The DNA from many trees within an aspen grove was sequenced and analyzed to determine clones and digital photography was used to pull quantitative color values from the trees. The two variables were compared using an analysis of variance (ANOVA), yielding a lack of correlation between a particular clone and the color value associated with its trees. This suggests the trees’ bark chlorophyll concentrations vary independently of clones as a response to changing environmental stresses. This study was performed as a collaborative effort led by Dr. Jon Seger (University of Utah) in which several research groups conducted studies concerning Populus tremuloides variation. The groups performed several independent studies, each looking at a different aspect of aspen variation. All groups shared some data with the other groups, contributing to each other’s information.
Transcript
QUAKING ASPEN BARK CHLOROPHYLL GENETICS
Group 4 (2013) Abstract
Quaking aspen (Populus tremuloides) carries a unique adaptation—the ability to
photosynthesize in winter due to chloroplasts and chlorophyll in their bark. Also, aspens
reproduce asexually via an extensive root system capable of cloning itself by having multiple
offshoots from the same root system. Here this study looks into whether the tree’s color caused
by the chlorophyll occurs as a response to the tree’s external environment or by the tree
regulating itself via genetic circadian rhythms. By looking for consistencies within the
coloration of clones, a correlation may appear, suggesting genetic control, or a lack of it,
suggesting trees within the clone react independently as a response to stresses in its environment.
The DNA from many trees within an aspen grove was sequenced and analyzed to determine
clones and digital photography was used to pull quantitative color values from the trees. The
two variables were compared using an analysis of variance (ANOVA), yielding a lack of
correlation between a particular clone and the color value associated with its trees. This suggests
the trees’ bark chlorophyll concentrations vary independently of clones as a response to changing
environmental stresses.
This study was performed as a collaborative effort led by Dr. Jon Seger (University of
Utah) in which several research groups conducted studies concerning Populus tremuloides
variation. The groups performed several independent studies, each looking at a different aspect
of aspen variation. All groups shared some data with the other groups, contributing to each
other’s information.
QUAKING ASPEN BARK CHLOROPHYLL GENETICS 2
Introduction:
Owing to an extensive range across the often extreme environments of northern North
America (Mock, 2013), quaking aspens (Populus tremuloides) carry an array of adaptations to
facilitate survival. Among them include mass cloning, causing many offshoots from the same
root system (Mock, 2013). As a result of this, aspens make almost ideal organisms to study
genetic variation because large variation can occur within a clone, allowing easy analysis of
heritable variance compared to acquired variance (Seger, 2013). Another unique adaptation in
aspens involves an ability to photosynthesize in their bark as a result of chlorophyll in the
outermost layers of their bark. Unusually, aspen bark chlorophyll concentrations vary depending
on the time of year. In summer, when leaves perform most of the photosynthesis, the bark
chlorophyll’s concentration decreases. The inverse phenomenon occurs in winter. In the
absence of leaves, the bark chlorophyll’s concentration increases (Pearson and Lawrence, 1958).
The seasonal fluctuations could result from either changing seasons causing environmental
stresses or the trees’ genes controlling them through circadian rhythms (Ibáñez et al, 2010). By
analyzing color discrepancies within clones, one could expect a correlation within colors within
all trees in a clone cluster should the trees’ genes cause the variation, while on the contrary, a
lack of correlation would suggest color and chlorophyll change as a result of seasons and other
environmental stresses.
Methods:
We performed our experiment in two main phases: a field phase followed by a lab phase.
The field phase involved traveling to a study area and collecting physical specimens, while the
lab phase involved both further qualitative and quantitative analysis using some high-tech
methods in comparing quantitative color values to the clone to which the tree belonged to.
QUAKING ASPEN BARK CHLOROPHYLL GENETICS 3
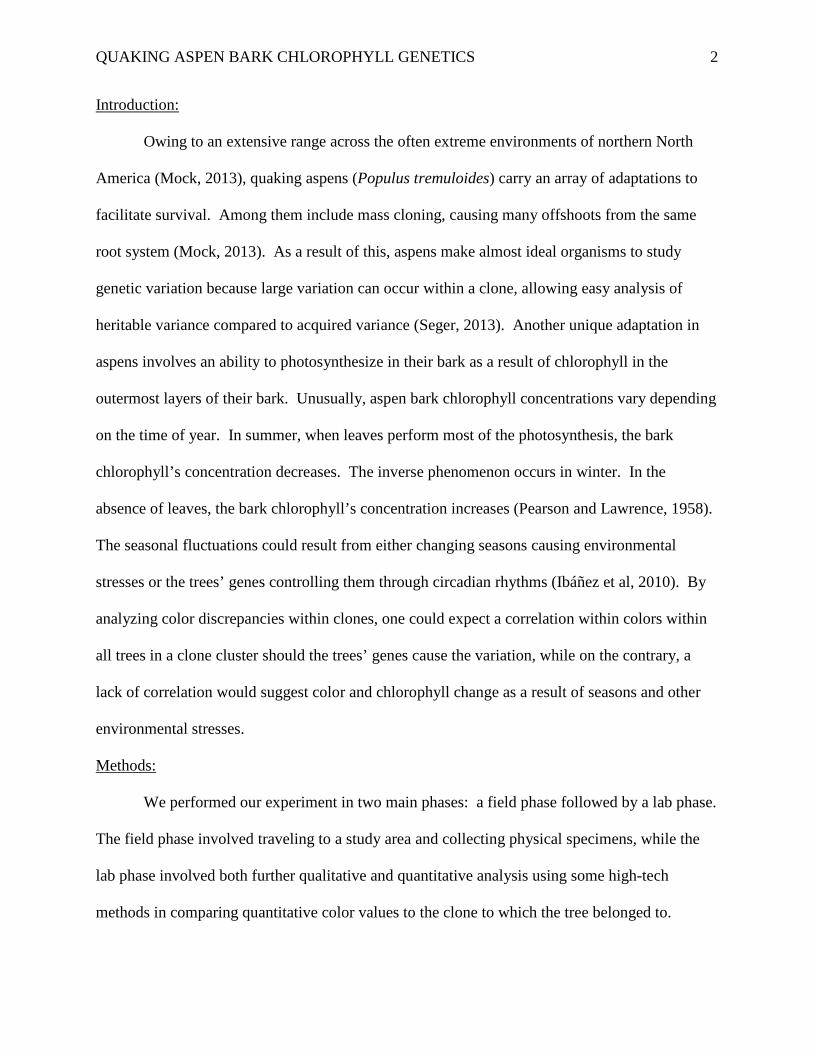
This study’s specimens came from a grove of Populus tremuloides (quaking aspen) on
the west slope overlooking Silver Lake in Big Cottonwood Canyon, Utah. Before collecting
specimens, we looked at photographs of the study area from amateur photographers and Google
Earth to predict clones within the grove. Looking in the pictures for consistencies in the picture
such as canopy “texture” and color patterns in autumn (i.e. Different clones change colors at
different times, resulting in uneven leaf coloration across the grove in autumn.), we chose a area
on the south side of the grove above the Sol-Bright ski trail that bisects the grove.
Within the study area, we selected nine random trees in the grove as our test subjects.
Over a course of three visits, usually one visit occurring every 1-2 weeks, leaf samples were
collected from each tree, dislodged by either throwing rocks or fallen branches at the trees, firing
a giant slingshot, or using pruning shears mounted on a long pole. We stored the samples in
Ziploc® bags, pressed the leaves under a stack of several heavy books, and refrigerated them.
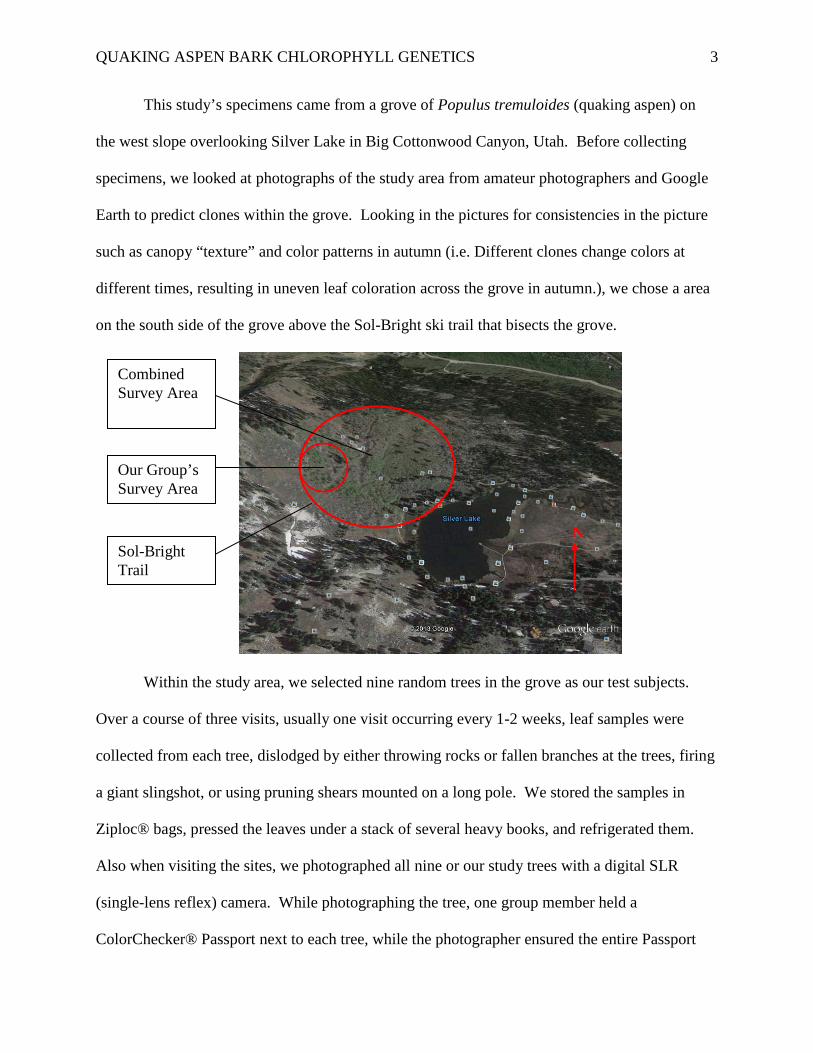
Also when visiting the sites, we photographed all nine or our study trees with a digital SLR
(single-lens reflex) camera. While photographing the tree, one group member held a
ColorChecker® Passport next to each tree, while the photographer ensured the entire Passport
N
Combined Survey Area
Sol-Bright Trail
Our Group’s Survey Area
QUAKING ASPEN BARK CHLOROPHYLL GENETICS 4
appeared in the frame unobstructed by uneven light across its surface. An actual photograph
from this study demonstrating this technique is shown below. In addition to our own trees, we
also photographed several trees outside our study area to expand our survey into trees unlikely to
be clones to our own. As previously mentioned in the abstract, this study formed a part of a
much larger group effort, so each group in its own respective area collected the leaf samples
from their trees for the genotyping of the whole study area.
The photography ended the field phase of the procedure. The lab phase immediately
followed. It began with extracting DNA from the collected leaves and running a polymerase
chain reaction (PCR) on the extracted DNA. After the PCR, the DNA was sequenced on a
computer, using PeakScanner® software, which read the DNA and used it to organize trees into
clones based on eight microsatellite loci. For a more detailed protocol for this genotyping
(reagents, DNA loci, etc.), see Callahan et al. (2013).
The second part of the lab phase involved editing the photographs to compensate and
neutralize the pictures, filtering out lighting abnormalities by using the ColorChecker® Passport
as the color standard. The passport’s corresponding software read the passport and adjusted the
pictures’ color using the passport as the standard. Doing so created a legible template, which
QUAKING ASPEN BARK CHLOROPHYLL GENETICS 5
enabled Adobe Photoshop® to pull quantitative color values on the image. We assumed varying
chlorophyll concentrations contributed to the color variety (Pearson and Lawrence, 1958). On
Photoshop, we analyzed the picture we perceived as the best based on ColorChecker Passport
software editing, overall image quality, and absence of factors such as extreme lighting (both
bright and dark), shadows, foreign objects blocking the passport, etc.
On Photoshop, we opened our chosen pictures and extracted color values for the aspen
bark. To compensate for shadows creating uneven lighting conditions on the bark in the
pictures, we cropped the largest maximum area bark in the same lighting conditions of the
ColorChecker Passport. Before determining the average color value of the whole crop, we
analyzed ten random loci (individual pixels) for their RGB (red, green, and blue intensity)
values. Photoshop reveals the RGB values of a particular pixel by simply clicking on a location
within the image. This step was done to display the color variation within one tree. After
analyzing the ten pixels, we pulled the average RGB values for the entire cropping. We
performed the same procedure photo editing procedure for all trees.
Although Photoshop accurately pulled RGB values for all trees, the RGB values varied
considerably owing to diverse lighting conditions when we snapped the pictures. Some trees
yielded abnormally high RGB values because of direct sunlight, but others produced much lower
values due to complete shadow. To compensate and obtain a more average color spread for all
the trees, we added an extra step to the procedure here. Here, we reasoned if colors were
identical across trees due to the trees’ genetically-controlled circadian rhythms, the ratio of the R
to G to B values would be entirely consistent across clones. To test this assumption, we obtained
the clone data and ran an analysis of variance (ANOVA) using the statistical computer program
R to relate the individual RGB values to the clones determined by eight microsatellite loci to
QUAKING ASPEN BARK CHLOROPHYLL GENETICS 6
determine the probability of those RGB values being connected to a particular aspen clone.
Also, we ran an ANOVA on the R: G, G: B, and R: B ratios also correlating them with the genes.
The ANOVAs were done on both the ten average pixels and the overall average RGB values.
The variances and associated values revealed the plausibility of color’s connection to the trees’
clone. These values are discussed in further detail in the results section of this report.
Results:
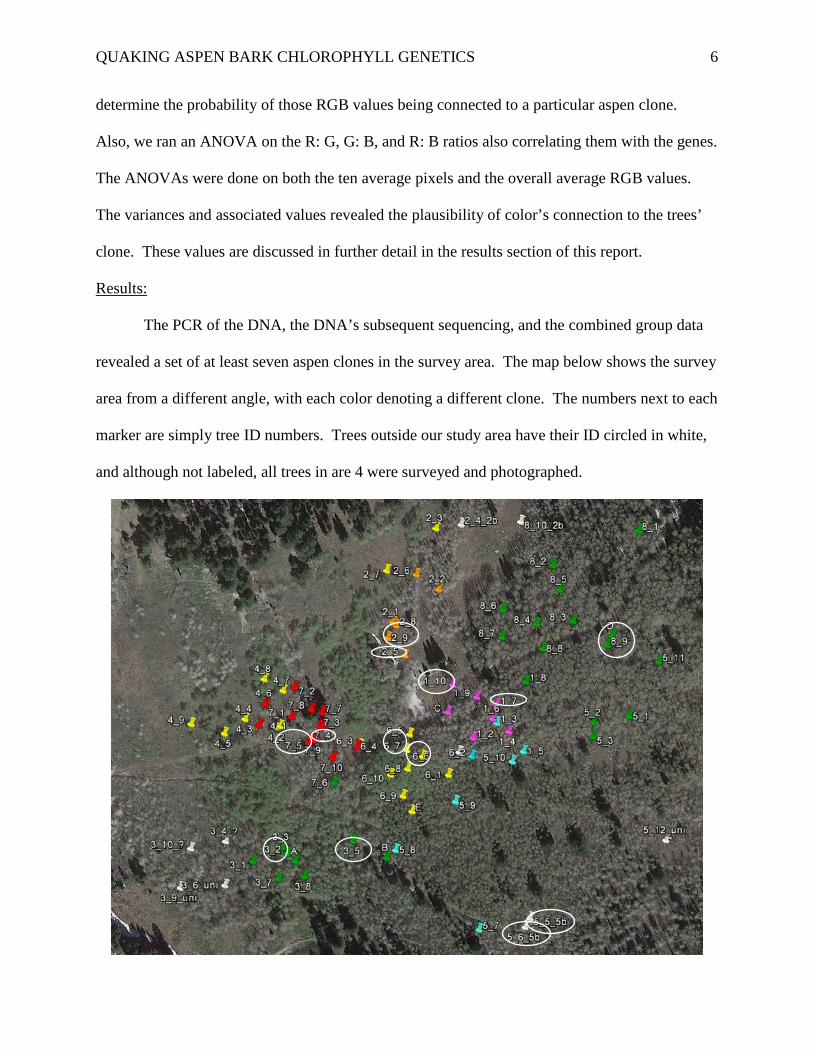
The PCR of the DNA, the DNA’s subsequent sequencing, and the combined group data
revealed a set of at least seven aspen clones in the survey area. The map below shows the survey
area from a different angle, with each color denoting a different clone. The numbers next to each
marker are simply tree ID numbers. Trees outside our study area have their ID circled in white,
and although not labeled, all trees in are 4 were surveyed and photographed.
QUAKING ASPEN BARK CHLOROPHYLL GENETICS 7
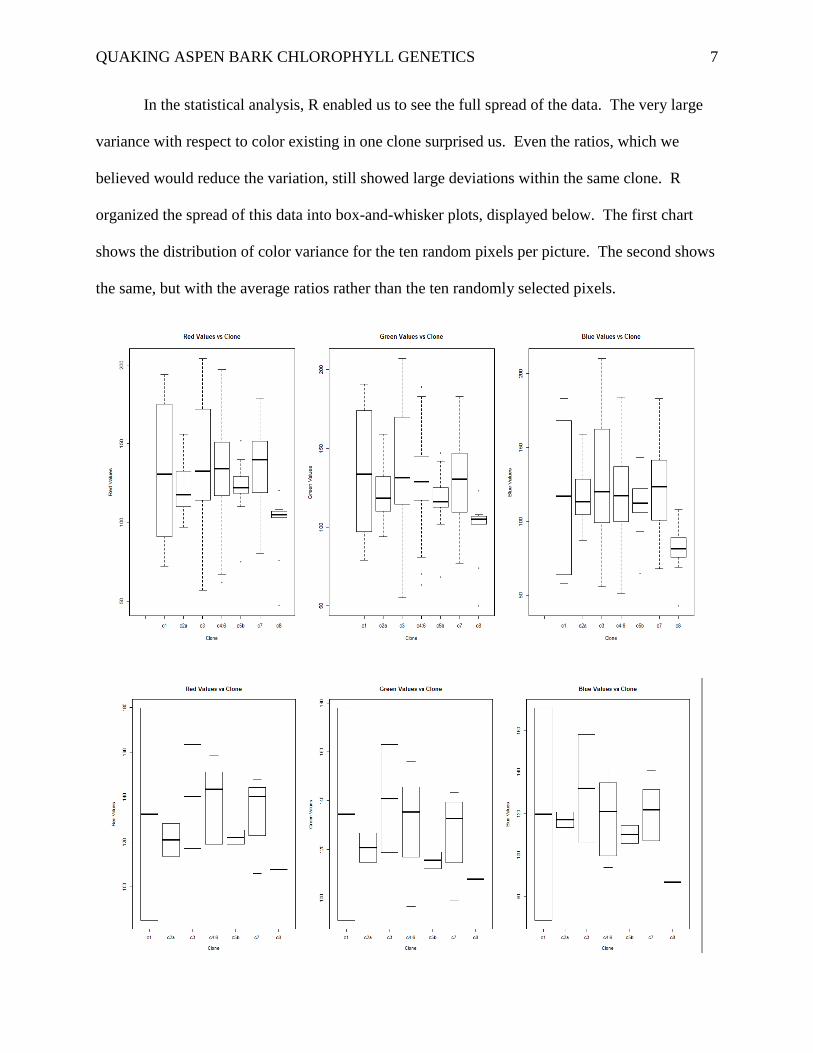
In the statistical analysis, R enabled us to see the full spread of the data. The very large
variance with respect to color existing in one clone surprised us. Even the ratios, which we
believed would reduce the variation, still showed large deviations within the same clone. R
organized the spread of this data into box-and-whisker plots, displayed below. The first chart
shows the distribution of color variance for the ten random pixels per picture. The second shows
the same, but with the average ratios rather than the ten randomly selected pixels.
QUAKING ASPEN BARK CHLOROPHYLL GENETICS 8
As we initially expected, some ratio box-and-whisker plots show much less variance than
the ratios simply because of less data to work with, but some actually expand the inner-quartile
range effectively increasing the variance. Since we photographed all the trees in our area and
only two trees each form all the other groups’ research sites, the genotyping revealed a huge
underrepresentation of some clones, evidenced by some plots only showing a mean or the inner-
quartile range.
When we had R perform ANOVAs on the random RGB values and the RGB ratios
compared to clone identity for both the random pixels’ RGB values and the average image’s
RGB values, two very contrasting data sets emerged. The ANOVAs for both the random ratios
and the random values compared to the clone gave a miniscule P-Value (shown on the charts as
Pr (>F)), inferring a high probability of connection the trees’ genes. However, the same
ANOVA test on the trees’ average RGB values showed the opposite effect. A much higher P-
value appeared, indicating any correlation as random and occurring independently. The various
sets told us the color discrepancies occur as either a result of random deviations as a response to
environmental factors or controlled genetically.
The chart to the right displays the
ANOVA results for the random
values compared to clones. The
asterisks next to the P-values
serve as a marker telling the high
likelihood of the observed trait
being connected to the clone the
tree grew in.
QUAKING ASPEN BARK CHLOROPHYLL GENETICS 9
The schism over whether the tree’s genetics correlate with the observed color variations
astounded us at first. According to Seger (the research leader), the schisms occur as a result of
differences in degrees of freedom (abbreviated Df in the ANOVA charts). Because a vastly
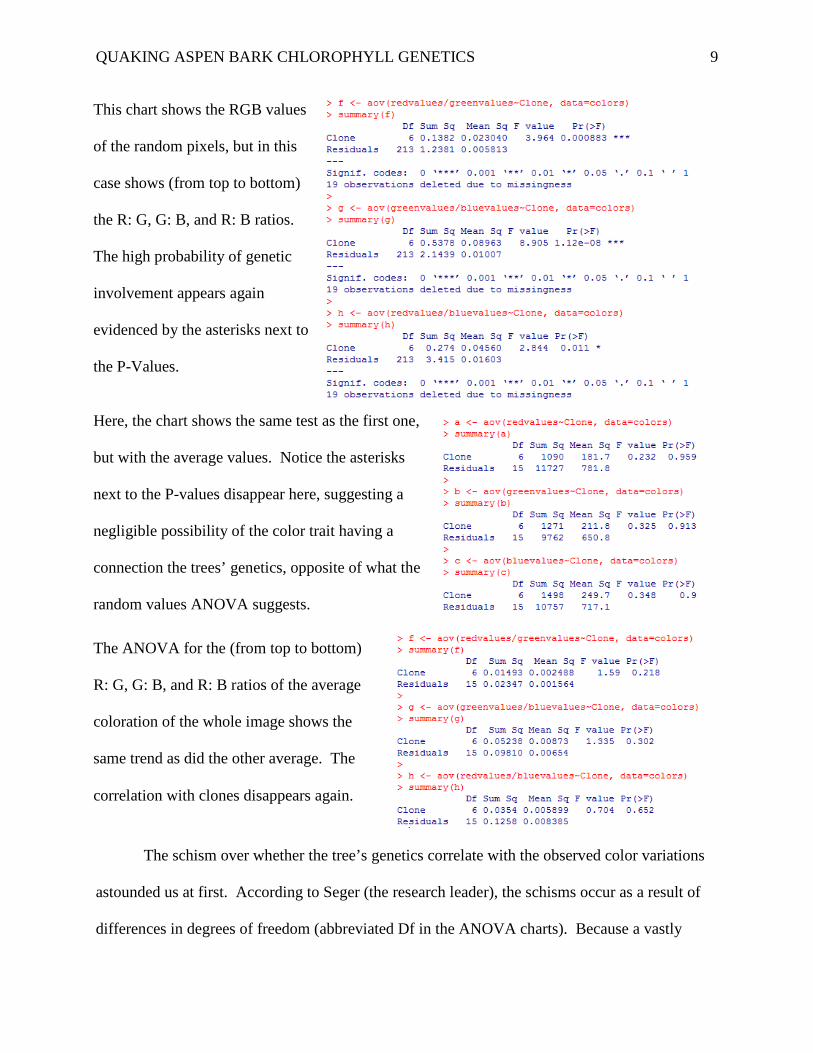
This chart shows the RGB values
of the random pixels, but in this
case shows (from top to bottom)
the R: G, G: B, and R: B ratios.
The high probability of genetic
involvement appears again
evidenced by the asterisks next to
the P-Values.
Here, the chart shows the same test as the first one,
but with the average values. Notice the asterisks
next to the P-values disappear here, suggesting a
negligible possibility of the color trait having a
connection the trees’ genetics, opposite of what the
random values ANOVA suggests.
The ANOVA for the (from top to bottom)
R: G, G: B, and R: B ratios of the average
coloration of the whole image shows the
same trend as did the other average. The
correlation with clones disappears again.
QUAKING ASPEN BARK CHLOROPHYLL GENETICS 10
larger set of data constituted the random pixel colors, the number set had greatly larger degrees
of freedom, facilitating the ability to draw a correlation between the clones and the colors. The
average values, therefore, lacked this large data set and resulted in much fewer degrees of
freedom, hindering the ability to draw a reasonable correlation between clones and bark color
intensity. Because we perceived the ten random pixels as inadequate in describing the overall
color in the bark, we decided to eliminate them in drawing a conclusion. Although the ten
random pixels did show significant color variation within a tree, we decided to analyze the over
picture average in drawing a conclusion. Therefore, using the relatively large P-values obtained
from the ANOVAs, color variations in aspens appear the result of a response to the trees’
external environment rather than regulated by genetically-controlled circadian rhythms. If genes
do have any effect, their influence seems almost entirely negligible.
Discussion:
From analyzing the average color intensity on an area of aspen bark and comparing those
values within clones, this study suggests color variation, as a result of varying chlorophyll
concentration, occurs as a tree within a clone’s response to its changing environment rather than
occurring as a result of genetically induced circadian rhythms. These results support and give
insights to past studies on the topic of bark chlorophyll. Pearson and Lawrence (1958) first
demonstrated the bark chlorophyll concentrations fluctuating as the seasons changed, with the
peaks occurring in winter with the absence of leaves and the troughs occurring in summer with
the presence of leaves. Here, our study adds to their findings by suggesting how the fluctuation
varies by arguing some change occurring with the seasons contributes to increasing quantities of
chlorophyll in aspen bark. Possibly, the absence of leaves allows more sunlight to reach the
QUAKING ASPEN BARK CHLOROPHYLL GENETICS 11
aspen bark, so the tree may respond by increasing bark chlorophyll quantities. However,
validating or disproving that hypothesis requires a further investigation.
The greatest margin for error in this study comes from not having standards when taking
the pictures. We simply took the pictures in broad sunlight as much as possible, ignoring factors
such as the specific side of the tree (angle of sunlight could result in uneven RGB values around
the tree, assuming sunlight intensity affects chlorophyll production), the camera’s distance from
the tree, and camera height. A method of correcting this factor could involve taking the pictures
at night, free of risk of sunlight interference, and using the camera flash to create a constant
lighting across the whole shot. Also potentially causing error, we analyzed nine trees from our
study area, but only two trees from all the other study areas, possibly creating
underrepresentation of some clones, reducing the certainty of our results for those trees. Smaller
contributing factors to error include the uneven color scheme on aspen bark caused by dark
gashes accenting the white and some bumps in otherwise smooth bark. Certain camera settings
(f-stop, shutter speed, ISO, etc.) likely do not affect the RGB values because the ColorChecker
software uses the Passport to correct for lighting conditions, allowing for accurate RGB value
extraction. Machines performed almost the genetic and statistical analysis, greatly reducing the
risk of human error. But regardless of any design flaw or human/technical error, this data seems
very valid. Workable, data did come out of the RGV values evidenced by how R pulled a strong
correlation between clones and the random values. Therefore, we see this as viable data.
However if one desires to replicate this experiment, we recommend taking the listed measures to
achieve maximum accuracy and precision in the numerical data.
As one study often yields several others, this project raises several other questions. On a
small, more molecular scale, determining the seasonal factor(s) resulting in fluctuating
QUAKING ASPEN BARK CHLOROPHYLL GENETICS 12
chlorophyll concentrations could lead to discovering how chemical processes alter to both
produce and reduce bark chlorophyll. Also, this study showed a large variance within clones,
small scale geographical analysis using similar methods to what Pearson and Lawrence (1958)
did could show patterns in bark chlorophyll concentrations. For example, if light stimulates
chlorophyll production, a dense grove would show more bark chlorophyll in peripheral trees and
less in central trees. Because aspens have such an extensive range through a variety of
environments, bark chlorophyll could vary not only on a small scale within clones, but also on
large scale owing to the type of ecosystem the aspen grows in, whether in temperate mountains
or subarctic. Extreme northern latitudes experience sunless winter days, while more southern
latitudes experience sunny winter days, which could affect bark chlorophyll, production cause
pending. The biogeography of aspens could greatly affect the variation within bark chlorophyll
and other quaking aspen adaptations, so a potentially diverse genome and a variety of
environments (Mock, 2013) could contribute to a remarkable variance all in the same species.
Acknowledgements:
Many thanks to Dr. Jon Seger, Patrice Kurnath, Meggan Alston, and Sarah Bradburn for
performing many technical aspects in this experiment such as DNA extraction, PCR, and
teaching computer programs as well as providing transportation to the research site. Also, thanks
to Summer Willis, Hannah Choi, Andrew Michelson, Guy Watson, Jake Decker, Jane Duncan,
Deanne Yugwa, Ryan Short, Madeline Berger, Dietrich Geisler, Elliot Lee, Michela Jennings,
Shalauna Johnson, Rachel Hyunh, Maya Mukai, Jacob Knight, Marco Testa, Emily Dennis, and
Jeppeson Feliciano for sharing your tree genotypes and guiding us in photographing your trees.
QUAKING ASPEN BARK CHLOROPHYLL GENETICS 13
Literature Cited:
Callahan, C. M., Rowe, C. A., Ryel, R. J., Shaw, J. D., Madritch, M. D., & Mock, K. E. (2013).
Continental-scale assessment of genetic diversity and population structure in quaking
aspen (Populus tremuloides) [Electronic version]. Journal of Biogeography, 40, 1780-
1791.
Ibáñez, C., Kozarewa, I., Johansson, M., Ögren, E., Rohde, A., & Eriksson, M. (2010, August 4).
Circadian clock components regulate entry and affect exit of seasonal dormancy as well
as winter hardiness in Populus trees [Electronic version]. Plant Physiology, 153(4), 1823-
1833.
Mock, K. (2013, September). “New perspective on aspens in the western US: phylogeography,
regeneration ecology, and triploidy.” The Biology of Variation. Lecture conducted from
the University of Utah , Salt Lake City, UT.
Pearson, L. C., & Lawrence, D. B. (1958, May). Photosynthesis in Aspen Bark [Electronic
version]. American Journal of Botany, 45(5), 383-387.
Seger, J. (2013, August). “Biology 2005, ‘Doing science: the biology of variation’.” The
Biology of Variation. Lecture conducted from the University of Utah, Salt Lake City,
UT.
Seger, J. (2013, August). “Quantitative characters: polygenes and environment.” The Biology
of Variation. Lecture conducted from the University of Utah, Salt Lake City, UT.