31
SEER 2017 SURVEYS: QUANTITATIVE & QUALITATIVE RESEARCH

SEER 2017
SURVEYS:
QUANTITATIVE &
QUALITATIVE RESEARCH

Characterize the purpose of survey research and provide examples of the types of research questions that call for survey research.
Name several different types of surveys and recognize important factors to consider when planning survey research.
Be able to compose and evaluate potential survey question items.
Evaluate survey research design & implementation plans using best practices.
Create simple survey items with Google forms and some more complicated options with Qualtrics
LEARNING OBJECTIVES

Paula Lemons
Jenn Thompson
Evan Conaway, Qualtrics Jedi Master
THANK YOU

Share:
What is the most recent survey that you have taken
and what was its purpose?
With a partner, consider this question:
Why would you choose to give a survey rather than
another research method like qualitative interviews
or observations?
RATIONALE OF SURVEYS

SURVEYS
“A survey is a type of quantitative research methods
that uses questionnaires or interviews to collect data
from a sample usually selected to represent a
population.” ( G a l l e t a l , 2 0 07)
“The use of questions to measure the phenomenon of
interest is another essential part of survey research.
Especially important when trying to measure
phenomena that cannot be directly observed, such as
attitudes, feelings, and cognitions.”(Martella et al., 2013)
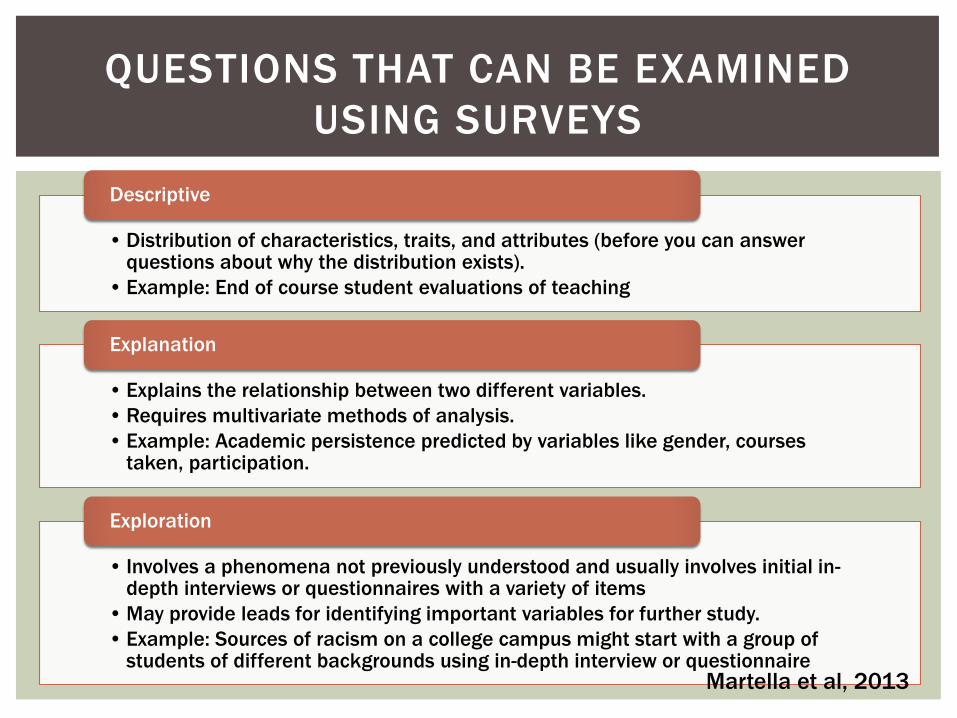
• Distribution of characteristics, traits, and attributes (before you can answer questions about why the distribution exists).
• Example: End of course student evaluations of teaching
Descriptive
• Explains the relationship between two different variables.
• Requires multivariate methods of analysis.
• Example: Academic persistence predicted by variables like gender, courses taken, participation.
Explanation
• Involves a phenomena not previously understood and usually involves initial in-depth interviews or questionnaires with a variety of items
• May provide leads for identifying important variables for further study.
• Example: Sources of racism on a college campus might start with a group of students of different backgrounds using in-depth interview or questionnaire
Exploration
QUESTIONS THAT CAN BE EXAMINED
USING SURVEYS
Martella et al, 2013
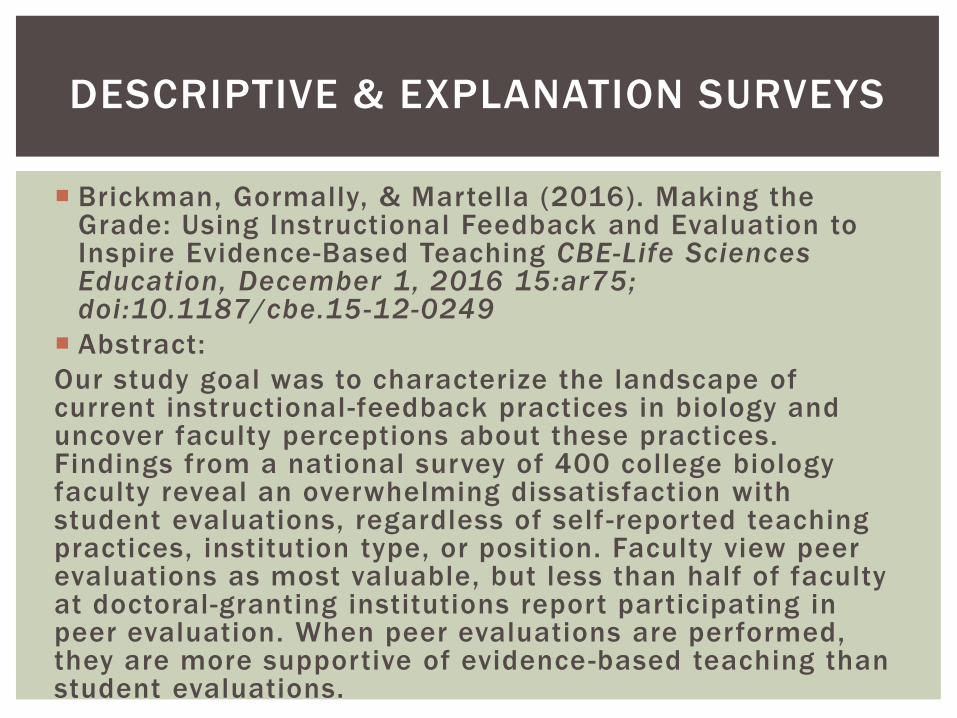
Brickman, Gormally, & Martella (2016). Making the Grade: Using Instructional Feedback and Evaluation to Inspire Evidence-Based Teaching CBE-Life Sciences Education, December 1, 2016 15:ar75; doi:10.1187/cbe.15-12-0249
Abstract:
Our study goal was to characterize the landscape of current instructional-feedback practices in biology and uncover faculty perceptions about these practices. Findings from a national survey of 400 college biology faculty reveal an overwhelming dissatisfaction with student evaluations, regardless of self -reported teaching practices, institution type, or position. Faculty view peer evaluations as most valuable, but less than half of faculty at doctoral-granting institutions report participating in peer evaluation. When peer evaluations are performed, they are more supportive of evidence-based teaching than student evaluations.
DESCRIPTIVE & EXPLANATION SURVEYS

Hartwig, M. K., & Dunlosky, J. (2012). Study strategies of college students: Are self -testing and scheduling related to achievement? Psychonomic Bulletin & Review, 19(1), 126-134.
Abstract:
Previous studies, such as those by Kornell and Bjork (Psychonomic Bulletin & Review, 14:219-224, 2007) and Karpicke, Butler, and Roediger (Memory, 17:471-479, 2009), have surveyed college students' use of various study strategies, including self -testing and rereading. These studies have documented that some students do use self-testing (but largely for monitoring memory) and rereading, but the researchers did not assess whether individual differences in strategy use were related to student achievement. Thus, we surveyed 324 undergraduates about their study habits as well as their college grade point average (GPA).
DESCRIPTIVE & EXPLANATION SURVEYS

Step 1: Developing the survey – identifying
key factors, writing items, testing and
revising.
Step 2: Administering survey
Step 3: Analyzing the results
STEPS IN SURVEY RESEARCH

PLANNING SURVEY RESEARCH –
STEP 1 DEVELOPING A SURVEY
Survey
What is my question format?
What is the content of my questionnaire?
• Close-ended
(select an
option)
• Open-ended
• Question
wording
• Order
• Sensitive
issues

STEP 1: DEVELOPING A SURVEY
Identifying Key Factors
Develop Questions or Statements
Format and Sequence of
QuestionsPilot-test
What are the
attributes,
characteristics,
or behaviors
associated with
the phenomena
under study?
Reliable – if given multiple times,
respondents would answer the same
question in the same way.
Valid – the answers that respondents
are an accurate representation of
the underlying characteristic you are
hoping to study

Today, you are going to start developing a
survey that relates to a research question that
interests you.
We will use the last 30 minutes to play with
the powerful survey program (Qualtrics) that is
available to UGA students, faculty and staff.
DEVELOPING YOUR OWN SURVEY

POSSIBLE RESEARCH TOPICS
1. What topic are you interested in surveying
people about?
Share your name and a brief description of your
topic
2. In the next 10 minutes, for the question you are
interested in, start to identify key factors (really
you would do a literature review for prior research)
that can help you decide what types of questions
you need to ask.
3. Once you have your factors, begin to write a few
questions would help you find out more about your
participants attributes, attitudes, characteristics, or
behaviors that you want to find out more about
from the survey.
DEVELOPING YOUR OWN SURVEY

THE DON’TS OF SURVEY QUESTION WRITING
Swap your questions with another pair and evaluate using
the following things to avoid in question writing:
Question wording
Lengthy words
Questions too long
Questions not specific
Lack of frame of reference
Vague language
Double negatives
Asking two questions in one
Using jargon or acronyms
Leading questions
Cultural differences in meaning
Irrelevant items
Respondent Characteristics
Memory-recall of events
Agreement or acquiescence bias
(tendency to agree)
Social Desirability (need to appear in a
positive light)
Floaters (forcing response for
respondents who don’t know)
Sensitive questions
Presentation of Questions
Enough response categories
Question order
Filter questions: to determine if next
set is relevant

STEP 1: PILOTING THE SURVEY
Identifying Key Factors
Develop Questions or Statements
Format and Sequence of
QuestionsPilot-test
Indicate
modifications
made as a
result of pilot
as well as
who
participated
as pilot
testers
“The only good question is a pre-tested question.”
This can include:
• Discussing with colleagues, methodologists, &
practitioners from the same settings that you will be
surveying.
• Cognitive interviews with people who reflect the
respondents. Asked to “think aloud” as they answer
the items.
• Basically, give the survey, revise the survey, repeat…
4. What is your plan to pilot test your survey?

We developed survey questions designed to collect faculty perceptions about current instructional -feedback practices and elicit faculty wishes for ideal feedback practices. We also collected faculty demographic data so we could compare responses to these items between faculty at different institutions, of different ranks, and with different experiences.
We then conducted individual cognitive interviews using a think -aloud protocol (Ericsonn and Simon, 1980; Coll ins, 2003) with initial survey questions. Twelve faculty members were asked to respond to each survey question and, as they answered the question, to describe why they responded in particular ways, to explain whether item responses were missing or irrelevant, and to comment on question and item-response clarity. We selected a range of faculty to represent different tenure status and institution type. After each interview, two coauthors (P.B. and A.M.M.) discussed and revised relevant survey items to address ambiguous wording and add or revise items.
FEEDBACK SURVEY

Step 1: Developing the survey
Step 2: Administering survey – sampling and
collecting data
Step 3: Analyzing the results
STEPS IN SURVEY RESEARCH

Survey
What is my question format?
What is the content of my questionnaire
?
What is my sampling
population?
What sampling
procedure will I use?
•Sampling frame:
population sample
will be drawn from
(comprehensive?)
• Generalizable to
this population?
• How to motivate
responses?
PLANNING SURVEY RESEARCH – STEP 2

Exhaustive sampling frames: taken from a more or less complete list of individuals in the population to be studied (usually when population is small or clearly defined (e.g. all members of the graduating class.)
Convenience sampling frames: set of individuals who do something or go somewhere that enables researchers to administer the survey. Create list and sample simultaneously, for example, surveying the 10 th person to enter stadium on a football game day.
Cluster sampling frames: completed in two or more stages: First randomly select houses in a neighborhood that have school-aged children, then survey a random sample of adults l iving in these houses about the perception of the quality of education.
SAMPLING FRAMES

A mixture of faculty within Biology departments were identified for this study
(convenience sampling):
1) Randomly selecting a subset of institutions from each category in the
Carnegie Classification of Institutions of Higher Education Examining
2) Using website research, we obtained email addresses from up to six
faculty from the biology departments of these institutions, attempting to
get an even distribution of faculty from dif ferent ranks (two ful l
professors, two associate professors, and two assistant professors or
lecturers)
SAMPLING & DATA COLLECTION –
FEEDBACK SURVEY
Methods: We obtained email addresses for faculty at 70 doctoral institutions (24% of
all 297 doctoral institutions), 175 master’s institutions (24% of 724 master’s
institutions), 161 baccalaureate institutions (24% of 663 appropriate baccalaureate
institutions), and 344 associate’s institutions (33% of 1042 associate’s institutions). We
sent the URL for our Web-based survey of feedback practices to more than 4000
faculty in October 2014 (Qualtrics, 2016). We received a total of 399 individual
responses, of which 343 were complete for all questions. The respondent pool
represents at least 185 different institutions (102 of the respondents did not include
the names of their institutions).

5. Decide on what your target population is for your survey
and describe which sampling frame you would use and
why.
Exhaustive sampling frames: taken from a more or less complete
list of individuals in the population to be studied (usually when
population is small or clearly defined.(all members of the
graduating class.)
Convenience sampling frames: set of individuals who do something
or go somewhere that enables researchers to administer the survey.
Create list and sample simultaneously, for example, surveying the
10th person to enter stadium on a football game day.
Cluster sampling frames: completed in two or more stages: First
randomly select houses in a neighborhood that have school -aged
children, then survey a random sample of adults living in these
houses about the perception of the quality of education
DEVELOPING YOUR OWN SURVEY

Threats to Survey Validity YES NO
Were the survey questions adequate in obtaining the information
needed by the researchers?
Was the survey pilot tested?
Did the authors indicate that modifications were made based on
the pilot results?
Did the pilot participants represent the respondents?
Were their alternative explanations for the results?
CHECKLIST FOR SURVEY STEPS 1 & 2
External Validity YES NO
Was the probability of being selected included in the description of
the sampling procedure?
Were the respondents and response rate described?
Was the sample representative of the target population?
What sampling frame was used? Exhaustive Convenience Cluster

Step 1: Developing the survey
Step 2: Administering survey
Step 3: Analyzing the results – presenting the
data
STEPS IN SURVEY RESEARCH

SurveyWhat is my
question format?
What is the content of my
questionnaire?
What is my sampling
population?
What sampling procedure will I
use?
What is the response rate I
am shooting for?
How much time and
money do I have?
Response rate:
number
surveyed/total
sampled (>50%,
unbiased?)
PLANNING SURVEY RESEARCH – STEP 3

PRESENTING CATEGORICAL DATA
Har twig , M. K . , & Dunlosky, J . (2012) . Study st rategies of co l lege students: Are se l f -
test ing and schedul ing re lated to achievement? Psychonomic Bul let in & Review,
19 (1 ) , 126 -134.

PRESENTING CATEGORICAL DATA
Har twig , M. K . , & Dunlosky, J . (2012) . Study st rategies of co l lege students: Are se l f -
test ing and schedul ing re lated to achievement? Psychonomic Bul let in & Review,
19 (1 ) , 126 -134.

Step 1: Developing the survey
Step 2: Administering survey
Step 3: Analyzing the results – statistical analysis
(survey was designed to measure a representative
sample of the total population so that conclusions
can be drawn about that population as a whole from
the sample.)
STEPS IN SURVEY RESEARCH
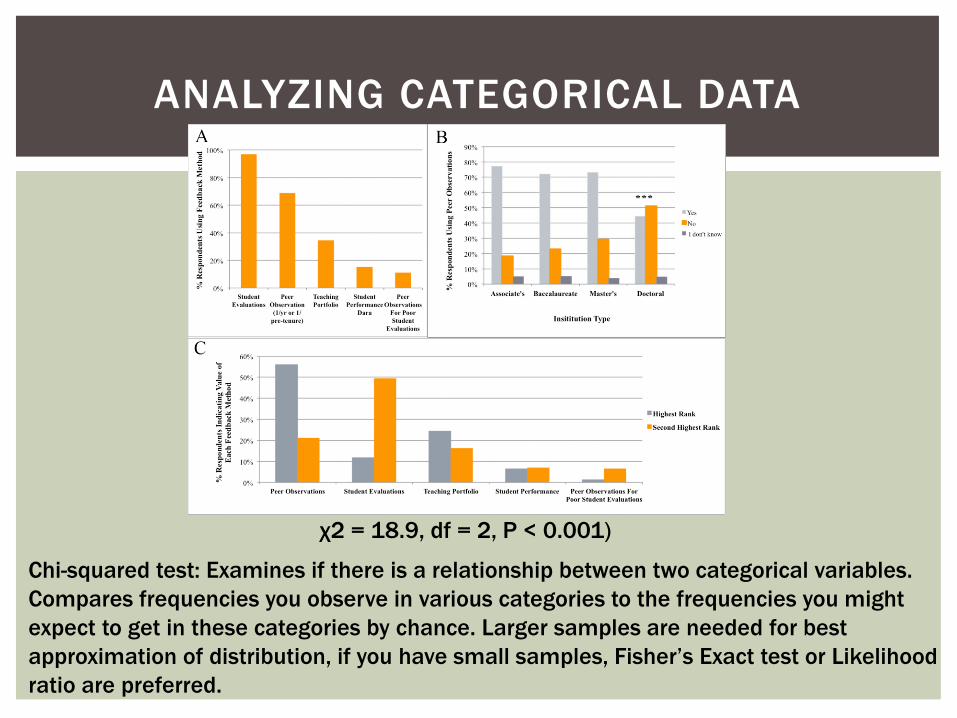
ANALYZING CATEGORICAL DATA
χ2 = 18.9, df = 2, P < 0.001)
Chi-squared test: Examines if there is a relationship between two categorical variables.
Compares frequencies you observe in various categories to the frequencies you might
expect to get in these categories by chance. Larger samples are needed for best
approximation of distribution, if you have small samples, Fisher’s Exact test or Likelihood
ratio are preferred.
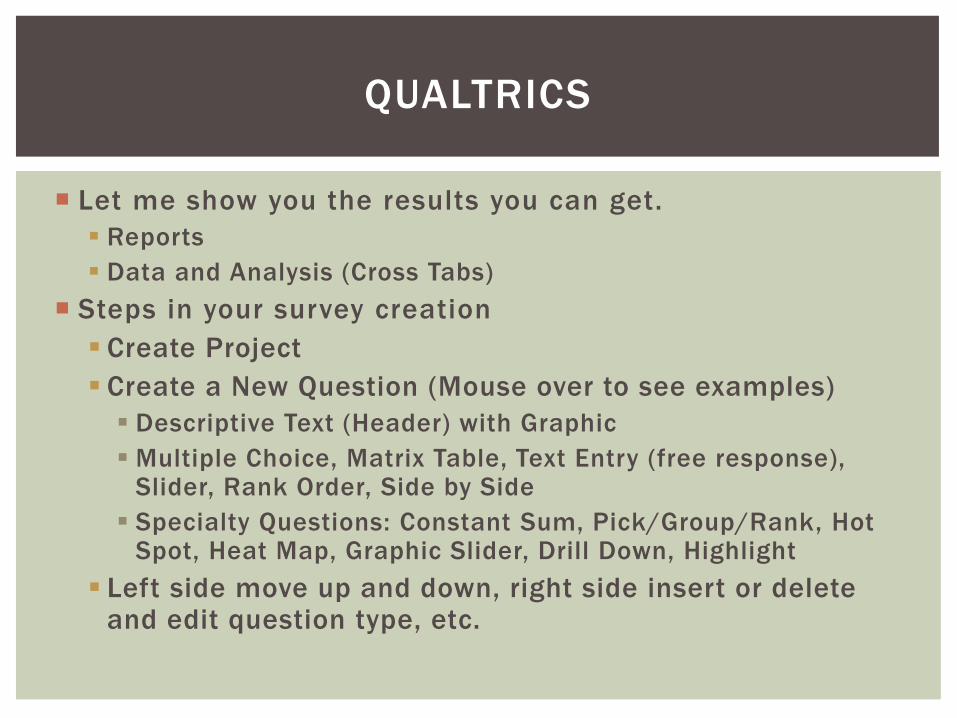
Let me show you the results you can get.
Reports
Data and Analysis (Cross Tabs)
Steps in your survey creation
Create Project
Create a New Question (Mouse over to see examples)
Descriptive Text (Header) with Graphic
Multiple Choice, Matrix Table, Text Entry (free response), Slider, Rank Order, Side by Side
Specialty Questions: Constant Sum, Pick/Group/Rank, Hot Spot, Heat Map, Graphic Slider, Drill Down, Highlight
Left side move up and down, right side insert or delete and edit question type, etc.
QUALTRICS

Joseph Check and Russell K Schutt , 2012. “Research Methods
in Education.”
M. D. Gall, Joyce P Gall, and Walter R. Borg, 2007
“Educational Research: An Introduction.”
Ronald C. Martella, J. Ronald Nelson, Robert L Morgan, and
Nancy E. Marchand-Martella (2013) Understanding and
Interpreting Educational Research. Guilford Press.
UGA Biology Education Research Group
REFERENCES FOR FURTHER STUDY


