41
2010 - 2011 Quality Account This report covers the period 1 April 2010 to 31 March 2011

2010 - 2011 Quality Account
This report covers the period 1 April 2010 to 31 March 2011

Quality Account 2010 – 2011 - 2 -
I am delighted to present the Trust’s second Quality Account, giving us the opportunity to give an update on the information in last year’s Quality Account and to continue to demonstrate our continued commitment to improving and maintaining the quality of care we provide. Our Trust objectives for the last year made our commitment to quality clear by including aims to continue to deliver reductions in hospital acquired infections and surgical site infections, ensure high ratings in the assessments of the hospital’s cleanliness, hygiene, privacy and dignity, and patient food. Following the Trust’s successful unconditional registration with the new Care Quality Commission (CQC), we made it a priority to ensure that we continued to achieve and maintain full compliance with the requirements of the CQC Essential Standards of Quality and Safety. It has always been important to us to ensure that we work in partnership with patients and their carers and promote an open and honest culture both between Trust staff and between the trust and patients and the wider public. By doing so we make undertake to provide an environment that helps to ensure good leadership and accountability and a willingness on our part to recognise where improvements can be made and lessons learned. This report provides an update on the areas included in last year’s Quality Account, a summary account of our performance against selected measures for this year and our priorities for improvement for the coming year. The first section contains nationally mandated measures, in order to allow some comparison between us and other organisations; the second part of the report follows on from last year and is thus based upon indicators that our patients, visitors and staff have indicated are particularly important to them. The main areas of achievement during 2010/11 include
- Minimal hospital acquired infections - The Trust had one case of a patient with Methicillin Resistant Staphylococcus Aureus bacteraemia (MRSA blood stream infection). Our target maximum was one case. There were seven cases of patients acquiring Clostridium difficile (C. difficile) infections whilst inpatients at the NOC (our target was a maximum of nine).
- Improved reporting and follow up of surgical site infections (SSIs) - Continued achievement against the targets for 18 week maximum wait for admitted and for
non-admitted patients.
- Continued compliance with the requirements of the Hygiene Code
- Full compliance with single sex accommodation and a focus on privacy & dignity for all patients.
- Full implementation of the national Patient Related Outcome Measures (PROMS) for
patients receiving hip and knee replacements
- Improvements to clinical administration processes and a customer care training programme.
- Overall wait for diagnostics has reduced down to 4 weeks or less
Chief Executive’s Statement

Quality Account 2010 – 2011 - 3 -
The content of this report has been reviewed by patient representatives, by our staff, through various clinical and managerial groups, and approved by the Trust Board. It includes not just areas where we feel we have made significant achievements, but also areas that we consider need some improvement. I would like to thank all the patients, visitors and staff who helped with the consultation and gave valuable feedback and ideas that have contributed to the content of this report. I confirm that the content of this report is, to the best of my knowledge, accurate and has been approved by the Board.
Signed …………………………………………………….
Chief Executive

Quality Account 2010 – 2011 - 4 -
Although we have made progress in improving quality during 2010/11, we recognise that there are some areas in which we could do even better. Our priorities for quality improvement for 2011/12 are as follows:
Patient Safety Deadline(s) How progress will be measured
How progress will be reported and
monitored
Ensure continued achievement of targets for Healthcare Acquired Infections (HCAIs):
Maintain full compliance with Hygiene Code
April 2012
Continue to aim at zero MRSA bacteraemia and zero C Difficile
April 2012
Implement systematic Root Cause Analysis (RCA)and case review process for all surgical site infections
July 2012
Internal Hygiene Code inspections. Recording of all HCAIs as clinical incidents. RCAs and Case Review Reports Monthly Key Performance Indicators
Through the Hospital Infection Control Committee and the Integrated Governance Committee.
Implement Safer Delivery Surgical Services & Intra Operative Fluid Management projects
95% of theatre lists start within 10 minutes of recorded start time.
March 2012
Implement Intra-Operative Fluid Management
March 2012
Monthly audits Musculoskeletal Directorate Board (MSK) and the Performance Management Group. Summary of progress on clinical audits to the Integrated Governance Committee.
Priorities for Improvement

Quality Account 2010 – 2011 - 5 -
Clinical Effectiveness Deadline(s) How progress will be measured
How progress will be reported and
monitored
Enhanced clinical pathway redesign
Develop integrated spinal pathway in conjunction with the Oxford Radcliffe Hospitals and with the Primary Care Trust
March 2012
Review patient pathways for non-elective (urgent) admissions
March 2012
Review & improve patient pathways implement Enhanced Recovery principles.
March 2012
Reports on progress. Through the MSK Board and the Performance Management Group.
Ensure through mapping, gain assurance and identify resources for outcomes per clinical team - Patient Reported Outcome Measures (PROMs)
Further development of the PROMS to include compliance with commissioning thresholds and use of patient decision making aids for patients with total knee replacement.
September 2011
In the next year we will be embedding further collection of PROMS for all spinal patients and all physiotherapy patients.
March 2012
Reports on progress. Through the MSK Board and the Performance Management Group.

Quality Account 2010 – 2011 - 6 -
Patient Experience Deadline(s) How progress will be measured
How progress will be reported and
monitored
To implement mechanisms ensure that every patient has the opportunity to give patient experience feedback
Implement mechanisms for capturing patient experience in all clinical areas
June 2011
All patients will be invited to complete a short questionnaire, commencing firstly with inpatients as a trial, and then expanding to outpatients.
Collation of responses via an IT system. Reports to individual teams, directorate board meetings and to the Integrated Governance Committee.
To give a pledge to every patient that they will not be cancelled more than once for an appointment or an admission, and will receive a written apology from the Chief Executive.
Implement new protocol, training staff and monitoring feedback
August 2011
Audit of use of protocol Key Performance Indicators (number of cancellations)
Integrated Governance Committee and Directorate Boards
To give a pledge to every patient that once they have been told by a senior clinician that they can be discharged this will happen within two hours.
Implement new protocol, training staff and monitoring feedback
June 2011
Audit of use of protocol Incident reports for delayed discharges.
Integrated Governance Committee and Directorate Boards

Quality Account 2010 – 2011 - 7 -
This section contains the nationally specified mandatory statements and information that must be included for comparison by all NHS provider organisations as part of this report.
__________________________________________ 1) Review of Services
During 2010/11 the Nuffield Orthopaedic Centre NHS Trust provided and/or subcontracted 39 NHS services.
1. Acute Pain Service 2. Bone Infection 3. Disability Services 4. Elbow and Shoulder Surgery 5. Foot and Ankle 6. Gait Analysis 7. Hand and Wrist Surgery 8. Hip and Knee 9. Histopathology 10. Infection Control 11. Limb Reconstruction 12. Medical Illustration 13. Metabolic Medicine 14. Neurological Rehabilitation 15. Occupational Therapy 16. Orthopaedics 17. Orthotics 18. Osteoporosis service 19. Oxford Bone and Soft Tissue Tumour Service 20. Oxfordshire Wheelchair Service 21. OxPARC: Oxford Paediatric and Adolescent Rheumatology Centre 22. OXSPORT@NOC : Human Performance Laboratory 23. Paediatric Musculo-Skeletal Services 24. Pain Management 25. Physiotherapy 26. Plastic & Reconstructive Surgery 27. Prosthetics 28. Radiology 29. Rehabilitation 30. Rehabilitation Engineering 31. Rheumatology 32. Shoulder and Elbow 33. Spasticity Management 34. Specialist Disability Service 35. Spinal 36. Tissue Viability 37. Training 38. Tumour Service 39. Musculoskeletal Tier 2 Interface Service
The Nuffield Orthopaedic Centre NHS Trust has reviewed all the data available to them on the quality of care in all of these NHS services.
Statements of Assurance from the Board

Quality Account 2010 – 2011 - 8 -
The Trust Board reviews quality issues as a whole, rather than by each service individually, as quality and safety initiatives apply to all of its services. Specific reports received and reviewed by the Trust Board during 2010/11 include:
• Quarterly Patient Experience Reports (which include complaints, Patient Advice and Liaison Service (PALS) contacts and results from the Patient Experience surveys.
• Annual Infection Control Report.
• Monthly infection control metrics.
• Review of the Risk Register and Assurance Framework.
• Annual Safeguarding adults and children reports.
• Report on emergency preparedness.
• Quarterly review of nursing care via a report from the Modern Matrons.
• Patient environment reports, via the Patient Environmental Action Team (PEAT) reports.
• Annual patient survey.
• Hygiene Code report.
• NOC Network (patient experience) report.
• Review of access to services via monthly performance reports.
• Report on Information Security.
• A patient story told at each board meeting. The income generated by the NHS services reviewed in 2010/11 represents 100% per cent of the total income generated from the provision of NHS services by the Nuffield Orthopaedic Centre NHS Trust for 2010/11.
__________________________________________ 2) Participation in Clinical Audits
a) National Audits and National Confidential Enquiries During 2010/11 8 national clinical audits and 1 national confidential enquiry covered NHS services that Nuffield Orthopaedic Centre NHS Trust provides.
During that period Nuffield Orthopaedic Centre NHS Trust participated in 4/8 (50%) national clinical audits and 1/1 (100%) national confidential enquiries of the national clinical audits and national confidential enquiries which it was eligible to participate in. The national clinical audits and national confidential enquiries that Nuffield Orthopaedic Centre NHS Trust was eligible to participate in during 2010/11 are as follows:
National Audits Emergency use of oxygen (British Thoracic Society)
Hip, knee and ankle replacements (National Joint Registry) Elective surgery (National PROMs Programme) Stroke care (National Sentinel Stroke Audit) Falls and non-hip fractures (National Falls & Bone Health Audit) Depression & anxiety (National Audit of Psychological Therapies) National Joint Registry National Cancer Survey

Quality Account 2010 – 2011 - 9 -
National Confidential Enquiries National Confidential Enquiry into Patient Outcome and Death (NCEPOD) – Resuscitation following cardiac arrest study
National audits take place through a variety of organisations and national bodies and organisations are notified of their chance to participate through various means. It is sometimes the case that the NOC is unaware of national audits taking place until reports are published as they have not been invited to participate or otherwise informed of the audit.
The national clinical audits and national confidential enquiries that Nuffield Orthopaedic Centre NHS Trust participated in during 2010/11 are as follows:
• National Joint Registry
• National PROMs Programme
• National Falls and Bone Health Audit
• National Cancer Survey
• National Confidential Enquiry into Patient Outcome and Death (NCEPOD) – Resuscitation following cardiac arrest study
The national clinical audits and national confidential enquires that Nuffield Orthopaedic Centre NHS Trust participated in, and for which data collection was completed during 2010/11, are listed below alongside the number of cases submitted to each audit or enquiry as a percentage of the number of registered cases required by the terms of that audit or enquiry.
National Joint Registry (NJR) 100% of patients who consented to their details being included were submitted.
National PROMs Programme This is monitored monthly; monthly completion rates range from 79% to 91%
National Falls and Bone Health Audit 100%
National Cancer Survey 66% response rate
National Confidential Enquiry into Patient Outcome and Death (NCEPOD) – Resuscitation following cardiac arrest study
The Trust signed up to be part of this audit, however no cardiac arrests occurred during the study period (1st - 14th November 2010) so there was no data to submit.
The reports of 2 national clinical audits were reviewed by the provider in 2010/11
and
Nuffield Orthopaedic Centre NHS Trust intends to take the following actions to improve the quality of healthcare provided
1) The Patient Outcomes in Surgery (POIS) audit report was reviewed at the NOC. The NOC benchmarks well against our peers and no action was deemed necessary other than continuing participation. The POIS audit fed in to our work with the commissioners and local GPs to set clinical guidance for referral criteria for osteoarthritis of the hip and knee and to set the threshold for hip and knee replacement surgery.

Quality Account 2010 – 2011 - 10 -
2) The NCEPOD – An Age Old Problem Report (A review of the care received by elderly patients undergoing surgery) was published during 2010/11. The NOC is in the process of reviewing its findings and this is due to be discussed at the Trust Nursing Professional Advisory Group early in 2011/12.
b) Local Clinical Audits The reports of 50 local clinical audits were reviewed by the provider in 2010/11
And
Nuffield Orthopaedic Centre NHS Trust intends to take the following actions to improve the quality of healthcare provided:
As there are a large number of clinical audits, either completed or ongoing, at the NOC, we feel it is more useful in an overview report such as this to list those that have been completed and the reports reviewed as at year end. There are a large number of positive outcomes showing where compliance with standards is good, and also some areas where actions were required (or are planned). Some of the audits are carried out annually or at other regular periods, while others are one-off audits. Anyone wishing to have more details of local audits, results and actions taken as a result of audits (or to enquire about ongoing clinical audits) may contact the Safety Quality and Standards Team (tel. 01865 737508 or e-mail [email protected]).
1. Acupuncture audit 2. Adherence to physical activity recommendations in adolescents 3. Adherence to PTH treatment audit 4. Antibiotic doses 5. Antimicrobial prescribing audit 6. Audit of nice guidelines CG79 management of rheumatoid arthritis in adults 7. Audit of emergency rheumatology clinic access 8. Audit of management of CNS vasculitis 9. Audit of paediatric rheumatology letters 10. Audit of pathway for patients with benign lumps 11. Audit of physiotherapy compliance with HPC and CSP standards 12. Audit of referral pathway for cancer patients 13. Audit of unplanned/emergency transfers 14. Audit of assessing sleep problems in young patients with chronic pain 15. Bare below the elbows audits 16. BUPA MRI scanner PP accreditation audit 17. NICE Guidelines CG21 – Falls risk assessment audit 18. NICE Guidelines – Pressure ulcer management 19. Cleaning audits 20. DNAR (Do Not Attempt Resuscitation) documentation audit 21. Medical documentation audit 22. Drug administration audit (Oxford Centre for Enablement Directorate) 23. GP referrals to sarcoma service audit 24. Hand therapy Quick Dash audit 25. Internal Hygiene Code inspections 26. IRR 1999 and IRMER radiation safety audit 27. Malnutrition screening audit 28. Medication errors audit 29. Medicines reconciliation on admission 30. Nice Guidelines CG88 – Back pain

Quality Account 2010 – 2011 - 11 -
31. Osteoporosis and metabolic bone service patient satisfaction survey 32. Oxygen safety audit 33. Patient controlled epidural analgesia (PCEA) audit 34. Patient discharge report audit 35. Patient information survey 36. Patient satisfaction following anterior cruciate ligament (ACL) repair 37. Pharmacy insulin audit 38. Physiotherapy notes audit 39. Point prevalence VIP audit 40. Prescription guidelines/Patient activity code audit 41. Promoting safer use of injectable medicines audit 42. Patient reported outcomes – Oxford Centre for Enablement directorate 43. Review of Proximal Interphalangeal Joint replacement outcomes 44. Rheumatology day unit patient satisfaction survey 45. Saving Lives audits 46. Sharps safety and waste disposal audit 47. Vancomycin use and monitoring 48. Vertebroplasty audit 49. WHO Surgical Safety Checklist audit 50. Hand hygiene audits
__________________________________________
3) Research The number of patients receiving NHS services provided or sub-contracted by Nuffield Orthopaedic Centre NHS Trust in 2010/11 that were recruited during that period to participate in research approved by a research ethics committee was 1800
_________________________________________

Quality Account 2010 – 2011 - 12 -
4) Use of the CQUIN Payment Framework A proportion of Nuffield Orthopaedic Centre NHS Trust income in 2010/11 was conditional on achieving quality improvement and innovation goals agreed between Nuffield Orthopaedic Centre NHS Trust and any person or body they entered into a contract, agreement or arrangement with for the provision of NHS services, through the Commissioning for Quality and Innovation (CQUIN) payment framework. Further details of the agreed goals for 2010/11 and for the following 12 month period are available electronically at http://www.noc.nhs.uk/aboutus/safetyqualitystandards/default.aspx
__________________________________________
5) The Care Quality Commission Nuffield Orthopaedic Centre NHS Trust is required to register with the Care Quality Commission and its current registration status is: registered for regulated Activities -
Treatment of disease, disorder or injury Surgical procedures Diagnostic and screening procedures Medical treatment to people detained under the Mental Health Act
Nuffield Orthopaedic Centre NHS Trust has the following conditions on registration:
Provider Conditions: This Regulated Activity may only be carried on at the following locations: Nuffield Orthopaedic Centre NHS Trust, Windmill Road, Oxford, OX3 7LD Note that, for the purposes of registration, this location allows for the services to patients via home visits and in peripheral clinics held by our staff around the county.
The Care Quality Commission has not taken enforcement action against Nuffield Orthopaedic Centre NHS Trust during 2010/11.
Nuffield Orthopaedic Centre is subject to periodic reviews by the Care Quality Commission and the last review self-assessment review was in February - March 2011 (submission of a self-assessment against the requirements of the Hygiene Code with a follow up unannounced site visit on 11th March). The CQC found that the NOC was compliant with this essential standard.
Nuffield Orthopaedic Centre NHS Trust intends to take the following action to address the points made in the CQC’s assessment: At the unannounced visit some minor issues were noted, most of which were rectified able to be rectified immediately. An action plan on the other minor issues was drawn up the following day and agreed at the Trust Integrated Governance Committee in March. The action plan will be monitored until complete. There were no required actions in the final CQC report.
__________________________________________

Quality Account 2010 – 2011 - 13 -
6) Data Quality
a) Statement on data quality
The Nuffield Orthopaedic Centre NHS Trust will be taking the following actions to improve data quality:
The trust will continue with its program of Data Quality Audits, publishing the results to the operational team who will provide an action plan which will be monitored by the Information Governance Group.
b) NHS number and General Medical Practice Code Validity
Nuffield Orthopaedic Centre NHS Trust submitted records during 2010/11 to the Secondary Uses Service for inclusion in the Hospital Episode Statistics which are included in the latest published data.
The percentage of records in the published data:
— which included the patient’s valid NHS number was:
• 97% for admitted patient care;
• 98% for outpatient care.
— which included the patient’s valid General Medical Practice Code was:
• 98% for admitted patient care;
• 98% for outpatient care. c) Information Governance Toolkit Attainment Levels Nuffield Orthopaedic Centre NHS Trust Information Governance Assessment report score overall score for 2010/11 was 66% and was graded Green, Satisfactory.
d) Clinical Coding
Nuffield Orthopaedic Centre NHS Trust was subject to the Payment by Results clinical coding audit during the reporting period by the Audit Commission and the error rates reported in the latest published audit for that period for diagnoses and treatment coding (clinical coding) were 10%

Quality Account 2010 – 2011 - 14 -
This section contains information on our main points of achievement during 2009/10 and those areas where further improvement is needed. Patients, staff and visitor feedback indicated what the important issues that contribute towards quality care are for them and we have included the themes that emerged from this feedback along with other areas where specific achievements have been made or where we recognise that improvements are required. The information is set out according to the three domains of quality – patient safety, clinical effectiveness and patient experience - and is summarised in the tables below. Update on Priorities for improvement for 2010/11 Patient Safety One of our priorities for improvement in 2010/11 was to carry out more rapid analysis of each reported surgical site infections (SSIs). This has been in place for the majority of 2010/11 and has allowed for detailed feedback through clinical improvement groups (at team or speciality level) and at the Trust-wide Hospital Infection Control Committee. One outcome of this work was that a small cluster of SSIs above baseline levels in one speciality was recognised very rapidly, was analysed and measures put in place to minimise further risk of similar infections, including changes to antibiotic regimes raising awareness amongst clinical staff of the issues highlighted in the analysis. We have also improved the Trust internal reporting process for SSIs by enabling notification through the electronic patient record system, which allows identification of SSIs by lead doctor. Clinical Effectiveness During 2010/11 we aimed to implement new ways of monitoring and measuring outcomes for patients having certain spinal treatments and undergoing some rehabilitation programmes. This will include asking patients to tell us what difference care and treatments have made to them and the results will be used to help determine the effectiveness of care and identify where improvements to treatments and care can be made. The spinal surgery team commenced use of the Spine Tango system that uses a measure called the COMI core outcomes measures index. This comprises a pain score, quality of life and disability questions, and in the version used for follow up, asks patients to report their own complications, their satisfaction with the care they received and whether or not they have sought further treatment, either at the NOC or elsewhere. Gathering data from such patient reported scores aids not only in determining whether surgery was helpful in a particular patient, but also enables us to better inform patients in the future about likely outcomes of intervention. The team have so far collected relatively small numbers of follow up information. This will be expanded during the next year with the use of hand held devices in follow up clinics to more efficiently collect patient feedback to go straight into the database. The Trust has implemented the principles of the Enhanced Recovery Programme for patients undergoing knee and hip procedures. The underlying principle is to enable patients to recover from surgery and leave hospital sooner by minimising the stress responses on the body during surgery.
NOC Quality Indicators

Quality Account 2010 – 2011 - 15 -
The four elements to the enhanced recovery programme centre on the pre-operative assessment, planning and preparation before admission, reducing the physical stress of the operation, a structured approach management during and immediately after surgery (including pain relief) and early mobilisation. The individual interventions involved, when implemented as a group, demonstrate a greater impact on outcomes than when implemented separately.
During the past 6 months a multi-disciplinary team have been reviewing and integrating all the information given to patients about their operation, reviewing and agreeing anaesthetic and pain management protocols to enable early mobilisation. Further work is progressing to set up a pre-surgery Joint School and involve primary care representatives in the project.
Patient Experience The results of the national patient survey carried out in 2010 were generally very positive, but did show some areas where we need to make changes to improve the whole journey through the system for patients. In addition, we have listened to feedback through the Patient Advice and Liaison Service (PALS) with regard to changes to appointment dates and communication between the NOC and our patients. During 2010/11 we said we would:
1) Review the system for arranging appointments and aim to reduce the number of avoidable changes to appointment or admission dates.
What we did was:
The Trust has adhered to the rule requiring six weeks advanced notice from doctors if they are going to be unavailable for a clinic. This has resulted in a reduction in short notice clinic cancellations. Where this has occurred it has been due to unforeseen circumstances. We also put on a number of extra evening and Saturday clinics to reduce the overall waiting time; this also enabled us to rapidly re-book any cancellations that did occur.
2) Making improvements to verbal and written information to patients on common and / or important side-effects of medication, with the aim of imparting information that is simple, clear, and memorable.
An example of what we did in one specialty (rheumatology) was: All of the rheumatology patient information leaflets have been put onto the NOC website for anyone to access.
Rheumatology now routinely offer counselling for patients regarding medications, which is undertaken by the Clinical Nurse Specialist during the monthly reviews for patients newly diagnosed with rheumatoid arthritis. For patients attending the multidisciplinary appointment, this does include a lot of information on medicines, including signposting to other information sites which have excellent medicines information resources. Medication leaflets are given to all rheumatology patients in whom new disease-modifying medication is given. This has been audited for one particular medication (Methotrexate) in the Trust.

Quality Account 2010 – 2011 - 16 -
Rheumatology have done 2 sessions in the local National Rheumatoid Arthritis Society (NRAS) Support group on ‘understanding your medicines’ and ‘management of pain’, which also included getting to know your medicines.
3) Making sure that there are robust arrangements in place to provide patients with copies
of letters from the NOC clinicians to the patients’ GPs.
What we did was: During the year we gradually, team by team, implemented this and now all patients can now expect to receive a copy of any clinical letter sent to their GP.
4) Working to ensure that clinic and discharge letters are sent to patients’ GPs faster so that GPs have the information they need to continue to provide appropriate care for patients.
What we did was: A weekly check is carried out to monitor the turnaround time for letters and take action where appropriate. The Clinical Administration Team are carrying out an audit to find out how successful the process is. Once this has been completed an reviewed, actions will be taken if required to improve further.
Progress on this work will be monitored by clinical groups, for instance the Medicines Management Group, and through the Integrated Governance Committee.

Quality Account 2010 – 2011 - 17 -
Cleanliness and Infection Control
Hygiene Code Regulations Healthcare–associated infections Cleaning Hand Hygiene
Operating theatre safety WHO Surgical Safety Checklist
Workforce Mandatory Training Employee Health and Wellbeing Staff feedback on being able to contribute to improvement Zero Tolerance
Patient Reported Outcome Measures (PROMS) Hip and Knee Replacement PROMS
Research
Research at the NOC
Clinical Audit Clinical audit priorities
Waiting Times 18 week wait Wait for MRI scans Operation cancellations Waiting times for cancer referrals
Response to Feedback Patient Advice and Liaison Service (PALS) Complaints National Inpatient Survey
Facilities Car parking Privacy and Dignity
How to become involved
Patient Safety
Clinical Effectiveness
Patient Experience
Patient and Public Involvement

Quality Account 2010 – 2011 - 18 -
Cleanliness and Infection Control
Why is this important?
Feedback from our patients and visitors indicates that this is an important factor in the level of confidence they have with the care provided here. Healthcare-associated infection (HCAI) is one of the challenges to safe care in England’s healthcare services. Reducing Hospital Acquired Infections remains a priority for the NHS as a whole and is, of course, very important to us.
Quality Indicator Hygiene Code Compliance
How do we measure and report this?
Self-assessments against the Hygiene Code duties and through inspection visits. Reports are reviewed through the NOC Integrated Governance Committee and are also sent to the Primary Care Trust and the Strategic Health Authority, where we are also required to report on progress of any action plans.
The Trust continued to monitor its compliance with the Care Quality Commission (CQC) outcome 8 of the Essential Standards of Quality and Safety (the Hygiene Code). Assessments against the standard have assured the Integrated Governance Committee and the Trust Board that the criteria for compliance are being met without any significant gaps. This is a continuous process and any minor gaps in compliance are dealt with as required. The Trust was subject to a targeted review by the CQC of compliance against this outcome in March 2011 (see Statements of Assurance from the Board, section 5, for further details).
Quality Indicator Healthcare-Associated Infections
How do we measure and report this?
Among other things, we look specifically at the number of patient who have acquired Methicillin Resistance Staphylococcus Aureus bacteraemia (MRSA blood stream infections) and the number acquiring Clostridium difficile (C. difficile) infections whilst inpatients here. These reports are reviewed at the Hospital Infection Control Committee, at the Integrated Governance Committee and through service specific Clinical Improvement Groups.
MRSA blood stream infections
Year (April – March) 2007 - 2008 2008 - 2009 2009 - 2010 2010 – 2011
Number of Patients 2 1 0 1
C. difficile Infections
Year (April – March) 2007 - 2008 2008 - 2009 2009 - 2010 2010 - 2011
Number of Patients 7 13 6 7
Patient Safety

Quality Account 2010 – 2011 - 19 -
Number of Clostridium difficile cases
0
2
4
6
8
10
12
14
16
Ap
r-0
8
Ma
y-0
8
Ju
n-0
8
Ju
l-0
8
Au
g-0
8
Se
p-0
8
Oct-
08
No
v-0
8
De
c-0
8
Ja
n-0
9
Fe
b-0
9
Ma
r-0
9
Ap
r-0
9
Ma
y-0
9
Ju
n-0
9
Ju
l-0
9
Au
g-0
9
Se
p-0
9
Oct-
09
No
v-0
9
De
c-0
9
Ja
n-1
0
Fe
b-1
0
Ma
r-1
0
Ap
r-1
0
Ma
y-1
0
Ju
n-1
0
Ju
l-1
0
Au
g-1
0
Se
p-1
0
Oct-
10
No
v-1
0
De
c-1
0
Ja
n-1
1
Fe
b-1
1
Ma
r-1
1
Month
Number of C. difficile cases
6 month totals trend
12 month totals trend
During 2010/11 the overall number of C.diff cases was 7 compared with the 2009/10 overall number of 6. The overall trend over the last 30 months is downwards.
We continue to treat all cases of C. difficile as untoward incidents and subject them to case review irrespective of severity. Actions are taken in response to lessons learned from these reviews and reports are submitted to the Hospital Infection Control Committee and the Trust’s Integrated Governance Committee (which oversees all matters relating to safety and quality). In September 2010, following trials of cleaning wipes, we introduced a new range of cleaning wipes which give broader spectrum activity against hospital pathogens (bacteria and viruses) and allow clinical staff to decontaminate equipment more easily and effectively.
New national monitoring of Methicillin Sensitive Staphylococcus Aureus (MSSA) and E coli commenced in 2011.
Quality Indicator Cleanliness
How do we measure and report this?
Cleaning audits, incident reporting by staff and patient and visitor feedback. These are reviewed by the NOC site services team and through the clinical directorate board meetings and the infection control committee.
All areas of the hospital have cleaning schedules, which are displayed for staff, patients and visitors to see. The service provider, G4S, who provide our domestic services, produce weekly, monthly cleaning audits (dependant on area risk category) which are reviewed by the Ward/Area Manager. There were 11 incidents reported relating to inadequate cleaning during 2010/11. All of these were minor incidents with very low or no impact on patient care or safety. Most were resolved through immediate communication with the domestic service supervisors. G4S use percentage scoring reporting mechanism in line with the National Cleaning Standards (2003) and report these as the monthly Facilities Management (FM) Report. The Trust Estates Contract Manager reviews these, discusses any concerns about standards with G4S and ensures that action is taken to resolve. Domestic cleaning standards are also reviewed at the monthly Modern Matrons’ meeting, through which concerns can be escalated to the Trust Board if this is required.

Quality Account 2010 – 2011 - 20 -
Quality Indicator Hand Hygiene compliance
How do we measure and report this?
Ongoing regular hand hygiene audits in all clinical areas. Results of these audits are fed back to individual teams as well as being reviewed through the Modern Matrons’ meeting and the infection control committee. The results are also available for staff, patients and visitors to view on the Patient and Staff Safety Boards around the trust.
Hand hygiene compliance audits take place at least two-weekly in clinical areas and more often if the results drop below certain levels. This is done as part of a group of checks, which also includes ensuring that staff are bare below the elbows when carrying out clinical duties. To ensure results are validated, a cross-over audit is undertaken (where member of staff from one ward or department audit another ward or department). Overall the compliance with all aspects of hand hygiene has continued to be at a high level for the whole year. In areas where there has been lower compliance than required, the appropriate clinical lead has addressed whatever issues have caused this and has been required to do more frequent audits until compliance has improved again. Hand hygiene audit results are displayed on the Patient and Staff Safety notice boards throughout the Trust, updated monthly.
Operating Theatre Safety
Why is this important?
We carry out approximately 146 operations on average per week here at the NOC. Although the vast majority of these operations go ahead without a hitch, the nature of the work in operating theatres brings with it inherent risks. It is therefore important to ensure that our processes around operating department safety are set up to minimise these risks as much as possible.
Quality Indicator WHO Surgical Safety Checklist
How do we measure and report this?
We monitor the use of the checklist across all the surgical teams
The World health Organisation (WHO) Checklist is a core set of safety checks for use in any operating theatre environment. The checklist is a tool for the relevant clinical teams to improve the safety of surgery by reducing deaths and complications. The Nuffield Orthopaedic Centre introduced this checklist very promptly after its launch in this country, through the National Patient Safety Agency (NPSA), and much earlier than the required deadline given nationally. The last audit we did of our use of the checklist, a spot-audit of fifty sets of patient records, showed that the WHO Surgical Safety Checklist was present and sign-in completed in all cases. Time Out was completed for 98% of patients (49/50). The incomplete Time Out was partially completed (only the anaesthetist section had been completed). Sign Out was completed for 76% of patients (38/50). These results are generally very good and were discussed at the musculoskeletal directorate board meeting and were also reviewed at individual team and specialty clinical meetings. Where improvement was required, around the need to ensure full sign-out, this has included highlighting the importance of completing the whole surgical safety checklist at team governance meetings, requiring that one person be responsible for coordinating completion of all three sections of the checklist to avoid partially complete checklists. A further audit will take place during 2011 to check that improvement has taken place.
Quality Account 2010 – 2011 - 21 -
Workforce
Why is this important?
To provide quality care it is necessary to have the right staff with the right support and training. Our Patient and Public Involvement Group requested that this be included in our Quality Account as an important background to quality.
Quality Indicator Mandatory training attendance
How do we measure and report this?
We monitor attendance at training sessions and follow up with managers to help ensure all staff attend mandatory training and updates in areas such as resuscitation, manual handling, safeguarding vulnerable children and adults and infection control. Overall figures and progress are also reported to the Integrated Governance Group and to the clinical directorate board meetings.
During 2009/10 we had a number of areas of training that showed low levels of compliance. Part of the work that was undertaking was around ensuring that we had the right data and a new recording system was put in place. However, we were aware that recording systems were not the overall issue and we recognised that we needed to significantly improve levels of staff training. A drive to increase this by reminding staff and their managers of their obligations around mandatory training along with a large number of additional training sessions meant that we were able to increase compliance levels considerably. Over the past 12 months the Trust has delivered a programme of training that has been designed to match demand. This approach has enabled the Trust to maintain high levels of compliance throughout the year, being managed in line with the Trust mandatory and statutory training policy. All mandatory and statutory training records are held on the Trusts electronic training database to ensure that records are managed acutely with are reported monthly to the Directorate and Trust Boards. In addition a new requirement was launched this year for Information Governance training and the Trust is on target to reach compliance. The percentages change each month as staff receive update training when due, when staff leave and new staff commence. Given the turnaround of staff, we aim to have levels of a minimum of 75% compliance for each type of training. Note that a 75% compliance rate does not mean that 25% of staff have never been trained; rather that there will be some staff who have moved from another organisation and need to have specific NOC related training and some have become overdue attending updates. All new staff receive their initial NOC mandatory training at the corporate induction sessions, shortly after they commence work here. Managers are sent a monthly list of staff who are overdue for update training and are required to ensure that staff are enabled to attend mandatory training sessions and that they do book on and attend.

Quality Account 2010 – 2011 - 22 -
For key mandatory and statutory training, the following shows what the levels have been at the end of each month during the last two years.
2009/10
Training Apr May Jun Jul Aug Sep Oct Nov Dec Jan Feb Mar
Fire - clinical staff 55.6% 65.0% 78.6% 80.6% 82.8% 84.0% 85.1% 63.4% 65.1% 66.2% 68.6% 72.0%
Fire - non-clinical staff 55.6% 65.0% 78.6% 80.6% 82.8% 84.0% 85.1% 94.1% 95.1% 96.5% 97.0% 98.0%
Child Protection 15.8% 36.8% 39.5% 41.4% 44.4% 45.8% 51.3% 50.2% 59.9% 64.3% 69.7% 79.0%
Safeguarding Adults 25.1% 33.7% 38.0% 49.2% 56.6% 58.5% 61.7% 65.9% 65.8% 65.6% 66.9% 73.0%
Manual Handling - clinical staff 61.7% 74.0% 74.6% 78.3% 80.5% 78.3% 79.5% 79.4% 80.2% 85.2% 85.3% 88.0%
Manual Handling - non-clinical staff 64.9% 78.3% 79.7% 78.7% 80.2% 82.2% 83.0% 85.5% 86.1% 87.0% 88.7% 87.0%
Resuscitation 36.0% 43.9% 43.1% 50.6% 59.1% 62.3% 66.3% 69.3% 78.4% 71.6% 72.0% 71.0%
Infection Control - 1 year Hand Hygiene 63.2% 72.0% 71.3% 72.1% 72.1% 72.9% 67.4% 67.5% 68.4% 79.6% 81.7% 79.0%
Infection Control - 2 year Full Update 56.6% 65.1% 69.6% 74.1% 77.7% 77.0% 78.9% 79.0% 78.8% 81.0% 81.3% 82.0%
2010/11
Training Apr-10
May-10
Jun-10 Jul-10
Aug-10
Sep-10 Oct-10
Nov-10
Dec-10
Jan-11
Feb-11
Mar-11
Fire - clinical staff 74.0% 70.0% 69.0% 73.0% 72.0% 74.0% 75.0% 77.0% 93.0% 75.0% 73.0% 73.0%
Fire - non-clinical staff 79.0% 97.0% 94.0% 92.0% 95.0% 93.0% 92.0% 94.0% 76.0% 90.0% 89.0% 82.0%
Child Protection 79.0% 79.0% 80.0% 82.0% 82.0% 80.0% 79.0% 84.0% 83.0% 84.0% 82.0% 83.0%
Safeguarding Adults 74.0% 74.0% 73.0% 75.0% 75.0% 75.0% 76.0% 78.0% 77.0% 76.0% 76.0% 77.0%
Manual Handling - clinical staff 87.0% 88.0% 88.0% 88.0% 86.0% 87.0% 87.0% 84.0% 84.0% 82.0% 82.0% 74.0%
Manual Handling - non-clinical staff 88.0% 90.0% 91.0% 94.0% 90.0% 87.0% 87.0% 90.0% 89.0% 89.0% 89.0% 88.0%
Resuscitation 72.0% 71.0% 70.0% 71.0% 70.0% 69.0% 67.0% 70.0% 73.0% 76.0% 75.0% 73.0%
Infection Control - 1 year Hand Hygiene 81.0% 73.0% 71.0% 76.0% 75.0% 78.0% 78.0% 78.0% 77.0% 67.0% 74.0% 75.0%
Infection Control - 2 year Full Update 83.0% 82.0% 81.0% 81.0% 79.0% 81.0% 82.0% 82.0% 82.0% 83.0% 83.0% 80.0%
Information Governance - A Beginners Guide
New requirement in 2011
41.0% 65.0% 69.0%
Information Governance - Password Management
New requirement in 2011
39.0% 62.0% 66.0%

Quality Account 2010 – 2011 - 23 -
Quality Indicator Employee Health and Wellbeing
How do we measure and report this?
This is measured through a number of indicators including: -
• Average days lost per employee due to sickness absence
• Percentage sickness absence rate
• Percentage of work related tress
The Health and Wellbeing of our staff really matters to us and we have continued to develop our health and wellbeing programme to provide staff with advice and support, enabling them to achieve balance in their home and working lives. The programme integrates with the public health strategy for Oxfordshire, and by enhancing the health and wellbeing of staff the hospital is able to increase the quality of care given to the hospital’s patients and positively influence their experience at the NOC. Following the introduction of the programme the average length of sickness absence per employee has reduced by 1.6 days. The Trust’s sickness absence levels have always compared favourably with other NHS organisations across England. In February 2011 the Trust’s sickness absence rate measured an average of 3.6% compared to an average of 4% across the NHS in England. The Trust influenza vaccination programme for staff in 2010 achieved a 55% take up rate. This helped protect staff against potential infection and in turn increased our ability to provide a safe environment for our patients. In addition, following the introduction of an enhanced employee assistance programme the Trust has noticed a significant decrease in the number of staff sickness absences as a result of work related issues and this has helped us to maintain safe staffing levels.
Quality Indicator Staff feedback on being able to contribute to improvement at work
How do we measure and report this?
This is measured through the annual staff survey and is reported at all levels in the organisation
Our staff took part in the eighth annual survey of NHS staff. The results will help the Trust to review and improve the experiences of our staff at work, enabling them to provide high quality care to our patients. This year 61% of staff completed and returned a survey, which is our highest ever response rate. The results have enabled us to understand that: -
- 95% of staff agreed that that the Trust effectively promoted the importance of hand washing, (7% above the NHS Average)
- 92% of staff felt that their role makes a real difference to patients. (2% above the NHS
Average)
- 89% of staff are satisfied with the quality of care they give (2% above the NHS Average)
- 85% of staff said that if a friend or relative needed treatment, they would be happy with
the standard of care provided by the Trust (19% above the NHS Average)
- 82% of staff said that they had an appraisal in the last 12 months (7% above the NHS Average)
- 80% of staff are willing to go beyond what is normally required
- 76% of staff agreed that they are able to deliver the patient care they aspire to (7%
above the NHS Average)
- 73% of staff said that they had taken part in taught courses (3% above the NHS Average)

Quality Account 2010 – 2011 - 24 -
Quality Indicator Zero Tolerance (prevention and management of physical and verbal assaults on staff)
How do we measure and report this?
This is measured through incident reports. Reports are reviewed at the Trust Health and Safety Committee.
Verbal and Physical Aggression to Staff Incidents
0
5
10
15
20
25
30
35
40
45
50
Ap
r-0
9
Ma
y-0
9
Ju
n-0
9
Jul-09
Aug-0
9
Sep-0
9
Oct-
09
No
v-0
9
De
c-0
9
Ja
n-1
0
Fe
b-1
0
Mar-
10
Ap
r-1
0
Ma
y-1
0
Ju
n-1
0
Jul-10
Aug-1
0
Sep-1
0
Oct-
10
No
v-1
0
De
c-1
0
Ja
n-1
1
Fe
b-1
1
Mar-
11
Number Reported
Verbal aggression incident reports Physical aggresion incident reports
12 month totals trends (verbal aggression) 12 month totals trends (physical aggression)
12 month totals trends
This graph shows that the number of reported incidents involving verbal and physical aggression against staff is low. What the graph doesn’t show is the severity of the incidents, which, thankfully, is largely very low. Incidents such as these are followed up with each individual staff member and are discussed as a whole within teams and at directorate level to ensure that everything possible is being done to help prevent them. It should also be noted that a large proportion of these incidents take place in the areas where we provide care for patients who have complex neurological disabilities with associated behavioural problems arising from brain damage. In other words these are often non-malicious events related to the nature of the patient’s condition. Staff who work in these areas are trained in the care of people with these conditions and are able to minimise the risks of such incidents occurring.

Quality Account 2010 – 2011 - 25 -
Patient Reported Outcome Measures (PROMS)
Why is this important?
PROMS, used at present for patients having hip and knee replacements, enable patients to let us know what difference surgery has made to them and thus how effective the treatment has been for them: a “before and after” assessment by patient of their health status, mobility and pain levels.
For the last two years, we have been collecting data on Patient Reported Outcome Measures (PROMS), a Department of Health initiative. The patients undergoing a joint replacement at the NOC are requested to fill in questionnaires at the time of their visit to the pre-operative assessment clinic. The questionnaires ask the patients different questions about their hip/knee, including pain encountered and difficulties in performing the activities of daily living. In addition, the patient provides information about their mobility, self-care and whether they suffer from anxiety or depression. The Department of Health contacts these patients again 6 months after surgery to enquire about the outcome of their surgery and to assess the improvement in the hip/knee scores.
These scores provide information about the patient's perception of their hip or knee problem and one of the most widely used outcome measures is the Oxford Hip or Oxford Knee Score, a score now used nationally and originally developed at the Nuffield Orthopaedic Centre. These questionnaires have 12 questions and the maximum possible score (best outcome) is 48. We have successfully collected information on more than 3000 patients so far. The average (mean) hip and knee scores before surgery in patients undergoing a joint replacement was 19 for knees and 20 for hips (similar to national averages). These improved significantly post surgery and the average (mean) scores at 6 months post surgery were 37 for knees and 39 for hips for patients who have had surgery at the NOC. These improvements were noticed in more than 95% of patients and are at par and at times better than national averages. Research
Why is this important?
It is known that well-conducted clinical research increases the standard of clinical care given to patients because the trial protocols encourage high levels of attention to detail.
Quality Indicator
How do we measure and report this?
We review processes, through monitoring projects using research governance principles.
The Trust has an international standing for its research and development in bone and joint (musculoskeletal) problems. It has one of three musculoskeletal Biomedical Research Units (BRU) in the country, funded by the National Institute of Health Research (NIHR). Research includes basic science projects that study tissue removed in the course of treating patients and that aim to produce new treatments, as well as studies on large groups of patients to see who will benefit the most from surgery or medical treatments. During 2009/10 we succeeded in spreading the benefits of research by increasing the number of active research studies, increasing the numbers of patients recruited into trials, and by increasing the number of research-active clinical staff working in the Trust. The funding level has been maintained for 2011/12 which will enable us to continue increasing the numbers of studies. Looking to the future, Professor Andy Carr has been appointed as Divisional Director for the Musculoskeletal and Rehabilitation Services Division, which will be part of the new Trust formed
Clinical Effectiveness

Quality Account 2010 – 2011 - 26 -
by the merger of the Nuffield Orthopaedic Centre NHS Trust and the Oxford Radcliffe Hospitals NHS Trust. Professor Carr is currently Nuffield Professor of Orthopaedic Surgery with NDORMS and a senior consultant at the NOC specialising in shoulder surgery. He is also Director of the Musculoskeletal Biomedical Research Unit. There have been a total of nine Joint Ventures lectures since June 2009. These lectures aim to involve, inform and educate patients and the public in all aspects of musculoskeletal research in Oxford and to improve the relevance, quality and appropriateness of that research from the patient's perspective. The lectures are open to members of the public and health professionals and are free to attend. They will continue in the new merged Trust and in addition will involve research from the Biomedical Research Centre at the Oxford Radcliffe Hospitals NHS Trust. The Kennedy Institute for Rheumatology Trust (a charity supporting research into the mechanisms and treatment of rheumatic diseases such as rheumatoid and osteoarthritis) and Oxford University have entered into a collaborative agreement for Oxford University and the Kennedy Trust to build a new rheumatology research institute which will be sited on the University’s Old Road Campus. This will place the new Institute in close proximity both with the Nuffield Orthopaedic Centre and with facilities that support a range of biomedical research activities, providing an opportunity to create the world’s leading programme in inflammatory arthritis.
Clinical Audit
Why is this important?
Carrying out clinical audits enables us to monitor our compliance with guidelines and standards, such as the NICE guidelines and with national standards.
Quality Indicator Clinical audit priorities
How do we measure and report this?
Participation in clinical audits is measured by review of reports at clinical improvement groups and overall through the Integrated Governance Committee, which checks to ensure that audits are carried out on areas of assessed high risk and those covering NICE guidelines and any priority areas for the Trust.
Further details on the Trust’s participation in national and local audits is given in section 2 of the Statements of Assurance from the Board.

Quality Account 2010 – 2011 - 27 -
Waiting Times
Why is this important?
As well as being part of national targets, our patients have told us, through consultation about what to include in this document and also via feedback through PALS and complaints, that this is an important area when considering the whole of the patient experience and how people feel about their care overall.
Quality Indicators 18 week wait Waiting times for MRI Scans Cancellation of Operations Waiting times for Cancer Referrals
How do we measure and report this?
Waiting times and any cancellations are recorded as part of the care records and coding systems that form the background to overall monitoring of systems in the NHS. Monthly figures are taken from this system and reported in our monthly Key Performance Indicator (KPI) reports reviewed by both the trust and Oxfordshire PCT, who are the main commissioners of our services.
Patients Treated Within 18 Weeks
Admitted
94%
94%
95%
93%
97%
95%
93%
94%
93%
91%
91%
91%
95%
94%
96%
96%
93%
93%
95%
93%
92%
92% 97%
97%
0%
10%
20%
30%
40%
50%
60%
70%
80%
90%
100%
Apr-
09
May-0
9
Jun-0
9
Jul-09
Aug-0
9
Sep-0
9
Oct-
09
Nov-0
9
Dec-0
9
Jan-1
0
Feb-1
0
Mar-
10
Apr-
10
May-1
0
Jun-1
0
Jul-10
Aug-1
0
Sep-1
0
Oct-
10
Nov-1
0
Dec-1
0
Jan-1
1
Feb-1
1
Mar-
11
Target (90%)
Patient Experience
Quality Account 2010 – 2011 - 28 -
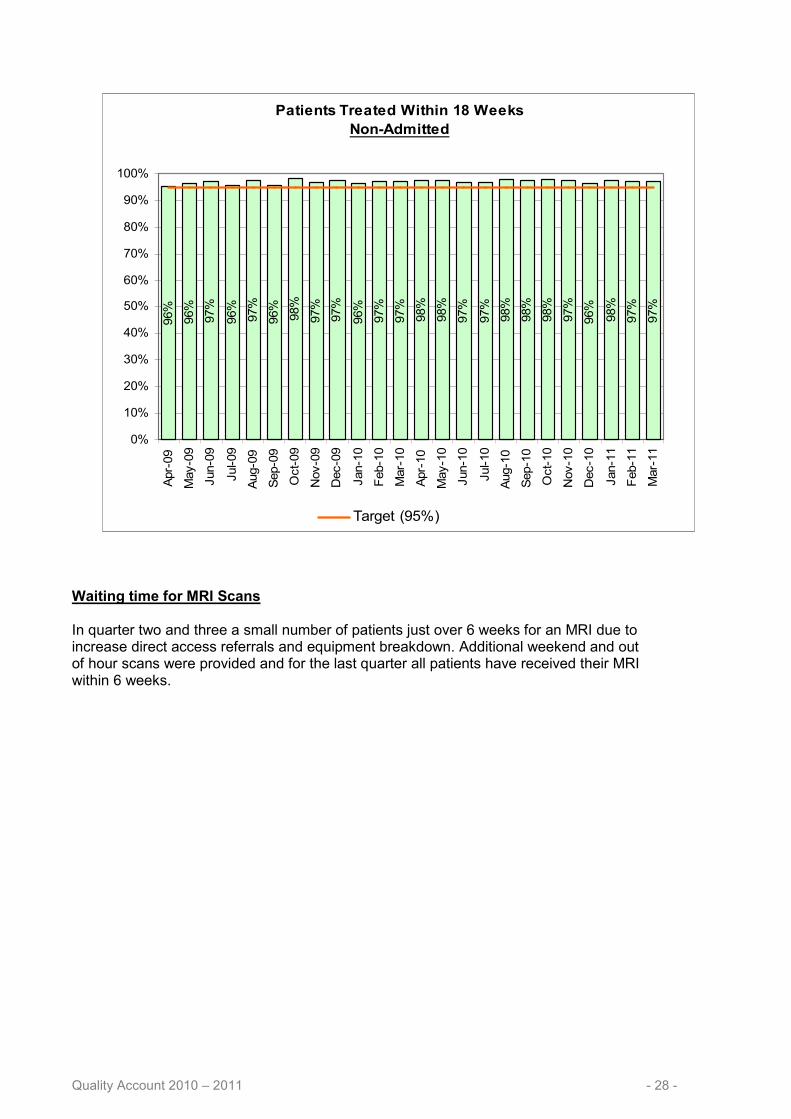
Patients Treated Within 18 Weeks
Non-Admitted
96%
96%
97%
96%
97%
96%
98%
97%
97%
96%
97%
97%
98%
98%
97%
97%
98%
98%
98%
97%
96%
98%
97%
97%
0%
10%
20%
30%
40%
50%
60%
70%
80%
90%
100%A
pr-
09
May-0
9
Jun-0
9
Jul-09
Aug-0
9
Sep-0
9
Oct-
09
Nov-0
9
Dec-0
9
Jan-1
0
Feb-1
0
Mar-
10
Apr-
10
May-1
0
Jun-1
0
Jul-10
Aug-1
0
Sep-1
0
Oct-
10
Nov-1
0
Dec-1
0
Jan-1
1
Feb-1
1
Mar-
11
Target (95%)
Waiting time for MRI Scans In quarter two and three a small number of patients just over 6 weeks for an MRI due to increase direct access referrals and equipment breakdown. Additional weekend and out of hour scans were provided and for the last quarter all patients have received their MRI within 6 weeks.

Quality Account 2010 – 2011 - 29 -
Operations Cancelled on the Day of Surgery
1.2
0%
0.8
8%
0.9
2%
1.0
4%
1.6
1%
1.1
5%
0.1
2%
0.6
5%
0.3
9%
1.7
5%
0.9
8%
0.2
5%
0.0
0%
0.3
0%
0.6
8%
0.2
9%
1.4
0%
0.4
6%
1.0
1%
0.6
4%
0.6
1%
0.3
3% 0.9
9%
0.1
2%
0.00%
2.00%
4.00%
6.00%
8.00%
10.00%
Apr-
09
May
-09
Jun
-09
Jul-
09
Aug-0
9
Sep-0
9
Oct-
09
Nov
-09
Dec
-09
Jan
-10
Feb
-10
Mar-
10
Apr-
10
May
-10
Jun
-10
Jul-
10
Aug-1
0
Sep-1
0
Oct-
10
Nov
-10
Dec
-10
Jan
-11
Feb
-11
Mar-
11
Percent of Operations Cancelled
Target (maximum of 0.8%)
12 month totals trend
6 month totals trend
Operation Cancellations on the Day of Surgery - April 2010 -
March 2011 Reasons for Cancellation
Staffing Problems, 9
Other, 4
Patient did not attend for
surgery, 14
Emergencies, 2 Equipment problems, 2
Patient cancelled their
own surgery, 28
Medically unfit for
surgery on the day, 108
Surgery not required, 39
Ran out of theatre time,
41
The sections coloured orange are those cancellations due to hospital reasons, which we are required to report externally.

Quality Account 2010 – 2011 - 30 -
We realise that it can be very upsetting for someone to have their operation cancelled on the day of surgery, particularly if this is due to issues unrelated to their condition or their own choice. The theatre team and clinicians work closely together to try to avoid any cancellations on the day and these are reviewed weekly at a multi-disciplinary senior level to see if there are any that could be avoided Data on cancellations is displayed in theatres, where it is listed by individual surgeon and reason for cancellation. Operations no longer required are reviewed to see whether the patient attended pre-admission clinic along with when and whether their symptoms have changed in the meantime or if anything about the pre-admission assessment or other arrangements could have been done better.
All patients cancelled on the day of operation subsequently had their surgery within 28 days.
Waiting Times for Cancer Referrals We monitor referrals to the Oxford Sarcoma Service using 3 indicators:
1. A 2-week wait for patients to be first seen following referral 2. A one month target from diagnosis to treatment 3. A 2 month target from diagnosis to subsequent treatment.
The NOC has achieved 100% compliance with the two week wait in 2010/11, 100% compliance with the 1-month wait from diagnosis to treatment and 100% compliance with 2-month wait from diagnosis to subsequent treatment in the last 3 quarters of 2010/11. It must be noted that due to a low number of referrals to the sarcoma service, any breach could have a significant impact on the performance targets within this category.
Cancer Two Week Referral to First Seen
70.00%
75.00%
80.00%
85.00%
90.00%
95.00%
100.00%
105.00%
110.00%
115.00%
120.00%
April May June July August September October November December January February March
Month
% Seen within 14 days of Referral
2009-10 Performance
2010-11 Performance
Target
2008-09 Performance
Cancer One Month Diagnosis to Treatment
80.00%
85.00%
90.00%
95.00%
100.00%
105.00%
110.00%
115.00%
120.00%
April May June July August September October November December January February March
Month
% Treated in 31 Days of Diagnosis
2009-10 Performance
2010-11 Performance
Target
2008-09 Performance

Quality Account 2010 – 2011 - 31 -
Cancer Two Month Referral to Treatment
60.00%
65.00%
70.00%
75.00%
80.00%
85.00%
90.00%
95.00%
100.00%
105.00%
110.00%
115.00%
120.00%
April May June July August September October November December January February March
Month
% Treated in 62 Days of Referral
2009-10 Performance
2010-11 Performance
Target
2008-09 Performance
Response to Feedback
Why is this important?
We welcome feedback on any aspect of the services we provide, whether it is on what we do well or areas in which we can improve. If we are doing something well, it is good to know so that we can plan to continue or develop these areas. If there are areas of concern we also need to know so that we can address these and improve the quality of service we provide.
Quality Indicator Patient Advice and Liaison Service (PALS)
How do we measure and report this?
PALS deal with a variety of issues from receiving compliments to be passed on to wards and departments, to responding to requests for information and dealing with concerns from patients and visitors. The service also collects all the comments cards posted in the various boxes around the Trust and adds these to the database of information and feedback. Anonymised reports are provided for team, department and directorate meetings so that any specific issues or trends in feedback can be discussed and action taken where required.

Quality Account 2010 – 2011 - 32 -
Number of PALS contacts, by month, for 2009/10
Patient Advice and Liaison Service (PALS) Contacts
93 105
93 97
63
116
86
138
92 103 141
114
129
105
104
106
87 97
68 81
63 72 97
83
0
250
500
750
1000
1250
Apr-
09
May-0
9
Jun-0
9
Jul-09
Aug-0
9
Sep-0
9
Oct-
09
Nov-0
9
Dec-0
9
Jan-1
0
Feb-1
0
Mar-
10
Apr-
10
May-1
0
Jun-1
0
Jul-10
Aug-1
0
Sep-1
0
Oct-
10
Nov-1
0
Dec-1
0
Jan-1
1
Feb-1
1
Mar-
11
Number of PALS Contacts
6 month totals trend 12 month totals trend
12 month totals trend
6 month totals trend
`
PALS is a confidential service available to patients, their families and carers. It aims to provide information or help resolve concerns relating to the Nuffield Orthopaedic Centre by addressing them as quickly as possible. Where PALS is unable to help, the enquirer is signposted to a more appropriate person or organisation. The majority of PALS contacts relate to individual issues which can be dealt with immediately, such as requests for information about hospital processes or putting people in touch with the correct department or individual.
Patients who wish to praise particular departments or individuals also contact PALS, with each compliment passed on to the relevant staff. All of these requests for information, compliments and concerns are recorded on the PALS enquiry system so that we can look at trends and follow these up as needed. The Trust website has been updated to improve the information available to patients and the public on how to make contact with different departments. The PALS, complaints and comments leaflets have been redesigned and are now available all around the Trust as one single patient feedback leaflet. The leaflet is also available to download on the Trust website. Concerns were raised with PALS last year from patients who had their surgical admission cancelled at short notice. This is something which the Trust only does as a last resort where emergency admissions have taken priority. As a result of this patient feedback an admissions audit was carried out and a Theatres Policy is currently being written. Patients have also told PALS that they have found the waiting time at the Pre-Operative Assessment Clinic to be too long, so a review of the process is now underway, which it is hoped will result in shorter appointment times. The majority of issues which are brought to PALS relate to communication. In most cases PALS is able to provide a speedy resolution for the patient, either by ensuring that the patient is able to speak to the most appropriate person, or by liaising with a department on behalf of the patient. PALS continues to provide advice and guidance to members of staff on handling patient concerns directly, helping to ensure that patients’ experience of the Trust is positive.

Quality Account 2010 – 2011 - 33 -
Quality Indicator Complaints
How do we measure and report this?
All complaints are dealt with individually with the complainant and in a manner best suited to resolve the particular concerns raised. We keep a record of all complaints to help identify areas for improvement. Complaints reports (containing anonymised information) are reviewed on a monthly, quarterly and annual basis at a number of meetings including those at team or service level so that lessons learned and actions taken can be shared. All complaints information is held separately from patients’ medical notes.
Number of formal complaints received, by month.
Formal Complaints
5
3
7
5
10
9 8 8 7
5
7
5 5
10
10
3
5
8 7
5
9 8 9
2
0
10
20
30
40
50
60
70
80
90
Apr-
09
May-0
9
Jun-0
9
Jul-09
Aug-0
9
Sep-0
9
Oct-
09
Nov-0
9
Dec-0
9
Jan-1
0
Feb-1
0
Mar-
10
Apr-
10
May-1
0
Jun-1
0
Jul-10
Aug-1
0
Sep-1
0
Oct-
10
Nov-1
0
Dec-1
0
Jan-1
1
Feb-1
1
Mar-
11
Number of Formal Complaints
6 month totals trend 12 month totals trend
12 month totals trend
6 month totals trend
When someone makes a formal complaint to us we agree with the individual complainant the best way to resolve the issues raised. For instance, some complainants wish simply to receive a formal acknowledgement from us that something went wrong and an apology along with reassurance that we have put things in place to help prevent the same thing happening to someone else. For others, particularly when related to more complex clinical issues, resolution may be best achieved through a meeting and chance to discuss their care with clinicians and agree on a positive way of proceeding. Feedback from patients has resulted in various actions being taken to improve our services. Some examples of this are:
- Work being done to improve the process for looking after inpatients’ property.

Quality Account 2010 – 2011 - 34 -
- A workshop has been held, and there is additional training, for staff on caring for patients with Alzheimer’s disease.
- Customer care training has continued for all front line staff and specific training has
been given to certain wards in response to feedback about those areas. Over the last year we have seen an increasing number of patients opt for the opportunity to discuss their complaint at a meeting with relevant staff, rather than having a formal written reply to their concerns. We have found this face to face approach to be beneficial to both the complainant and the staff involved and that it helps to ensure that people feel they have been heard and understood and helps to facilitate a more positive way forward.
Quality Indicator National Inpatient Survey
How do we measure and report this?
The inpatient survey is carried out annually and is a valuable source of information regarding patients’ perception and experience of our services. The survey identifies areas of good practice, where the trust achievements are above the national average, and also areas where we need to improve.
The National Inpatient Survey was undertaken by Quality Health for Nuffield Orthopaedic Centre NHS Trust between September 2010 and January 2011. The survey required a sample of 850 inpatients to be drawn from those patients being discharged during June, July, or August 2010 who had had a stay of at least one night in hospital. The NOC scores in relation to other Trusts on issues relating to the patients’ overview of their stay are generally higher and, whilst scores have remained at about the same level as last year, some areas show a slight fall. Survey Findings against Key Themes Admission The NOC average scores are higher in relation to other Trusts on patient admission. However the overall NOC scores on patient admission issues have fallen back since last year.
- 28% of patients said that their admission date was changed once, and a further 7% said it was changed twice or more.
- 26% of waiting list patients said they were given a choice of admission dates; 73% were not
given a choice. The Hospital and Ward The NOC average scores are higher in relation to other Trusts on issues relating to the hospital and ward environment. However the overall Trust scores on hospital and ward environment issues have fallen back since last year.
- 94% of patients said hand-wash gels were available for patients and visitors to use. - - 88% of patients said they were always offered a choice of food; 4% said they were not
offered a choice. - - Of those patients needing help from staff to eat their meals, 66% said they always got
enough help; 14% said they did not get enough help.

Quality Account 2010 – 2011 - 35 -
Doctors The NOC average scores are higher in relation to other Trusts on issues relating to doctors. However the NOC overall Trust scores on doctors have fallen back since last year.
- 90% of the patients said they always had confidence and trust in the doctors treating them; 2% said they did not.
- 79% of patients said that Doctors always gave understandable answers to important
questions - 60% said that they thought that Doctors always washed or cleaned their hands between
touching patients Nurses The NOC average scores are higher in relation to other Trusts on issues relating to nurses. In addition there has been real progress and the overall scores on nurses have improved since last year.
- 77% of patients who had important questions to ask a nurse said they always understood the answers they were given. 2% said they did not understand answers from nurses, and a further 21% said they only sometimes did.
- 79% of the patients said they always had confidence and trust in the nurses treating them;
2% said they did not. - 66% though that nurses always washed or cleaned their hands between touching patients
Care and Treatment The NOC average scores are higher in relation to other Trusts on issues relating to care and treatment. In addition there gas been real progress and the overall Trust scores on care and treatment have improved since last year.
- 64% of patients said they were definitely as involved as they wanted to be in decisions about their care and treatment; a further 30% said they were to some extent.
- 81% of patients said they always were given enough privacy when discussing their condition
or treatment.
- 92% of patients felt they were always given enough privacy when being examined or treated.
- 78% of patients said they were in pain during their stay in hospital and 76% of patients in
pain said hospital staff definitely did everything they could to help control the pain - 5% of patients said they were often told one thing by one member of staff and something
quite different by another; a further 25% said this sometimes was the case. Operations and Procedures The NOC average scores are higher in relation to other Trusts on issues relating to operations and procedures. In addition there has been real progress with the overall Trust scores on operations and procedures have improved since last year.

Quality Account 2010 – 2011 - 36 -
- 90% of patients said they had an operation or procedure during their stay in hospital. - 89% said staff explained the risks and benefits completely in a way they could understand;
1% said they were not explained. - 76% said staff explained what would be done completely in a way they could understand;
3% said this was not explained. Leaving Hospital The NOC average scores are higher in relation to other Trusts on issues relating to leaving hospital. Overall Trust scores on leaving hospital have improved since last year.
- 29% of patients said their discharge from hospital was delayed. The main reason for delays in discharge was patients having to wait for medication to take home.
- 87% of those patients taking medication home who needed an explanation said the purpose
of the medicines was explained completely in a way they could understand. 3% said it was not explained, and a further 11% felt it was only explained to some extent.
- 56% of patients who thought it was necessary said that they were told completely what
danger signals to watch for regarding their illness or treatment after they went home. Priorities for Action The NOC Board has reviewed the results of the survey and agreed three top priority actions for 2011/12.
1. To implement mechanisms ensure that every patient has the opportunity to give patient experience feedback.
2. To give a pledge to every patient that they will not be cancelled more than once for an
appointment or an admission, and will receive a written apology from CEO. 3. To give a pledge to every patient that once they have been told by a senior clinician that
they can be discharged this will happen within two hours. Other actions are planned to help ensure that patients needing assistance to eat their meals always get that assistance, addressing communication issues including reducing the amount of conflicting information given to patients, improving written information, helping patients to be more involved in decisions about their care and treatment and improving information to patients on their medication.

Quality Account 2010 – 2011 - 37 -
Facilities
Why is this important?
The provision of clean and well maintained facilities; both clinical and non-clinical is an essential ingredient of the care provided by the Trust.
Every endeavour is made to ensure that all the facilities, not just the operating theatres and wards, but the toilets, reception areas, car parks, entrances and other areas are kept clean and well maintained. Regular inspections and walk rounds are carried out in a bid to ensure the desired standards are being achieved. Feedback from staff, patients and visitors is another important monitoring tool. The annual Patient Environmental Action Team (PEAT) audit took place in February 2011 and was carried out by the site services manager, a patient representative, two of the modern matrons (including the senior nurse for infection control) and a representative from the cleaning service provider, G4S. This audit contains sections on areas that are specifically related to facilities management. The Trust continues to achieve excellent results in this audit with only a few minor issues identified Examples of results from the February 2011 audit include: Specific Cleanliness (Scale of 0 – 5 where 5 = excellent)
Patient
Equipment
Electrical Points and Equipment
Walls, Ceilings
and Doors
Radiators and
Ventilation Grills
Floors Curtains
and Blinds
Windows/ External Glazing
Wards 4 5 5 5 4 4 5
Clinics 4 5 4 4 4 5 5
Stairwells, Lifts, Corridors and other public areas
N/A 5 5 5 5 N/A 5
Internal Glazing inc
Mirrors
High Surfaces
Low Surfaces
Seating Bed Area Waste
Receptacles
Wards 5 5 5 5 5 5
Clinics 5 4 5 4 N/A 5
Stairwells, Lifts, Corridors and other public areas
5 5 5 5 N/A 5
Areas requiring action:
- Two wards have equipment storage issues - In one area there was damaged flooring and some waiting area chairs need to be
changed to be wipeable. - Some small areas of dust in two areas.
Quality of Toilet and Bathroom Environment (Scale of 0 – 5 where 5 = excellent)
Overall Bathroom
Environment
Overall Toilet Environment
Patient Equipment (Condition)
Walls, Ceilings and Doors
(Décor)
Floors (Condition)
Wards 5 5 5 4 5
Clinics N/A 5 4 4 5

Quality Account 2010 – 2011 - 38 -
Overall Bathroom
Environment
Overall Toilet Environment
Patient Equipment (Condition)
Walls, Ceilings and Doors
(Décor)
Floors (Condition)
Other Public Areas
5 5 N/A 5 5
Sanitary Fittings
(Condition)
Curtains and Blinds
(Condition)
Waste Receptacles
Odour Control
Wards 5 4 5 4
Clinics 5 5 5 5
Other Public Areas
5 5 5 5
Areas requiring action: - Some curtains were too short - A door frame had some flaking paint
Environment (Scale of 0 – 5 where 5 = excellent)
All Wards Outside Welcoming &
Reception Clinics
Stairwells, Lifts,
Corridors and other public
areas
Décor 5 5 5 5 4
Lighting (Including Security Aspects)
5 5 5 5 5
Tidiness 4 5 5 4 4
Waste Management 5 5 5 4 5
Odour Control 4 5 5 5 5
Furnishings 5 5 5 5 5
Maintenance 5 5 5 5 5
Linen 5 n/a n/a 4 n/a
Floors 5 n/a 5 5 5
Provision of Suitable Arrangements for personal possessions
5 n/a n/a n/a n/a
Areas requiring action:
- Waste waiting to be collected next to fire exits - Too much paper signage - Gowns in consulting rooms resting on light boxes - Decor damage to pillar protection in two places

Quality Account 2010 – 2011 - 39 -
Quality Indicator Parking
Why is this important?
Orderly car parking is essential for access to site for patients, visitors, staff and emergency services. In addition feedback from patients and visitors tells us that the ease, or otherwise, of getting to the hospital is an important part of their experience of care here.
The Trust is in continual communication with the local councils on improving direct public transport links to the Headington area. To encourage Staff to use alternate modes of transport when coming to work, the Trust has invested in a periodic on site cycle repair service for staff and a purpose built motorcycle parking area has been constructed. A review of the Trusts Parking Policy in late 2009 and early 2010 resulted in a number of measures, including the introduction of staff parking permit exclusion zones, the provision of additional disabled spaces and the reallocation of 18 staff parking spaces to patient and visitor pay and display spaces. During this year there have been markedly less complaints about parking. However, the Trust does appreciate that it will never be perfect for everyone. For this reason any comment received about parking on site is responded to on an individual basis.
Quality Indicator Privacy and Dignity
How do we measure and report this?
This is monitored through a privacy and dignity audit and via the Privacy and Dignity Group that meets annually and includes representation from the Patient Liaison Group in its membership.
Trust policy requires that patients admitted to a bed space in a bay with other patients, that this will be a bay with members of the same sex and where there is access to single sex washing and toileting facilities. The only exceptions to this are for patients being cared for in the theatre recovery area immediately after their operation and in the High Dependency Unit. There have been no breaches of this policy occurring in the last two years. Feedback from patients regarding the accommodation and toilet facilities continues to be positive. The Trust has reviewed its provision for theatre wear and now provides paper pants and theatre gowns for bariatric patients. The website has been reviewed and includes information on how we care for patients as well as offering them the facility to email us with any queries they may have so that they can be reassured prior to their admission to the Trust.

Quality Account 2010 – 2011 - 40 -
The Nuffield Orthopaedic Centre NHS Trust is committed to ensuring that it delivers excellence (one of its core values) for its patients, its staff, the NHS and its partners in the community. This can best be achieved by the full participation of patients, carers, the public and its staff in the way that it shapes and delivers its services. This strategy sets out the national and local agenda for patient and public involvement. It includes the key principles and standards on which patient and public involvement at the NOC is based. The objectives for the NOC are clearly stated with a detailed action plan. The Patient and Public Involvement Steering Group (PPI) meets quarterly and comprises both staff and members of patient groups, including the NOC Network group and the Patient Liaison Group. Members of these groups support the Trust by working with staff on a number of key projects aimed at improving the quality of service for our patients. Projects include surveys on the quality of the hospital’s leaflets and other materials and patient safety walkabouts which seek to highlight safety issues from a patient’s point of view. We have a very enthusiastic group of people (patients, carers and others) involved at the NOC and are very grateful for the input they provide, both in their time and in providing the patient and public perception of how services work. Patient stories are invaluable and examples of these are presented to the Trust Board to help keep perspective on what it is like for individuals being treated at the NOC. We encourage any degree of involvement that matches your availability, experience, interests and skills. If you would like to be involved please contact us: E-mail: [email protected]
By post: PALS Office Nuffield Orthopaedic Centre NHS Trust Windmill Road Headington Oxford OX3 7LD
Telephone: 01865 738126
Patient and Public Involvement

Quality Account 2010 – 2011 - 41 -
Appendix - Comments on the NOC Quality Account As required by the regulations governing the NHS Quality Accounts (QAs), the lead commissioning Primary Care Trust is required to comment on the QAs of its providers. In addition, comments are invited from the Health Overview and Scrutiny Committee and from the Local Improvement Network (LINks) The Health Overview and Scrutiny Committee and the Local Improvement Network were invited to comment; both declined. The comments from Oxfordshire PCT are as follows:
“NHS Oxfordshire has reviewed the Nuffield Orthopaedic Centre (NOC) NHS Trust Quality Account against the three domains of quality: patient experience, patient safety and clinical effectiveness. There is evidence that the Trust has relied on both internal and external assurance mechanisms and NHS Oxfordshire is satisfied as to the accuracy of the data contained in the Account.
NHS Oxfordshire regards these quality accounts as a generally honest presentation of the current position. The NOC has performed well in many areas in 2010/11 and the account reflects progress in reducing the incidence of Clostridium Difficile and good trends in mandatory training uptake. PCT is also pleased to note that there has been a reduction in surgery cancellations as a result of the efforts of staff at all levels. Progress has clearly been made on all the priorities for improvement highlighted in the 2009-10 quality accounts, such as reporting and follow-up of surgical site infections and new ways of measuring outcomes for patients having certain spinal treatments; further action is planned in many of these areas to consolidate the achievements of the year. However, NHS Oxfordshire would have liked to see included in the Priorities for Improvement section a greater focus on key issues of venous thromboembolism risk assessment and diagnostic turnaround times.
One purpose of the Quality Account is to help patients assess the quality of services and make choices between different providers. NHS Oxfordshire recognises that the Trust has taken on board the PCT’s comments made last year by giving more information on patient reported outcomes for high volume surgical procedures such as hip and knee surgery, but would encourage the NOC to use additional information in future from other sources such as clinical audit to give a more comprehensive view of clinical outcomes.
The Trust should consider writing brief details of the quality improvement initiatives that have been implemented as a result of Commissioning for Quality and Innovation (CQUIN) over and above providing a link to a web page outlining CQUIN details.
There are some occasions where there is ambiguity, or where the language is a little hard to understand and greater clarity would get the message across more effectively. The document is not easy for a layperson to read, and PCT requests that in 2011/12 consideration is given to making the document more accessible to patients and the public.
The planned integration of the NOC and the ORH (Oxford Radcliffe Hospitals) may generate some risks for quality of services as integration of services can lead to a loss of managerial focus on quality. However, NHS Oxfordshire is encouraged by this account and is looking forward to working closely with the NOC as we move towards GP Commissioning in Oxfordshire.
Progress has clearly been made on all the priorities for improvement highlighted in the 2009-10 quality accounts, such as reporting and follow-up of surgical site infections and new ways of measuring outcomes for patients having certain spinal treatments; further action is planned in many of these areas to consolidate the achievements of the year.”


