59
Quality Account 2016/17 This annual report covers the period 1 April 2016 to 31 March 2017

Quality Account 2016/17This annual report covers the period 1 April 2016 to 31 March 2017

University Hospitals Birmingham NHS Foundation Trust | Quality Account 2016-17 | 3
Quality Account 2016-17
Contents
1 Chief Executive’s Statement 4
2 Priorities for improvement and statements of assurance from the Board of Directors 6
2.1 Priorities for Improvement 6
Priority 1: Reduce grade 2 hospital-acquired pressure ulcers 7
Priority 2: Improve patient experience and satisfaction 9
Priority 3: Timely and complete observations including pain assessment 17
Priority 4: Reduce medication errors (missed doses) 19
Priority 5: Infection prevention and control (to be removed for 2017/18) 21
NEW Priority 5 – Reducing harm from falls (New for 2017/18) 23
NEW Priority 6 – Timely treatment for sepsis in the emergency department (New for 2017/18) 25
2.2 Statements of assurance from the Board of Directors 26
2.3 Performance against national core set of quality indicators 33
3 Other information 34
3.1 Overview of quality of care provided during 2016/17 34
3.2 Performance against indicators included in the NHS Improvement Single Oversight Framework 38
3.3 Mortality 40
3.4 Safeguarding 41
3.5 Staff Survey 41
3.6 Specialty Quality Indicators 43
3.7 Sign Up to Safety 44
3.8 Duty of Candour 45
3.9 Glossary of terms 46
Appendix A: Performance against core indicators 49
Annex 1: Statements from commissioners, local Healthwatch organisations and Overview and Scrutiny Committees 53
Annex 2: Statement of directors’ responsibilities for the Quality Report 57
Annex 3: Independent Auditor’s Report on the Quality Report 58

4 | University Hospitals Birmingham NHS Foundation Trust | Quality Account 2016-17
1 Chief Executive’s Statement
2016/17 Quality Account
University Hospitals Birmingham NHS Foundation Trust (UHB) has continued to focus on delivering high quality care and treatment to patients during 2016/17. In line with national trends, UHB has again seen unprecedented demand for its services with large increases in Emergency Department attendances and admissions which has put significant pressure on our ability to deliver planned treatments. The Trust’s Vision is “to deliver the best in care” to our patients. The Trust’s Core Purposes – Clinical Quality, Patient Experience, Workforce and Research and Innovation – provide the framework for UHB’s robust approach to managing quality.
UHB has made progress in relation to two of the five priorities for improvement set out in last year’s Quality Report: ‘reducing grade 2 pressure ulcers’ and ‘improving patient experience and satisfaction’. Performance for the remaining indicators – ‘timely and complete observations’, ‘reducing medication errors’ and ‘infection prevention and control’ – has been mixed with some progress and further work required to improve performance in 2017/18.
The Board of Directors has chosen to continue with four of the five priorities for improvement in 2017/18. They have chosen to remove priority 5 (infection prevention and control) and to replace it with two new priorities – ‘reducing harm from falls’ and ‘timely treatment for sepsis in the Emergency Department’. Both of these can have a devastating impact on patients and relatives.
The selection of local patient survey questions included in priority 2 (improving patient experience and satisfaction) has been refreshed based on performance for 2016/17 by the Care Quality Group which has Governor representation.
The Trust continues to do all it can to improve performance for the ‘All cancers – maximum 62-day wait for first treatment from urgent GP referral for suspected cancer’ and ‘A&E maximum waiting time of 4 hours from arrival to admission/transfer/discharge’ indicators which are affected by late referrals from other trusts and ever increasing A&E attendances respectively.
It is very pleasing to see that inpatients and outpatients continue to recommend the Trust as a place to be treated in the ‘Friends and Family’ tests, and that responses to a number of the questions in the patient surveys have improved.
UHB’s focused approach to quality, based on driving out errors and making incremental but significant improvements, is driven by innovative and bespoke information systems which allow us to capture and use real-time data in ways which few other UK trusts are able to do. A wide range of omissions in care have
been reviewed in detail during 2016/17 at the regular Executive Care Omissions Root Cause Analysis (RCA) meetings chaired by the Chief Executive. Cases are selected for review from a range of sources including an increasing number put forward by senior medical and nursing staff: wards selected for review, missed or delayed medication, Serious Incidents (SIs), serious complaints, infection incidents, incomplete observations and cross-divisional issues.
Data quality and the timeliness of data are fundamental aspects of UHB’s management of quality. Data is provided to clinical and managerial teams as close to real-time as possible through various means such as the Trust’s digital Clinical Dashboard. Information is subject to regular review and challenge at specialty, divisional and Trust levels by the Clinical Quality Monitoring Group, Care Quality Group and Board of Directors, for example. An essential part of improving quality at UHB continues to be the scrutiny and challenge provided through proper engagement with staff and other stakeholders. These include the Trust’s Council of Governors, General Practitioners (GPs) and local Clinical Commissioning Groups (CCGs).
A key part of UHB’s commitment to quality is being open and honest with our staff, patients and the public, with published information not limited to good performance. The Quality web pages provide up-to-date information on UHB’s performance in relation to quality: http://www.uhb.nhs.uk/quality.htm. The Trust has continued to publish monthly data during 2016/17 showing how each inpatient specialty is performing for a range of indicators on the dedicated mystay@QEHB website: infection rates, medication given, observations, clinical assessments and patient feedback.
The Trust’s internal and external auditors provide an additional level of scrutiny over key parts of the Quality Report. The Trust’s external auditor Deloitte has reviewed the content of UHB’s 2016/17 Quality Report and undertaken testing for three areas in line with the NHS Improvement guidance on external assurance: 18-week maximum wait from point of referral to treatment (incomplete pathways), maximum waiting time of four hours in A&E from arrival to admission, transfer or discharge and one local indicator. The Trust’s Council of Governors selected one of the new quality improvement priorities – priority 5 (reducing harm from falls) – as the local indicator to be audited.
The Trust has been given an unmodified opinion for the content of the Quality Report and the two nationally mandated indicators, with a number of recommendations for improvement which will be implemented during 2017/18. The auditors are not required to provide an opinion for the local indicator, for which there is one minor recommendation.

University Hospitals Birmingham NHS Foundation Trust | Quality Account 2016-17 | 5
Following the Care Quality Commission’s (CQC) focussed visit in December 2015 to review Cardiac Surgical Services, UHB was required to submit outcome and performance data on a weekly basis. In May 2016 the CQC wrote to UHB to remove the conditions from registration, and to inform the Trust that data and updates would only be required quarterly. The Cardiac Surgery Quality Improvement Programme, which was commenced prior to the CQC review, continues and the majority of the actions identified from the CQC and subsequent external visit have been completed. In November 2016, the Royal College of Surgeons conducted a review which recognised the progress made by the service.
In March 2017 the NHS published the Next Steps on the Five Year Forward View, outlining plans for the health service over the next few years that will deliver the ambitions set out in the Five Year Forward View, originally published in October 2014. This sets targets to “make the biggest national move towards integrated care of any major western country”. The Trust is a partner in delivering the Birmingham and Solihull Sustainability and Transformation Plan (and I am its interim lead), which aims to co-ordinate and transform local health service delivery to meet changing patient needs within the available funding.
During 2016/17, UHB continued to support Heart of England NHS Foundation Trust (Heartlands Hospital, Good Hope Hospital, Solihull Hospital, Birmingham Chest Clinic and Solihull Community Services) in order to share learning and best practice. Plans are being developed to ensure the ongoing sustainability of those services through the formation of a single organisation.
UHB has also expanded Umbrella, a sexual health treatment and prevention programme, under which it is responsible for delivering sexual health services through clinics and partner GPs and pharmacies, across Birmingham and Solihull. This has pioneered the type of population-based system proposed by the Next Steps on the Five Year Forward View strategy to deliver better outcomes for users of its services alongside increased efficiency.
2017/18 will be another very challenging year for UHB as we focus on delivering the best in care and achieving outcome and access targets alongside ever increasing demand for our services coupled with tighter financial constraints. The Trust will continue working with regulators, commissioners, healthcare providers and other organisations to influence future models of care delivery and deliver further improvements to quality during 2017/18.
On the basis of the processes the Trust has in place for the production of the Quality Report, I can confirm that to the best of my knowledge the information contained within this report is accurate.
Dame Julie Moore, Chief Executive18 May 2017

6 | University Hospitals Birmingham NHS Foundation Trust | Quality Account 2016-17
2 Priorities for improvement and statements of assurance from the Board of Directors
2.1 Priorities for ImprovementThe Trust’s 2015/16 Quality Report set out five priorities for improvement during 2016/17:
Î Priority 1: Reduce grade 2 pressure ulcers Î Priority 2: Improve patient experience and
satisfaction Î Priority 3: Timely and complete observations
including pain assessment Î Priority 4: Reduce medication errors (missed doses) Î Priority 5: Infection prevention and control
The Trust has made progress in relation to two quality improvement priorities: Priority 1 – reducing grade 2 pressure ulcers and Priority 2 – improving patient experience and satisfaction. There has however been mixed performance for timely and complete observations, reducing medication errors and infection prevention and control during 2016/17.
Performance for the first indicator (observations) in Priority 3 achieved the end of year target, however the second indicator (timely analgesia) did not despite steady results throughout the year. Performance for Priority 4 (missed doses) has remained about the same, so did not achieve the proposed reduction in 2016/17. For Priority 5, the Trust missed the trajectory for zero Trust-apportioned MRSA bacteraemias but met the C. difficile infection trajectory during 2016/17.
The Board of Directors has chosen to continue with four of the five priorities for improvement in 2016/17. Priority 5, ‘Infection prevention and control’ has been removed and two new priorities have been added: ‘Reducing harm from falls’ and ‘Timely treatment for sepsis in the emergency department’.
1 Reduce grade 2 pressure ulcers
New trajectory for 2017/18 agreed with CCG
2 Improve patient experience and satisfaction
New patient survey questions added, others removed due to achieving the 2016/17 target
3 Timely and complete observations including pain assessment
Targets for 2017/18 updated in line with 2016/17 performance
4 Reduce medication errors (missed doses)
Targets and methodology kept the same for 2017/18
5 Infection prevention and control
To be removed
Reducing harm from falls New priority for 2017/18
6 Timely treatment for sepsis in the emergency department
New priority for 2017/18
The improvement priorities for 2017/18 were confirmed by the Trust’s Clinical Quality Monitoring Group chaired by the Executive Medical Director, following consideration of performance in relation to patient safety, patient experience and effectiveness of care. These were then discussed with various Trust groups including staff, patient and public representatives during Quarter 4 2016/17 as shown in the table below. The priorities for improvement in 2017/18 were also shared and discussed with interested parties outside the Trust including the Trust’s lead Clinical Commissioning Group (CCG), Birmingham CrossCity CCG.
The focus of the patient experience priority was decided by the Care Quality Group and the priorities for improvement in 2017/18 were then finally approved by the Board of Directors in March 2017. The priorities for 2017/18 will be presented to the Trust Partnership Team and cascaded to all staff via Team Brief in May 2017.
Date Group Key members
February 2017
Council of Governors
Chairman, Chief Executive, Executive Directors, Directors and Staff, Patient and Public Governors
March 2017
Care Quality Group
Chairman, Chief Executive, Executive Directors, Directors and Staff, Patient and Public Governors
April 2017
Chief Operating Officer’s Group
Executive Chief Operating Officer, Deputy Chief Operating Officer, Directors of Operations, Divisional Directors, Director of Operational Finance, Deputy Chief Nurse, Director of Patient Services, Director of Estates and Facilities, Director of IT Services plus other Managers
May 2017
Trust Partnership Team
Executive Directors, Directors, Human Resources Managers, Divisional Directors of Operations, Staff Side Representatives
May 2017
Chief Executive’s Team Brief (cascaded to all Trust staff)
Chief Executive, Executive Directors, Directors, Clinical Service Leads, Heads of Department, Associate Directors of Nursing, Matrons, Managers
Although three of the 2017/18 priorities have been in place for a number of years, the focus and targets within each priority are regularly reviewed and updated in line with changes in performance and in response to priorities within the Trust.
The performance for 2016/17 and the rationale for any changes to the priorities are provided in detail below. It might be useful to read this report alongside the Trust’s Quality Report for 2015/16.

University Hospitals Birmingham NHS Foundation Trust | Quality Account 2016-17 | 7
Priority 1: Reduce grade 2 hospital-acquired pressure ulcers
BackgroundThis quality improvement priority was first proposed by the Council of Governors and approved by the Board of Directors for 2015/16.
Pressure ulcers are caused when an area of skin and the tissues below are damaged as a result of being placed under pressure sufficient to impair its blood supply (NICE, 2014). They are also known as ‘bedsores’ or ‘pressure sores’ and they tend to affect people with health conditions that make it difficult to move,
especially those confined to lying in a bed or sitting for prolonged periods of time. Some pressure ulcers also develop due to pressure from a device, such as tubing required for oxygen delivery.
Pressure ulcers are painful, may lead to chronic wound development and can have a significant impact on a patient’s recovery from ill health and their quality of life. They are graded from 1 to 4 depending on their severity, with grade 4 being the most severe:
Grade Description
1 Skin is intact but appears discoloured. The area may be painful, firm, soft, warmer or cooler than adjacent tissue.
2 Partial loss of the dermis (deeper skin layer) resulting in a shallow ulcer with a pink wound bed, though it may also resemble a blister.
3Skin loss occurs throughout the entire thickness of the skin, although the underlying muscle and bone are not exposed or damaged. The ulcer appears as a cavity-like wound; the depth can vary depending on where it is located on the body.
4 The skin is severely damaged, and the underlying muscles, tendon or bone may also be visible and damaged. People with grade 4 pressure ulcers have a high risk of developing a life-threatening infection.
(National Pressure Ulcer Advisory Panel, 2014)
At UHB, pressure ulcers are split into two groups: those caused by medical devices and those that are not.
Due to very low numbers of hospital-acquired grade 3 and grade 4 ulcers at UHB, the Trust focus is on further reducing grade 2 ulcers. This in turn should help towards aiming for zero avoidable hospital acquired grade 3 and grade 4 ulcers, as grade 2 ulcers will be less likely to progress.
PerformanceThe 2016/17 reduction target agreed with Birmingham CrossCity Clinical Commissioning Group (CCG) was 125 patients with non device-related, hospital-acquired
avoidable grade 2 pressure ulcers. This was chosen as a 5% decrease on the reduction target set for 2015/16.
UHB has seen a continued decrease in the number of hospital-acquired pressure ulcers during 2016/17.
For the period April 2016 to March 2017, UHB reported 71 patients with non device-related, hospital-acquired avoidable grade 2 pressure ulcers, against the agreed reduction target of 125. This compares to 79 reported in 2015/16, and 144 reported in 2014/15. For the latest Quarter (Quarter 4 2016/17), there were only 8 patients with such ulcers.
Number of patients with grade 2 hospital-acquired, non device-related avoidable pressure ulcers, by Quarter
0
5
10
15
20
25
Q1 Q2 Q3 Q4
2016/17

8 | University Hospitals Birmingham NHS Foundation Trust | Quality Account 2016-17
Initiatives implemented in 2016/17 Î Re-introduction of the React to RED (formerly Code
RED) campaign Î Close working with therapists/Allied Health
Professionals/Keep Moving Roadshow Î Device related task and finish groups regarding Anti
Embolic Stockings Î Close Divisional working, with tissue viability nurses
attending Divisional meetings and providing education Î The pressure ulcer action group became the
Preventing Harms Group, which also receives information on patient falls and infection prevention and control
Î Differentiation between moisture lesions and pressure ulcers
Î Electronic records around repositioning Î Skin Champions study day for Health Care Assistants
(HCAs) Î Networking with Shelford Group and regional Tissue
Viability Nurses Î Targeted education campaigns Î Seating campaign and purchase of new equipment
Changes to improvement priority for 2017/18The 2017/18 target agreed with Birmingham CrossCity Clinical Commissioning Group (CCG) is to maintain current performance.
Initiatives to be implemented during 2017/18To continue to build on the improvements seen in 2016/17, to further identify any common causes or reasons behind hospital-acquired pressure ulcers and to target training and resources accordingly. Initiatives to aid improvements:
Î To improve the classification and grading of pressure ulcers across the trust through a variety of education and training programmes.
Î To improve repositioning documentation through educational campaigns and Tissue Viability Quality Audits, Back to the Floor visits by senior nursing staff and the introduction of electronic records.
Î To empower tissue viability link nurses to be confident in verifying grade 2 pressure ulcers and to complete mini RCAs (root cause analysis), initially as a pilot on Critical Care.
Î To reduce the number of Deep Tissue Injuries (DTIs) by utilising the ‘prevent purple’ campaign.
Î Update Equipment Selection Flowchart to reflect equipment available in the Trust and to better guide staff on appropriate equipment choice through education and forums.
Î Education for specific staff groups including medical staff.
Î Monitoring competency figures and timely risk assessment.
How progress will be monitored, measured and reported Î All grade 2, 3 and 4 pressure ulcers are reported via
the Trust’s incident reporting system Datix, and then reviewed by a Tissue Viability Specialist Nurse.
Î Monthly reports are submitted to the Trust’s Preventing Harms meeting, which reports to the Chief Nurse’s Care Quality Group.
Î Data on pressure ulcers also forms part of the Clinical Risk report to the Clinical Quality Monitoring Group.
Î Staff can monitor the number and severity of pressure ulcers on their ward via the Clinical Dashboard.

University Hospitals Birmingham NHS Foundation Trust | Quality Account 2016-17 | 9
Priority 2: Improve patient experience and satisfaction
The Trust measures patient experience via feedback received in a variety of ways, including local and national patient surveys, the NHS Friends and Family Test, complaints and compliments and online sources (e.g. NHS Choices). This vital feedback is used to make improvements to our services. This quality priority focuses on improving scores in our local surveys, and also takes into account national survey results and correlations with what ranks as most important to patients in giving a high rating of care.
Patient experience data from local surveysDuring 2016/17, 14,519 patient responses were received to our local inpatient survey, 941 to the Emergency Department survey, 2,122* to the outpatient survey and 2,029* responses to our discharge survey.
*postal surveys data up to February 2017
In addition, UHB usually publishes data taken from the National Inpatient Survey, run by the Picker Institute on behalf of the CQC, however publication of the 2016 survey report has been delayed and is not available at the time of writing. The results will be shown in Part 3 of this Quality Account once the report has been received by the Trust.
MethodologyThe local inpatient survey is undertaken, predominantly, utilising our bedside TV system, allowing patients to participate in surveys at their leisure. Areas that do not have the bedside TVs use either paper or computer tablets for local surveys. The Emergency Department survey is a paper-based survey, and the outpatient and discharge surveys are postal – both sent to a sample of 500 patients per month. Results of the postal surveys are given up to February 2017 as that is the latest data available at the time of compiling this report.
Improvement target for 2017/18 For 2017/18 we reviewed 2016/17 performance for the questions set for this priority. Where these achieved or maintained their target during the year, some have been replaced with new questions – but continue on our local surveys for monitoring. Others remain as a priority but with a more challenging target because they are extremely important to patients in reporting high quality care.
This improvement priority was agreed at the Trust’s Care Quality Group meeting in March 2017, which is a Chief Nurse-led sub-committee of the board, attended by clinical staff and also patient Governors to provide the patients’ perspective. Rationale for keeping, removing or adding questions was included in the report to this committee. This was based on data available at that time (February for electronic surveys, January for postal surveys).
Î Questions carried forward – targets have been carried forward from 2016/17 or new challenging targets set.
Î New questions with a 2016/17 baseline score from local surveys – existing local targets will apply or be set by adding a 5% challenge to the 2016/17 score.
Î New questions without a 2016/17 baseline – target to be set at Care Quality Group following collection of baseline data.
Historically our targets for this priority were capped at a score of 9, however it was agreed at Care Quality Group in January 2017 to exceed a score of 9 where appropriate for continued challenge and advancement of patient experience.
10 | University Hospitals Birmingham NHS Foundation Trust | Quality Account 2016-17
Res
ult
s fr
om
loca
l pat
ien
t su
rvey
sTh
is t
able
sho
ws
resu
lts
for
2015
/16
and
2016
/17
alon
g w
ith t
he s
tatu
s fo
r ea
ch q
uest
ion.
Bel
ow t
his
are
the
new
que
stio
ns a
dded
for
201
7/18
.
2015
/16
sc
ore
2016
/17
ta
rget
2016
/17
sc
ore
Stat
us
2017
/18
ta
rget
2016
/17
N
o. r
esp
on
ses
Inp
atie
nt
surv
ey
1.
Did
you
find
som
eone
on
the
hosp
ital s
taff
to t
alk
abou
t you
r wor
ries
or fe
ars?
8.5
8.8
8.8
Ach
ieve
dRe
mov
ed6
012
2.
Do
you
thin
k th
at t
he w
ard
staf
f do
all t
hey
can
to h
elp
you
rest
and
sle
ep a
t nig
ht?
8.9
99
Ach
ieve
dRe
mov
ed71
75
3.
Hav
e yo
u be
en b
othe
red
by n
oise
at n
ight
from
hos
pita
l sta
ff?
8.3
8.5
8.5
Ach
ieve
dRe
mov
ed70
79
4.
Som
etim
es in
hos
pita
l a m
embe
r of s
taff
say
s on
e th
ing
and
anot
her s
ays
som
ethi
ng q
uite
diff
eren
t. H
as t
his
happ
ened
to y
ou?
8.8
98.
8C
arry
for
war
d9.
014
34
8
5.
Dur
ing
your
tim
e in
hos
pita
l did
you
feel
wel
l loo
ked
afte
r by
hosp
ital s
taff
?n
/a9
9.5
Car
ry f
orw
ard
9.7
8785
Ou
tpat
ien
t su
rvey
*
6.
How
wou
ld y
ou ra
te t
he c
ourt
esy
of t
he re
cept
ion
staf
f dur
ing
your
tim
e in
the
O
utpa
tient
s D
epar
tmen
t?8
.99.
08.
8C
arry
for
war
d9.
020
95
7.
Did
the
sta
ff t
reat
ing
and
exam
inin
g yo
u in
trod
uce
them
selv
es?
8.8
8.9
8.8
Car
ry f
orw
ard
8.9
204
8
8.
If yo
u ha
d im
port
ant q
uest
ions
to a
sk t
he d
octo
r, di
d yo
u ge
t ans
wer
s th
at y
ou
coul
d un
ders
tand
?8
.99.
08.
9C
arry
for
war
d9.
018
92
Emer
gen
cy D
epar
tmen
t su
rvey
9.
Dur
ing
your
tim
e in
the
Em
erge
ncy
Dep
artm
ent d
id y
ou fe
el w
ell l
ooke
d af
ter b
y ho
spita
l sta
ff?
n/a
8.9
8.6
Car
ry f
orw
ard
9.0
610
10.
How
wou
ld y
ou ra
te t
he c
ourt
esy
of t
he E
mer
genc
y D
epar
tmen
t rec
eptio
n st
aff?
n/a
8.7
8.5
Car
ry f
orw
ard
9.0
576
11.
Wer
e yo
u ke
pt in
form
ed o
f wha
t was
hap
peni
ng a
t all
stag
es d
urin
g yo
ur v
isit?
n/a
8.0
7.9
Car
ry f
orw
ard
8.5
60
6
Dis
char
ge
surv
ey*
12.
Did
a m
embe
r of s
taff
tell
you
abou
t med
icat
ion
side
eff
ects
to w
atch
for w
hen
you
wen
t hom
e?5.
76.
15.
9C
arry
for
war
d6.
114
74
13.
Did
you
feel
you
wer
e in
volv
ed in
dec
ision
s ab
out g
oing
hom
e fr
om h
ospi
tal?
7.2
7.4
7.2
Car
ry f
orw
ard
7.4
184
6
*po
stal
sur
veys
– d
ata
up t
o Fe
brua
ry 2
017

University Hospitals Birmingham NHS Foundation Trust | Quality Account 2016-17 | 11
New questions to be added for 2017/18
2016/17 score
Status2017/18 target
2016/17 No. responses
Inpatient survey
If you used the call bell, was it answered in a reasonable time?
9.1NEW for 2017/18
9.5 5227
Did you get enough help to eat your meals? n/aNEW for 2017/18
To be set n/a
How progress will be monitored, measured and reported
Î This priority is measured using the local survey results as detailed in the methodology.
Î The new ‘help to eat meals’ question will be added to the local inpatient survey and a baseline set once sufficient data has been collected.
Î The target for the ‘new’ ‘help to eat meals’ question has been taken from the local catering survey, and will be added to the full inpatient local survey to maximise the number of responses.
Î The new ‘call bell’ question is already on the local inpatient survey so has a reliable baseline measure.
Î The operational Patient Experience Group (reporting to the Care Quality Group) monitors this priority.
Î Monthly exception reports to Associate Directors of
Nursing (ADNs) highlight individual wards not meeting the quality priority so that action can be taken. This report is presented to the Care Quality Group and includes a section from each ADN with actions for their division.
Î This patient experience quality priority is also reported on the Clinical Dashboard so is always available for staff to view; updated monthly.
Î Quarterly patient experience reports are provided to the Care Quality Group (summarised to the Board of Directors) and the local Clinical Commissioning Group – this includes a gap analysis on the patient experience quality priority.
Î Feedback on patient experience is also provided by members of the Patient and Carer Councils as part of the Adopt a Ward/Department visits and via Governor drop-in sessions.
Update on Patient Experience initiatives in 2016/17
Initiative planned Update
Using a more project-based approach to tackle challenging aspects of patient experience.
Ongoing From the 2015 National Inpatient Survey, three topics were chosen for projects rather than focusing on small changes to individual question scores. The topics chosen were: feeling well looked after, discharge medications and communication around operations and procedures. Early indications from preliminary data from the 2016 national survey are that this approach was successful.
Continued review and updating of the patient experience dashboard and reporting processes.
Ongoing The patient experience dashboard has been developed to include categorised free text comments aiding identification of themes and trends. New reporting has been developed for Inpatient Governor Drop Ins and Patient and Carer Council adopt-a-ward feedback.
Implement the use of patient stories as a feedback and training mechanism.
Ongoing Patient stories now used at all Patient Experience Group meetings and used in complaints and customer relations training. Developments in the use of patient stories to continue as a valuable and insightful tool.
Review of how patient experience data is monitored and used to drive improvements.
Ongoing A staff survey, initially looking at how data travels across the Trust, has been drawn up ready for implementation.
Finalisation of plans to implement an internal buggy system.
Withdrawn Based on the success of the car park buggy, a group was set up to look at the feasibility of implementing a buggy inside the hospital to help outpatients and visitors to get around. The group discovered that health and safety regulations, along with the limitations of the route that the buggy could take, meant that this was not a viable option. The group is now going to look at how internal movement could be better supported using wheelchairs.

12 | University Hospitals Birmingham NHS Foundation Trust | Quality Account 2016-17
Initiative planned Update
Scope the potential implementation of therapeutic visits from trained and approved volunteers with pets.
Ongoing Planning for this scheme is well underway.
Increase the number of guest beds to allow carers to stay overnight.
Complete Wards were asked how many guest beds they currently had and how many they needed. With the kind help of QEHB Charity 60 new guest beds were purchased.
Pilot a new ward booklet to give patients and visitors improved information.
Ongoing Planning for this is underway, and draft text has been compiled with help from members of the Patient and Carer Council (Wards).
Additional wheelchairs for patient use.
Complete With the kind support of QEHB Charity 16 additional wheelchairs for outpatient use have been provided.
Implement updated survey system on bedside TVs to include free text comments.
Complete The bedside TV surveys now allow patients to leave free text answers.
Review of complaints process to streamline and improve response time.
Ongoing Response times have improved during the year with 80%+ of all complaints responded to within 30 working days. Work continues to try to increase this further.
Refresh the Friends and Family Test in outpatients to increase response rate.
Complete A number of initiatives have taken place during the year, contributing to an increase in response rate.
Implement new learning from complaints report to share learning Trust-wide.
Complete Sharing document developed, incorporating learning from complaints, feedback, incidents, safeguarding, observations in care and learning from excellence. Distributed with Chief Executive’s Team Brief.
The Friends and Family Test Response rates and positive recommendation percentages have been closely monitored throughout 2016/17 against internal targets set and tracked against national and regional averages to benchmark how we are doing against our peers.
The Friends and Family Test (FFT) asks patients the following question:
“How likely are you to recommend our (ward/emergency department/service) to friends and family if they needed similar care or treatment?”
Patients can choose from six different responses as follows: Î Extremely likely Î Likely Î Neither likely or unlikely Î Unlikely Î Extremely Unlikely Î Don’t know
MethodologyPatients admitted as day cases, or staying overnight on an inpatient ward, were asked to complete the FFT on discharge from hospital; either on the bedside TVs, on paper or tablet. Those attending the emergency department were asked either on leaving (using a paper survey), or afterwards via an SMS text message. Outpatients are given the opportunity to answer the question whenever suits them best, either before they leave the department (paper or check in kiosk), or they can access the question online via the Trust website.
The Trust follows the national guidance for undertaking and scoring of the Friends and Family Test.
Performance March data for the FFT is not currently available, and will be included the final report if it becomes available in time.
The charts below show benchmark comparisons for the positive recommendation percentages for the Friends and Family Test for Inpatients, A&E and Outpatients.

University Hospitals Birmingham NHS Foundation Trust | Quality Account 2016-17 | 13
InpatientsDuring 2016/17 the Trust has maintained a positive recommendation rate that was above the national and West Midlands average rates.
A&EDuring 2016/17 the Trust’s positive recommendation rate has fluctuated and has remained around the regional average but below the national average. Waiting times is often cited by patients as the reason for this reduction in score.
OutpatientsDuring 2016/17 the Trust has maintained a positive recommendation rate that is significantly higher than both the national average, and the West Midlands regional average
0
10
20
30
40
50
60
70
80
90
100
Apr2016
May2016
Jun2016
Jul2016
Aug2016
Sep2016
Oct2016
Nov2016
Dec2016
Jan2017
Feb2017
Mar2017
UHB NHS Foundation Trust National average NHS England West Midlands Region
0
10
20
30
40
50
60
70
80
90
100
Apr2016
May2016
Jun2016
Jul2016
Aug2016
Sep2016
Oct2016
Nov2016
Dec2016
Jan2017
Feb2017
Mar2017
UHB NHS Foundation Trust National average NHS England West Midlands Region
0
10
20
30
40
50
60
70
80
90
100
Apr2016
May2016
Jun2016
Jul2016
Aug2016
Sep2016
Oct2016
Nov2016
Dec2016
Jan2017
Feb2017
Mar2017
UHB NHS Foundation Trust National average NHS England West Midlands Region
ComplaintsThe total number of all complaints (formal and informal) received in 2016/17 was 779, an increase of 15% on the 680 formal and informal complaints received in 2015/16. The largest increase was seen in Quarter 4 with an increase of 27% in the total number of complaints received compared to Quarter 3 2016/17.
The main subjects of all complaints received in 2016/17 related to clinical treatment (203), communication and information (129) and attitude of staff (110), matching the top three subjects from the previous year.
2014/15 2015/16 2016/17
Total number of all complaints
792 680 779
The table below compares complaints received against activity data. The number of inpatient complaints received in 2016/17 reduced compared to the previous year, whilst activity increased, resulting in a lower complaints-to-activity ratio.
There was an increase in the level of complaints and activity in the outpatient and emergency department in 2016/17, resulting in slightly increased levels of complaints to activity ratios in both areas.

14 | University Hospitals Birmingham NHS Foundation Trust | Quality Account 2016-17
Rate of all complaints to activity 2014/15 2015/16 2016/17
Inpatients
FCEs* 127,204 129,574 135,216
Complaints 429 345 327
Rate per 1000 FCEs 3.4 2.7 2.4
Outpatients
Appointments** 752,965 788,996 817,407
Complaints 271 245 331
Rate per 1000 appointments 0.4 0.3 0.4
Emergency Department
Attendances 102,054 108,463 115,226
Complaints 92 90 121
Rate per 1000 attendances 0.9 0.8 1.0* FCE = Finished Consultant Episode – which denotes the time spent by a patient under the continuous care of a consultant ** Outpatients activity data relates to fulfilled appointments only and also includes Therapies (Physiotherapy, Podiatry, Dietetics, Speech & Language Therapy and Occupational Therapy).
Learning from complaints The table below provides some examples of how the Trust has responded to complaints where serious issues have been raised, a number of complaints have been
received about the same or similar issues or for the same location, or where an individual complaint has resulted in specific learning and/or actions.
Issue Action taken
Concerns about how a patient’s diabetes was managed when an inpatient
ö Diabetes Nurse Consultant is reviewing education requirements on the ward where the patient was cared for.
ö Introduction onto wards of diabetes resource packs incorporating learning points from this case.
ö Increased provision of ketone meters into clinical areas, where required, to improve the monitoring and subsequent treatment of diabetic patients.
Poor experience of a patient with severe hearing loss when attending for cochlear implant surgery.
Group set up by deputy chief nurse to review arrangements for patients with hearing and visual impairments to try and improve all aspects of their experience.
Bereaved relatives did not receive a timely response from a consultant about their family member’s death.
Improved process introduced to ensure that concerns are followed up via an email by the medical examiner to the appropriate consultant and the bereavement sister is also informed.
Concerns raised by diabetes user group around inadequate signage to diabetes clinic
Improved signage for diabetes clinic installed.
Poorly fitting anti-embolism stocking caused scarring.
Refresher training sessions arranged for all staff on the ward around the correct measuring and fitting of anti-embolism stockings.
Latex gloves used in theatre despite patient previously advising staff of an allergy.
New process implemented whereby the booking co-ordinator will screen all patients at the time of booking to check for any allergies prior to admission.
Delay with Chemotherapy medication being delivered to the unit.
Trial of Saturday working to produce Chemotherapy for patients attending the unit on Mondays and Tuesdays. Results of trial to be audited.
Delay in reporting of CT scan. Report developed to identify urgent CT scans to help prevent delays.
More information around how learning is shared across the Trust can be found in the patient experience annual report.

University Hospitals Birmingham NHS Foundation Trust | Quality Account 2016-17 | 15
Accessible complaints processThe Trust makes every effort to ensure that our complaints process is accessible to all. Complaints can be made by telephone, by email, via our website, in writing or in person (at the PALS office). Feedback leaflets with contact details are located on every ward and department. We have an easy read complaints leaflet, which explains the process in simple terms. When we are contacted by someone who has difficulties with the process, we provide clear contact details for the local NHS complaints advocacy service, who can support the individual and make the complaint on their behalf. We have provided complaints responses in alternative formats to accommodate specific requests including large font and braille.
Serious complaintsThe Trust uses a risk matrix to assess the seriousness of every complaint on receipt. Those deemed most serious, which score either 4 or 5 for consequence on a 5 point scale, are highlighted separately across the Trust. The number of serious complaints is reported to the Chief Executive’s Advisory Group and detailed analysis of the cases and the subsequent investigation and related actions are presented to the Divisional Management Teams at their Divisional Clinical Quality Group meetings. It is the Divisional Management Teams’ responsibility to ensure that, following investigation of the complaint, appropriate actions are put in place to ensure that learning takes place and that every effort is made to prevent a recurrence of the situation or issue which triggered the complaint being considered serious.
Parliamentary and Health Service Ombudsman (PHSO): Independent review of complaints
PHSO Involvement 2014/15 2015/16 2016/17
Cases referred to PHSO by complainant for investigation 23 28 28
Cases which then required no further investigation 2 0 0
Cases which were then referred back to the Trust for further local resolution 1 0 1
Cases which were not upheld following review by the PHSO 5 6 13
Cases which were partially upheld following review by the PHSO 9 11 12
Cases which were fully upheld following review by the PHSO 0 2 1NB outcome numbers may not match the cases referred in any year as these may span different periods – e.g. cases received in one year may be finalised in another.
Compliment subcategories 2014/15 2015/16 2016/17
Nursing care 242 579 211
Friendliness of staff 142 84 90
Treatment received 1,743 1,290 1,582
Medical care 56 83 88
Other 17 24 18
Efficiency of service 104 268 275
Information provided 12 15 20
Facilities 12 6 2
Total 2,328 2,349 2,286
The total number of cases referred to the Ombudsman for assessment, agreed for investigation and ultimately upheld or partially upheld remains relatively low in proportion to the overall level of complaints received by the Trust.
Thirteen cases were upheld or partially upheld by the Ombudsman in 2016/17, the same as for the previous year. A further thirteen cases were not upheld by the Ombudsman, compared to just six last year. In every case, appropriate apologies were provided, action plans were developed where requested and the learning from the cases shared with relevant staff.
Compliments The majority of compliments are received in writing – by letter, card, email, website contact or via the Trust Patient Experience feedback leaflet, the rest are received verbally via telephone or face to face. Positive feedback is shared with staff and patients to promote and celebrate good practice as well as to boost staff morale.
UHB consistently receives considerably more compliments than it does complaints. The Trust recorded slightly fewer compliments in 2016/17 than in 2015/16. The Patient Experience team provide support and guidance to divisional staff around the collation and recording of compliments received directly to wards and departments.

16 | University Hospitals Birmingham NHS Foundation Trust | Quality Account 2016-17
Examples of compliments received during 2016/17
Month received Compliment
Apr 2016 …You treated me with gentle care when I was feeling stressful, with your gentle words and quiet ways my treatment was successful. You explained each procedure, in explicit care and detail… Best wishes and thank you.
May 2016 Having been in many wards within the QE, the domestic team on ward 622 are the best. They have lovely personalities, are efficient and proficient.
Jun 2016 My whole experience to date has been excellent. The staff are caring, thoughtful and knowledgeable. The efficiency and organisation should be set as a standard for other NHS hospitals.
Jul 2016 I am an outpatient of the Liver Clinic, all the staff, admin, nurses, doctors are all amazing. Everyone is so friendly and informative, good listeners and put you at ease…
Aug 2016 …Doctors, nurse and sisters very good, were able to translate and this was good. Students were nice and helpful. Food was nice.
Sep 2016 …To the crash team who successfully resuscitated mum on the night of the 6th July, allowing us a few more days together. We didn't get to meet you all so I don't know who in particular I need to thank!
Oct 2016 Really impressed with all of the appointment staff, especially at the Cardiology department. The technology controlling the appointments works so well… and the volunteers there to support s are great.
Nov 2016 ...Being portered up to the operating theatre was another pleasant experience and the talk before going into the theatre left me in no doubt I was in good hands...
Dec 2016 ... What fantastic staff, nothing is too much trouble, ward is spotlessly clean, food is great... Thank you from the bottom of our hearts.
Jan 2017 Everybody is very warm and caring and extremely helpful, considering I am deaf, everybody has written the information down for me.
Feb 2017 ...I was lucky enough to encounter rather a lot of amazing people over the subsequent 36 hours... A year on I remember that day and I am forever grateful to all the people who helped me... You are all amazing.
Mar 2017 The aftercare was so lovely by the nurses and sisters on duty that afternoon and also the bereavement care team, when we had to come down for the death certificates, were so helpful, caring and professional...
University Hospitals Birmingham NHS Foundation Trust | Quality Account 2016-17 | 17
Feedback received through NHS Choices, Patient Opinion and Healthwatch websitesThe Trust has a system in place to monitor feedback posted on three external websites; NHS Choices, Patient Opinion and Healthwatch. Feedback is sent to the relevant service/department manager for information and action. A response is posted to each comment received which acknowledges the comment and provides general information when appropriate. The response also promotes the Patient Advice and Liaison Service (PALS) as a mechanism for obtaining a more personalised response, or to ensure a thorough investigation into any concerns raised. Whilst there has been a further increase in the number of comments posted on each of these three websites the numbers continue to be extremely low in comparison to other methods of feedback received. The majority of feedback received via this method is extremely positive, negative comments tend to be reflective of feedback received via more direct methods for example concerns raised via PALS, complaints or locally received verbal feedback.
Initiatives to be implemented in 2017/18 Î Implement more flexible visiting times, with an
increase from 2.30pm–7.30pm to 11am–8pm Î Work with QEHB Charity to develop and implement a
Pets in Hospital scheme Î Pilot a renewed volunteer dining companions
programme Î Undertake a baseline assessment of existing and ideal
numbers and roles of volunteers to identify the Trust’s volunteering needs and build a vacancy list
Î Work with Harborne Academy on a pilot permitting younger volunteers (aged 16-17) into the Trust (currently minimum age is 18 years old)
Î Development of our patient experience collection, analysis and reporting system in conjunction with the Trust/University of Birmingham PROMs group
Î Work with the Young Persons’ Council to develop mechanisms to increase feedback from young patients aged 16–24
Î Develop a campaign to increase the number of patients reporting that their call bell was answered in a time reasonable for their needs
Î Evaluate the pilot of an accessible feedback card and put methods in place to ensure that the opportunity to provide feedback is easy and accessible to all
Priority 3: Timely and complete observations including pain assessment
BackgroundAll inpatient wards have been recording patient observations (temperature, blood pressure, oxygen saturation score, respiratory rate, pulse rate and level of consciousness) electronically since 2011. The observations are recorded within the Prescribing Information and Communication System (PICS).
When nursing staff carry out patient observations, it is important that they complete the full set of observations. This is because the electronic tool automatically triggers an early warning score called the SEWS (Standardised Early Warning System) score if a patient’s condition starts to deteriorate. This allows patients to receive appropriate clinical treatment as soon as possible.
For 2015/16 the Board of Directors chose to tighten the timeframe for completeness of observation sets to within 6 hours of admission or transfer to a ward and to include a pain assessment.
In addition, the Trust is monitoring the timeliness of analgesia (pain relief medication) following a high pain score. The pain scale now used at UHB runs from 0 (no pain at rest or movement) to 10 (worst pain possible). Whenever a patient scores 7 or above, they should be given analgesia within 30 minutes. The indicator also includes patients who are given analgesia within the 60 minutes prior to a high pain score to allow time for the medication to work.
Performance These were new indicators for 2015/16 and the initial targets were nearly achieved, so for 2016/17 the Trust decided to again set challenging and ambitious improvement targets.
Indicator 1 achieved the target in Quarter 4, and also during the five months of May to September 2016. Performance during Quarters 1 and 3 was also high – above 89%. Performance for Indicator 2 was steady throughout the year, between 74% and 76% each month, however the target of 85% was not achieved.
Performance by quarter
Indicator 1 Indicator 2
Full set of observations plus pain assessment recorded within 6 hours of
admission or transfer to a ward
Analgesia administered within 30 minutes of a high pain score
Performance 2014/15 71% 64%
Performance 2015/16 79% 76%
2016/17
Target 90% 85%
Q1 89.2% 75.3%
Q2 90.5% 74.9%
Q3 89.3% 74.7%
Q4 90.8% 74.9%
Year 89.8% 75.0%

18 | University Hospitals Birmingham NHS Foundation Trust | Quality Account 2016-17
Performance by month – Indicator 1: Complete observations and pain assessment within 6 hours
75%
80%
85%
90%
95%
100%
Apr May Jun Jul Aug Sep Oct Nov Dec Jan Feb Mar
2016/17
Performance by month – Indicator 2: Timely administration of analgesia
75%
74%
73%
72%
71%
70%
76%
77%
78%
79%
80%
Apr May Jun Jul Aug Sep Oct Nov Dec Jan Feb Mar
2016/17
Initiatives implemented in 2016/17
Î The bespoke electronic observations chart for the four Critical Care Units have been piloted and rolled out.
Î Wards performance is monitored at a divisional and Trust level – lower performing wards developed action plans to make improvements, and can be called to an Executive Care Omissions Root Cause Analysis (RCA) meeting if required.
Changes to Improvement Priority for 2017/18
Indicator 1 – as the Trust achieved the target at the end of 2016/17, the Trust has chosen to increase the target for 2017/18:
1. Full set of observations plus pain assessment recorded within 6 hours of admission or transfer to a ward: 95% by the end of the year.
Indicator 2 – as performance was steady throughout the year, meaning the target was not achieved, the Trust has chosen to keep the same target for 2017/18:
2. Analgesia administered within 30 minutes of a high pain score: 85% by the end of the year.
Initiatives to be implemented in 2017/18 Î A message is to be sent out via Team Brief, reminding
wards of the importance of timely observations and assessments, and response to a high pain score.
Î To consider bespoke indicators for the four Critical Care wards.
Î Wards performing below target for the two indicators will continue to be reviewed at the Executive Care Omissions Root Cause Analysis (RCA) meetings to identify where improvements can be made. Observations and pain assessment compliance will be monitored as part of the unannounced monthly Board of Directors’ Governance Visits to wards.
How progress will be monitored, measured and reported Î Progress will be monitored at ward, specialty and
Trust levels through the Clinical Dashboard and other reporting tools. The Clinical Dashboard allows staff to compare their ward performance to the Trust as a whole, as well as seeing detailed data about which of the six observations or pain assessment were missed.
Î Performance will continue to be measured using PICS data from the electronic observation charts.
Î Progress will be reported monthly to the Clinical Quality Monitoring Group and the Board of Directors in the performance report. Performance will continue to be publicly reported through the quarterly Quality Report updates on the Trust’s website.

University Hospitals Birmingham NHS Foundation Trust | Quality Account 2016-17 | 19
Priority 4: Reduce medication errors (missed doses)
BackgroundSince April 2009, the Trust has focused on reducing the percentage of drug doses prescribed but not recorded as administered (omitted, or missed) to patients on the Prescribing Information and Communication System (PICS).
The most significant improvements occurred when the Trust began reporting missed doses data on the Clinical Dashboard in August 2009 and when the Executive Care Omissions Root Cause Analysis (RCA) meetings started at the end of March 2010.
The Trust has chosen to focus on maintaining performance for missed antibiotics and reducing non-antibiotic missed doses in the absence of a national consensus on what constitutes an expected level of drug omissions.
It is important to remember that some drug doses are appropriately missed due to the patient’s condition at the time, and when a patient refuses a drug this is also
recorded as a missed dose. The Trust has decided to record patient refusals as missed doses, as it is important for the staff looking after the patient to encourage them to take the medication, and to consider the reasons for refusal and whether a different medication would be more appropriate.
Performance In the 2015/16 Quality Report, the Trust committed to maintaining performance for missed antibiotics at around 4.0% – performance during 2016/17 was around this mark (July 16 achieved 3.68%), however UHB has ended the year at 4.1%, slightly outside the target.
The Trust was aiming to reduce the percentage of missed non-antibiotics to 10% in 2016/17, however this has not been achieved. The best performance was in June 16 (10.1%), however overall performance for the year was 10.6% – very similar to the performance for the last two years of 10.5%.
Percentage of doses not give (missed doses)
6%
4%
2%
0%
8%
10%
12%
Apr 2016 May 2016 Jun 2016 Jul 2016 Aug 2016 Sep 2016 Oct 2016 Nov 2016 Dec 2016 Jan 2017 Feb 2017 Mar 2017
AntibioticsNon-antibiotics
Initiatives implemented during 2016/17 and learning from missed doses
Î New ‘Abloy’ locks are being fitted to drug cupboards in wards across the Trust. These allow all members of nursing staff on a shift to unlock a drug cupboard, rather than having one set of keys for the whole ward. This reduces the time spent by staff looking for the keys and reduces delays in administration of medications.
Î An observational audit was carried out during in late 2016 to review practice around missed doses, as part of this Pharmacy managers reviewed all missed doses that were due to the medication being out of stock.
Î Nursing staff have been reminded that they have the ability to pause certain drugs until the prescription can be reviewed by a doctor.
Î Various updates have been made to PICS, including ö a new ordering system for wards to request
medications from Pharmacy ö nurses can now mark a dose as ‘not administered’
(missed) without it automatically generating a request to Pharmacy. This can be used when the
nurse knows that the medication has already been ordered, reducing duplication of Pharmacy requests
ö improving what is recorded against due doses between the time that a prescription is suggested (e.g.) by a pharmacist, and the time when it is written by the doctor
ö a change to the prescription screen for certain medications to ensure prescriptions have the correct duration for each patient
Î A report which displays missed doses due to medication being intermittently out of stock is used to identify cases for review at the Executive Care Omissions RCA meetings.
Î Review of missed doses for the Executive Care Omissions RCA group has led to certain drugs, e.g. ones used to manage Parkinson’s disease, being stocked in the emergency drug cupboards which ward staff can access when the medication is not available on their ward.
Î Following one Executive Care Omissions RCA case,

20 | University Hospitals Birmingham NHS Foundation Trust | Quality Account 2016-17
the ward manager has reminded staff how to use the stock locator feature in PICS, and to escalate any missed doses to the Nurse in Charge. The ward have also started a daily review of all missed doses in PICS to ensure they have been addressed and escalated where appropriate.
Î Following another Executive Care Omissions RCA case, staff were reminded to ensure that patients’ medications were transferred with the patient when the patient moves to another ward.
Changes to Improvement Priority for 2017/18The Trust has chosen to continue its focus on maintaining performance for missed doses of antibiotics and reducing missed doses of non-antibiotics in the absence of a national consensus on what constitutes an expected level of drug omissions.
As the targets were not achieved for 2016/17, the Trust has decided to keep the same targets for 2017/18: Î missed doses of antibiotics to be 4% or less by the
end of 2017/18 Î missed doses of non-antibiotic to be 10% or less by
the end of 2017/18.
Initiatives to be implemented in 2017/18 Î Publish a Practice Development Team “nil by mouth”
mythbuster or practice update, to be circulated to all relevant staff
Î Identify which medicines require exact timings for administration
Î To consider new reports to identify types and patterns of missed doses across the Trust.
Î Individual cases will continue to be selected for further review at the Executive Care Omissions RCA meetings.
Î The Corporate Nursing team and Pharmacy will continue work together to identify where improvement actions should be directed to try to reduce missed doses.
How progress will be monitored, measured and reported Î Progress will continue to be measured at ward,
specialty, divisional and Trust levels using information recorded in the Prescribing Information and Communication System (PICS).
Î Data on missed drug doses is available to clinical staff via the Clinical Dashboard and includes a breakdown of the most commonly missed drugs and the most common reasons recorded for doses being missed. This is also monitored at divisional, specialty and ward levels.
Î Performance will continue to be reported to the Chief Executive’s Advisory Group, the Chief Operating Officer’s Group and the Board of Directors each month to ensure appropriate actions are taken.
Î Progress will be publicly reported in the quarterly Quality Report updates published on the Trust’s quality web pages. Performance for missed doses by specialty will continue to be provided to patients and the public on the mystay@QEHB website.

University Hospitals Birmingham NHS Foundation Trust | Quality Account 2016-17 | 21
Priority 5: Infection prevention and control (to be removed for 2017/18)
Performance
MRSA Bacteraemia The national objective for all Trusts in England in 2016/17 was to have zero avoidable MRSA bacteraemia. During 2016/17, there were four MRSA bacteraemias apportioned to UHB.
All MRSA bacteraemias are subject to a post infection review (PIR) by the Trust in conjunction with the Clinical Commissioning Group. MRSA bacteraemias are then apportioned to UHB, the Clinical Commissioning Group
or a third party organisation, based on where the main lapses in care occurred. Trust-apportioned MRSA bacteraemias are also subject to additional review at the Trust’s Executive Care Omissions Root Cause Analysis meetings chaired by the Chief Executive.
The table below shows the Trust-apportioned cases reported to Public Health England for the past three financial years.
Time Period 2013/14 2014/15 2015/162016/17
Q1 Q2 Q3 Q4 Total
Number of cases 5 6 8 1 2 0 1 4
Agreed trajectory 0 0 0 0
Clostridium difficile Infection (CDI)The Trust’s annual agreed trajectory is a total of 63* cases during 2016/17, although NHS Improvement (NHSI) and the local Clinical Commissioning Group (CCG) measure the Trust against lapses in care. A lapse in care means that correct processes were not fully adhered to, and therefore the Trust had not done everything it could to try to prevent a C. difficile infection. The Trust uses a post infection review tool with the local Clinical Commissioning Group to identify whether there were any lapses in care which the Trust can learn from.
UHB reported 92 cases in total during 2016/17, of which 31** were deemed to have lapses in care.
The table overleaf shows the total Trust-apportioned cases reported to Public Health England for the past three financial years, and how many of these were deemed to be avoidable.

22 | University Hospitals Birmingham NHS Foundation Trust | Quality Account 2016-17
Initiatives implemented in 2016/17 Î Deep cleans of selected wards, in particular wards
that have had a high number of CDI. Î Strict attention to hand hygiene and use of personal
protective equipment (PPE). Î Increased compliance with MRSA screening before
admission, on admission and for long stay patients. Î Ensuring appropriate antimicrobial use, to optimise
patient outcomes and to reduce the risk of adverse events.
Î Infection prevention and control nurses are available seven days per week to advise and support staff
Î Ensure post infection review investigations are completed and lessons learnt are fed back throughout the Trust.
Changes to Improvement Priority for 2017/18 Î The Governors and Board of Directors have agreed to
remove this Priority for 2017/18, as data is presented elsewhere in the Quality Report (see part 3.1), and performance is widely monitored and reported both internally at the Trust and to other external bodies.
How progress will be monitored, measured and reportedThis priority is to be removed from the Quality Account, however monitoring and reporting will continue as before: Î The number of cases of MRSA bacteraemia and CDI
will be submitted monthly to Public Health England and measured against the agreed trajectories.
Î Performance will be monitored via the Clinical Dashboard. Performance data will be discussed monthly at the Board of Directors, Chief Executive’s Advisory Group and Infection Prevention and Control Group meetings.
Î Any death where an MRSA bacteraemia or CDI is recorded on part one of the death certificate will continue to be reported as serious incidents (SIs) to Birmingham CrossCity Clinical Commissioning Group (CCG).
Î Post infection review and root cause analysis will continue to be undertaken for all MRSA bacteraemia and CDI cases.
Î Progress against the Trust Infection Prevention and Control delivery plan will be monitored by the Infection Prevention and Control Group and reported to the Board of Directors via the Patient Care Quality Reports and the Infection Prevention and Control Annual Report. Progress will also be shared with Commissioners.
Time Period 2013/14 2014/15 2015/162016/17
Q1 Q2 Q3 Q4 Total
Number of Trust-apportioned cases
80 66 66 24 23 24 21 92
Cases with lapses in care 16 17 24 13 9 6 3** 31**
Agreed trajectory 56 67 63 63** unless 17.6 per 100,000 bed days is higher – which equates to about 70 cases for 2016/17 ** typing results awaited for 4 cases

University Hospitals Birmingham NHS Foundation Trust | Quality Account 2016-17 | 23
Priority 5 – Reducing harm from falls (New for 2017/18)
This quality improvement priority was proposed by the Council of Governors and approved by the Board of Directors.
BackgroundInpatient falls are common and remain a great challenge for the NHS. Falls in hospital are the most common reported patient safety Incident, with more than 240,000 reported in acute hospitals and Mental Health trusts in England and Wales every year (Royal College of Physicians, National Audit of Inpatient Falls, 2015). About 30% of people 65 years of age or older have a fall each year, increasing to 50% in people 80 years of age or older (National Institute of Health and Clinical Excellence – NICE).
All falls can impact on quality of life, they can cause patients distress, pain, injury, prolonged hospitalisation and a greater risk of death due to underlying ill health. Falls can result in loss of confidence and independence which can result in patients going into long term care. Falling also affects the family members and carers of people who fall.
When a fall occurs at UHB, the staff looking after the patient submit an incident form via Datix, the Trust’s incident reporting system. All falls incidents are reviewed by the Trust’s Falls Team, a team of clinical nurse specialists. The lead for the area where the fall happened, usually the Senior Sister/Charge Nurse, investigates the fall and reports on the outcome of the fall, and whether there is any learning or if any changes in practice/policy need to be made.
Most falls do not result in any harm to the patient. Any falls that result in moderate or severe harm undergo an RCA (root cause analysis) process to identify any issues or contributory factors. Falls resulting in specific harm, e.g. a fractured neck of femur (broken hip), are also reported to the local Clinical Commissioning Group.
Falls preventionAll inpatients should undergo a Falls Assessment on admission/transfer to a ward or if their clinical condition changes. If a patient is found to be at risk at of falls,
staff will identify the risk factors and the precautions that can be taken to reduce these risks. These may include a medication review by pharmacy staff, provision of good-fitting footwear, ensuring chairs are the correct height and width for the patient, or moving the patient to a height-adjustable bed.
The Falls Team also receive information on patients who have fallen more than once during their hospital stay. These patients are reviewed, taking account of mobility, medication, continence and altered cognition. The Falls Team will make suitable recommendations to the ward staff around intervention and prevention of further falls.
The Falls Team provide training on falls assessment, prevention and management to ward staff, junior doctors and students.
PerformanceThe Trust has chosen to measure ‘percentage of falls resulting in harm’.
While staff take precautions to prevent falls from occurring, it is not possible to prevent all falls – therefore it is also important in minimise the harm that occurs due to falls.
Data for the last two years is presented below.
Year Quarter Percentage of falls with harm
2015/16 Q1 20.2%
Q2 19.6%
Q3 19.5%
Q4 13.6%
Year 18.1%
2016/17 Q1 18.1%
Q2 18.9%
Q3 17.4%
Q4 15.3%
Year 17.4%
Percentage of all falls that result in harm
10%
5%
0%
15%
20%
25%
Q1 2015/16 Q2 2015/16 Q3 2015/16 Q4 2015/16 Q1 2016/17 Q2 2016/17 Q3 2016/17 Q4 2016/17
Linear (%) falls with harm% falls with harm
24 | University Hospitals Birmingham NHS Foundation Trust | Quality Account 2016-17
Overall, the trend has been that the percentage of falls with harm has been decreasing since Quarter 1 2015/16
– this is shown by the trendline in the graph above.
The Trust has decided to set a target of 16.5% by the end of 2017/18 – this is a 5% reduction on the 2016/17 result.
Initiatives to be implemented during 2017/18 Î Work with Divisions on their plans for 2017/18 Î Continue providing Falls training to all Divisions on
their mandatory training days and also FY1 (junior doctor) training induction days.
Î Working with Lead Nurse for Standards to devise a new policy, procedure and guidelines.
Î Participate in the Royal College of Physicians’ National Audit of Inpatient Falls in May 2017, led by a Consultant in Geriatric Medicine
How progress will be monitored, measured and reported Î Data on falls is presented to the monthly Trust
Preventing Harm group, which reports to the Chief Nurse’s Care Quality Group. Data on falls is also provided to the Medical Director’s monthly Clinical Quality Monitoring Group.
Î Ward-level and trust-level data on falls is available to clinical staff via the Clinical Dashboard.
Î Falls with specific outcomes, e.g. a fractured neck of femur (broken hip), are reported to the local Clinical Commissioning Group.
Î Progress will be publicly reported in the quarterly Quality Report updates published on the Trust’s quality web pages.

University Hospitals Birmingham NHS Foundation Trust | Quality Account 2016-17 | 25
Priority 6 – Timely treatment for sepsis in the emergency department (New for 2017/18)
This quality improvement priority was proposed by the Clinical Quality Monitoring Group, agreed by the Council of Governors and approved by the Board of Directors.
BackgroundSepsis is a potentially life-threatening condition which is the result of a bacterial infection in the blood. It affects an estimated 260,000 people per year in the UK and is a significant cause of preventable mortality. Approximately 44,000 people die each year as a result of sepsis – a quarter of which are avoidable.
Although there are certain groups in whom sepsis is more common – the very young and very old, people with multiple co-morbidities, people with impaired immunity and pregnant women – it can occur in anybody, regardless of their age or health status.
Though sepsis is common, it is poorly addressed. It is important to understand that if sepsis is recognised early and appropriately managed it is treatable. However, if recognition is delayed and appropriate treatment not instituted (usually oxygen, intravenous fluids and antibiotics), significant harm or even death can occur.
Sepsis has been on the national agenda as a high priority area for the Commissioning for Quality and Innovation (CQUIN) system. In 2016/17 certain trusts had a key target to implement systematic screening for sepsis of appropriate patients and where sepsis is identified, to provide timely and appropriate treatment and review. This CQUIN has been extended in the 2017–19 plan, which UHB is participating in.
The Trust intranet pages have a library of information on recognising the symptoms of sepsis, screening patients and treating sepsis – these pages are available for all staff to view and have been promoted by the trust Communications team.
The Trust’s aim for 2017/18 is to improve the early recognition and management of patients with sepsis.
PerformanceFor this Quality Priority, UHB has chosen to base measurement on one of the indicators in the CQUIN process – “Timely treatment for sepsis in emergency departments”. This will be measured by calculating the time between diagnosis of sepsis and first dose of IV (intravenous) antibiotic. To do this, the Emergency Department (ED) will need the PICS (Prescribing Information and Communication System) in place, in order to capture the exact times of diagnosis and drug administration.
There is a plan to implement PICS in the ED with initial testing to begin in May 2017. Once PICS is implemented in ED, data will be collected and then used to set a baseline and an improvement target.
Initiatives to be implemented during 2017/18A new sepsis screening tool is to be rolled out across the trust, to help staff quickly identify patients who are at risk, or who have developed sepsis. It can be used for patients who have attended ED or have just been admitted to a ward, as well as patients who are already in hospital. As well as helping staff to identify patients who may have sepsis, it provides clear instruction on how to treat them and what further tests are required.
‘THINK SEPSIS’ is a national campaign aiming to raise awareness of sepsis. In April 2017, UHB held a Sepsis Awareness week, to raise awareness of the THINK SEPSIS campaign and to provide information and advice of how to recognise the symptoms, how to screen and how to treat red flag sepsis. On the first day there was a stall with information and a presentation from Dr Ron Daniels BEM, Chief Executive of the UK Sepsis Trust and Global Sepsis Alliance, and also Clinical Advisor (Sepsis) to NHS England. On the following days a multi-disciplinary Sepsis Team visited wards across the hospital site.
How progress will be monitored, measured and reported Î Once PICS is implemented in the Emergency
Department, data will be collected and used to set a baseline and improvement target.
Î Progress will be publicly reported in the quarterly Quality Account updates published on the Trust’s quality web pages.
Î Performance will be reported to the Clinical Quality Monitoring Group as part of the quarterly Quality Account update reports.
26 | University Hospitals Birmingham NHS Foundation Trust | Quality Account 2016-17
2.2 Statements of assurance from the Board of Directors
2.2.1 Information on the review of servicesDuring 2016/17 the University Hospitals Birmingham NHS Foundation Trust* provided and/or sub-contracted 63 relevant health services.
The Trust has reviewed all the data available to them on the quality of care in 63 of these relevant health services.**
The income generated by the relevant health services reviewed in 2016/17 represents 100 per cent of the total income generated from the provision of relevant health services by the Trust for 2016/17.
*University Hospitals Birmingham NHS Foundation Trust will be referred to as the Trust/UHB in the rest of the report.
**The Trust has appropriately reviewed the data available on the quality of care for all its services. Due to the sheer volume of electronic data the Trust holds in various information systems, this means that UHB uses automated systems and processes to prioritise which data on the quality of care should be reviewed and reported on.
Data is reviewed and acted upon by clinical and managerial staff at specialty, divisional and Trust levels by various groups including the Clinical Quality Monitoring Group chaired by the Executive Medical Director.
2.2.2 Information on participation in clinical audits and national confidential enquiriesDuring 2016/17 44 national clinical audits and 6 national confidential enquiries covered relevant health services that UHB provides. During that period UHB participated in 92% (36 of 39) national clinical audits and 83% (5 of 6) national confidential enquiries of the national clinical audits and national confidential enquiries which it was eligible to participate in.
The national clinical audits and national confidential enquiries that UHB was eligible to participate in during 2016/17 are as follows: (see tables below).
The national clinical audits and national confidential enquiries that UHB participated in during 2016/17 are as follows: (see tables below).
The national clinical audits and national confidential enquiries that UHB participated in, and for which data collection was completed during 2016/17, are listed below alongside the number of cases submitted to each audit or enquiry as a percentage of the number of registered cases required by the terms of that audit or enquiry.

University Hospitals Birmingham NHS Foundation Trust | Quality Account 2016-17 | 27
National Clinical Audits
National Audit UHB eligible to participate inUHB participation
2016/17Percentage of required
number of cases submitted
Acute Coronary Syndrome or Acute Myocardial Infarction Yes 100%
Adult Asthma Yes 100%
Adult Cardiac Surgery Yes 100%
Asthma (paediatric and adult) care in emergency departments Yes 100%
BAETS – Endocrine and Thyroid National Audit Yes 100%
Cardiac Rhythm Management Yes <80%
Congenital Heart Disease Yes 99.7%
Coronary Angioplasty/National Audit of Percutaneous Coronary Interventions Yes 100%
Critical Care Case Mix Programme (ICNARC) Yes 100%
Head and Neck Cancer Audit Yes 100%
Inflammatory Bowel Disease programme Yes 100%* Historical Data – upload only: new registry not commenced collection
Learning Disability Mortality Review Programme (LeDeR Programme) No Data collection not fully commenced at time of writing.
National Bowel Cancer Audit Yes 66%
National Cardiac Arrest Audit (NCAA) No 0%
National Chronic Obstructive Pulmonary Disease (COPD) Audit programme Yes Data collection not fully commenced at time of writing.
National Comparative Audit of Blood Transfusion – Audit of Patient Blood Management in Scheduled Surgery
Yes 100%
National Diabetes Audit No 0%
National Emergency Laparotomy Audit Yes 61%
National Heart Failure Audit Yes 69%
National Hip Fracture Audit Yes 86.9%
National Inpatient Audit (Diabetes) Yes 100%
National Joint Registry (NJR) Yes 100%
National Lung Cancer Audit Yes 100%
National Neurosurgery Audit Programme Yes 100%
National Ophthalmology Audit Yes 100%
National Prostate Cancer Audit Yes >100%
National Vascular Registry Yes 96%
Nephrectomy audit Yes 100%
Oesophago-Gastric Cancer Audit Yes 41–50%
Percutaneous Nephrolithotomy (PCNL) Yes 100%
Radical Prostatectomy Audit Yes 100%
Renal Replacement Therapy (Renal Registry) Yes 100%
Rheumatoid and Early Inflammatory Arthritis Yes 100%
Sentinel Stroke National Audit programme Yes 100%
Severe Sepsis and Septic Shock – care in emergency departments Yes 100%
Stress Urinary Incontinence Audit Yes 100%
TARN – Major Trauma Audit Yes 100%
Emergency Oxygen Yes 100%
Use of blood in Haematology Yes 100%

28 | University Hospitals Birmingham NHS Foundation Trust | Quality Account 2016-17
National Confidential Enquiries (NCEPOD)
National Confidential Enquiries (NCEPOD)UHB participation
2016/17Percentage of required
number of cases submitted
Mental Health Yes 100%
Acute Pancreatitis Yes 100%
Acute Non Invasive Ventilation Yes 100%
Chronic Neurodisability Yes 100%
Young People’s Mental Health No Insufficient cases and available information to participate
Cancer In Children, Teens and Young Adults Yes Active study – Ongoing
Percentages given are the latest available figures.
The reports of 14 national clinical audits were reviewed by the provider in 2016/17 and UHB intends to take the following actions to improve the quality of healthcare provided: (see separate clinical audit appendix published on the Quality web pages: http://www.uhb.nhs.uk/quality.htm).
The reports of 255 local clinical audits were reviewed by the provider in 2016/17 and UHB intends to take the following actions to improve the quality of healthcare provided (see separate clinical audit appendix published on the Quality web pages: http://www.uhb.nhs.uk/quality.htm).
At UHB a wide range of local clinical audits are undertaken. This includes Trust-wide audits and specialty-specific audits that reflect local interests and priorities. A total of 809 clinical audits were registered with UHB’s clinical audit team during 2016/17. Of these audits, 255 were completed during the financial year (see separate clinical audit appendix published on the Quality web pages: http://www.uhb.nhs.uk/quality.htm)
2.2.3 Information on participation in clinical research The number of patients receiving relevant health services provided or sub-contracted by UHB in 2016/17 that were recruited during that period to participate in research approved by a research ethics committee was:
NIHR portfolio studies 5,190
Non-NIHR portfolio studies 2,368
Total 7,558*
*Data only available up to January 2017 (it takes 2–3 months for UKCRN to upload UKCRN patient recruitment numbers)
The total figure is based on all research studies that were approved during 2016/17 (NIHR: National Institute for Health Research).
The table below shows the number of clinical research projects registered with the Trust’s Research and Development (R&D) Team during the past three financial years. The number of studies which were abandoned is also shown for completeness. The main reason for studies being abandoned is that not enough patients were recruited due to the study criteria or patients choosing not to get involved.
Reporting period 2013/14 2014/15 2015/16 2016/17
Total number of projects registered with R&D 306 307 361 266
Out of the total number of projects registered, the number of studies which were abandoned
39 56 70 115
Trust total patient recruitment 10,778 11,400 8,493** 7,558*
*Data only available up to January 2017 (it takes 2-3 months for UKCRN to upload UKCRN patient recruitment numbers) **This figure has been updated since the 2015/16 Quality Account, as the full year’s data is now available.

University Hospitals Birmingham NHS Foundation Trust | Quality Account 2016-17 | 29
The table below shows the number of projects registered in 2016/17, by specialty:
Specialty No. of projects registered
Non-Specific 26
Anaesthetics 4
Burns & Plastics 5
Cardiac Medicine 1
Cardiac Surgery 1
Cardiology 15
Clinical Haematology 4
Clinical Immunology 2
Critical Care 10
Dermatology 3
Diabetes 4
Endocrinology 17
ENT 7
General Surgery 5
Genito-Urinary Medicine 6
Geriatric Medicine 1
GI Medicine 10
Haematology 10
Histopathology 1
HIV 1
Imaging 1
ITU 3
Liver Medicine 21
Liver Surgery 4
Lung Investigation Unit 3
Microbiology 5
Neurology 15
Neuroradiology 3
Neurosurgery 4
Oncology 36
Ophthalmology 6
Pain Services 2
Palliative Care 1
Renal Medicine 4
Renal Surgery 3
Respiratory Medicine 5
Rheumatology 6
Stroke Services 3
Therapy Services 1
Trauma 2
Urology 4
Vascular Surgery 1
Total 266
Examples of research at UHB having an impact on patient careA joint study with the University of Birmingham is looking into treatment of head and neck cancer, specifically drugs that can be given alongside chemotherapy and radiotherapy, as well as trialling different regimens.
UHB is also involved in a study that has established a new cancer prevention network for colitis-associated dysplasia (CAD), which is looking at the impact that optimised surveillance has on organ preserving treatment. Current treatment of CAD requires radical panproctocolectomy – removal of the large bowel. An international consortium has been launched to support this organ preserving initiative with industry collaboration.
The sexual health research team is based within the Umbrella sexual health partnership at UHB which has regional coverage and operates eight walk-in satellite clinics across the West Midlands. Research activity has expanded to cover these clinics and has provided research opportunities and trial recruitment for the first time in Boots in Birmingham city centre and Solihull, and the Erdington Health & Wellbeing Walk-in Centre.
Working with industry means that UHB patients have been able to receive new treatments at an exceptionally early stage of trial and drug development, for example: PRELUDE – a rare neuroendocrine oncology trial cancer study; PIPEFLEX – a neuro-interventional study with flow diverter in intracranial brain aneurysms; WILSONS
– a neuro-hepatology trial in this rare disease and GAMMACORE – an interventional migraine study for which UHB was also the top recruiting UK site.
2.2.4 Information on the use of the Commissioning for Quality and Innovation (CQUIN) payment frameworkA proportion of UHB income in 2016/17 was conditional on achieving quality improvement and innovation goals agreed between UHB and any person or body they entered into a contract, agreement or arrangement with for the provision of relevant health services, through the Commissioning for Quality and Innovation payment framework.
Further details of the agreed goals for 2016/17 and for the following 12-month period are available electronically at www.uhb.nhs.uk/quality-reports.htm
The amount of UHB income in 2016/17 which was conditional upon achieving quality improvement and innovation goals was £12.3m.* Final payment for 2016/17 will not be known until June 2017.
* This represents the amount of income achievable based on the contract plans for NHS England and West Midlands CCGs. It isn’t a precise figure for the following reasons;
Î CQUIN would also be payable on any over-performance against these contracts
Î CQUIN is also payable on out of area contracts Î A provision has been made in the accounts for non-delivery of some
CQUINS Î CQUIN adjustments will also be applied for any adjustments made to
the final outturn positions agreed with commissioners for 16/17.

30 | University Hospitals Birmingham NHS Foundation Trust | Quality Account 2016-17
UHB income in 2015/16 was not conditional on achieving quality improvement and innovation goals through the Commissioning for Quality and Innovation payment framework because the Trust was paid by commissioners based on the Default Rollover Tariff in 2015/16 and therefore was not eligible for CQUIN funding.
2.2.5 Information relating to registration with the Care Quality Commission (CQC) and special reviews/investigations UHB is required to register with the Care Quality Commission and its current registration status is registered without compliance conditions. UHB has the following conditions on registration: the regulated activities UHB has registered for may only be undertaken at Queen Elizabeth Medical Centre.
The Care Quality Commission has not taken enforcement action against UHB during 2016/17.
UHB has not participated in special reviews or investigations by the CQC during 2016/17.
Following the Care Quality Commission (CQC)’s focussed visit in December 2015 to review Cardiac Surgical Services, the CQC placed two conditions on UHB’s registration – to provide outcome and performance data on a weekly basis and to commission an external review. UHB submitted the data every week as requested, and a two-day external review was conducted in February/March 2016. In May 2016 the CQC then wrote to UHB to remove the conditions from registration, and to inform the Trust that data and updates would only be required on a quarterly basis. The Cardiac Surgery Quality Improvement Programme, which was commenced prior to the CQC visit, continues and the majority of the actions identified from the CQC report and subsequent external visit have been completed. In November 2016, the Royal College of Surgeons conducted a review which recognised the progress made by the service. Reports on progress against the project plan continue to be provided to the Cardiac Surgery Project Board, while performance data is reviewed at weekly meetings chaired by Executive Directors.
Information on visits conducted by Birmingham Cross City Commissioning Group is provided in the table below.

University Hospitals Birmingham NHS Foundation Trust | Quality Account 2016-17 | 31
Insp
ecti
on
s/vi
sits
un
der
take
n b
y B
irm
ing
ham
Cro
ss C
ity
Clin
ical
Co
mm
issi
on
ing
Gro
up
Dat
eTy
pe
of
insp
ecti
on
Ou
tco
me
Act
ion
s ta
ken
13 J
uly
2016
An
unan
noun
ced
visi
t w
as
cond
ucte
d on
war
d 30
3.O
vera
ll th
e ve
rbal
fee
dbac
k w
as v
ery
posi
tive.
W
e ar
e aw
aitin
g th
e fin
al r
epor
t.N
/A
21 J
uly
2016
An
unan
noun
ced
visi
t w
as
cond
ucte
d on
war
ds 7
27
and
728
.
Ove
rall
the
verb
al f
eedb
ack
was
ver
y po
sitiv
e.
We
are
awai
ting
the
final
rep
ort.
N/A
17 O
ctob
er
2016
An
unan
noun
ced
visi
t w
as
cond
ucte
d on
war
d 51
8 w
hich
fo
cuss
ed o
n In
fect
ion
Con
trol
.
The
initi
al f
eedb
ack
was
tha
t th
e w
ard
was
tid
y an
d un
clut
tere
d. T
here
wer
e so
me
area
s id
entifi
ed d
urin
g th
e vi
sit
whi
ch n
eed
atte
ntio
n su
ch a
s a
cont
inue
d fo
cus
on e
quip
men
t cl
eani
ng a
nd in
fect
ion
prev
entio
n pr
actic
es
All
iden
tified
act
ions
hav
e no
w b
een
rect
ified
: equ
ipm
ent
clea
ning
pr
ogra
mm
e em
bedd
ed, T
rust
wid
e In
fect
ion
Prev
entio
n an
d C
ontr
ol
actio
n pl
ans
have
bee
n m
odifi
ed a
nd d
ispl
ayed
to
fit in
divi
dual
war
d pr
ofile
s, c
linic
al w
aste
and
dom
estic
was
te b
ins
have
bee
n ap
prop
riate
ly
plac
ed, d
aily
mon
itorin
g of
all
bays
and
sin
gle
room
s to
ens
ure
alco
hol
hand
rub
is a
vaila
ble.
21 O
ctob
er
2016
An
unan
noun
ced
insp
ectio
n w
as c
ondu
cted
on
Edgb
asto
n W
ard
and
War
d W
est
2 by
the
sa
fegu
ardi
ng t
eam
.
Ther
e w
ere
no s
peci
fic r
equi
rem
ents
or
reco
mm
enda
tions
ar
isin
g ou
t of
the
vis
it ot
her
than
thr
ee p
oint
s fo
r co
nsid
erat
ion
:
1.
“Thi
s is
me”
– c
ould
be
utili
sed
bett
er, t
he c
onte
nt w
as
rath
er li
ght.
2.
Pote
ntia
l for
dis
cuss
ion
of s
afeg
uard
ing
/men
tal c
apac
ity
issu
es t
o be
bui
lt in
to h
ando
vers
to
embe
d le
arni
ng a
nd
unde
rsta
ndin
g.3.
C
are
plan
s sp
ecifi
cally
det
ailin
g D
OLs
for
pat
ient
s w
ould
be
ben
efici
al, w
ith ‘D
os a
nd D
on’t
s’ a
nd s
pelli
ng o
ut w
hat
‘leas
t re
stric
tive
prac
tice’
look
s lik
e.
Feed
back
was
sha
red
with
the
war
ds in
volv
ed.
5 Dec
embe
r 20
16
An
unan
noun
ced
visi
t w
as
cond
ucte
d to
the
Em
erge
ncy
Dep
artm
ent
with
an
emph
asis
on
qua
lity,
saf
ety
and
patie
nt
expe
rienc
e.
Ther
e w
ere
no im
med
iate
con
cern
s ra
ised
and
no
rem
edia
l ac
tions
to
be t
aken
. We
are
awai
ting
the
final
rep
ort.
N/A

32 | University Hospitals Birmingham NHS Foundation Trust | Quality Account 2016-17
Car
e Q
ual
ity
Co
mm
issi
on
: In
spec
tio
n R
atin
gs
Gri
d
The
CQ
C c
arrie
d ou
t a
focu
sed
insp
ectio
n of
the
Tru
st in
Jan
uary
201
5. A
s a
resu
lt of
the
insp
ectio
n th
e Tr
ust
was
ove
rall
rate
d as
‘goo
d’ a
nd f
ull d
etai
ls o
f th
e Tr
usts
rat
ings
are
bel
ow:
Do
mai
nSa
feEf
fect
ive
Car
ing
Res
po
nsi
veW
ell-
led
Ove
rall
Urg
ent
and
Emer
genc
y Se
rvic
esR
equ
ires
Im
pro
vem
ent
Req
uir
es
Imp
rove
men
tG
oo
dO
uts
tan
din
gG
oo
dG
oo
d
Med
ical
Car
eG
oo
dG
oo
dG
oo
dG
oo
dG
oo
dG
oo
d
Surg
ery
Go
od
Ou
tsta
nd
ing
Go
od
Req
uir
es
Imp
rove
men
tG
oo
dG
oo
d
Crit
ical
Car
eG
oo
dO
uts
tan
din
gO
uts
tan
din
gO
uts
tan
din
gO
uts
tan
din
gO
uts
tan
din
g
End
of L
ife C
are
Go
od
Go
od
Go
od
Ou
tsta
nd
ing
Go
od
Go
od
Out
patie
nt a
nd d
iagn
ostic
im
agin
gG
oo
dN
/AG
oo
dR
equ
ires
Im
pro
vem
ent
Req
uir
es
Imp
rove
men
tR
equ
ires
Im
pro
vem
ent
Ove
rall
Trus
tG
oo
dG
oo
dG
oo
dG
oo
dO
uts
tan
din
gG
oo
d
For
the
area
s w
hich
wer
e ra
ted
as ‘r
equi
res
impr
ovem
ent’
the
CQ
C p
rovi
ded
reco
mm
enda
tions
the
Tru
st m
ust
take
to
impr
ove.
An
actio
n pl
an w
as d
evel
oped
as
a re
sult
of a
nd is
mon
itore
d by
the
Boa
rd o
f D
irect
ors
on a
qua
rter
ly b
asis
.

University Hospitals Birmingham NHS Foundation Trust | Quality Account 2016-17 | 33
2.2.6 Information on the quality of dataUHB submitted records during 2016/17 to the Secondary Uses service for inclusion in the Hospital Episode Statistics which are included in the latest published data. The percentage of records in the published data:
Î which included the patient’s valid NHS Number was*: ö 99.46% for admitted patient care; ö 99.65% for outpatient care; and ö 97.61% for accident and emergency care.
Î which included the patient’s valid General Medical Practice Code was*: ö 99.99% for admitted patient care; ö 99.94% for outpatient care; and ö 99.98% for accident and emergency care.
*Figures cover the latest available period: 1st April 2016 to 28th February 2017.
UHB Information Governance Assessment Report overall score for 2016/17 was 70% and was graded green (satisfactory).
UHB was not subject to the Payment by Results clinical coding audit during 2016/17 by the Audit Commission.
(Note: the Audit Commission has now closed and responsibility now lies with NHS Improvement).
UHB will be taking the following actions to improve data quality:
Î Continue to drive forward the strategy of the West Midlands Clinical Coding Academy and the UHB Coding Training programme to further improve training and clinical coding across the West Midlands.
Î Implementation of a new integrated Trust-wide patient administration system which will reduce duplication of data entry.
Î Continue to monitor data quality through the Ward Clerk quality monitoring and management programme.
Î Ensure continued compliance with the Information Governance Toolkit minimum Level 2 for data quality standards.
Î Review the Data Quality Policy and develop associated procedures.
Î Continue to reinforce the embedded data quality culture by challenging data at the Data Quality Group and investigating any potential issues.
Î Implementation of a quality assurance programme ensuring key elements of information reporting including data assurance, presentation and validation.
Î Continue to improve the data quality in relation to 18 week referral to treatment time (RTT) through audit, validation and education of both clinical and non-clinical teams.
2.3 Performance against national core set of quality indicatorsA national core set of quality indicators was jointly proposed by the Department of Health and Monitor for inclusion in trusts’ Quality Reports from 2012/13. The data source for all the indicators is NHS Digital (formerly the Health and Social Care Information Centre, or HSCIC). The Trust’s performance for the applicable quality indicators is shown in Appendix A for the latest time periods available. Further information about these indicators can be found on the NHS Digital website: http://content.digital.nhs.uk/

34 | University Hospitals Birmingham NHS Foundation Trust | Quality Account 2016-17
3 Other information
3.1 Overview of quality of care provided during 2016/17The tables below show the Trust’s latest performance for 2016/17 and the last two financial years for a selection of indicators for patient safety, clinical effectiveness and patient experience. The Board of Directors has chosen to include the same selection of indicators as reported in the Trust’s 2015/16 Quality Report to enable patients and the public to understand performance over time.
The patient safety and clinical effectiveness indicators were originally selected by the Clinical Quality Monitoring Group because they represent a balanced picture of quality at UHB.
The patient experience indicators were selected in consultation with the Care Quality Group which has Governor representation to enable comparison with other NHS trusts.
The latest available data for 2016/17 is shown below and has been subject to the Trust’s usual data quality checks by the Health Informatics team. Benchmarking data has also been included where possible.
Performance is monitored and challenged during the year by the Clinical Quality Monitoring Group and the Board of Directors.

University Hospitals Birmingham NHS Foundation Trust | Quality Account 2016-17 | 35
Pati
ent
safe
ty in
dic
ato
rs
Ind
icat
or
Dat
a so
urc
e20
14/1
520
15/1
620
16/1
7Pe
er G
rou
p A
vera
ge
(w
her
e av
aila
ble
)
1(a
) Pa
tien
ts w
ith
MR
SA in
fect
ion
/10
0,0
00
bed
day
s ö
(incl
udes
all
bed
days
from
all
spec
ialti
es)
öLo
wer
rate
indi
cate
s be
tter
per
form
ance
öTr
ust M
RSA
dat
a re
port
ed to
PH
E ö
HES
dat
a (b
ed d
ays)
1.52
2.0
61.
00
Apr
il–D
ec 2
016
0.4
4
Apr
il–D
ec 2
016
Acu
te t
rust
s in
W
est
Mid
land
s
1(b
) Pa
tien
ts w
ith
MR
SA in
fect
ion
/10
0,0
00
bed
day
s ö
(age
d >1
5, e
xclu
ding
Obs
tetr
ics,
Gyn
aeco
logy
and
ele
ctiv
e O
rtho
paed
ics)
öLo
wer
rate
indi
cate
s be
tter
per
form
ance
öTr
ust M
RSA
dat
a re
port
ed to
PH
E ö
HES
dat
a (b
ed d
ays)
1.52
2.0
71.
01
Apr
il–D
ec 2
016
0.49
Apr
il–D
ec 2
016
Acu
te t
rust
s in
W
est
Mid
land
s
2(a
) Pat
ien
ts w
ith
C. d
iffi
cile
infe
ctio
n/1
00,0
00 b
ed d
ays
ö(in
clud
es a
ll be
d da
ys fr
om a
ll sp
ecia
lties
) ö
Low
er ra
te in
dica
tes
bett
er p
erfo
rman
ce
öTr
ust C
DI d
ata
repo
rted
to
PH
E ö
HES
dat
a (b
ed d
ays)
16.7
316
.76
23.8
8
Apr
il–D
ec 2
016
15.6
9
Apr
il–D
ec 2
016
Acu
te t
rust
s in
W
est
Mid
land
s
2(b
) Pat
ien
ts w
ith
C. d
iffi
cile
infe
ctio
n/1
00,0
00 b
ed d
ays
ö(a
ged
>15,
exc
ludi
ng O
bste
tric
s, G
ynae
colo
gy a
nd e
lect
ive
Ort
hopa
edic
s) ö
Low
er ra
te in
dica
tes
bett
er p
erfo
rman
ce
öTr
ust C
DI d
ata
repo
rted
to
PH
E ö
HES
dat
a (b
ed d
ays)
16.8
216
.84
24.0
0
Apr
il–D
ec 2
016
17.4
2
Apr
il–D
ec 2
016
Acu
te t
rust
s in
W
est
Mid
land
s
3(a
) Pa
tien
t sa
fety
inci
den
ts
ö(r
epor
ting
rate
per
100
0 be
d da
ys)
öH
ighe
r rat
e in
dica
tes
bett
er re
port
ing
öD
atix
(inc
iden
t dat
a) ö
Trus
t adm
issi
ons
data
47.2
63.3
63.6
58.7
Apr
il –
Sep
2016
Acu
te (
no
n sp
ecia
list)
ho
spit
als
NR
LS w
ebsi
te (
Org
anis
atio
nal
Pati
ent
Safe
ty In
cid
ents
Wo
rkb
oo
k)
3(b
) N
ever
Eve
nts
ö
The
num
ber o
f Nev
er E
vent
s th
at o
ccur
red
durin
g th
e tim
e pe
riod
öLo
wer
num
ber i
ndic
ates
bet
ter p
erfo
rman
ce
öD
atix
(inc
iden
t dat
a)3
51
Not
ava
ilabl
e
4(a
) Pe
rcen
tag
e o
f p
atie
nt
safe
ty in
cid
ents
wh
ich
are
no
har
m
inci
den
ts
öH
ighe
r % in
dica
tes
bett
er p
erfo
rman
ce
öD
atix
(inc
iden
t dat
a)81
.0%
82.0
%83
.1%
76%
Apr
il –
Sep
2016
Acu
te (
no
n sp
ecia
list)
ho
spit
als
NR
LS w
ebsi
te (
Org
anis
atio
nal
Pati
ent
Safe
ty In
cid
ents
Wo
rkb
oo
k)

36 | University Hospitals Birmingham NHS Foundation Trust | Quality Account 2016-17
Ind
icat
or
Dat
a so
urc
e20
14/1
520
15/1
620
16/1
7Pe
er G
rou
p A
vera
ge
(w
her
e av
aila
ble
)
4(b
) Pe
rcen
tag
e o
f p
atie
nt
safe
ty in
cid
ents
rep
ort
ed t
o t
he
Nat
ion
al R
epo
rtin
g a
nd
Lea
rnin
g S
yste
m (
NR
LS)
resu
ltin
g in
se
vere
har
m o
r d
eath
öLo
wer
% in
dica
tes
bett
er p
erfo
rman
ce
öD
atix
(pat
ient
saf
ety
inci
dent
s re
port
ed to
the
N
RLS)
0.12
%0.
14%
0.12
%0.
30%
Apr
il –
Sep
2016
Acu
te (
no
n sp
ecia
list)
ho
spit
als
NR
LS w
ebsi
te (
Org
anis
atio
nal
Pati
ent
Safe
ty In
cid
ents
Wo
rkb
oo
k)
4(c
) N
um
ber
of
pat
ien
t sa
fety
inci
den
ts r
epo
rted
to
th
e N
atio
nal
R
epo
rtin
g a
nd
Lea
rnin
g S
yste
m (
NR
LS)
öD
atix
(pat
ient
saf
ety
inci
dent
s re
port
ed to
the
N
RLS)
16,2
2220
,516
22,5
3211
,155
(6
mo
nths
)
Apr
il –
Sep
2016
Acu
te (
no
n sp
ecia
list)
ho
spit
als
NR
LS w
ebsi
te (
Org
anis
atio
nal
Pati
ent
Safe
ty In
cid
ents
Wo
rkb
oo
k)
Clin
ical
eff
ecti
ven
ess
ind
icat
ors
Ind
icat
or
Dat
a so
urc
e20
14/1
520
15/1
620
16/1
7Pe
er G
rou
p A
vera
ge
(w
her
e av
aila
ble
)
5(a
) Em
erg
ency
rea
dm
issi
on
s w
ith
in 2
8 d
ays
(%)
ö(M
edic
al a
nd s
urgi
cal s
peci
altie
s –
elec
tive
and
emer
genc
y ad
mis
sion
s
aged
>15
) %
öLo
wer
rate
indi
cate
s be
tter
per
form
ance
öH
ES d
ata
13.5
1%
Eng
lan
d: 1
3.87
%
13.4
1%
Eng
lan
d: 1
4.1
5%
13.3
3%
Apr
–Dec
201
6
13.5
5%
Apr
il–D
ec 2
016
Uni
vers
ity
ho
spit
als
Eng
lan
d: 1
4.1
0%
5(b
) Em
erg
ency
rea
dm
issi
on
s w
ith
in 2
8 d
ays
(%)
ö(a
ll sp
ecia
lties
) ö
Low
er %
indi
cate
s be
tter
per
form
ance
öH
ES d
ata
13.4
8%
Eng
lan
d: 1
3.24
%
13.3
9%
Eng
lan
d: 1
3.52
%
13.4
5%
Apr
–Dec
201
6
13.0
8%
Apr
–Dec
201
6 U
nive
rsit
y h
osp
ital
s En
gla
nd
: 13.
47%
5(c
) Em
erg
ency
rea
dm
issi
on
s w
ith
in 2
8 d
ays
of
dis
char
ge
(%)
öLo
wer
% in
dica
tes
bett
er p
erfo
rman
ce ö
Lore
nzo
10.7
5%10
.68%
10.6
7%
Apr
201
6–F
eb 2
017
Not
ava
ilabl
e
6 Fa
lls (
inci
den
ts r
epo
rted
as
% o
f p
atie
nt
epis
od
es)
öLo
wer
% in
dica
tes
bett
er p
erfo
rman
ce ö
Dat
ix (i
ncid
ent d
ata)
, ö
Trus
t adm
issi
ons
data
2.2
%2
.1%
2.2
%N
ot a
vaila
ble
7 St
roke
in-h
osp
ital
mo
rtal
ity
öLo
wer
% in
dica
tes
bett
er p
erfo
rman
ce ö
SSN
AP
data
9.5%
5.0%
1.8%
Not
ava
ilabl
e
8 Pe
rcen
tag
e o
f b
eta
blo
cker
s g
iven
on
th
e m
orn
ing
of
the
pro
ced
ure
fo
r p
atie
nts
un
der
go
ing
firs
t ti
me
coro
nar
y ar
tery
byp
ass
gra
ft
(CA
BG
) ö
Hig
her %
indi
cate
s be
tter
per
form
ance
öTr
ust P
ICS
data
94.7
%97
.5%
97.4
%N
ot a
vaila
ble

University Hospitals Birmingham NHS Foundation Trust | Quality Account 2016-17 | 37
Notes on patient safety and clinical effectiveness indicators
The data shown is subject to standard national definitions where appropriate. The Trust has also chosen to include infection and readmissions data which has been corrected to reflect specialty activity, taking into account that the Trust does not undertake paediatric, obstetric, gynaecology or elective orthopaedic activity. These specialties are known to be very low risk in terms of hospital acquired infection, for example, and therefore excluding them from the denominator (bed day) data enables a more accurate comparison to be made with peers.
Î 1a, 1b, 2a, 2b, 5a, 5b Receipt of HES data from the national team always happens two to three months later, these indicators will be updated in the next quarterly report.
Î 1a, 1b, 2a, 2b For further information on action taken at UHB around MRSA and CDI, please refer to Priority 5 in Section 2 above.
Î 3(a) The NHS England definition of a bed day (“KH03”) differs from UHB’s usual definition. For further information, please see this link: http://www.england.nhs.uk/statistics/statistical-work-areas/bed-availability-and-occupancy/ NHS England have also reduced the number of peer group clusters (trust classifications), meaning UHB is now classed as an ‘acute (non specialist)’ trust and is in a larger group. Prior to this, UHB was classed as an
‘acute teaching’ trust which was a smaller group. In January 2014, the Trust implemented an automatic incident reporting process whereby incidents are directly reported from the Trust’s Prescribing Information and Communication System (PICS). These include missed observations and patients who need to be discharged off PICS. The Trust’s incident reporting rate has therefore increased and this trend is likely to continue. The purpose of automated incident reporting is to ensure even small errors or omissions are identified and addressed as soon as possible. The plan is to include other automated incidents such as ‘complete set of observations plus pain assessment within 6 hours of admission to a ward’ during 2017/18.
Î 3(b) UHB had one Never Event in 2016/17: Patient underwent surgery; at the end of the procedure the swab count reported one swab missing. The consultant was at the point of skin closure; an x-ray was taken which failed to identify the swab. The consultant decided to transfer patient to Critical Care where they had another x-ray which could provide a clearer image and the missing swab was identified. The patient returned to theatre for removal of the swab, and duty of candour was completed.
Î 4(c) The number of incidents shown only includes those classed as patient safety incidents and reported to the National Reporting and Learning System.
Î 5a, 5b The methodology has been updated to reflect the latest guidance from the Health and Social Care Information Centre. The key change is that day cases and regular day case patients, all cancer patients or patients coded with cancer in the previous 365 days are now excluded from the denominator. This indicator includes patients readmitted as emergencies to the Trust or any other provider within 28 days of discharge. Further details can be found on the Health and Social Care Information Centre website. Any changes in data since the previous Quality Report are due to updates made to the national HES data.
Î 5c This indicator only includes patients readmitted as emergencies to the Trust within 28 days of discharge and excludes UHB cancer patients. The data source is the Trust’s patient administration system (Lorenzo). The data for previous years has been updated to include readmissions from 0 to 27 days and exclude readmissions on day 28 in line with the national methodology. Any changes in previously reported data are due to long-stay patients being discharged after the previous years’ data was analysed.
Î 8 Beta blockers are given to reduce the likelihood of peri-operative myocardial infarction and early mortality. This indicator relates to patients already on beta blockers and whether they are given beta blockers on the day of their operation. All incidences of beta blockers not being given on the day of operation are investigated to understand the reasons why and to reduce the likelihood of future omissions. During 2014/15 there was a small adjustment to the methodology of this indicator, resulting in a very small change to the indicator results for this year.

38 | University Hospitals Birmingham NHS Foundation Trust | Quality Account 2016-17
Patient experience indicators UHB usually publishes data taken from the National Inpatient Survey, run by the Picker Institute on behalf of the CQC, however publication of the 2016 survey report has been delayed and is not available at the time of writing. The text and table below refer to the 2015 survey results, which were reported in the 2015/16 Quality Account. Information on the 2016 results will be added to the published Quality Account once it is available. Alternative patient experience data and indicators are also available in Priority 2: Improving patient experience above, these are taken from the Trust’s local patient surveys.
The results of the 2015 National Inpatient Survey reported that the Trust was ‘better’ than other Trusts in six questions (four in 2014): getting enough help from staff to eat meals, being given written or printed information about what to do/not do after leaving hospital, giving family/someone close all the information needed to care for the patient, telling patients who to contact if they are worried after leaving hospital, discussing with patient whether any further health or social care services were needed after leaving hospital, and asking patients during their stay about the quality of care they were receiving. The remaining questions scored ‘about the same’ as other trusts.
2014/15 2015/16 2016/17
Patient survey question Score Comparison with other NHS trusts
in England
Score Comparison with other NHS trusts
in England
Score Comparison with other NHS trusts
in England
9. Overall were you treated with respect and dignity?
9.2 About the same 9.2 About the same TBC TBC
10. Involvement in decisions about care and treatment
7.7 About the same 7.5 About the same TBC TBC
11. Did staff do all they could to control pain?
8.1 About the same 8.2 About the same TBC TBC
12. Cleanliness of room or ward
9.2 About the same 9.2 About the same TBC TBC
13. Overall rating of care 8.3 About the same 8.4 About the same TBC TBC
Time period & data source 2014, Trust’s Survey of Adult Inpatients 2014 Report, CQC
2015, Trust’s Survey of Adult Inpatients 2015 Report, CQC
TBC – 2016, Trust’s Survey of Adult Inpatients 2016 Report, CQC
Note: Data is presented as a score out of 10; the higher the score for each question, the better the Trust is performing.
3.2 Performance against indicators included in the NHS Improvement Single Oversight FrameworkIn the 2015/16 Quality Account, trusts were required to report performance for the Monitor Risk Assessment Framework. This changed to the NHS Improvement Single Oversight Framework on 1st October 2016, and
for the 2016/17 Quality Account trusts are required to report only on indicators common to both Frameworks. Therefore there are fewer indicators in the 2016/17 Quality Account than the previous 2015/16 report.
Indicator TargetPerformance
2014/15 2015/16 2016/17
A&E maximum waiting time of 4 hours from arrival to admission/transfer/discharge1
95% 94.8% 91.9% 81.8%
Maximum time of 18 weeks from point of referral to treatment (RTT) in aggregate − patients on an incomplete pathway1
92% 93.6% 95.0% 92.5%
All cancers – maximum 62-day wait for first treatment from urgent GP referral for suspected cancer
85% 73.8% 72.2% 75.4%
All cancers – maximum 62-day wait for first treatment from NHS cancer screening service referral
90% 89.3% 92.8% 96.2%
C. difficile – meeting the C. difficile objective ≤ 63 cases judged to be lapses in care
17 judged lapses in care (66 total)
24 judged lapses in care (66 total)
31 judged lapses (92 total)
1 – Indicators audited by the Trust’s external auditor Deloitte as part of the external assurance arrangements for the 2016/17 Quality Report. Please see detailed notes below relating to the Maximum time of 18 weeks from point of referral to treatment (RTT) indicator.

University Hospitals Birmingham NHS Foundation Trust | Quality Account 2016-17 | 39
Performance validation – maximum time of 18 weeks from point of referral to treatment (RTT) indicator
In line with practices across many NHS Trusts and Foundation Trusts, the Trust has a month end validation process in place prior to the submission of Referral-to-Treatment (RTT) performance data. The Trust undertakes a range of validation primarily because of the volume of patients recorded as being on a RTT pathway, the volume of referrals accepted from other organisations and also because of the complexity of the patient pathways as a specialist tertiary centre.
The Trust concentrates its month end reporting validation on the incomplete pathways with a waiting time in excess of 18 weeks. Previously validation only focused on the less well-performing specialties and ceased once overall performance reached between 92%-95%. This meant there was a possibility we may have previously overstated the number of breaches. As a result, performance against the 92% target was likely to have been historically under-reported. However, to improve data quality and accuracy of reporting, all incomplete pathways with a waiting time of 18 weeks or more are now validated, regardless of specialty or the level of performance reached.
There is also now a feedback loop to operational services which is aimed at sharing the most common errors found during the validation process. The validation team is able to identify individual users who make the most errors so that they can be targeted for training and support. As a result, fewer errors are made at the outset which reduces the month-end validation burden. As predicted, there was a reduction in the size of the unfinished waiting list during 2016 (against the national trend) which has been largely attributed to an improvement in data quality; i.e. fewer erroneous clock starts. A consequence of a smaller waiting list is that it also reduces the number of pathways allowed within the 8% tolerance for this standard, making it more challenging to achieve. The Trust has, however, maintained an above standard performance for the unfinished 18 week RTT target all year.
A weekly RTT Assurance meeting is chaired by the Head of Service Improvement and is attended by operational managers representing all specialties. Key themes that emerge from the month end validation process are discussed at the meeting, for example the validation process may have identified an increase in the number of missed clock stops for first treatment in outpatients. This discussion and subsequent rectification action planning ensures that key messages are disseminated and learning from validation is shared within the organisation.
Unknown clock startsThe Trust is required to report performance against three indicators in respect of 18 week Referral-to-Treatment targets. For patient pathways covered by this target, the three metrics reported are:
Î “admitted” – for patients admitted for first treatment during the year, the percentage who had been waiting less than 18 weeks from their initial referral;
Î “non-admitted” – for patients who received their first treatment without being admitted, or whose treatment pathway ended for other reasons without admission, the percentage for the year who had been waiting less than 18 weeks from the initial referral; and
Î “incomplete” – the average of the proportion of patients at each month end who had been waiting less than 18 weeks from initial referral, as a percentage of all patients waiting at that date.
The measurement and reporting of performance against these targets is subject to a complex series of rules and guidance published nationally. However, the complexity and range of the services offered by the Trust mean that local policies and interpretations are required, including those set out in the Trust Access Policy. As a specialist tertiary provider receiving onward referrals from other trusts, a key issue for the Trust is reporting pathways for patients who were initially referred to other providers.
Under the rules for the indicators, the Trust is required to report performance against the 18 week target for patients under its care, including those referred on from other providers. Depending on the nature of the referral and whether the patient has received their first treatment, this can either “start the clock” on a new 18 week treatment pathway, or represent a continuation of their waiting time which began when their GP made an initial referral. In order to accurately report waiting times, the Trust therefore needs other providers to share information on when each patient’s treatment pathway began.
Although providing this information is required under the national RTT rules, and there is a standard defined ‘Inter Provider Administrative Data Transfer Minimum Data Set’ to facilitate sharing the required information, the Trust does not usually receive this information from referring providers. This means that for some patients the Trust cannot know definitively when their treatment pathway began. The national guidance assumes that the “clock start” can be identified for each patient pathway, and does not provide guidance on how to treat patients with ‘unknown clock starts’ in the incomplete pathway metric.
The Trust’s approach in these cases, where information is not forthcoming after chasing the referring provider, is to treat a new treatment pathway as starting on the date that the Trust receives the referral for the first time. Rather than spend a significant amount of time chasing clock starts for tertiary referrals, the main focus is on recording receipt of the referral and ensuring timely appointments are made. This approach means that all patients are included in the calculation of the reported indicators, but may mean that the percentage waiting more than 18 weeks for treatment is understated as we cannot take account of time spent waiting with other providers which has not been reported by them. Due to how data is captured, it is not practicable to quantify the number of patients this represents for the year.
The absence of timely sharing of data by referring providers impacts the Trust’s ability to monitor and manage whether patients affected are receiving treatment within the 18 week period set out in the NHS Constitution, and requires significant time and resource for follow-up.

40 | University Hospitals Birmingham NHS Foundation Trust | Quality Account 2016-17
3.3 MortalityThe Trust continues to monitor mortality as close to real-time as possible with senior managers receiving daily emails detailing mortality information and on a longer term comparative basis via the Trust’s Clinical Quality Monitoring Group. Any anomalies or unexpected deaths are promptly investigated with thorough clinical engagement.
The Trust has not included comparative information due to concerns about the validity of single measures used to compare trusts.
Summary Hospital-level Mortality Indicator (SHMI)The Health and Social Care Information Centre (HSCIC) first published data for the Summary Hospital-level Mortality Indicator (SHMI) in October 2011. This is the national hospital mortality indicator which replaced previous measures such as the Hospital Standardised Mortality Ratio (HSMR). The SHMI is a ratio of observed deaths in a trust over a period time divided by the expected number based on the characteristics of the patients treated by the trust. A key difference between the SHMI and previous measures is that it includes deaths which occur within 30 days of discharge, including those which occur outside hospital.
The Summary Hospital-level Mortality Indicator should be interpreted with caution as no single measure can be used to identify whether hospitals are providing good or poor quality care.1 An average hospital will have a SHMI around 100; a SHMI greater than 100 implies more deaths occurred than predicted by the model but may still be within the control limits. A SHMI above the control limits should be used as a trigger for further investigation.
The Trust’s latest SHMI is 104 for the period April – December 2016 this implies the mortality numbers are higher than expected but remain within tolerance control limits. The latest SHMI value for the Trust, which is available on the NHS Digital (formerly HSCIC) website, is 102 for the period April – September 2016. This is within tolerance.
The Trust has concerns about the validity of the Hospital Standardised Mortality Ratio (HSMR) which was superseded by the SHMI but it is included here for completeness. UHB’s HSMR value is 99.68 for the period April 2016 – January 2017 as calculated by the Trust’s Health Informatics team. The validity and appropriateness of the HSMR methodology used to calculate the expected range has however been the subject of much national debate and is largely discredited.2,3 The Trust is continuing to robustly monitor mortality in a variety of ways as detailed above.
Crude MortalityThe first graph shows the Trust’s crude mortality rates for emergency and non-emergency (planned) patients. The second graph below shows the Trust’s overall crude mortality rate against activity (patient discharges) by quarter for the past two calendar years. The crude mortality rate is calculated by dividing the total number of deaths by the total number of patients discharged from hospital in any given time period. The crude mortality rate does not take into account complexity, case mix (types of patients) or seasonal variation.
The Trust’s overall crude mortality rate for 2016/17 is 2.96%, which is a small decrease compared to 2015/16 (3.04%) and 2014/15 (3.05%).
1 Freemantle N, Richardson M, Wood J, Ray D, Khosla S, Sun P, Pagano, D. Can we update the Summary Hospital Mortality Index (SHMI) to make a useful measure of the quality of hospital care? An observational study. BMJ Open. 31 January 2013.
2 Hogan H, Healey F, Neale G, Thomson R, Vincent C, Black, N. Preventable deaths due to problems in care in English acute hospitals: a retrospective case record review. BMJ Quality & Safety. Online First. 7 July 2012.
3 Lilford R, Mohammed M, Spiegelhalter D, Thomson R. Use and misuse of process and outcome data in managing performance of acute and medical care: Avoiding institutional stigma. The Lancet. 3 April 2004.
Emergency and non-emergency mortality graph
4.5%
5.0%
3.5%
3.0%
4.0%
2.0%
2.5%
1.0%
0.5%
0.0%
1.5%
2010/11 2011/12 2012/13 2013/14 2014/15 2015/16 2016/17
Non-emergencyEmergency

University Hospitals Birmingham NHS Foundation Trust | Quality Account 2016-17 | 41
Overall crude mortality graph
12,000
14,000
8,000
6,000
10,000
2,000
4,000
0
4.5%
5.0%
3.5%
3.0%
4.0%
2.0%
2.5%
1.5%
1.0%
0.5%
0.0%Q1
2014/15
Discharges
Dis
char
ges
Mor
talit
y Ra
te
Mortality rate
2015/16 2016/17Q2 Q3 Q4 Q1 Q2 Q3 Q4 Q1 Q2 Q3 Q4
3.4 SafeguardingThe Trust underwent a Care Quality Commission (CQC) inspection in January 2015 which included a review of safeguarding practice. The report, which was published in May 2015, was very positive in relation to safeguarding practice, training and leadership.
The Lead Nurse for Safeguarding receives details of relevant incidents on a daily basis and initiates follow up actions where necessary. The Lead Nurse for Safeguarding also receives any complaints or concerns raised via the Patient Advice and Liaison Service (PALS) relating to safeguarding and these are also followed up.
The Trust’s framework for safeguarding adults and children is based on national guidance arising from the Care Act 2014 and the Working Together to Safeguard Children 2015 guide, which promotes development of inter-agency working to safeguard vulnerable adults and children. The Trust has also worked in partnership with Birmingham children services in developing new referral processes.
UHB has continued to ensure that safeguarding of adults and children remains a high priority.
Level 2 Adult and Children Safeguarding training is a combined session and has been mandatory for all patient-facing staff in 2016/17. A further two study days for Clinical Champions (one from each clinical area) have been held to improve knowledge across the Trust.
Factsheets on types of abuse are available to support staff, and patient information leaflets for adults and children are available in all clinical areas and have been well received. The Trust intranet pages on mental capacity, Deprivation of Liberty Safeguards (DoLS) and independent mental capacity advocates have also been updated.
The safeguarding team have developed a questionnaire for adult patients who pass through the safeguarding process to obtain their views on the process and the support they have received from the safeguarding team. The aim is to ensure that the safeguarding process is personal for every patient. The results have
been extremely positive showing that patients feel they are involved in the safeguarding process, providing assurance that it is person-centred.
The Trust is committed to listening to the voice of the child and the safeguarding team visit all child admissions (16 and 17 year olds) to ensure they are being supported appropriately.
The Trust approaches safeguarding using an integrated ‘think family’ model. At all times staff are encouraged to think about the impact their patients’ needs may have on children or vulnerable adults in their care.
The aim of safeguarding is to ensure that there is a robust policy with supporting procedural documents which allows a consistent approach to the delivery of safeguarding principles across the Trust. The policy provides a framework that can be consistently followed, reinforced by training and support, to enable all clinical staff to recognise and report adults and children who are at risk, ensuring that patients receive a positive experience, including support in relation to safeguarding where necessary. Further information can be found in the Trust’s Annual Report for 2016/17: http://www.uhb.nhs.uk/reports.htm.
3.5 Staff SurveyThe Trust’s Staff Survey results for 2016 show that performance was average or better for 29 of the 32 key findings and below average for 3 key findings, when compared to other acute trusts.
The results are based on responses from 3553 staff which represents a decrease in response rate from 50% last year to 41% this year; this is below average for acute trusts in England. However the number of responses has increased from 418 last year as the survey was sent to all staff, whereas in previous years a sample of staff was chosen.
The results for the key findings of the Staff Survey which most closely relate to quality of care are shown in the table below.
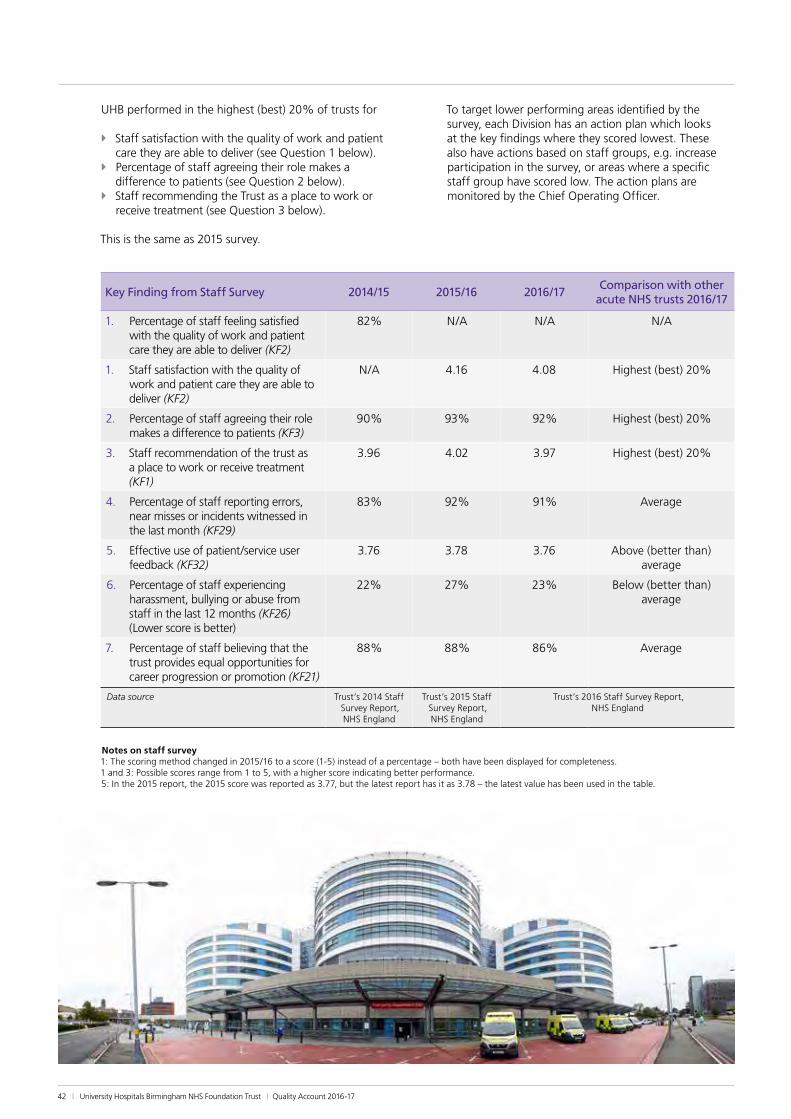
42 | University Hospitals Birmingham NHS Foundation Trust | Quality Account 2016-17
UHB performed in the highest (best) 20% of trusts for
Î Staff satisfaction with the quality of work and patient care they are able to deliver (see Question 1 below).
Î Percentage of staff agreeing their role makes a difference to patients (see Question 2 below).
Î Staff recommending the Trust as a place to work or receive treatment (see Question 3 below).
This is the same as 2015 survey.
To target lower performing areas identified by the survey, each Division has an action plan which looks at the key findings where they scored lowest. These also have actions based on staff groups, e.g. increase participation in the survey, or areas where a specific staff group have scored low. The action plans are monitored by the Chief Operating Officer.
Key Finding from Staff Survey 2014/15 2015/16 2016/17Comparison with other
acute NHS trusts 2016/17
1. Percentage of staff feeling satisfied with the quality of work and patient care they are able to deliver (KF2)
82% N/A N/A N/A
1. Staff satisfaction with the quality of work and patient care they are able to deliver (KF2)
N/A 4.16 4.08 Highest (best) 20%
2. Percentage of staff agreeing their role makes a difference to patients (KF3)
90% 93% 92% Highest (best) 20%
3. Staff recommendation of the trust as a place to work or receive treatment (KF1)
3.96 4.02 3.97 Highest (best) 20%
4. Percentage of staff reporting errors, near misses or incidents witnessed in the last month (KF29)
83% 92% 91% Average
5. Effective use of patient/service user feedback (KF32)
3.76 3.78 3.76 Above (better than) average
6. Percentage of staff experiencing harassment, bullying or abuse from staff in the last 12 months (KF26) (Lower score is better)
22% 27% 23% Below (better than) average
7. Percentage of staff believing that the trust provides equal opportunities for career progression or promotion (KF21)
88% 88% 86% Average
Data source Trust’s 2014 Staff Survey Report, NHS England
Trust’s 2015 Staff Survey Report, NHS England
Trust’s 2016 Staff Survey Report, NHS England
Notes on staff survey 1: The scoring method changed in 2015/16 to a score (1-5) instead of a percentage – both have been displayed for completeness. 1 and 3: Possible scores range from 1 to 5, with a higher score indicating better performance. 5: In the 2015 report, the 2015 score was reported as 3.77, but the latest report has it as 3.78 – the latest value has been used in the table.

University Hospitals Birmingham NHS Foundation Trust | Quality Account 2016-17 | 43
3.6 Specialty Quality IndicatorsThe Trust’s Quality and Outcomes Research Unit (QuORU) was set up in September 2009. The unit has linked a wide range of information systems together to enable different aspects of patient care, experience and outcomes to be measured and monitored. The unit continues to provide support to clinical staff in the development of innovative quality indicators with a focus on research. In August 2012, the Trust implemented a framework based on a statistical model for handling potentially significant changes in performance and identifying any unusual patterns in the data. The framework has been used by the Quality and Informatics teams to provide a more rigorous approach to quality improvement and to direct attention to those indicators which may require improvement.
Performance for a wide selection of the quality indicators developed by clinicians, Health Informatics and the Quality and Outcomes Research Unit has been included the Trust’s annual Quality Reports. The selection included for 2016/17 includes 69 indicators covering the majority of clinical specialties and performance for the past three financial years is included in a separate appendix on the Quality web pages: http://www.uhb.nhs.uk/quality.htm
This analysis is based on data for April 2016 to March 2017 for most indicators. Some run one to two months in arrears and this is indicated where relevant.
The Trust’s clinical and management teams improved performance for 11% of the indicators during 2016/17. Performance for 75% stayed about the same (including four indicators which were already scoring the maximum and continued to do so). Performance for 14% of the indicators deteriorated during 2016/17. Two further indicators do not yet have any data for 2016/17 so cannot be compared to 2015/16 performance (this data is sourced nationally).
The majority of the 69 indicators have a goal; 62% of those with a goal met them in 2016/17, compared to 63% in 2015/16 and 54% in 2014/15.
Table 1 below shows performance for selected specialty indicators where the most notable improvements have been made during 2016/17. Table 2 below shows performance for selected indicators where performance has deteriorated during 2016/17.
Performance for the remaining indicators can be viewed on the Quality web pages: http://www.uhb.nhs.uk/quality.htm.
Table 1
Specialty Indicator Goal Percentage Apr 14 –Mar 15
Percentage Apr 15 – Mar 16
Numerator Apr 16 – Mar 17
Denominator Apr 16 – Mar 17
Percentage Apr 16 – Mar 17
Data Sources
Stroke Medicine
In hospital mortality following stroke
< 15% 8.5% 5.0% 9 501 1.8% SSNAP
Routine Surgery/Care*
Unplanned return to theatre for all non-emergency surgical patients
<2.5% 1.2% 0.8% 83 24576 0.3% Galaxy
Imaging GP direct access patients who have report turnaround time of less than or equal to 7 days for Ultrasound
> 99% 94.4% 94.8% 8545 8585 99.5% CRIS
*data up to February 2017 – indicator runs one month in arrears
Table 2
Specialty Indicator Goal Percentage Apr 14 –Mar 15
Percentage Apr 15 – Mar 16
Numerator Apr 16 – Mar 17
Denominator Apr 16 – Mar 17
Percentage Apr 16 – Mar 17
Data Sources
Colorectal Surgery
Clexane medication after elective colorectal surgery (excluding day cases)
> 95% 94.2% 90.2% 190 224 84.8% Lorenzo PICS
Maxillofacial Surgery
Percentage of emergency admissions with fractured mandible (lower jaw) who are operated on the same or next day
>90% 79.3% 76.1% 130 168 77.4% Lorenzo
Surgery – Emergency
Perianal abscess operations should take place on the day of admission or the next day
> 90% 94.4% 83.3% 74 92 80.4% Lorenzo
44 | University Hospitals Birmingham NHS Foundation Trust | Quality Account 2016-17
3.7 Sign Up to SafetyThe national Sign up to Safety campaign was launched in 2014 and aims to make the NHS the safest healthcare system in the world. The ambition is to halve avoidable harm in the NHS over the next three years. Organisations across the NHS have been invited to join the Sign up to Safety campaign and make five key pledges to improve safety and reduce avoidable harm. UHB joined the campaign in November 2014 and made the following five Sign up to Safety pledges:
1. Put safety first Commit to reduce avoidable harm in the NHS by half and make public the goals and plans developed locally. We will: ö reduce medication errors due to missed drug doses. ö improve monitoring of deteriorating patients
through completeness of observation sets. ö reduce hospital acquired grade 3 and 4 pressure
ulcers. ö reduce harm from falls.
2. Continually learn Make their organisations more resilient to risks, by acting on the feedback from patients and by constantly measuring and monitoring how safe their services are. We will: ö better understand what patients are telling about
us about their care through continuous local patient surveys, complaints and compliments.
ö review the Clinical Dashboard to ensure clinical staff have the performance and safety information they need to improve patient care.
3. Honesty Be transparent with people about our progress to tackle patient safety issues and support staff to be candid with patients and their families if something goes wrong. We will: ö improve staff awareness and compliance with the
Duty of Candour. ö communicate key safety messages through regular
staff open meetings and Team Brief. ö make patients and the public aware of safety issues
and what the Trust is doing to address them.
4. Collaborate Take a leading role in supporting local collaborative learning, so that improvements are made across all of the local services that patients use. We will: ö work closely with our partners to:
• make improvements for patients in relation to mental health and mental health assessment.
• develop clearer and simpler pathways around delayed transfers of care, safeguarding, end of life care and falls.
• implement electronic solutions such as the ‘Your Care Connected’ project to improve patient safety by sharing key information.
5. Support Help people understand why things go wrong and how to put them right. Give staff the time and support to improve and celebrate the progress. We will: ö improve the learning and feedback provided to
staff from complaints and incident reporting. ö enable Junior Doctors to understand how they are
performing and how they can improve in relation to key safety issues such as VTE prevention through the Junior Doctor Monitoring System.
ö recognise staff contribution to patient safety through the Best in Care awards.
UHB’s Sign Up to Safety action plan can be found on the Trust intranet: http://www.uhb.nhs.uk/sign-up-to-safety.htm
Further information about Sign Up to Safety can be found on the NHS England website: http://www.england.nhs.uk/signuptosafety/

University Hospitals Birmingham NHS Foundation Trust | Quality Account 2016-17 | 45
3.8 Duty of CandourWhen a patient has been adversely affected by an incident, staff have a duty to inform the patient, relatives and/or carers as appropriate. This may fall under the Being Open process or Duty of Candour, depending upon the level of harm or potential for harm to the patient, and must include details of what happened and what is being done in response. Provision of reasonable support and an apology when things go wrong must also be addressed. This ensures that not only does the Trust meet its Duty of Candour statutory requirements, but that staff are open and transparent, honouring the Trust vision and values of providing the best in care and honesty to patients and service users.
When Duty of Candour is identified as being applicable, the risk team work with staff to support the process and provide expert advice as required. Conversations are recorded on a standard form which includes specific details of who is to be contacted for future feedback and who will undertake this feedback. These forms are logged against the Trust-wide Duty of Candour tracker, which is monitored by the Clinical Risk and Compliance department, and also contains information on actions taken. If an incident has led to further investigation then details of the investigation will also be recorded. The risk team work closely with the investigations team and complaints department to ensure that details are co-ordinated, providing patient focused feedback that is appropriate and timely, as well as meeting statutory deadlines.
The risk team support staff in understanding the process and how to complete Duty of Candour, as well as ensuring regulatory compliance. As part of the service review the risk team plan to embed Duty of Candour into the investigation process to ensure a holistic approach to patient feedback.
The Duty of Candour process at UHB was audited by Birmingham CrossCity CCG in January 2016 and the process was deemed compliant and the tracker content was deemed to be of a high standard.
The Trust plans to use the incident reporting system, Datix, to record Duty of Candour information by autumn 2017. Datix has been reviewed to ensure that it can record the information currently captured by the Duty of Candour forms, and supportive monitoring is also in place, to give information and assurance regarding deadlines. An education scheme is being planned to ensure all staff receive appropriate training before this is launched, and will be supported by ongoing education and training. The Duty of Candour/ Being Open Policy will also be reviewed to reflect the new processes.

46 | University Hospitals Birmingham NHS Foundation Trust | Quality Account 2016-17
3.9 Glossary of terms
Term Definition
A&E Accident & Emergency – also known as the Emergency Department
Acute Trust An NHS hospital trust that provides secondary health services within the English National Health Service
Administration When relating to medication, this is when the patient is given the tablet, infusion or injection. It can also mean when anti-embolism stockings are put on a patient.
Alert organism Any organism which the Trust is required to report to Public Health England
Analgesia A medication for pain relief
Bacteraemia Presence of bacteria in the blood
Bed days Unit used to calculate the availability and use of beds over time
Benchmark A method for comparing (e.g.) different hospitals
Betablockers A class of drug used to treat patients who have had a heart attack, also used to reduce the chance of heart attack during a cardiac procedure
Birmingham Health & Social Care Overview Scrutiny Committee
A committee of Birmingham City Council which oversees health issues and looks at the work of the NHS in Birmingham and across the West Midlands
CABG Coronary artery bypass graft procedure
CCG Clinical Commissioning Group
CDI C. difficile infection
Clinical Audit A process for assessing the quality of care against agreed standards
Clinical Coding A system for collecting information on patients’ diagnoses and procedures
Clinical Dashboard An internal website used by staff to measure various aspects of clinical quality
Clinical Quality Committee
A committee led by the Trust’s Chairman which reviews clinical quality in detail
Commissioners See CCG
Congenital Condition present at birth
Contraindication A condition which makes a particular treatment or procedure potentially inadvisable
CQC Care Quality Commission
CQG Care Quality Group; a UHB group chaired by the Chief Nurse, which assesses the quality of care, mainly nursing
CQMG Clinical Quality Monitoring Group; a UHB group chaired by the Executive Medical Director, which reviews the quality of care, mainly medical
CQUIN Commissioning for Quality and Innovation payment framework
CRIS Radiology database
Datix Database used to record incident reporting data
Day case Admission to hospital for a planned procedure where the patient does not stay overnight
DCQG Divisional Clinical Quality Group - the divisional subgroups of the CQMG
Deloitte UHB’s external auditors
Division Specialties at UHB are grouped into Divisions
Echo/echocardiogram Ultrasound imaging of the heart
ED Emergency Department (previously called Accident and Emergency Department)
Elective A planned admission, usually for a procedure or drug treatment
Episode The time period during which a patient is under a particular consultant and specialty. There can be several episodes in a spell
FCE Finished/Full Consultant Episode - the time spent by a patient under the continuous care of a consultant
Foundation Trust Not-for-profit, public benefit corporations which are part of the NHS and were created to devolve more decision-making from central government to local organisations and communities.
GI Gastro-intestinal

University Hospitals Birmingham NHS Foundation Trust | Quality Account 2016-17 | 47
Term Definition
GP General Practitioner
Healthwatch Birmingham
An independent group who represent the interests of patients and the public.
HES Hospital Episode Statistics
HSCIC Health and Social Care Information Centre – now known as NHS Digital
HSMR Hospital Standardised Mortality Ratio
ICNARC Intensive Care National Audit & Research Centre
Informatics UHB’s team of information analysts
IT Information Technology
ITU Intensive Treatment Unit (also known as Intensive Care Unit, or Critical Care Unit)
Lorenzo Patient administration system
MINAP Myocardial Ischaemia National Audit Project
Monitor Independent regulator of NHS Foundation Trusts – now replaced by NHS Improvement
Mortality A measure of the number of deaths compared to the number of admissions
MRI Magnetic Resonance Imaging – a type of diagnostic scan
MRSA Meticillin-resistant Staphylococcus aureus
Myocardial Infarction Heart attack
mystay@QEHB An online system that allows patients to view information/indicators on particular specialties
NaDIA National Diabetes Inpatient Audit
NBOCAP National Bowel Cancer Audit Programme
NCAA National Cardiac Arrest Audit
NCEPOD National Confidential Enquiry into Patient Outcome and Death - a national review of deaths usually concentrating on a particular condition or procedure
NHS National Health Service
NHS Choices A website providing information on healthcare to patients. Patients can also leave feedback and comments on the care they have received
NHS Digital Formerly HSCIC - Health and Social Care Information Centre. A library of NHS data
NHS Improvement The national body that provides the reporting requirements and guidance for the Quality Accounts
NIHR National Institute for Health Research
NRLS National Reporting and Learning System
Observations Measurements used to monitor a patient's condition e.g. pulse rate, blood pressure, temperature
PALS Patient Advice and Liaison Service
Patient Opinion A website where patients can leave feedback on the services they have received. Care providers can respond and provide updates on action taken.
Peri-operative Period of time prior to, during, and immediately after surgery
PHE Public Health England
PICS Prescribing Information and Communication System
Plain imaging X-ray
PRISM Cardiology System which records information on ECGs and Echoes
PROMs Patient Reported Outcome Measures
Prophylactic/prophylaxis
A treatment to prevent a given condition from occurring
QEHB Queen Elizabeth Hospital Birmingham
QuORU Quality and Outcomes Research Unit
R&D Research and Development
RCA Root cause analysis

48 | University Hospitals Birmingham NHS Foundation Trust | Quality Account 2016-17
Term Definition
Readmissions Patients who are readmitted after being discharged from hospital within a short period of time e.g., 28 days
Safeguarding The process of protecting vulnerable adults or children from abuse, harm or neglect, preventing impairment of their health and development
Sepsis A potentially life-threatening condition resulting from a bacterial infection of the blood
SEWS Standardised Early Warning System
Shelford Group A group of England’s ten leading Academic Healthcare Organisations. UHB is a member, as are other hospital trusts such as University College Hospital in London.
SHMI Summary Hospital Mortality Indicator
Spell The time period from a patient's admission to hospital to their discharge. A spell can consist of more than one episode if the patient moves to a different consultant and/or specialty.
SSNAP Sentinel Stroke National Audit Programme
TARN Trauma Audit and Research Network
Trajectory In infection control, the maximum number of cases expected in a given time period
Trust apportioned A case (e.g. MRSA or CDI) that is deemed as 'belonging' to the Trust in question
Trust Partnership Team Attendees include Staff Side (Trade Union representatives), Directors, Directors of Operations and Human Resources staff. The purpose of this group is to provide a forum for Staff Side to hear about and raise issues about the Trust’s strategic and operational plans, policies and procedures.
TVS Tissue Viability Service
UHB University Hospitals Birmingham NHS Foundation Trust
VTE Venous thromboembolism – a blood clot

University Hospitals Birmingham NHS Foundation Trust | Quality Account 2016-17 | 49
Appendix A: Performance against core indicatorsThe Trust’s performance against the national set of quality indicators jointly proposed by the Department of Health and Monitor (now NHS Improvement) is shown in the tables below. There are eight indicators which are applicable to acute trusts. The data source for all the indicators is the NHS Digital website (formerly the Health and Social Care Information Centre, or HSCIC).
Data for Indicators 2, 3 and 4 has not been updated on the NHS Digital website since the previous Quality Report. The latest available data has been provided for Indicators 1, 5, 6, 7 and 8. Data is displayed in the same format as found on the NHS Digital website. National comparative data is included where available.
1. Mortality
Previous Period (Jul 2015–Jun 2016)
Current period (Oct 2015–Sep 2016)
UHB UHBNational Performance
Overall Best Worst
(a) Summary Hospital-level Mortality Indicator (SHMI) value
1.03 1.06 1.00 0.69 1.16
(a) SHMI banding 2 2 — 3 1
(b) Percentage of patient deaths with palliative care coded at diagnosis or specialty level
28.08 29.08 29.57 0.39 56.27
CommentThe Trust considers that this data is as described for the following reasons as this is the latest available on the NHS Digital (HSCIC) website. The Trust intends to take the following actions to improve this indicator, and so the quality of its services, by continuing with the technical approach UHB takes to improving quality detailed in this report.
The Trust does not specifically try to reduce mortality as such but has robust processes in place, using more recent data, for monitoring mortality as detailed in Part 3 of this report. It is important to note that palliative care coding has no effect on the SHMI.
2. Patient Reported Outcome Measures (PROMs) – Average Health Gain
Previous Period (Apr 2014–Mar 2015)
Current period (Apr–Sep 2015)
UHB UHBNational Performance
Overall Best Worst
(i) Groin hernia surgery 0.069 0.080 0.087 0.135 0.008
(ii) Varicose vein surgery — — 0.103 0.129 0.037
(iii) Hip replacement surgery Not applicable to UHB
(iv) Knee replacement surgery Not applicable to UHB
CommentThe Trust considers that this data is as described for the following reasons as it is the latest available on the NHS Digital (HSCIC) website.
The Trust intends to take the following actions to improve this data, and so the quality of its services, by continuing to focus on improving participation rates for the pre-operative questionnaires which we have control over. Participation is shown in Part 2 as part of the audit section of this report. Figures for UHB for Varicose Vein Surgery are not available as insufficient responses were received.

50 | University Hospitals Birmingham NHS Foundation Trust | Quality Account 2016-17
3. Readmissions to hospital within 28 days
Previous Period (Apr 2010–Mar 2011)*
Current period (Apr 2011–Mar 2012)*
UHB UHBNational Performance
Overall Best Worst
(i) Patients aged 0–15 readmitted to a hospital which forms part of the trust within 28 days of being discharged from a hospital which forms part of the trust (Standardised percentage)
— — 10.01 5.86 12.50
(ii) Patients aged 16 or over readmitted to a hospital which forms part of the trust within 28 days of being discharged from a hospital which forms part of the trust (Standardised percentage)
11.60 11.54 11.45 10.64 13.55
* The Trust has included the latest data available on the NHS Digital/HSCIC website.
CommentThe Trust considers that this data (standardised percentages) is as described for the following reasons as this is the latest available on the NHS Digital (HSCIC) website. UHB is however unable to comment on whether it is correct as it is not clear how the data has been calculated.
The Trust intends to take the following actions to improve this data (standardised percentages), and so the quality of its services, by continuing to review readmissions which are similar to the original admission on a quarterly basis. UHB monitors performance for readmissions using more recent Hospital Episode Statistics (HES) data as shown in Part 3 of this report.
3(i) is not applicable to UHB as the Trust does not provide a Paediatrics service.
4. Responsiveness to the personal needs of patients
Previous Period (2013/14)
Current period (2014/15)*
UHB UHBNational Performance
Overall Best Worst
Trust’s responsiveness to the personal needs of its patients – average weighted score of 5 questions from the National Inpatient Survey (Score out of 100)
72.2 72.0 68.9 86.1 59.1
CommentThe Trust considers that this data is as described for the following reasons as it is the latest available on the NHS Digital (HSCIC) website.
The Trust intends to take the following actions to improve this data, and so the quality of its services, by continuing to collect real-time feedback from our patients as part of our local patient survey. The Board of Directors has again selected improving patient experience and satisfaction as a Trust-wide priority for improvement in 2017/18 (see Part 2 of this report for further details).

University Hospitals Birmingham NHS Foundation Trust | Quality Account 2016-17 | 51
5. Staff who would recommend the trust as a provider of care to their family and friends
Previous Period (2015)
Current period (2016)
UHB UHBNational Performance
Average (median) for acute trusts
Staff who would recommend the trust as a provider of care to their family and friends. Performance shown is based on staff who agreed or strongly agreed.
82% 81% 70%
CommentThe Trust considers that this data (scores) is as described for the following reasons as it is the latest available on the NHS Digital (HSCIC) website and performance for 2016 is consistent with 2015.
The Trust intends to take the following actions to improve this data, and so the quality of its services, by trying to maintain performance for this survey question.
6. Venous thromboembolism (VTE) risk assessment
Previous Period (Q2 2016/17)
Current period (Q3 2016/17)
UHB UHBNational Performance
Overall Best Worst
Percentage of admitted patients risk-assessed for VTE
99.5% 99.4% 98.2% 100% 65.9%
CommentThe Trust considers that this data (percentages) is as described for the following reasons as UHB has consistently performed above the national average for the past few years.
The Trust intends to take the following actions to improve this data, and so the quality of its services, by continuing to ensure our patients are risk assessed for venous thromboembolism (VTE) on admission.
7. C. difficile infection
Previous Period (2014/15)
Current period (2015/16)
UHB UHB
National Performance
Overall (England)
Best Worst
C. difficile infection rate per 100,000 bed-days (patients aged 2 or over)
38.9 38.0 40.8 0 111.1
CommentThe Trust considers that this data is as described for the following reasons as it is the latest available on the NHS Digital (HSCIC) website.
The Trust intends to take the following actions to improve this rate, and so the quality of its services, by continuing to reduce C. difficile infection through the measures outlined in Priority 5: Infection prevention and control in this report.

52 | University Hospitals Birmingham NHS Foundation Trust | Quality Account 2016-17
8. Patient Safety Incidents
Since the 2014/15 report, the rate for this indicator has changed to ‘per 1000 bed days’ from ‘per 100 admissions’.
Previous Period (Oct 2014–Mar 2015)
Current period (Oct 2015–Mar 2016)
UHB UHB
National Performance (Acute Teaching Providers)
Overall Best Worst
Incident reporting rate per 1,000 bed days 52.4 60.7 — 14 352
Number of patient safety incidents that resulted in severe harm or death
11 15 — 0 119
Rate of patient safety incidents that resulted in severe harm or death rate per 1,000 bed days
0.06 0.08 — 0.00 4.45
Note – although the table above refers to ‘best’ and ‘worst’, a high incident reporting rate can be reflective of a good, open reporting culture.
CommentThe Trust considers that this data is as described for the following reasons as the data is the latest available on the NHS Digital (HSCIC) website. UHB is however unable to comment on whether it is correct as it is not clear how the numerator (incidents) and denominator (admissions) data has been calculated.
The Trust intends to take the following actions to improve this data and so the quality of its services, by continuing to have a high incident reporting rate. The Trust routinely monitors incident reporting rates and the percentage of incidents which result in severe harm or death as shown in Part 3 of this report.

University Hospitals Birmingham NHS Foundation Trust | Quality Account 2016-17 | 53
Annex 1: Statements from commissioners, local Healthwatch organisations and Overview and Scrutiny Committees
The Trust has shared its 2016/17 Quality Report with Birmingham CrossCity Clinical Commissioning Group, Healthwatch Birmingham and Birmingham Health & Social Care Overview and Scrutiny Committee.
Birmingham CrossCity Clinical Commissioning Group, Healthwatch Birmingham and Birmingham Health & Social Care Overview and Scrutiny Committee have reviewed the Trust’s Quality Report for 2016/17 and provided the statements below.
Statement provided by Birmingham CrossCity Clinical Commissioning Group
University Hospitals Birmingham NHS Foundation Trust
Quality Account 2016/17
Statement of Assurance from Birmingham CrossCity CCG May 2017
1.1 Birmingham CrossCity Clinical Commissioning Group (BCC CCG), as coordinating commissioner for University Hospitals Birmingham NHS Foundation Trust (UHB), welcomes the opportunity to provide this statement for inclusion in the Trust’s 2016/17 Quality Account.
1.2 A draft copy of the quality account was received by BCC CCG on the 21st April and the review has been undertaken in accordance with the Department of Health Guidance. This statement of assurance has been developed in consultation with neighbouring CCGs.
1.3 In the version of the quality account we viewed some full year data was not yet available and so we have not been able to validate those areas; we assume, however, that the Trust will be populating these gaps in the final published edition of this document.
1.4 In compiling this account the Trust has provided the reader with a well laid out and clear picture regarding performance against 2016/17 priorities, which describes the initiatives implemented, identifying any changes to the priority and further actions to be undertaken going forward.
1.5 Where existing priorities are being carried forward into 2017/18 the CCG supports the Trust’s review of progress and setting of either revised or continuation of targets.
1.6 The Trust is to be congratulated for the achievement of priority 1: reducing grade 2 hospital acquired pressure ulcers. The final figure for this priority was 71 which is considerably below the target of 125.
1.7 The Trust has made a decision to remove the Infection prevention and control (IPC) priorities around MRSA Bacteraemia and Clostridium difficile infection (CDI) despite failure to achieve the targets set for 2016/17. The CCG would be keen to see the Trust maintaining
MRSA and CDI as a priority, particularly given that the peer group scores are lower than UHB’s.
1.8 The CCG supports the introduction of two new priorities – reducing harm from falls and timely treatment for sepsis in the emergency department. We look forward to hearing about the progress made in use of a new sepsis screening tool and the impact of falls training coupled with a new falls policy and guidelines.
1.9 It is pleasing to note that the Trust performance for 2016/17 for the Friends and Family Test (FFT) question on recommending the Trust is significantly higher than that of both the national average and West Midlands regional average (for both inpatients and outpatients). It is unclear from the account how the Trust intends to work on improving feedback for A&E.
1.10 It has been noted that there has been a 15% increase in complaints; the Trust has analysed the themes and determined that the ‘top 3’ remain the same as in previous years. It would be good to see information on how the Trust has learnt from complaints, including those 13 cases partially/fully upheld by the Ombudsman. Staff attitude has been identified as a regular theme for complaints, it is unclear what actions the Trust is taking to address this and indeed if this data has been triangulated with the reduction in the compliments received, particularly that of nursing care.
1.11 It was good to see that the Trust has included a section on how they have made the complaints process accessible and given examples of meeting individual needs such as provision of information in braille and large font.
1.12 The inclusion of information on Sign Up to Safety and the pledges made by the Trust was welcomed by the CCG demonstrating the Trust’s continued commitment to improving safety and reducing avoidable harm.
1.13 The Trust’s Staff Survey results show a pleasing performance for many areas, particularly the three areas where it is in the highest performing 20% of trusts. This element of the quality account would benefit from an overview of the actions being taken to address staff satisfaction, particularly where performance is below the average for acute trusts in England.
1.14 Under the ‘speciality quality indicators’ section data is provided where there have been the most notable improvements and deteriorations in performance. No information has been provided on what actions the Trust is taking to improve the deteriorating indicators.
1.15 We have made some specific comments to the Trust directly in relation to the quality account which we hope will be considered as part of the final document. These include: action being taken to improve the Information Governance score; the internal process for reviewing mortality (the role of the medical examiner

54 | University Hospitals Birmingham NHS Foundation Trust | Quality Account 2016-17
in enhancing the oversight of mortality and associated learning); revision to the Duty of Candour statement and comments on layout.
1.16 As commissioners we have worked closely with UHB over the course of 2016/17, meeting with the Trust regularly to review the organisation’s progress in implementing its quality improvement initiatives. We are committed to engaging with the Trust in an inclusive and innovative manner and are pleased with the level of engagement from the Trust. We hope to continue to build on these relationships as we move forward into 2017/18.
Barbara KingAccountable OfficerBirmingham CrossCity Clinical Commissioning Group
Statement from Healthwatch Birmingham on University Hospitals Birmingham NHS Foundation Trust Quality Account 2016/17
Healthwatch Birmingham welcomes the opportunity to provide our statement on the Quality Account for University Hospitals Birmingham NHS Foundation Trust 2016/17. In line with our role, we have focused on the following:
Î The use of patient and public insight, experience and involvement in decision-making.
Î The quality of care patients, the public, service users and carers access and how this aligns with their needs.
Î Variability in the provision of care and the impact it has on patient outcomes.
Patient experience and feedbackHealthwatch Birmingham recognises the Trust’s approach to using different methods to measure patient feedback and make improvement to services. This includes: surveys for different departments, the Friends and Family Test, complaints, concerns, and compliments. We note that the focus of Quality Priority 2 (improve patient experience and satisfaction) is to improve scores and determine what ranks as most important to patients. What we would like to see in next year’s report is:
Î An introduction of qualitative questions to the survey that will complement the statistical data the Trust collects. This will help the Trust to understand why an issue is ranked highly by patients. Consequently, qualitative data will offer greater insight to barriers patients face to receiving good quality of care.
Î A demonstration of how the Trust uses patient insight and experience to understand the barriers different groups face and the impact on health outcomes. Consequently, how this data is used to implement change or improvement that addresses the needs of these groups.
We therefore agree with the Trust’s patient experience initiatives that will be carried over into the 2017/18 Quality Account. Namely:
Î Implement the use of patient stories as a feedback and training mechanism. We note that these are now used at all patient experience group meetings, in complaints and customer relations training. Healthwatch Birmingham would like to see examples of these stories, learning that has occurred, and the impact on services.
Î Review of how patient experience data is monitored and used to drive improvement – especially examining how data ‘travels’ across the Trust.
Î Using a more project-based approach to tackle challenging aspects of patient care. Projects have been around discharge medications; communication and operations and procedures.
Î Development of a patient experience collection, analysis and reporting system in conjunction with the University of Birmingham PROMs group.

University Hospitals Birmingham NHS Foundation Trust | Quality Account 2016-17 | 55
In examining the various initiatives presented in the report around patient experience, Healthwatch Birmingham believes that the Trust has the foundation on which it can develop a strategy for involving, patients and the public in decision-making. Such a strategy will clearly outline how and why patients, the public and carers will be engaged in order to improve health outcomes and reduce health inequality. This will ensure that there is commitment across the Trust to using patient and public insight, experience and involvement. It will also make clear arrangements for collating feedback and experience. Therefore, we suggest that service user and carer’s insight and experience should be collected to not only identify barriers to improved health outcomes but also to identify and understand health inequality. We believe that a project-based approach initiative, as part of a wider strategy, will be a novel way to understand barriers to improvements in health outcomes for different groups or characteristics.
Friends and Family Test (FFT)Our review of the FFT scores for 2016/17 shows that the positive response rate for A&E has been inconsistent and has been below the national average. Conversely, the positive recommendation score for inpatients and outpatients has been above the national and regional average. Whilst we applaud the Trust for this performance for inpatients and outpatients, we believe that the difference between this and performance in A&E indicates variability in care. How people access services has an impact on their experience.
Patient Experience indicatorsAt the time of writing our response, the 2016 survey results were not available for us to comment on effectively. From the data provided, we note that many of the scores remained the same or slightly increased for 2015/16 in comparison to 2014/15. There was a slight decrease in the extent to which patients feel involved in decisions about their care and treatment; 7.7 in 2014/15 to 7.5 in 2015/16.1 Similarly, the Trust’s responsiveness to the personal needs of patients decreased slightly from 72.2% in 2013/14 to 72% in 2014/15 and this is below the best performing Trust (86.1%).
In order to make improvements, the Trust needs to ensure that service users are involved from the point of identifying the barrier to improvement in health outcomes including increasing independence and preventing worsening ill-health; and mapping out possible solutions to evaluating options and selecting the optimum solution. To do this effectively, the Trust needs to increase the number and diversity of people it’s hearing from. Therefore, the Trust should consider including the number of responses to their surveys or for the Friends and Family Test to assess performance.
ComplaintsThe report shows that the total number of complaints has increased by 15% from 680 in 2015/16 to 779 (2016/17). The top three complaints were about clinical treatment (203); communication and information (129) and attitude of staff (110). In addition, complaints for inpatients reduced from 345 in 2015/16 to 327 in
2016/17 and there was an increase for outpatients (form 245 in 2015/16 to 331 in 2016/17) and the emergency department (from 90 in 2015/16 to 121 in 2016/17). We are concerned that the number of complaints and the FFT scores for emergency department seem to reflect a need for improvement. However, we welcome the Trust’s actions taken to learn from complaints. In particular, the review of arrangements for patients with hearing and visual impairment, to try and improve all aspects of their experience. Consequently, the Trust is not only addressing the barriers but variability in care that might result in a health inequality.
The report states that the Trust aims to make the complaints process accessible to all. We would like to know what methods the Trust uses to get feedback on the complaints process and how this feedback is used to inform the necessary changes to the process?
Compliments We note that the Trust’s number of compliments received in 2016/17 (2286) decreased compared to 2015/16 (2349). What is concerning is that the number of compliments for nursing care decreased in 2016/17 (211) by more than half the number in 2015/16 (579). The Trust should consider making this topic a project so as to get an in-depth understanding of what the problem is and develop solutions to address it.
Variability in HealthcareHealthwatch Birmingham is concerned that of the five priorities agreed in 2016/17, the Trust made progress in only two (reducing pressure ulcers and improving patient experience and satisfaction). Whilst there has been some improvement in priority 3 (timely and complete observations including pain assessment), this has been inconsistent. Priority 4 (reduce medication errors) has made no progress. We agree with the Trust that, based on performance, patient experience and effectiveness of care, four of these five priorities be carried over into the 2017/18 Quality Account.
Timely and complete observations including pain assessmentWe commend the Trust for improving its performance in 2016/17 (89% from 79% in 2015/16) in the percentage of observations plus pain assessment recorded within three hours of admission or transfer to ward. However, the Trust has not met its target to increase the percentage of patients receiving pain medication (analgesia) within 30 minutes of a high pain score. There is a variability in care such that patients with the same diagnosis are receiving different treatments. Those patients receiving the pain medication within 30 minutes are accessing better quality of care and consequently better health outcomes than those not accessing this. We therefore welcome the Trust’s improvement priority for 2017/18 to increase observations and pain assessment to 95% and 85% for those receiving analgesia within 30 minutes.
Clostridium difficile Infection (CDI)The Quality report states that the Trust had 92 apportioned cases of CDI in 2016/17, 31 of which were
1. No data is provided for 2015/16 and 2016/17.

56 | University Hospitals Birmingham NHS Foundation Trust | Quality Account 2016-17
deemed lapses in care. We are concerned that cases deemed lapses in care are increasing year on year. We note that this is not a priority for 2017/18 but hope to see an update on this in the 2017/18 Quality Account. In particular, how the Trust has learnt from cases deemed lapses in care and actions taken as a result.
To conclude – Healthwatch Birmingham would like to take this opportunity to congratulate the Trust for the impact of its research findings on patient care. Consequently, for being recognised for expertise in delivering commercial research studies and winning the 2016 West Midlands NIHR Clinical Research Network (CRN) Awards.
However, a theme that has been consistent through the various data provided on complaints, experience and performance is that patients’ experience and outcome differs for inpatients, outpatients and A&E patients. We note the various initiatives the Trust will implement to address this and we hope to see an improvement in the 2017/18 Quality Account.
Andy CaveCEOHealthwatch Birmingham
Statement provided by Birmingham Health & Social Care Overview and Scrutiny Committee
The Birmingham Health & Social Care Overview and Scrutiny Committee has confirmed that it is not in a position to provide a statement on the 2016/17 Quality Report.

University Hospitals Birmingham NHS Foundation Trust | Quality Account 2016-17 | 57
Annex 2: Statement of directors’ responsibilities for the Quality Report
The directors are required under the Health Act 2009 and the National Health Service (Quality Accounts) Regulations to prepare quality accounts for each financial year.
NHS Improvement has issued guidance to NHS foundation trust boards on the form and content of annual quality reports (which incorporate the above legal requirements) and on the arrangements that foundation trust boards should put in place to support the data quality for the preparation of the quality report.
In preparing the Quality Report, directors are required to take steps to satisfy themselves that:
Î the content of the Quality Report meets the requirements set out in the NHS foundation trust annual reporting manual 2016/17 and supporting guidance
Î the content of the Quality Report is not inconsistent with internal and external sources of information including: ö board minutes and papers for the period April
2016 to May 2017 ö papers relating to quality reported to the board
over the period April 2016 to May 2017 ö feedback from the commissioners dated
11/05/2017 ö feedback from governors dated 14/02/2017 ö feedback from local Healthwatch organisations
dated 17/05/2017 ö feedback from Overview and Scrutiny Committee
dated 02/03/2017 ö the trust’s complaints report published under
regulation 18 of the Local Authority Social Services and NHS Complaints Regulations 2009, dated 18/05/2017
ö the 2015 national patient survey (published in June 2016; this is the latest available survey. The 2016 survey has been delayed and is unlikely to be published before June 2017)
ö the 2016 national staff survey March 2017 ö the Head of Internal Audit’s annual opinion over
the trust’s control environment dated 18/05/2017 ö CQC inspection report dated 15/05/2015
Î the Quality Report presents a balanced picture of the NHS foundation trust’s performance over the period covered
Î the performance information reported in the Quality Report is reliable and accurate
Î there are proper internal controls over the collection and reporting of the measures of performance included in the Quality Report, and these controls are subject to review to confirm that they are working effectively in practice
Î the data underpinning the measures of performance reported in the Quality Report is robust and reliable, conforms to specified data quality standards and prescribed definitions, is subject to appropriate scrutiny and review and
Î the Quality Report has been prepared in accordance with NHS Improvement’s annual reporting manual and supporting guidance (which incorporates the Quality Accounts regulations) as well as the standards to support data quality for the preparation of the Quality Report.
The directors confirm to the best of their knowledge and belief they have complied with the above requirements in preparing the Quality Report.
By order of the board

58 | University Hospitals Birmingham NHS Foundation Trust | Quality Account 2016-17
Annex 3: Independent Auditor’s Report on the Quality Report

University Hospitals Birmingham NHS Foundation Trust | Quality Account 2016-17 | 59

60 | University Hospitals Birmingham NHS Foundation Trust | Quality Account 2016-17


