The DICE project (February 2015-January 2018) has received funding from the EuropeanUnion’s Horizon 2020 research and innovation programme under grant agreement No. 644869
This deliverable documents the anomaly and trace checking tools from the DICE solution. It details thedevelopment and architecture of the Anomaly Detection Tool (ADT) from Task 4.2 and that of the TraceChecking (TraCT) from T4.3. The initial versions of the Regression based Anomaly Detection methodis also detailed in this deliverable. In the initial versions of these tools the main goal was to create acomprehensive and extensible yet lightweight base on which further advancements related to anomalydetection can be built. We have done this by defining the overall architecture and workflow for ADT aswell as TraCT. Furthermore, we also detail a Regression based AD solution that is able to compare andhighlight anomalies in different versions of the same application.
The document is structured as follows: the Introduction section highlights the objectives and featuresof the anomaly detection, trace checking tools as well as that of the Regression based AD method. Italso describes the contributions of these tools to DICE objectives and DICE innovation objectives. Thisis followed by the presentation of the position of the tools inside overall architecture and its interfacesto other DICE tools. The first section also highlights the achievements of the period under report. Thesecond section, Architecture and design of the tool, details the constituent components of each of thetools. The third section connects the DICE Monitoring platform to DICE use cases and requirementsidentified and presented in deliverable D1.2. Deployment and validation of the tools is tackled in section4. The last section draws final conclusions and sets the future development plans for DICE ADT andTrace Checking.
1 Example of JSON script requesting trace checking analysis for spoutA and boltA . . . . 212 JSON job descriptor . . . . . . . . . . . . . . . . . . . . . . . . . . . . . . . . . . . . . 373 Field ”node” of the JSON script used for validation experiment. . . . . . . . . . . . . . 384 Json script sent by D-Mon to DICE-TraCT. Each node name is endow with the list of
logs where it appears. . . . . . . . . . . . . . . . . . . . . . . . . . . . . . . . . . . . . 395 JSON script sent by D-Mon to DICE-TraCT. Each node name is endow with the list of
logs where it is appears. . . . . . . . . . . . . . . . . . . . . . . . . . . . . . . . . . . . 406 Event log ready for trace checking built by LM for node boltA. . . . . . . . . . . . . . . 417 Descriptor of regular expression used to parse the files. . . . . . . . . . . . . . . . . . . 418 Template of the temporal logic formula used in the validation example. . . . . . . . . . . 419 Temporal logic formula used in the validation example built from the template for node
spoutA. . . . . . . . . . . . . . . . . . . . . . . . . . . . . . . . . . . . . . . . . . . . 4210 Temporal logic formula used in the validation example built from the template for node
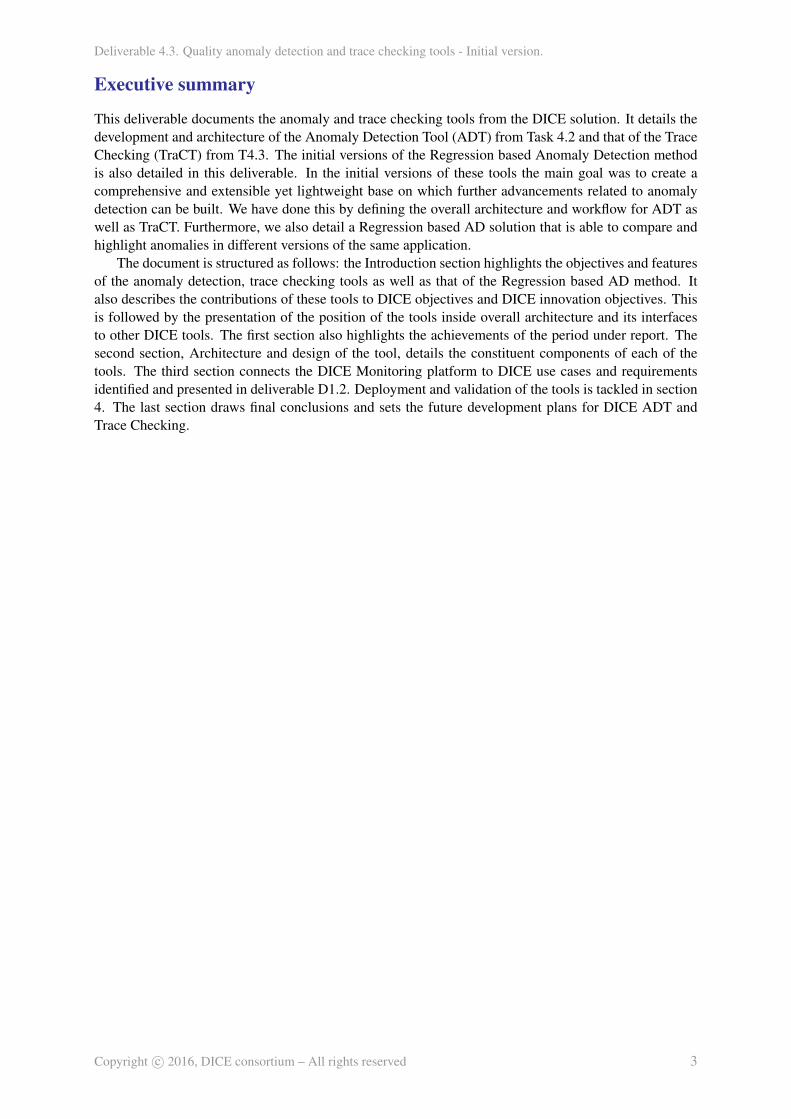
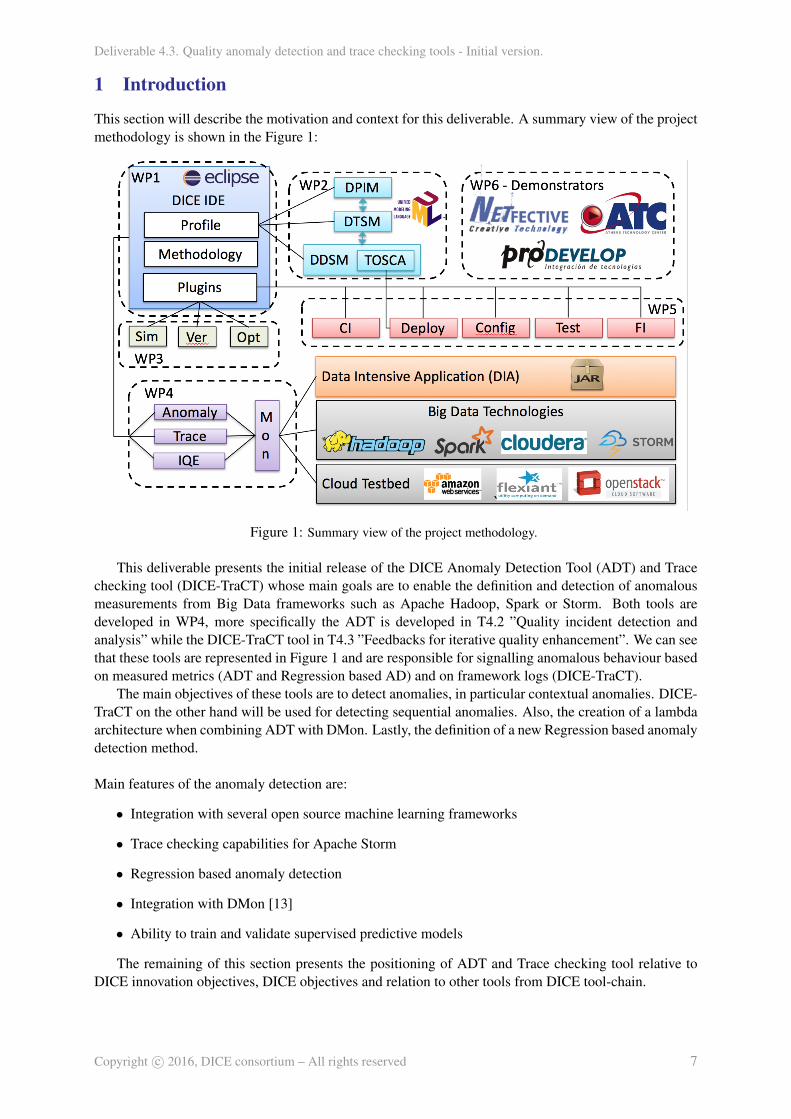
This section will describe the motivation and context for this deliverable. A summary view of the projectmethodology is shown in the Figure 1:
Figure 1: Summary view of the project methodology.
This deliverable presents the initial release of the DICE Anomaly Detection Tool (ADT) and Tracechecking tool (DICE-TraCT) whose main goals are to enable the definition and detection of anomalousmeasurements from Big Data frameworks such as Apache Hadoop, Spark or Storm. Both tools aredeveloped in WP4, more specifically the ADT is developed in T4.2 ”Quality incident detection andanalysis” while the DICE-TraCT tool in T4.3 ”Feedbacks for iterative quality enhancement”. We can seethat these tools are represented in Figure 1 and are responsible for signalling anomalous behaviour basedon measured metrics (ADT and Regression based AD) and on framework logs (DICE-TraCT).
The main objectives of these tools are to detect anomalies, in particular contextual anomalies. DICE-TraCT on the other hand will be used for detecting sequential anomalies. Also, the creation of a lambdaarchitecture when combining ADT with DMon. Lastly, the definition of a new Regression based anomalydetection method.
Main features of the anomaly detection are:
• Integration with several open source machine learning frameworks
• Trace checking capabilities for Apache Storm
• Regression based anomaly detection
• Integration with DMon [13]
• Ability to train and validate supervised predictive models
The remaining of this section presents the positioning of ADT and Trace checking tool relative toDICE innovation objectives, DICE objectives and relation to other tools from DICE tool-chain.
The focus of the DICE project is to define a quality-driven framework for developing data-intensiveapplications that leverage Big Data technologies hosted in private or public clouds. DICE will offer anovel profile and tools for data-aware quality-driven development. The methodology will excel for itsquality assessment, architecture enhancement, agile delivery and continuous testing and deployment,relying on principles from the emerging DevOps paradigm. The DICE anomaly detection and tracechecking tools contribute to all core innovations of DICE, as follows:
I1: Tackling skill shortage and steep learning curves in quality-driven development of data- intensivesoftware through open source tools, models, methods and methodologies.
ADT and Regression based AD will enable the detection and alerting of anomalous behaviourduring data intensive application development. DICE-TraCT on the other hand will deal withsequential anomalies identified from log data. This will help identify quality related anomaliesand signal these, in essence making the debugging and identification of performance bottlenecksmuch easier.
I2: Shortening the time to market for data-intensive applications that meet quality requirements, thusreducing costs for ISVs while at the same time increasing value for end-users.
Several tools and actors profit from the information (anomalies) signalled by ADT and DICE-TraCT, thus using the detected anomalies in their initial setup.
I3: Decreasing costs to develop and operate data-intensive cloud applications, by defining algorithmsand quality reasoning techniques to select optimal architectures, especially in the early develop-ment stages, and taking into account SLAs.
By detecting quality and performance related anomalies operational costs can be reduced by theoptimized version of the application. At the same time other tools may use the detected anoma-lies to provide feedback to the end user/developer and the output of these optimization tools canprovide significant financial and performance advantages.
I4: Reducing the number and severity of quality-related incidents and failures by leveraging DevOps-inspired methods and traditional reliability and safety assessment to iteratively learn applicationruntime behaviour.
Runtime application behaviour is collected by DMon which is then used as a data source for ADTpermitting the timely detection of quality-related incidents.
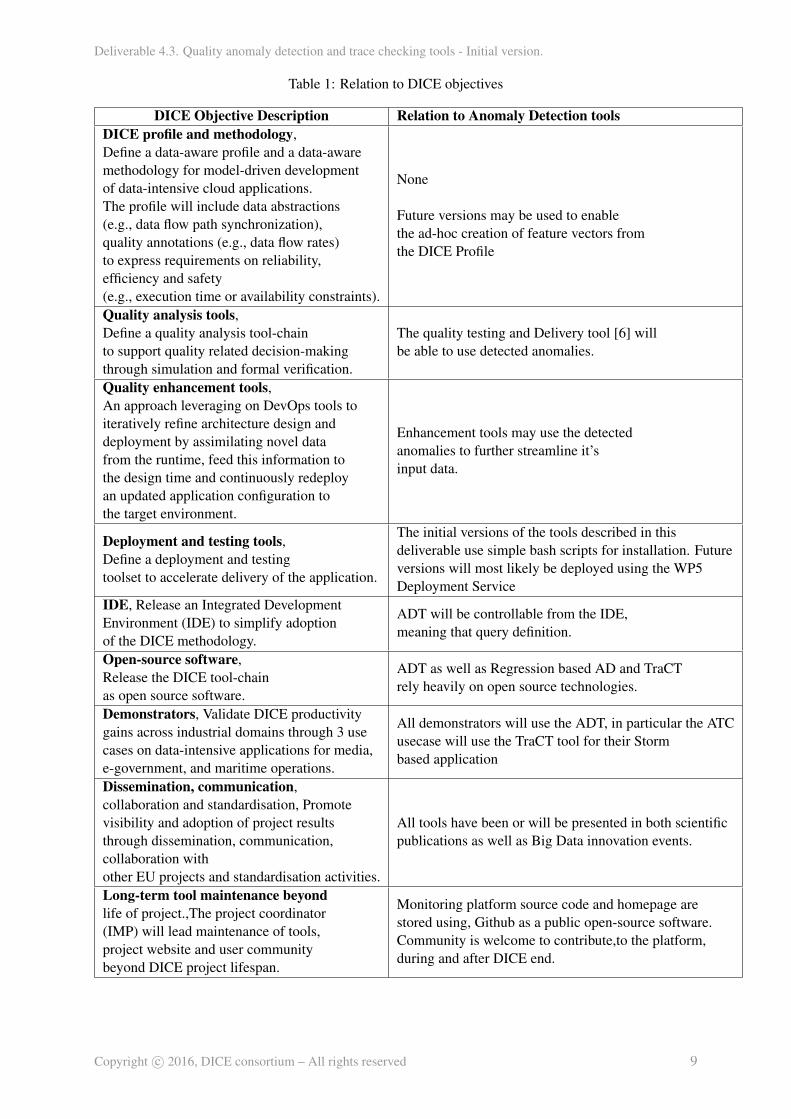
1.2 Relation to DICE objectives
The following table 1 highlights the contributions of ADT and Trace checking tool to DICE objec-tives.
1.3 Relation to DICE Tools
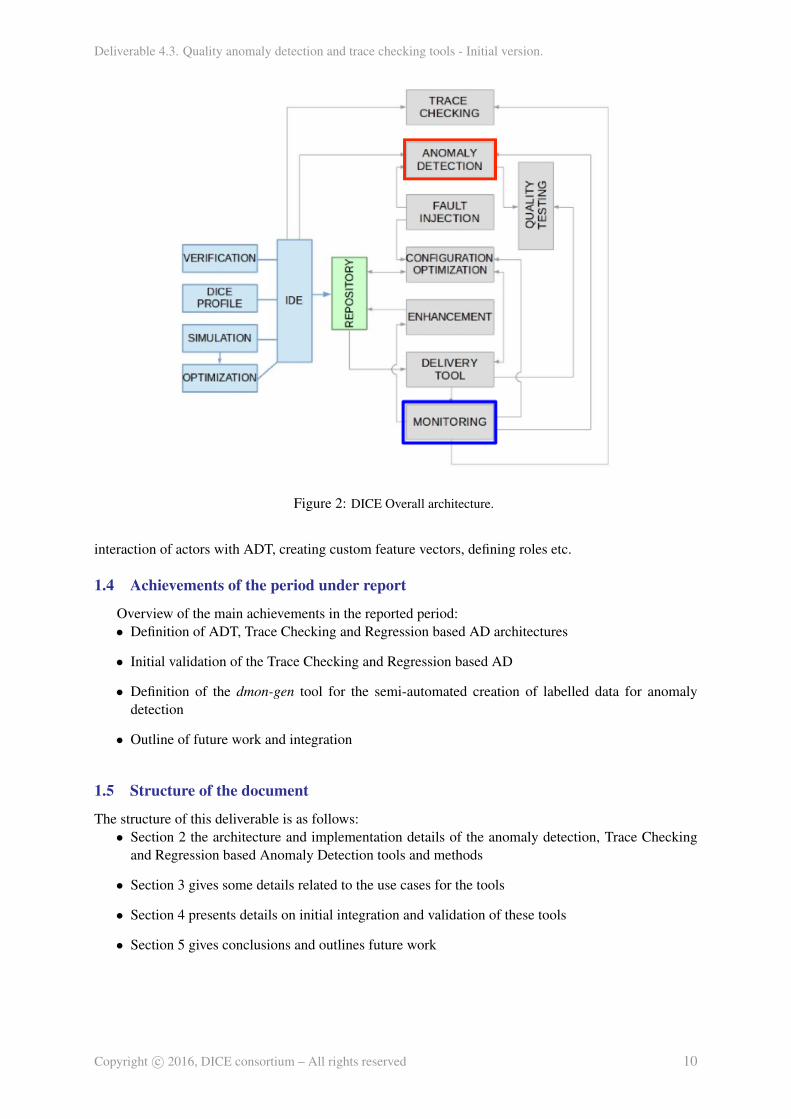
Figure 2 illustrates the interfaces between the ADT (marked with red) and the rest of the DICEsolution. The main goal of ADT is to detect inconsistencies at runtime and on historical data for jobs andservices in data intensive applications. It is meant to provide a powerful but still light weight solution forboth developers, architects and software engineers.
As mentioned in the deliverable D4.1 [13], there exists a tight integration between DMon and ADTas these two tools will for the basis of a lambda type architecture. DMon is the serving layer whileinstances of ADT can take the role of both speed and batch layers.
Other tools that make us of ADT are: Fault Injection, Quality Testing and IDE. The fault injectiontool is able to produce system level anomalies which can be used by ADT for the creation of training/-validation datasets. Quality testing tool will use the detected anomalies while the IDE will permit the
DICE Objective Description Relation to Anomaly Detection toolsDICE profile and methodology,Define a data-aware profile and a data-awaremethodology for model-driven developmentof data-intensive cloud applications.The profile will include data abstractions(e.g., data flow path synchronization),quality annotations (e.g., data flow rates)to express requirements on reliability,efficiency and safety(e.g., execution time or availability constraints).
None
Future versions may be used to enablethe ad-hoc creation of feature vectors fromthe DICE Profile
Quality analysis tools,Define a quality analysis tool-chainto support quality related decision-makingthrough simulation and formal verification.
The quality testing and Delivery tool [6] willbe able to use detected anomalies.
Quality enhancement tools,An approach leveraging on DevOps tools toiteratively refine architecture design anddeployment by assimilating novel datafrom the runtime, feed this information tothe design time and continuously redeployan updated application configuration tothe target environment.
Enhancement tools may use the detectedanomalies to further streamline it’sinput data.
Deployment and testing tools,Define a deployment and testingtoolset to accelerate delivery of the application.
The initial versions of the tools described in thisdeliverable use simple bash scripts for installation. Futureversions will most likely be deployed using the WP5Deployment Service
IDE, Release an Integrated DevelopmentEnvironment (IDE) to simplify adoptionof the DICE methodology.
ADT will be controllable from the IDE,meaning that query definition.
Open-source software,Release the DICE tool-chainas open source software.
ADT as well as Regression based AD and TraCTrely heavily on open source technologies.
Demonstrators, Validate DICE productivitygains across industrial domains through 3 usecases on data-intensive applications for media,e-government, and maritime operations.
All demonstrators will use the ADT, in particular the ATCusecase will use the TraCT tool for their Stormbased application
Dissemination, communication,collaboration and standardisation, Promotevisibility and adoption of project resultsthrough dissemination, communication,collaboration withother EU projects and standardisation activities.
All tools have been or will be presented in both scientificpublications as well as Big Data innovation events.
Long-term tool maintenance beyondlife of project.,The project coordinator(IMP) will lead maintenance of tools,project website and user communitybeyond DICE project lifespan.
Monitoring platform source code and homepage arestored using, Github as a public open-source software.Community is welcome to contribute,to the platform,during and after DICE end.
The following section will detail the overall architecture, implementation as well as the requirementcoverage of each tool. IT Also covers the main rationale behind the necessity of each tool as well as theinteraction between them and the overall DICE toolchain.
2.1 Anomaly detection tool
Anomaly Detection is an important component involved in performance analysis of data intensive ap-plications. We define an anomaly as an observation that does not conform to an expected pattern [7, 8].Most tools or solutions such as Sematex1, Datadog2 etc. are geared more towards a production envi-ronment in contrast to this the DICE Anomaly Detection Tool (ADT) is designed to be used during thedevelopment phases of big data applications.
2.1.1 Big Data framework metrics data
In DICE most data preprocessing activities will be done within DMon [13]. However, some additionalpreprocessing such as normalisation or filtering will have to be applied at method level.
In anomaly detection the nature of the data is a key issue. There can be different types of data suchas: binary, categorical or continuous. In DICE we deal mostly with the continuous data type althoughcategorical or even binary values could be present. Most metrics data relate to computational resourceconsumption, execution time etc.. There can be instances of categorical data that denotes the status/stateof a certain job or even binary data in the form of boolean values. This makes the creation of data sets onwhich to run anomaly detection an extremely crucial aspect of ADT, because some anomaly detectionmethods don’t work on categorical or binary attributes.
It is important to note that most, if not all, anomaly detection techniques and tools, deal with pointdata, meaning that no relationship is assumed between data instances [8]. In some instances this assump-tion is not valid as there can be spatial, temporal or even sequential relationships between data instances.This in fact is the assumption we are basing ADT on with regard to the DICE context.
All data in which the anomaly detection techniques will use are queried from DMon. This meansthat some basic statistical operations (such as aggregations, median etc.) can already be integrated intothe DMon query. In some instances this can reduce the dataset size in which to run anomaly detection.
2.1.2 Types of anomalies
An extremely important aspect of detecting anomalies in any problem domain is the definition of theanomaly types that can be handled by the proposed method or tool. In the next paragraphs we will givea short definition of the classification of anomalies in relation to the DICE context.
First we have point anomalies which are the simplest types of anomalies, represented by data in-stances that can be considered anomalous with respect to the rest of the data [7]. Because this type ofanomaly is simple to define and check a big part of research effort will be directed towards finding them.We intend to further investigate this type of anomalies and consider them for inclusion in DICE ADT.However, as there are a lot of existing solutions already on the market this will not be the main focus ofADT instead we will use the Watcher3 solution from the ELK stack to detect point anomalies.
A more interesting type of anomalies in relation with DICE are the so called contextual anomalies.These are considered anomalous only in a certain context and not otherwise. The context is a result ofthe structure from the data set. Thus, it has to be specified as part of the problem formulation [19, 7].When defining the context we consider; contextual attributes which are represented by the neighbours ofeach instance and behavioural attributes which describe the value itself. In short anomalous behaviour isdetermined using the values for the behavioural attributes from within the specified context [7]. In DICEmost data is time-series data which is the most common type of data in which contextual anomalies can
occur. Also, the meaningfulness of contextual anomalies is heavily dependant of the target applicationdomain. Because of this in the context of our tool we must have a set of anomalies for each of theBig Data services covered in DICE project. In this deliverable the main focus is on creating a basicframework that enables ad-hoc definition of context rather than an exhaustive list of predefined ones.Future work will also feature some instances of these predefined contexts and anomalies.
The last types of anomalies are called collective anomalies. These anomalies can occur when acollection of related data instances are anomalous with respect to the entire data set. In other words,individual data instances are not anomalous by themselves. Typically collective anomalies are related tosequence data and can only occur if data instances are related. In ADT these types of anomalies will behandled by the Trace Checking tool (See Section 2.2).
2.1.3 Anomaly detection methods
There are a wide range of anomaly detection methods currently in use [7]. These can be split up intotwo distinct categories based on how they are trained. First there are the methods used in supervisedmethods. In essence these can be considered as classification problems in which the goal is to train acategorical classifier that is able to output a hypothesis about the anomality of any given data instances.These classifiers can be trained to distinguish between normal and anomalous data instances in a givenfeature space. These methods do not make assumptions about the generative distribution of the eventdata, they are purely data driven. Because of this the quality of the data is extremely important.
For supervised learning methods labelled anomalies from application data instances are a prereq-uisite. False positives frequency is high in some instances, this can be mitigated by comprehensivevalidation/testing. Computational complexity of validation and testing can be substantial and representsa significant challenge which has been taken into consideration during in the ADT tool. Method usedfor supervised anomaly detection include but are note limited to: Neural Networks, Neural Trees, ART1,Radial Basis Function, SVM, Association Rules and Deep Learning based techniques.
In unsupervised anomaly detection methods the base assumption is that normal data instances aregrouped in a cluster in the data while anomalies don’t belong to any cluster. This assumption is usedin most clustering based methods [16, 17] such as: DEBSCAN, ROCK, SNN FindOut, WaveCluster.The second assumption [7, 20] on which K-Means, SOM, Expectation Maximization (EM) algorithmsare based is that normal data instances belong to large and dense clusters while anomalies in small andspars ones. It is easy to see that the effectiveness of each of unsupervised, or clustering based, methodis largely based in the effectiveness of individual algorithms in capturing the structure of normal datainstances.
It is important to note that these types of methods are not designed with anomaly detection in mind.The detection of anomalies is more often than not a by product of clustering based techniques. Also, thecomputational complexity in the case of clustering based techniques can be a serious issue and carefulselection of the distance measure used is a key factor.
Anomaly detection libraries
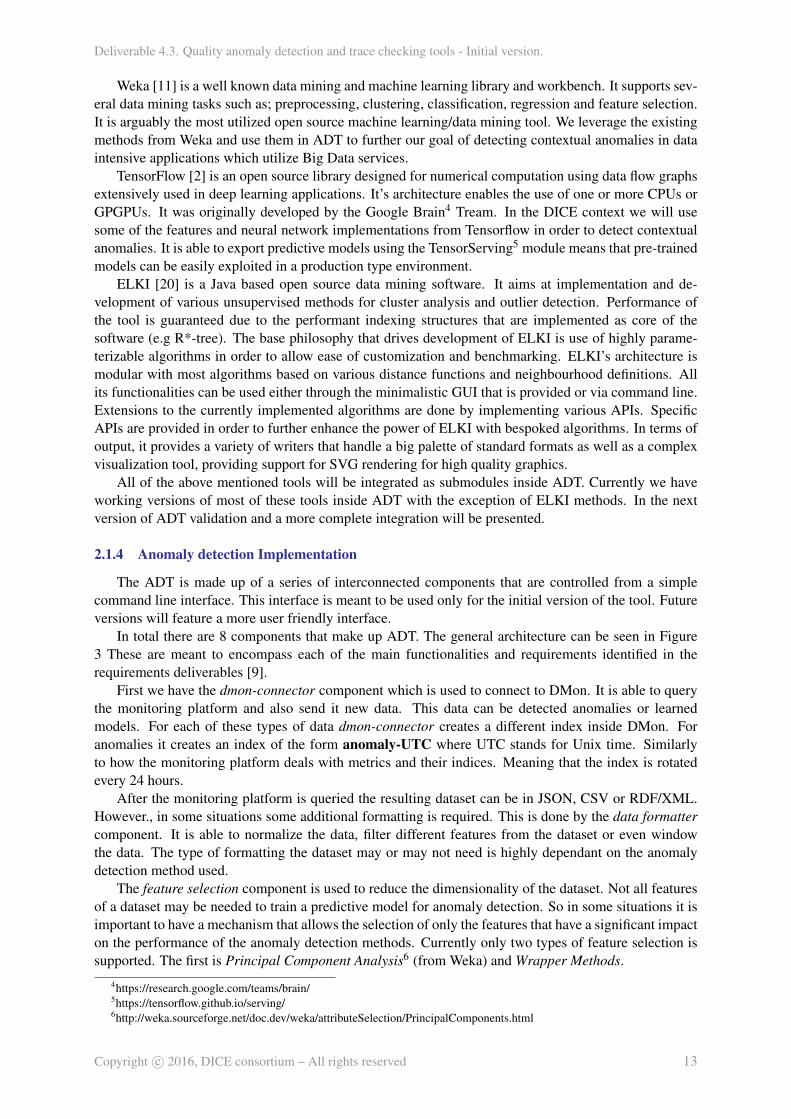
In recent years there have been a great deal of general machine learning frameworks developed.These can deal with a wide range of problems. One of the problem domains that can be tackled usingthem is that of anomaly detection. It is important to mention that we will use not only bespoked anomalydetection libraries/methods but also more general supervised (i.e. classification based) and unsupervised(i.e. clustering based) techniques in ADT. In Figure 3 we have a short overview of the core libraries inthe current version of ADT. For the sake of completeness we will briefly describe the machine learninglibraries used, and the rationale behind using them in ADT.
Scikit-learn [18] is a Python based open source machine learning library. Some of its core algorithmsare written in Cython to achieve performance. It has Cython wrappers around LIBSVM and LIBLIN-EAR as well as using the Numpy and Scipy modules. It is a general purpose library with minimaldependencies. It features various classification and clustering methods including DEBSCAN, k-meansand SVM.
Weka [11] is a well known data mining and machine learning library and workbench. It supports sev-eral data mining tasks such as; preprocessing, clustering, classification, regression and feature selection.It is arguably the most utilized open source machine learning/data mining tool. We leverage the existingmethods from Weka and use them in ADT to further our goal of detecting contextual anomalies in dataintensive applications which utilize Big Data services.
TensorFlow [2] is an open source library designed for numerical computation using data flow graphsextensively used in deep learning applications. It’s architecture enables the use of one or more CPUs orGPGPUs. It was originally developed by the Google Brain4 Tream. In the DICE context we will usesome of the features and neural network implementations from Tensorflow in order to detect contextualanomalies. It is able to export predictive models using the TensorServing5 module means that pre-trainedmodels can be easily exploited in a production type environment.
ELKI [20] is a Java based open source data mining software. It aims at implementation and de-velopment of various unsupervised methods for cluster analysis and outlier detection. Performance ofthe tool is guaranteed due to the performant indexing structures that are implemented as core of thesoftware (e.g R*-tree). The base philosophy that drives development of ELKI is use of highly parame-terizable algorithms in order to allow ease of customization and benchmarking. ELKI’s architecture ismodular with most algorithms based on various distance functions and neighbourhood definitions. Allits functionalities can be used either through the minimalistic GUI that is provided or via command line.Extensions to the currently implemented algorithms are done by implementing various APIs. SpecificAPIs are provided in order to further enhance the power of ELKI with bespoked algorithms. In terms ofoutput, it provides a variety of writers that handle a big palette of standard formats as well as a complexvisualization tool, providing support for SVG rendering for high quality graphics.
All of the above mentioned tools will be integrated as submodules inside ADT. Currently we haveworking versions of most of these tools inside ADT with the exception of ELKI methods. In the nextversion of ADT validation and a more complete integration will be presented.
2.1.4 Anomaly detection Implementation
The ADT is made up of a series of interconnected components that are controlled from a simplecommand line interface. This interface is meant to be used only for the initial version of the tool. Futureversions will feature a more user friendly interface.
In total there are 8 components that make up ADT. The general architecture can be seen in Figure3 These are meant to encompass each of the main functionalities and requirements identified in therequirements deliverables [9].
First we have the dmon-connector component which is used to connect to DMon. It is able to querythe monitoring platform and also send it new data. This data can be detected anomalies or learnedmodels. For each of these types of data dmon-connector creates a different index inside DMon. Foranomalies it creates an index of the form anomaly-UTC where UTC stands for Unix time. Similarlyto how the monitoring platform deals with metrics and their indices. Meaning that the index is rotatedevery 24 hours.
After the monitoring platform is queried the resulting dataset can be in JSON, CSV or RDF/XML.However., in some situations some additional formatting is required. This is done by the data formattercomponent. It is able to normalize the data, filter different features from the dataset or even windowthe data. The type of formatting the dataset may or may not need is highly dependant on the anomalydetection method used.
The feature selection component is used to reduce the dimensionality of the dataset. Not all featuresof a dataset may be needed to train a predictive model for anomaly detection. So in some situations it isimportant to have a mechanism that allows the selection of only the features that have a significant impacton the performance of the anomaly detection methods. Currently only two types of feature selection issupported. The first is Principal Component Analysis6 (from Weka) and Wrapper Methods.
Figure 3: General overview of Anomaly Detection Stack.
The next two components (see Figure 3) are used for training and then validating predictive modelsfor anomaly detection. For training a user must first select the type of method desired. The dataset is thensplit up into training and validation subsets and later used for cross validation. The ratio of validationto training size can be set during this phase. Parameters related to each method can also be set in thiscomponent.
Validation is handled by a specialized component which minimizes the risk of overfiting the modelas well as ensuring that out of sample performance is adequate. It does this by using cross validation andcomparing the performance of the current model with past ones.
Once validation is complete the model exporter component transforms the current model into a seri-alized loadable form. We will use the PMML [10] format wherever possible in order to ensure compat-ibility with as many machine learning frameworks as possible. This will also make the use of ADT in aproduction like environment much easier.
The resulting model can be fed into DMon. In fact the core services from DMon (specifically Elastic-search) have to role of a serving layer from a lambda architecture. Both detected anomalies and trainedmodels are stored in the DMon and can be queried directly from the monitoring platform. In essence thismeans that other tools from the DICE toolchain need to know only the DMon endpoint in order to seewhat anomalies have been detected.
Furthermore, the training and validation scenarios (see Figure 17) is in fact the batch layer whileunsupervised methods and/or loaded predictive models are the speed layer. Both these scenarios can beaccomplished by ADT. This integration will be further detailed in later sections.
The last component is the anomaly detection engine. It is responsible for detecting anomalies. Itis important to note the it is able to detect anomalies however it is unable to communicate them to theserving layer (i.e. DMon). It uses the dmon-connector component to accomplish this. The anomalydetection engine is also able to handle unsupervised learning methods. We can see this in Figure 3 inthat the Anomaly detection engine is in some ways a subcomponent of the model selector which selectboth pre-trained predictive models and unsupervised methods.
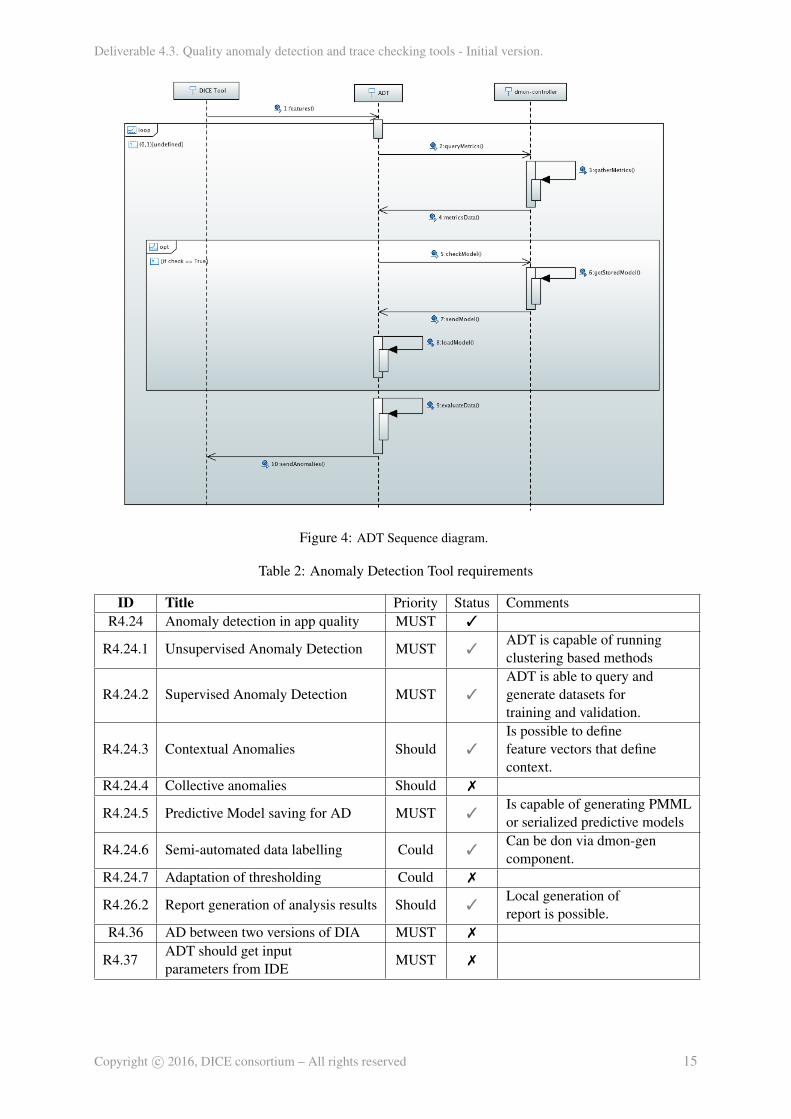
We can see in Figure 4 the sequence diagram for ADT and DMon. It is clearly observable that bothanomalies and predictive models are served and stored inside DMon.
Requirements
In table 2 we can see the current status of the requirements related to ADT. Requirements markedwith an x are still to be started while the other ones are either started (grey) or fully operational (black).
2.2 Trace checking tool
DICE Trace checking tool (DICE-TraCT) performs trace checking in the D-mon platform.Trace checking is an approach for the analysis of system executions that are recorded as sequences of
timestamped events. Collected logs are analyzed to establish whether the system logs satisfy a property,
usually specified in a logical language; in the positive case, the sampled system behavior conforms withthe constraints modeled by the property.
When the language allows temporal operators, trace checking is a way to check the correctness ofthe ordering of the events occurring in the system and of the time delays between pairs of events. Forinstance, if property requires that all the emit events of a certain bolt occur not more than ten millisecondafter the latest receive event, then checking the property over a trace results in a boolean outcome whichis positive if the distance between two consecutive and ordered pair of emit and receive events is lessthan ten milliseconds.
Trace checking is especially useful when the aggregated data that are available from the monitoringsystem are not enough to conclude the correctness of the system executions with respect to some specificcriteria. In some cases, in fact, these criteria are application dependent as they are related to some non-functional property of the application itself and they do not depend on the physical infrastructure wherethe application is executed. Trace checking is a possible technique to achieve this goal and can be usedon purpose to extract information from the executions of a running application.
Logical languages involved in the trace checking analysis are usually extensions of metric temporallogics which offer special operators called aggregating modalities. These operators hold if the tracesatisfies particular quantitative features like, for instance, a specific counting property of events in thetrace. DICE-TraCT uses Soloist [3] which offers the following class of aggregating modalities:• number of occurrences of an event e in a time window of length d,
• maximum/average number of occurrences of an event e, aggregated over right-aligned adjacentnon-overlapping subintervals (of size h) in a time window of length d,
• average time elapsed between a pair of specific adjacent and alternating events e and e’ occurringin a time window of length d.
According to the DICE vision, trace checking is performed after verification to allow for continuousmodel refinement. The result obtained through the log analysis confirms or refutes the outcome of theverification task, which is run at design time. The value of the parameters in the design-time model iscompared with the value at runtime; if the two are “compatible” then the results of verification are valid,otherwise the model must be refined. For a complete description of the model and the parameters forverification see “DICE Verification Tool – Initial version” [15].
Since verification of DICE models, reported in “DICE Verification Tool – Initial version” [15], dealsonly with Storm applications, DICE-TraCT currently supports Storm logs analysis. Next releases (M24-M36) will consider other big-data technologies and relevant properties to monitor.
2.2.1 Storm logging
The initial version of DICE-TraCT is implemented for Storm logs analysis as its functionality iscurrently tailored to the manipulation of collected logs in a Storm deployed topology. This paragraphbriefly introduces some features of the logging mechanism implemented in Storm.
Storm topologies are defined by graphs of computational nodes. “Spouts” are the data sources of atopology and always produce messages - or tuples - that are elaborated by the bolts. Bolts receive tuplesfrom one or more nodes and send their outcome to other bolts, unless they are final. In this last case, abolt does not emit tuples.
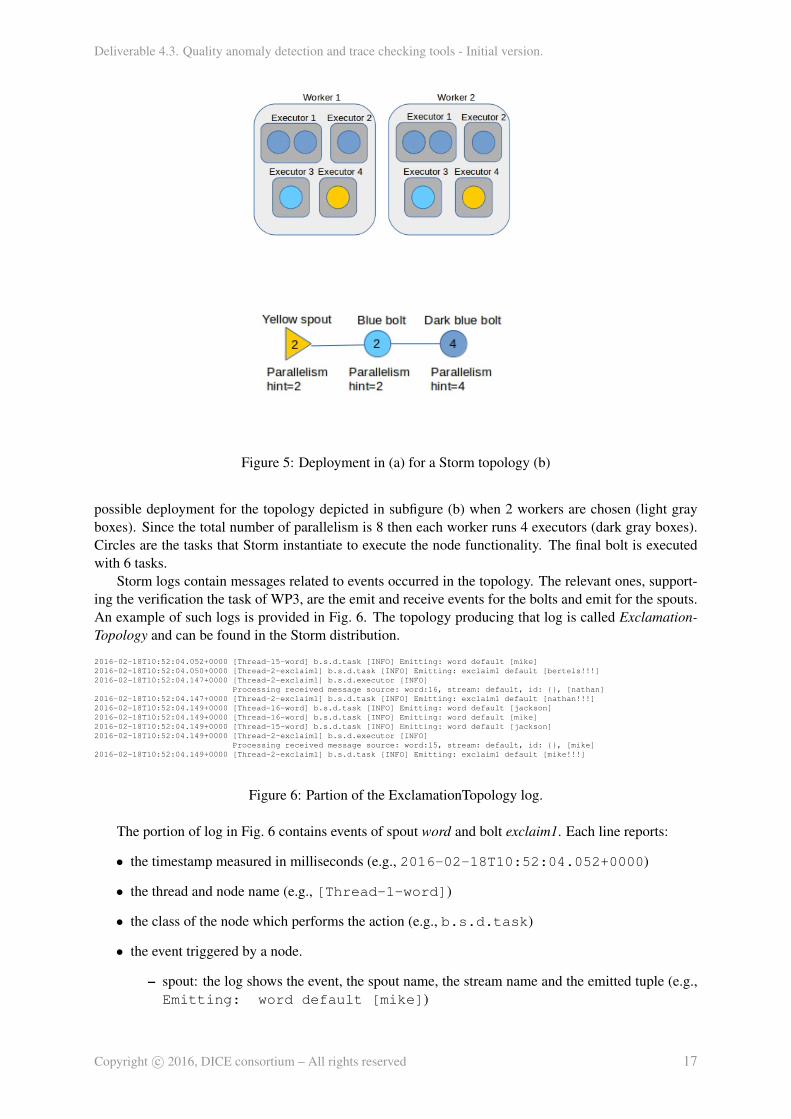
The deployment of a topology in a cluster of physical machines is realized automatically by Storm.A topology is organized by means of workers that are Java virtual machines running on some physicalmachine of the cluster. A worker executes a subset of a topology and one or more workers implement thewhole topology. For each physical machine there is at least one active worker and within each worker atleast one executor runs. An executor is a thread that is spawned by a worker and runs one or more taskswhich actually perform the data processing. Defining a topology requires the user to specify the numberof workers for the topology, the number of executors and tasks for each spout and bolt.
Figure 5 shows an example of a running topology. The running configuration, depicted in (a), is a
Figure 5: Deployment in (a) for a Storm topology (b)
possible deployment for the topology depicted in subfigure (b) when 2 workers are chosen (light grayboxes). Since the total number of parallelism is 8 then each worker runs 4 executors (dark gray boxes).Circles are the tasks that Storm instantiate to execute the node functionality. The final bolt is executedwith 6 tasks.
Storm logs contain messages related to events occurred in the topology. The relevant ones, support-ing the verification the task of WP3, are the emit and receive events for the bolts and emit for the spouts.An example of such logs is provided in Fig. 6. The topology producing that log is called Exclamation-Topology and can be found in the Storm distribution.
– bolt: the log shows the actual event along with the source node and thread id (e.g., Processingreceived message source: word:16), the stream name (e.g., default) and, finally, the id tupleand the tuple itself (e.g., d: {}, [nathan]. If id is empty when the topology is runwithout reliable message processing).
2.2.2 DICE-TraCT architecture
DICE Trace checking tool (DICE-TraCT) is the module which performs trace checking in DICE. Itis designed as a component of the anomaly detection tool so that it exploits a direct access to the D-monAPIs and to the DICE-IDE through the API exported by the anomaly detection service. DICE-TraCTcollects user requests from the DICE-IDE and, based on the information retrieved through the queriessent to the D-mon platform, executes one or more instances of trace checking. The DICE-IDE allowsthe user to select a property to verify for a selected DIA application, currently shown in the IDE, andrun the trace checking. The input format for DICE-TraCT is a JSON file which contains the name of thetopology to verify, the set of nodes that the user wants to analyze and the property to verify. The currentversion of the tool does not support user-defined properties but only those related to parameter of theverification model.
Figure 7: Architectural overview shows DICE-TraCT component within the Anomaly Detection tool.
The following section provides a detailed description of all the components implementing DICE-TraCT which is composed of three components. The architecture is depicted in Fig. 8.
Figure 8: DICE-TraCT architecure.
2.2.3 Trace Checking Engine
Trace Checking Engine (TCE) is the engine that actually performs the trace analysis. It is imple-mented in Spark and takes advantage of the distributed implementation to realize a parallel algorithm forevaluating temporal formulae over the logs. The input is a time stamped log of events and a Soloist [3]formula. The output is a boolean outcome which is the result of the evaluation of the formula over thespecified log. The positive outcome is obtained if the log satisfies the property.
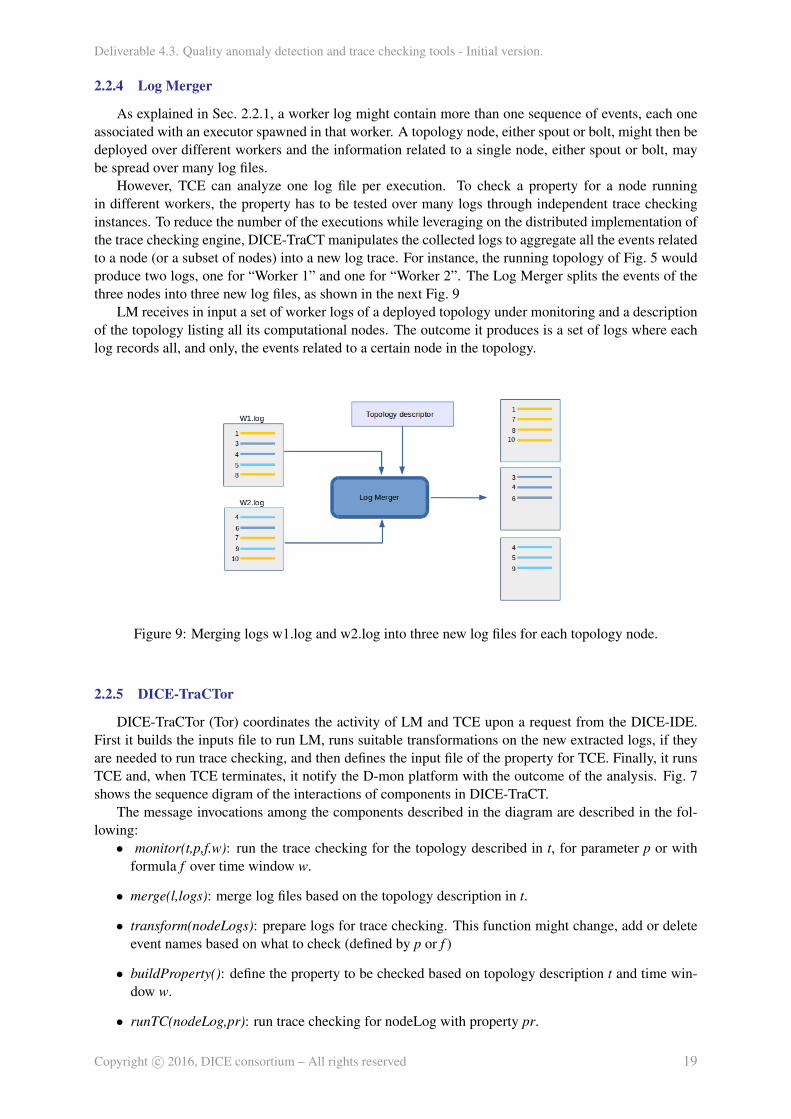
As explained in Sec. 2.2.1, a worker log might contain more than one sequence of events, each oneassociated with an executor spawned in that worker. A topology node, either spout or bolt, might then bedeployed over different workers and the information related to a single node, either spout or bolt, maybe spread over many log files.
However, TCE can analyze one log file per execution. To check a property for a node runningin different workers, the property has to be tested over many logs through independent trace checkinginstances. To reduce the number of the executions while leveraging on the distributed implementation ofthe trace checking engine, DICE-TraCT manipulates the collected logs to aggregate all the events relatedto a node (or a subset of nodes) into a new log trace. For instance, the running topology of Fig. 5 wouldproduce two logs, one for “Worker 1” and one for “Worker 2”. The Log Merger splits the events of thethree nodes into three new log files, as shown in the next Fig. 9
LM receives in input a set of worker logs of a deployed topology under monitoring and a descriptionof the topology listing all its computational nodes. The outcome it produces is a set of logs where eachlog records all, and only, the events related to a certain node in the topology.
Figure 9: Merging logs w1.log and w2.log into three new log files for each topology node.
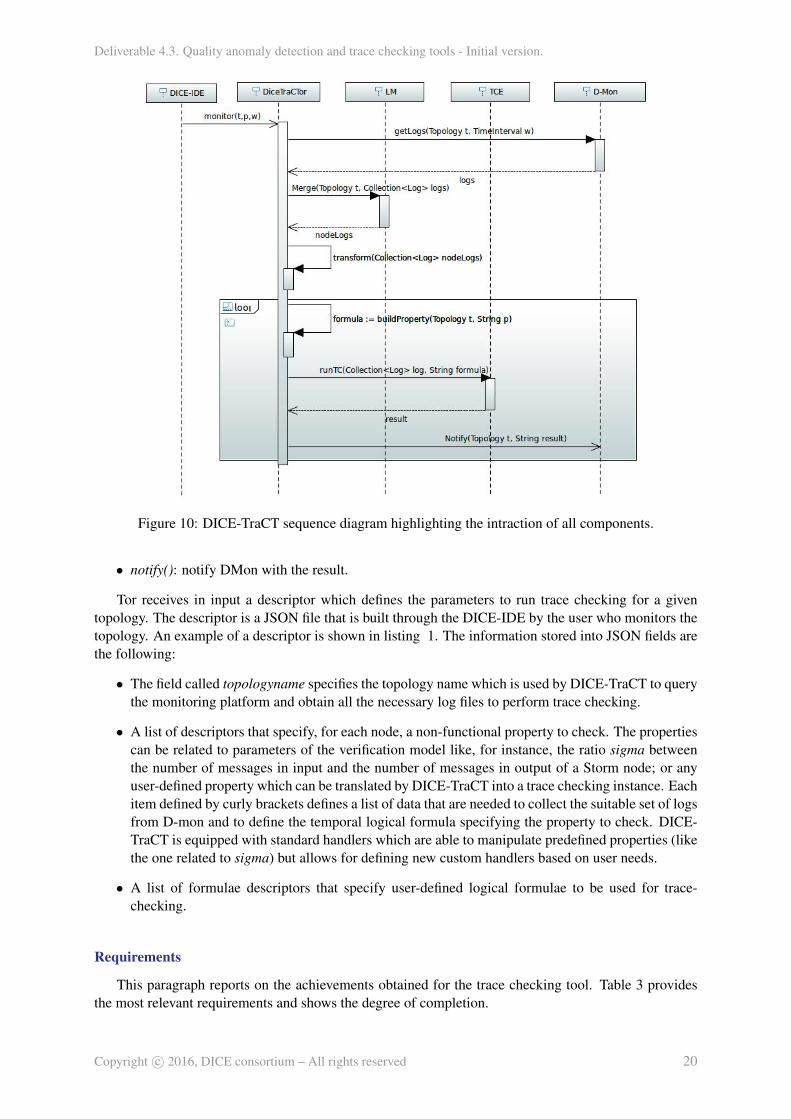
2.2.5 DICE-TraCTor
DICE-TraCTor (Tor) coordinates the activity of LM and TCE upon a request from the DICE-IDE.First it builds the inputs file to run LM, runs suitable transformations on the new extracted logs, if theyare needed to run trace checking, and then defines the input file of the property for TCE. Finally, it runsTCE and, when TCE terminates, it notify the D-mon platform with the outcome of the analysis. Fig. 7shows the sequence digram of the interactions of components in DICE-TraCT.
The message invocations among the components described in the diagram are described in the fol-lowing:• monitor(t,p,f.w): run the trace checking for the topology described in t, for parameter p or with
formula f over time window w.
• merge(l,logs): merge log files based on the topology description in t.
• transform(nodeLogs): prepare logs for trace checking. This function might change, add or deleteevent names based on what to check (defined by p or f )
• buildProperty(): define the property to be checked based on topology description t and time win-dow w.
• runTC(nodeLog,pr): run trace checking for nodeLog with property pr.
Figure 10: DICE-TraCT sequence diagram highlighting the intraction of all components.
• notify(): notify DMon with the result.
Tor receives in input a descriptor which defines the parameters to run trace checking for a giventopology. The descriptor is a JSON file that is built through the DICE-IDE by the user who monitors thetopology. An example of a descriptor is shown in listing 1. The information stored into JSON fields arethe following:
• The field called topologyname specifies the topology name which is used by DICE-TraCT to querythe monitoring platform and obtain all the necessary log files to perform trace checking.
• A list of descriptors that specify, for each node, a non-functional property to check. The propertiescan be related to parameters of the verification model like, for instance, the ratio sigma betweenthe number of messages in input and the number of messages in output of a Storm node; or anyuser-defined property which can be translated by DICE-TraCT into a trace checking instance. Eachitem defined by curly brackets defines a list of data that are needed to collect the suitable set of logsfrom D-mon and to define the temporal logical formula specifying the property to check. DICE-TraCT is equipped with standard handlers which are able to manipulate predefined properties (likethe one related to sigma) but allows for defining new custom handlers based on user needs.
• A list of formulae descriptors that specify user-defined logical formulae to be used for trace-checking.
Requirements
This paragraph reports on the achievements obtained for the trace checking tool. Table 3 providesthe most relevant requirements and shows the degree of completion.
Listing 1: Example of JSON script requesting trace checking analysis for spoutA and boltA1 {2 ” topologyname ” : ” ATopology ” ,3 ” nodes ” : [4 {5 ”name ” : ” spoutA ” ,6 ” t y p e ” : ” s p o u t ” ,7 ” p a r a m e t e r ” : ” i d l e T i m e ” ,8 ” timewindow ” : 3600 ,9 ” i n p u t r a t e ” : 100 ,
10 ” method ” : ” ” ,11 ” r e l a t i o n ” : ” ” ,12 ” d e s i g n v a l u e ” : 0 . 013 } ,14 {15 ”name ” : ” bo l tA ” ,16 ” t y p e ” : ” b o l t ” ,17 ” p a r a m e t e r ” : ” s igma ” ,18 ” timewindow ” : 3600 ,19 ” i n p u t r a t e ” : 100 ,20 ” method ” : ” c o u n t i n g ” ,21 ” r e l a t i o n ” : ”=” ,22 ” d e s i g n v a l u e ” : 1 . 123 }24 ]25 ” f o r m u l a e ” : [26 {27 . . .28 }29 ]30 }
IF Title Priority Status CommentsR4.28 Safety and privacy
properties loadingMUST 7
R4.26 Report generation ofanalysis results
Should 3 Trace checking results arestored into an output file.
R4.28 Safety and privacyproperties loading
MUST 3 User can define templates of therelevant properties and choosethem when trace checking is
invoked.R4.28.1 Definition of time
window of interestfor safety/privacy
properties
MUST 3 Storm monitoring allows theuser to select the the time
window.
R4.29 Event occurrencesdetection for safety
and privacypropertiesmonitoring
MUST 3 DICE-TraCT implements thelogic to customize how to select
events from Storm logs.
R4.30 Safety and privacypropertiesmonitoring
MUST 3 Storm monitoring is currentlysupported.
R4.30.1 Safety and privacyproperties result
reporting
MUST 3
R4.31 Feedback fromsafety and privacy
propertiesmonitoring to UML
models
Could 7
R4.30 Safety and privacypropertiesmonitoring
MUST 3 Privacy properties are notsupported yet. Safety propertiesare related to some parameters
of the verification modelR4.32 Correlation between
data stored in theDW and DICEUML models
MUST 3 The case of Storm applicationhas been studied to verify the
need of instrumenting thesource code.
2.3 Regression based Anomaly Detection
In the wake of growing complexity of data-intensive applications, market competition and pressureto deliver applications to the market as quickly as possible without decrease in their quality, applicationdevelopment lifecycle needs to be continuous, iterative, automated and cost-efficient at the same time.
SPEC group outlined the need in the performance-oriented DevOps for the enterprise applications[4]. The same stands true for the Data-Intensive Applications (DIAs). Anomaly Detection (AD) toolpresented below is devised to automatically train statistical (linear regression) models for any type ofsoftware applications (web-based, cloud, enterprise, data-intensive) or Big Data technology at each newdeployment and then look for the possible presence of anomalous behaviour by comparing the currentmodel (deployment n) with the one trained at the deployment n − 1. In other words, AD tool seeks touncover any potential anomalies that may arise after every modification of the application.
Sequential model selection algorithm employed in the model training module was adopted basedon the requirement for cost-efficiency. During application development (especially on the early stages)historical data is not available, while conducting model selection by conventional means – providing thealgorithm with the set of observations of a certain size – might be costly (as some of the data pointsmight turn out to be redundant), especially with the possible presence of interactions and/or non-linearterms which are not known in advance. Therefore, each new observation should be added only whenabsolutely necessary and also should add as much information about the system under test as possible.
The purpose of this tool/method: detect presence of performance anomalies with the elements of rootcause analysis at the application design time iteratively and in a cost-effective manner by:• Accept a set of inputs (from the developer and certain deployment information)
• Train statistical model describing application behaviour for the given performance or reliabilitymetric(s) of interest (set by the developer)
• Compare this model with the model, trained at the previous deployment and identify the presenceof anomaly(-ies), if any.
• Generate report for the developer indicating the presence/absence of performance anomalies andpossible root causes (if anomalous behaviour is detected).
• Repeat the process for each deployment version.
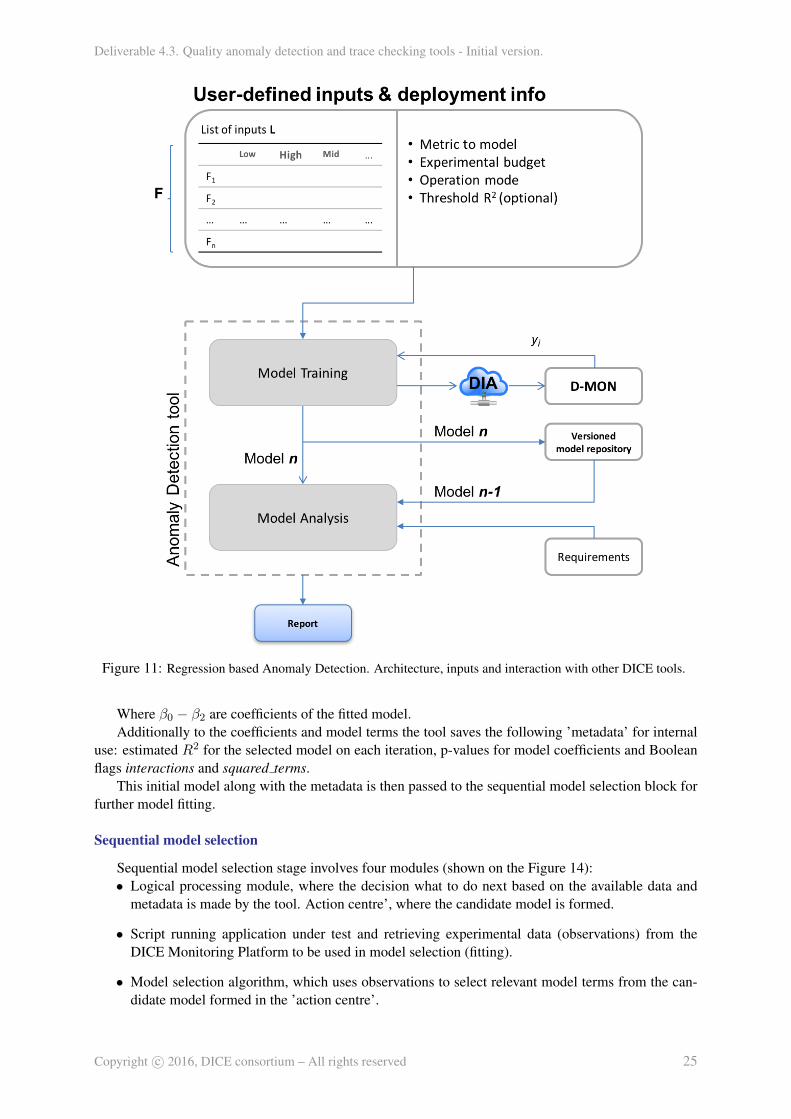
On the high level the Regression based AD tool consists of two modules: model training and modelanalysis. Model training module accepts input from the user (via IDE or DMon) along with the requireddeployment data (from the IDE translated by the DICE deployment tool [6]) and builds the statisticalmodel of the application behaviour for the performance or reliability metric defined by the user (devel-oper) at the current deployment (n). This model is then submitted to the model analysis module where itis compared to the application performance model trained at the previous deployment (n-1). Afterwards,the report is generated to inform the developer whether the anomalous behaviour is present and suggestpossible root cause(s). The high-level architecture of the Regression based AD tool is presented on theFigure 11:
Architecture and functionality for each of the modules are described in the following sections.
2.3.1 Model Training module
The purpose of this module is to train a statistical (linear regression) model capturing the behaviourof the application at the current deployment for the chosen performance or reliability metric of interest.
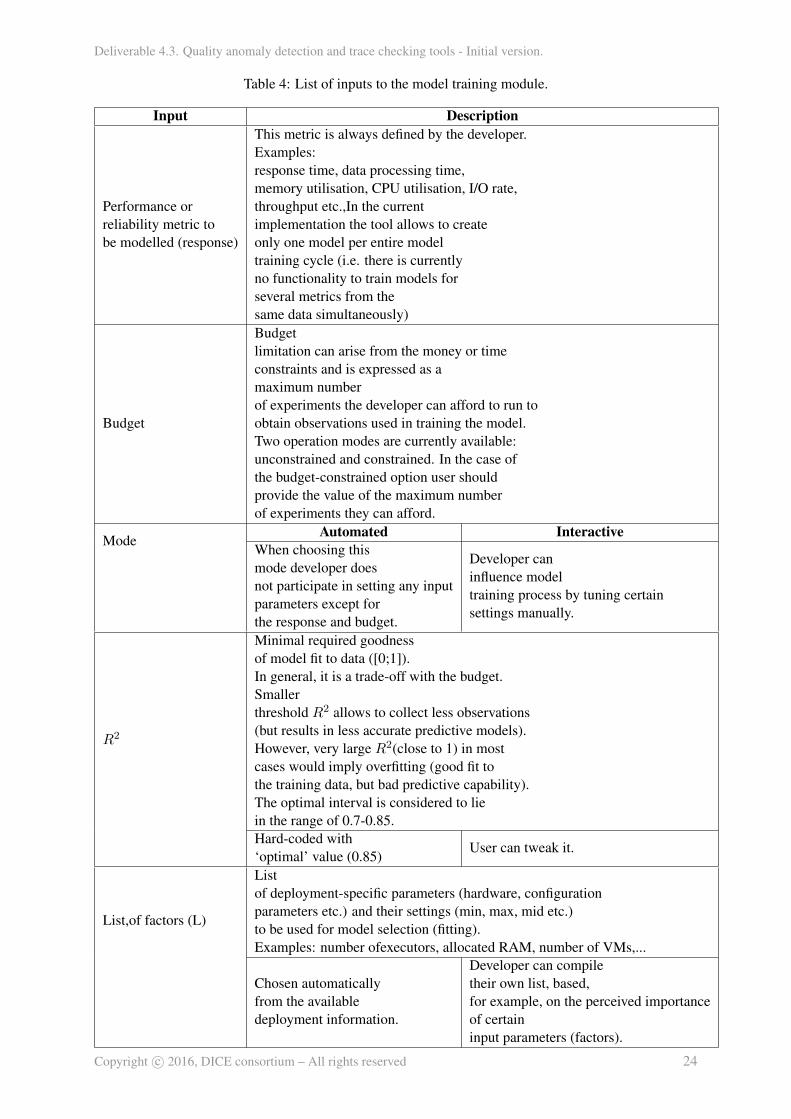
In order to do this the tool accepts a list of inputs, some of them are deployment-related informationand some are tuning/configuration parameters for the tool. These inputs can be either provided interac-tively by the developer or a set of predefined ”optimal” settings can be used instead. The list of inputparameters to the tool along with their description is given in the Table 4:
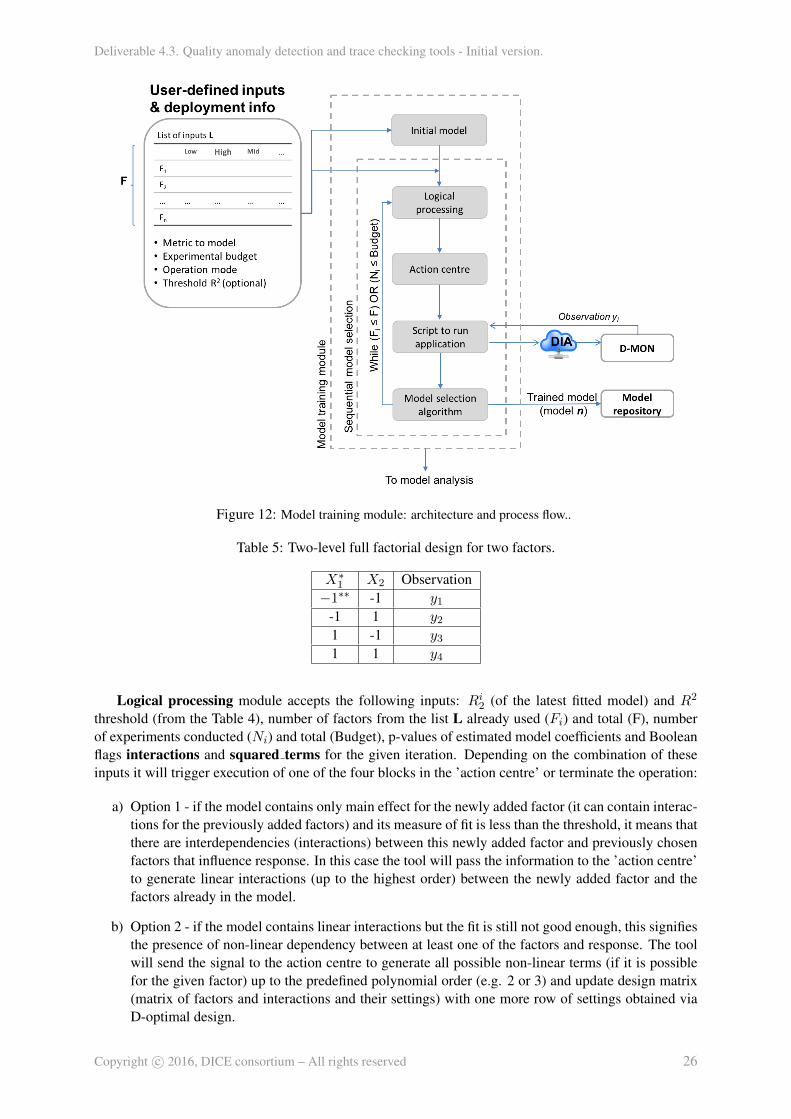
On the high-level, model training module consists of two principal parts: initial model and sequen-tial model selection. Sequential model selection block is composed of the logical processing block,’action centre’, script, running the deployed application and sequential model selection algorithm. Theirfunctionality and operation are described in details below.
Low-level architecture of the model training module combined with the process flow diagram is pre-sented on the Figure 14.
Initial Model
At this stage the tool selects two factors from the list L, creates the simplest two-level factorial design(see Table 3), runs application four times with the settings from the Table 5 to obtain observations y1−y4and fit the model (1).
This metric is always defined by the developer.Examples:response time, data processing time,memory utilisation, CPU utilisation, I/O rate,throughput etc.,In the currentimplementation the tool allows to createonly one model per entire modeltraining cycle (i.e. there is currentlyno functionality to train models forseveral metrics from thesame data simultaneously)
Budget
Budgetlimitation can arise from the money or timeconstraints and is expressed as amaximum numberof experiments the developer can afford to run toobtain observations used in training the model.Two operation modes are currently available:unconstrained and constrained. In the case ofthe budget-constrained option user shouldprovide the value of the maximum numberof experiments they can afford.
ModeAutomated Interactive
When choosing thismode developer doesnot participate in setting any inputparameters except forthe response and budget.
Developer caninfluence modeltraining process by tuning certainsettings manually.
R2
Minimal required goodnessof model fit to data ([0;1]).In general, it is a trade-off with the budget.Smallerthreshold R2 allows to collect less observations(but results in less accurate predictive models).However, very large R2(close to 1) in mostcases would imply overfitting (good fit tothe training data, but bad predictive capability).The optimal interval is considered to liein the range of 0.7-0.85.Hard-coded with‘optimal’ value (0.85)
User can tweak it.
List,of factors (L)
Listof deployment-specific parameters (hardware, configurationparameters etc.) and their settings (min, max, mid etc.)to be used for model selection (fitting).Examples: number ofexecutors, allocated RAM, number of VMs,...
Chosen automaticallyfrom the availabledeployment information.
Developer can compiletheir own list, based,for example, on the perceived importanceof certaininput parameters (factors).
Figure 11: Regression based Anomaly Detection. Architecture, inputs and interaction with other DICE tools.
Where β0 − β2 are coefficients of the fitted model.Additionally to the coefficients and model terms the tool saves the following ’metadata’ for internal
use: estimated R2 for the selected model on each iteration, p-values for model coefficients and Booleanflags interactions and squared terms.
This initial model along with the metadata is then passed to the sequential model selection block forfurther model fitting.
Sequential model selection
Sequential model selection stage involves four modules (shown on the Figure 14):• Logical processing module, where the decision what to do next based on the available data and
metadata is made by the tool. Action centre’, where the candidate model is formed.
• Script running application under test and retrieving experimental data (observations) from theDICE Monitoring Platform to be used in model selection (fitting).
• Model selection algorithm, which uses observations to select relevant model terms from the can-didate model formed in the ’action centre’.
Figure 12: Model training module: architecture and process flow..
Table 5: Two-level full factorial design for two factors.
X∗1 X2 Observation
−1∗∗ -1 y1-1 1 y21 -1 y31 1 y4
Logical processing module accepts the following inputs: Ri2 (of the latest fitted model) and R2
threshold (from the Table 4), number of factors from the list L already used (Fi) and total (F), numberof experiments conducted (Ni) and total (Budget), p-values of estimated model coefficients and Booleanflags interactions and squared terms for the given iteration. Depending on the combination of theseinputs it will trigger execution of one of the four blocks in the ’action centre’ or terminate the operation:
a) Option 1 - if the model contains only main effect for the newly added factor (it can contain interac-tions for the previously added factors) and its measure of fit is less than the threshold, it means thatthere are interdependencies (interactions) between this newly added factor and previously chosenfactors that influence response. In this case the tool will pass the information to the ’action centre’to generate linear interactions (up to the highest order) between the newly added factor and thefactors already in the model.
b) Option 2 - if the model contains linear interactions but the fit is still not good enough, this signifiesthe presence of non-linear dependency between at least one of the factors and response. The toolwill send the signal to the action centre to generate all possible non-linear terms (if it is possiblefor the given factor) up to the predefined polynomial order (e.g. 2 or 3) and update design matrix(matrix of factors and interactions and their settings) with one more row of settings obtained viaD-optimal design.
c) Option 3 - the situation when current model contains both interactions and/or non-linear terms,but the fit still hasn’t reached the threshold means that the number of available data points (obser-vations) is less than the number of significant model parameters. In this case the tool will updatedesign matrix with one more row of settings obtained via D-optimal design.
d) Option 4 – when the measure of fit is finally satisfactory for the selected model, the tool addsone more factor (only the main effect) and updates design matrix with one more row of settingsobtained via D-optimal design.
e) When either the tool has sifted through all factors from the list L or ran out of the experimen-tal budget, the model training process terminates and the model is exported and saved as a datastructure (cell array).
Boolean flags interactions and squared terms mentioned above are used by the logical processingmodule to identify the composition of the model fitted on each iteration (i.e. the terms it contains) anduse this information in the decision-making process.
In the ’action centre’ candidate model for the terms selection is formed based on the informationsent from the logical processing block using D-optimal design [14]. D-optimal design aims to find thefactors’ settings which would allow to obtain an observation (after running the application with thesesettings) that would be the most useful for model selection.
Model selection algorithm builds on the idea of creating the model in the situation where the numberof available observations is less than the size of the candidate model (from which algorithm aims to selectonly relevant terms). There are a number of methods available, but Dantzig Selector (DS) [5] was chosendue to it employing the so-called non-asymptotic bounds. Other model selection methods operating onsmall samples (e.g. Lasso [21], ridge regression [12]) assume that sample statistics (mean, variance)can be accepted for population statistics in obtaining estimators (model coefficients). This assumptionnegatively affects accuracy of the asymptotic bounds used by the optimization algorithms in [21], [12] toestimate model coefficients and, as a consequence, prediction accuracy of the resulting model. DantzigSelector, on the other hand, employs approximation theory to quantify approximation error arising fromusing the sample mean and variance instead of the population mean and variance for the estimator. Thisapproximation error, in essence, describes the discrepancy between the approximated model (the modelthat will be fit) and ‘true’ model (the unknown model that accurately describes the process in the system),which is then added to the bounds in the optimisation algorithm for finding estimators.
However, all mentioned model selection methods rely on the tuning parameter λ (lambda), whichcontrols the magnitude of estimated coefficients (whether these coefficients are above or below the noiselevel and, hence, should be selected into the model or discarded). Therefore, DS could not be used on itsown (as optimal is unknown). This issue was addressed by fitting the model with Lasso before DS, asits Matlab implementation provides an entire coefficient path with the range of lambda values (i.e. notone model, but a range of models, each with its own estimated λ). Then DS can be implemented foreach value in this narrow range of lambdas. Like other model selection methods, DS does not provideaccurate estimates of model coefficients, they are ’shrunk’ (reduced) by the value of λ (soft-thresholding).Therefore, an approach widely applied in Machine Learning is used: after the model is selected (for eachλ provided by Lasso), chosen model terms are fit with OLS (Ordinary Least Squares) and the model withthe highest R2 (with account for overfitting and possible multicollinearity) is then chosen.
The tool continues to sequentially select the ’best’ model until one of the two following conditionsis met:
• All factors from the list L are investigated and the satisfactory fit is achieved;
• The tool still hasn’t got through all factors, but exceeded the experimental budget (e.g. because thenumber of factors on the list L was larger than available experimental budget).
After the model selection process is finished, the tool checks coefficients’ p-values to remove statis-tically insignificant terms (some of the terms in the resulting model still can be ‘noise’) and then saves
(a) Model Analysis module. Architecture (b) Model Analysis module. Process flow diagram
Figure 13: A figure with Architecture and Flow Diagram
the model as a data structure (cell array). The data structure contains application deployment versionnumber and the list of model terms with an array of respective coefficients.
This model is then used as an input (the model of the application at the deployment n) for the modelanalysis module.
2.3.2 Model Analysis module
After the linear regression model of the application at the deployment n for the performance orreliability metric of interest is created and saved as a data structure (cell array), the next step is to identifywhether there is an anomaly present in the modified application.
Model Analysis (MA) module accepts as inputs two linear regression models and compares them.The first model is of the application at the previous deployment (n−1) stored externally as a data structure(cell array), and the second is of the current deployment (n) created and saved on the model training step.The principle of the anomaly detection procedure implemented in the DICE AD tool utilises the well-known property of the linear regression models. Namely, that each model term (and its correspondingcoefficient) can be interpreted as a predicted change in response caused by the corresponding input whenall other inputs are fixed.
This means that comparison of the models can be carried out term by term. After the comparison isfinished, MA module generates report for the developer.
The high-level diagram of the MA module and the process flow are shown on the Figures 13a and13b respectively.
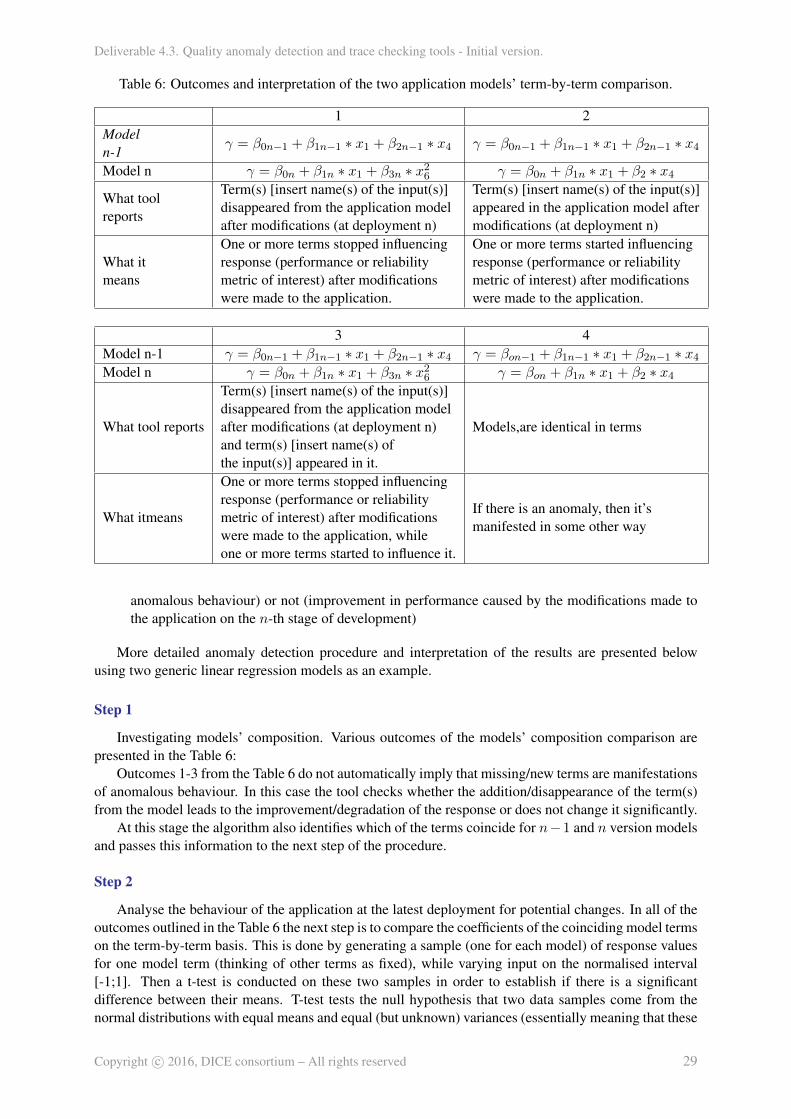
Process flow diagram shown on the Figure 13b demonstrates that model analysis is undertaken inthree principal stages:• Detection of model terms missing from the new model (n) and/or new ones which were not present
in the model of the previous deployment (n− 1);
• Detection if there is a change in the response (performance or reliability metric) caused by any ofthe model terms by comparing coefficients for the terms between two models;
• In the case change is detected, analyse if this change is performance degradation (manifestation of
Term(s) [insert name(s) of the input(s)]disappeared from the application modelafter modifications (at deployment n)and term(s) [insert name(s) ofthe input(s)] appeared in it.
Models,are identical in terms
What itmeans
One or more terms stopped influencingresponse (performance or reliabilitymetric of interest) after modificationswere made to the application, whileone or more terms started to influence it.
If there is an anomaly, then it’smanifested in some other way
anomalous behaviour) or not (improvement in performance caused by the modifications made tothe application on the n-th stage of development)
More detailed anomaly detection procedure and interpretation of the results are presented belowusing two generic linear regression models as an example.
Step 1
Investigating models’ composition. Various outcomes of the models’ composition comparison arepresented in the Table 6:
Outcomes 1-3 from the Table 6 do not automatically imply that missing/new terms are manifestationsof anomalous behaviour. In this case the tool checks whether the addition/disappearance of the term(s)from the model leads to the improvement/degradation of the response or does not change it significantly.
At this stage the algorithm also identifies which of the terms coincide for n−1 and n version modelsand passes this information to the next step of the procedure.
Step 2
Analyse the behaviour of the application at the latest deployment for potential changes. In all of theoutcomes outlined in the Table 6 the next step is to compare the coefficients of the coinciding model termson the term-by-term basis. This is done by generating a sample (one for each model) of response valuesfor one model term (thinking of other terms as fixed), while varying input on the normalised interval[-1;1]. Then a t-test is conducted on these two samples in order to establish if there is a significantdifference between their means. T-test tests the null hypothesis that two data samples come from thenormal distributions with equal means and equal (but unknown) variances (essentially meaning that these
Figure 14: Visualization of the term by term comparison of model coefficients
two data samples were drawn from the same population and the difference in their means lies within thesample variance). If this null hypothesis is rejected, it means that these two independent samples comefrom different distributions. In relation to the software applications rejection of the null hypothesis canbe interpreted in a way that these two data samples were generated by different processes.
T-test is not directional, i.e. it is impossible to tell if significant difference detected means improve-ment or degradation of the performance. Therefore, if it’s flagged, the tool next compares two samplemeans to identify whether there is a performance improvement or degradation.
The procedure for detecting if non-coinciding significantly influence response is almost identical tothe comparison of coefficients of coinciding terms. The samples are generated for each not coincidingterm and their means are calculated. Where these terms are absent in the compared model, their coeffi-cients and thus sample means are assumed to be zero. Then t-tests are conducted to identify if there is asignificant difference between each of the means and zero. If the new/absent model terms cause signif-icant difference in the predicted response, then the tool goes to the step 3 to establish if this differencemeans improvement or degradation.
Below is the example for the term-by-term comparison of the model coefficients for the generic linearregression model used in the Table 6 (the values for coefficients are chosen arbitrarily for illustrativepurpose).
By assuming that ’other model terms are fixed’, we can set them to zero and thus look at the projec-tions of the response surface onto the axes corresponding to the specific terms. The visualisation of theseprojections for the terms from the equations (2) is presented on the Figure 14.
The leftmost plot on the Figure 14 illustrates the termX1 for both models, with significant differencenot detected. The curves lie close to each other and the model coefficients, which in this setup (onlyone variable and with 0 as the centre of the interval) are, essentially, sample means are also close. Theplot in the middle illustrates the case where significant difference between deployments n− 1 and n wasdetected for the termX4. The rightmost plot shows the comparison between the termX2
6 which is absentfrom the model n− 1 and thus modelled as having coefficient = 0.
Step 3
Establish if detected change in response is performance degradation (anomaly) or not (improvement).Because t-test is not directional and some performance or reliability metrics improve by decreasing
(e.g. response time, data processing time), while others improve by increasing (e.g. throughput), it isimpossible for the MA module to identify the influence of change (positive/negative) only by comparingtwo sample means. Therefore, it needs additional information to make a decision.
This information can be obtained from the relevant requirement (e.g. supplied directly by the de-veloper on the tool’s prompt or extracted by the tool from the requirements repository). For example, ifthere is a requirement exists: ’Performance (or reliability) metric A must not exceed value X’, the MAmodule can parse it looking for the keywords such as ’not exceed’, ’not larger than/not greater than’,/larger than/greater than’ etc. and use this information to identify if the direction of change in perfor-mance (or reliability) metric is positive or negative (improvement or degradation).
2.3.3 Report generation
After the model analysis is finished, the AD tool generates report with the analysis results and sug-gestions for possible root causes in the case performance degradation is detected. This functionalityis currently not implemented, because it is proposed that the tool would communicate its output to thedeveloper via DICE Monitoring Platform and the work on integration hasn’t started yet.
For the visualisation of the entire model or specific terms (similar to the plots from the Figure 14) inthe DICE Monitoring Platform the range of input parameters can easily be re-scaled from the normalisedinterval [-1;1] back to their original values.
2.3.4 Discussion
From the description of the model analysis process it can be seen that in addition to flagging thepresence/absence of an anomaly the AD tool allows to identify if there is a significant improvement inperformance as a result of modifications undertaken and also provides basic (preliminary) root causeanalysis.
The information obtained in the Model Analysis procedure can be potentially exploited in the rootcause analysis due to the assumption based on the nature of the linear regression models. It is well-knownthat linear regression models are the so-called ’black box’ models. Meaning that any change in the systemthey describe can only be reflected in the model terms composition and their coefficients. However,due to the fact that each coefficient and model term (i.e. input parameters such as, e.g. configuration,hardware and so on) in isolation reflects its impact on the response, it can be suggested that if its negativeinfluence is detected, then it might be the source/manifestation of the problem (or architecture/codedirectly connected with this ’problematic’ input parameter). This additional functionality comes as a’by-product’ of the developed approach to the anomaly detection.
Next steps for the tool implementation and development would be to integrate with the other tools inthe DICE framework (DMon, Deployment tool, IDE), provide support for PMML to store the model inthe universal format and validate the tool with experiments.
As a conclusion, Table 7 indicates how the work reported in this deliverable addresses the require-ments identified by the requirement analysis.
This section details what use cases are handled by each tool. It shows the main workflow for ADTas well as that of TraCT. For the Regression based AD the input parameters for the method are detailedas well as example configuration files.
3.1 Anomaly Detection
Anomaly detection tool will check for anomalies during the runtime of a deployed application ona wide range of Big Data frameworks. These frameworks are unchanged from those supported by theDICE Monitoring platform (DMon) [13]. In the case of unsupervised anomaly detection methods thequerying of DMon will result in the generation of the data sets on which these methods will operate. Inessence the only thing that the end user needs to do is give ADT the query string and the desired timeframe.
For supervised anomaly detection methods this is a bit more complicated as it is not enough to givethe query string and time frame. The data sets must be labelled in order to create a viable training andvalidating data set. Once this is done the resulting predictive models can be easily applied during runtime.
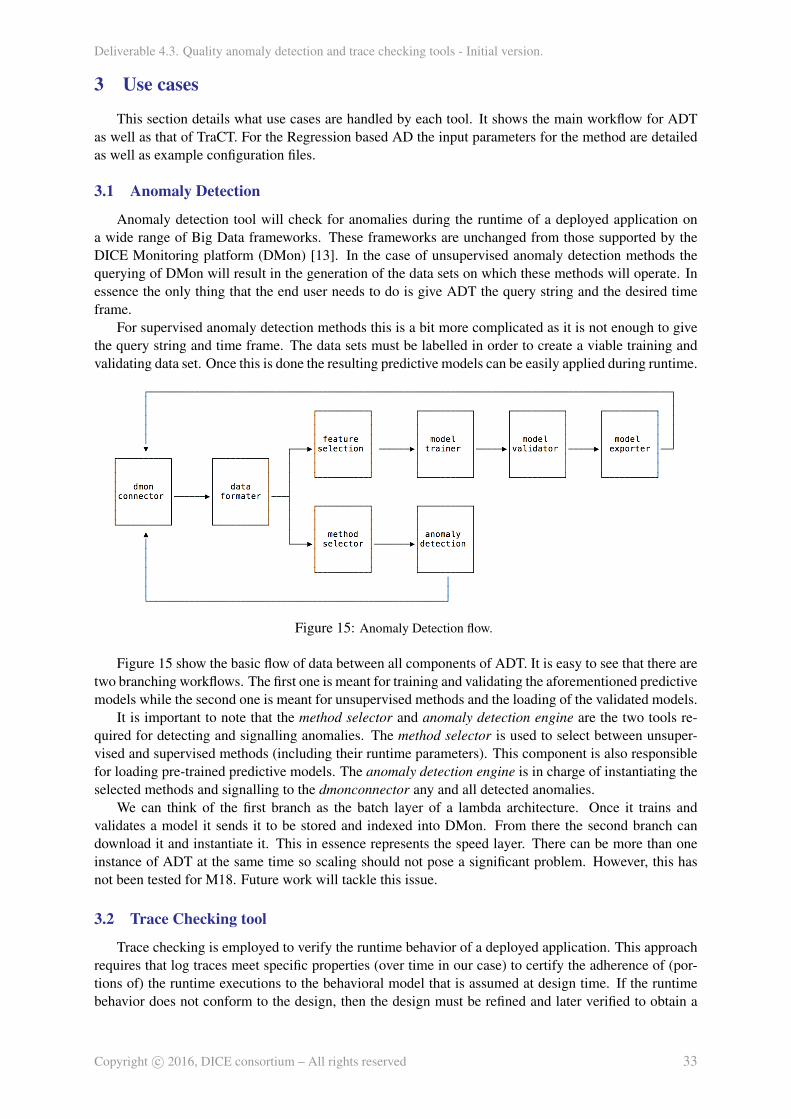
Figure 15: Anomaly Detection flow.
Figure 15 show the basic flow of data between all components of ADT. It is easy to see that there aretwo branching workflows. The first one is meant for training and validating the aforementioned predictivemodels while the second one is meant for unsupervised methods and the loading of the validated models.
It is important to note that the method selector and anomaly detection engine are the two tools re-quired for detecting and signalling anomalies. The method selector is used to select between unsuper-vised and supervised methods (including their runtime parameters). This component is also responsiblefor loading pre-trained predictive models. The anomaly detection engine is in charge of instantiating theselected methods and signalling to the dmonconnector any and all detected anomalies.
We can think of the first branch as the batch layer of a lambda architecture. Once it trains andvalidates a model it sends it to be stored and indexed into DMon. From there the second branch candownload it and instantiate it. This in essence represents the speed layer. There can be more than oneinstance of ADT at the same time so scaling should not pose a significant problem. However, this hasnot been tested for M18. Future work will tackle this issue.
3.2 Trace Checking tool
Trace checking is employed to verify the runtime behavior of a deployed application. This approachrequires that log traces meet specific properties (over time in our case) to certify the adherence of (por-tions of) the runtime executions to the behavioral model that is assumed at design time. If the runtimebehavior does not conform to the design, then the design must be refined and later verified to obtain a
new certification of correctness. Specifically, trace checking in DICE allows the DICE users to verifytwo classes of properties that are derived from the DPIM, DTSM and DDSM models.
The first class of property of interest for DICE consists of temporal properties that allow for checkingthe validity of the results obtained with the verification analysis defined in WP3. Currently, verificationis carried out at DTSM level on UML models enriched with information that are useful to perform theanalysis of Storm applications (more details in DICE Verification Tool - Initial version [15]). Stormtopologies, that are captured by DTSM models, are analyzed through a logical model which capturestheir behavior over time. Storm topologies consist of nodes that represent computational resources im-plementing the application. They can be either data sources or data processors (bolt) that manipulateinput messages.
To verify DTSM models the designer must provide some parameter values that abstract the (temporal)behavior of spouts and bolts (the complete description can be found in the document DICE VerificationTool - Initial version [15]).Trace checking is employed to extract from real executions those parametervalues that are not available from the monitoring component of the framework as they might be inherentlyspecific of the modeling adopted for verification. An example of such a parameter is the ratio betweenthe number of messages that are received by a bolt and the number of messages that it emits in output.
The second class of property concerns privacy aspects of the applications. Privacy constraints are de-signed through the the DPIM, DTSM and DDSM models by means of suitable annotations and possiblynew ad-hoc constraints specifying, for instance, authentication and authorization restrictions, resourcespolicies, encryption on communication etc. Checking the integrity of the deployed and running applica-tion can be achieved through trace checking with the analysis of application logs and suitable propertiesderived from the models.
3.3 Regression based Anomaly Detection
Regression-based Anomaly Detection tool is implemented in Matlab and compiled as an executablefile that can be run as a standalone application from the command line. MyAppInstaller web.exe is anexecutable file of the MATLAB Generated Standalone Application and detailed installation instructioncan be found in [1]. After the application is installed it can be executed by running regressionad mainfile.
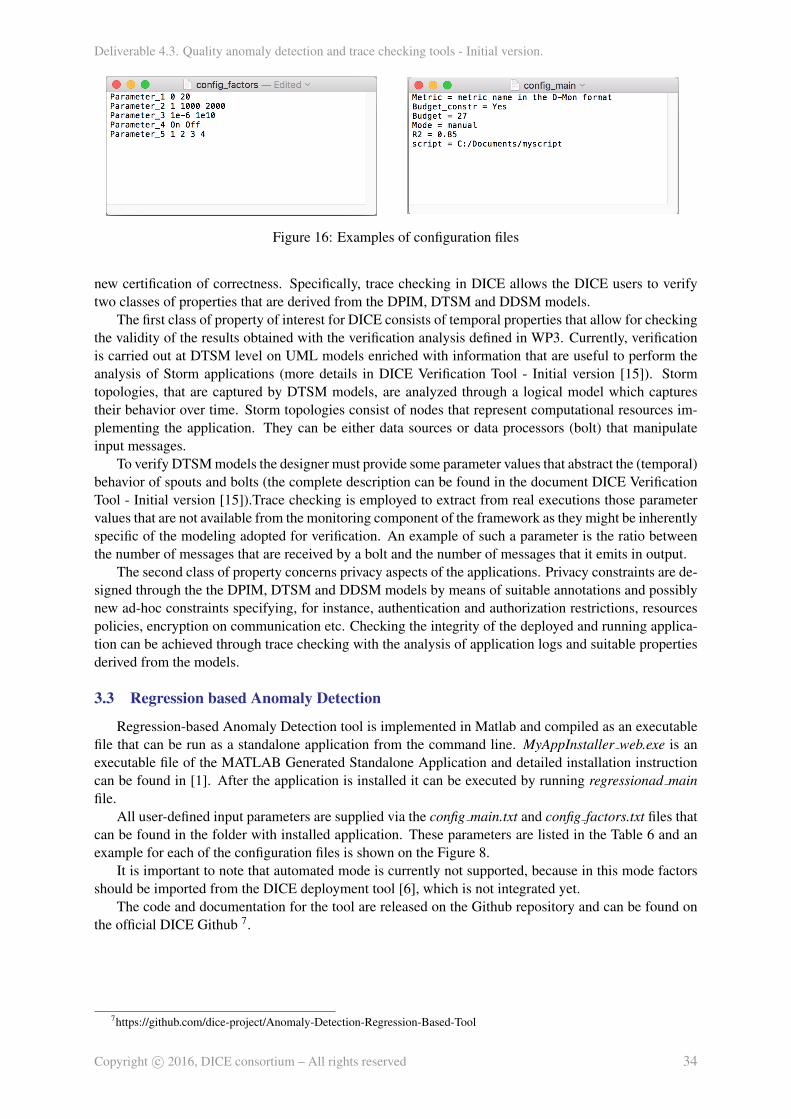
All user-defined input parameters are supplied via the config main.txt and config factors.txt files thatcan be found in the folder with installed application. These parameters are listed in the Table 6 and anexample for each of the configuration files is shown on the Figure 8.
It is important to note that automated mode is currently not supported, because in this mode factorsshould be imported from the DICE deployment tool [6], which is not integrated yet.
The code and documentation for the tool are released on the Github repository and can be found onthe official DICE Github 7.
MetricPerformance or reliability metricto model and investigate for anomaly
The name of the metric should beprovided exactly how it’s suppliedby the DMon, because the toolqueries DMon to obtain themeasurements for this metric.
Budget constrIs there a limit on the number ofexperiments to run
Yes/ No
Budget
If Budget constr is ‘Yes’, providethe maximum number of experimentspossible to run. If ‘No’, do notenter any value
Number (e.g. 27) or blank space
Mode
auto – automated mode, user does notcontrol R2 (see below) and leaves theconfig factors.txt blankmanual – user can modify R2 and,config factors.txt
R2
Script running the Data-IntensiveApplication to obtain observationsfor the performance or reliabilitymetric,(external executable fileprovided by the user)
Number from 0 to 1 (optimal interval 0.7¸0.85).For the auto mode it is set at the default value(0.85)
script
Script running the Data-IntensiveApplication to obtain observationsfor the performance or reliabilitymetric,(external executable fileprovided by the user)
Full path to the file location, including file name.
config factors.txt
Separate configuration file containingthe list of the parameters of the DIAand the range in which they can vary(min/max/mid etc.)
Each line in the file contains the informationfor one input parameter in the following form(see detailed example in the Figure 6):Parameter name level 1 level 2 . . .
This section covers integration as well as validation issues for each tool. The first subsection will dealwith both ADT as well as Regression based AD and how it interacts with the overall DMon Architecture.The second section details the Trace Checking tool and how it combines logs and checks for sequentialanomalies.
4.1 Anomaly Detection
ADT will have a closer integration with DMon than with other tools from the DICE solution. This ismainly due to two facts. Firstly, ADT needs data on which to run anomaly detection methods. Thus it isextremely important to have data available in a format which is usable. Second, ADT together with themonitoring forms a lambda architecture. Each instance of ADT can have the role of batch or speed layerwhile DMon has the role of a serving layer. For more details see Figure 17.
Figure 17: Anomaly detection integration with DMON.
As mentioned before the detected anomalies will be sent and indexed into DMon. All DICE actorsand tools will be able to query this special index to see/listen for detected anomalies. In this way it ispossible to create specialized ADT instances for each anomaly detection method in part. The result willbe reflected in the same index from DMon. This architecture also allows us serve the results of both themonitoring and anomaly detection on the same endpoint (DMon).
As mentioned in section some anomaly detection methods, more precisely the ones using supervisedlearning techniques, need labelled data in order to function properly. This is a fairly complicated thing toaccomplish. One solution is to label all normal data instances and all unlabelled instances are consideredanomalies. In most systems the normal data instances far outnumber the anomalous ones so labellingthem is extremely impractical.
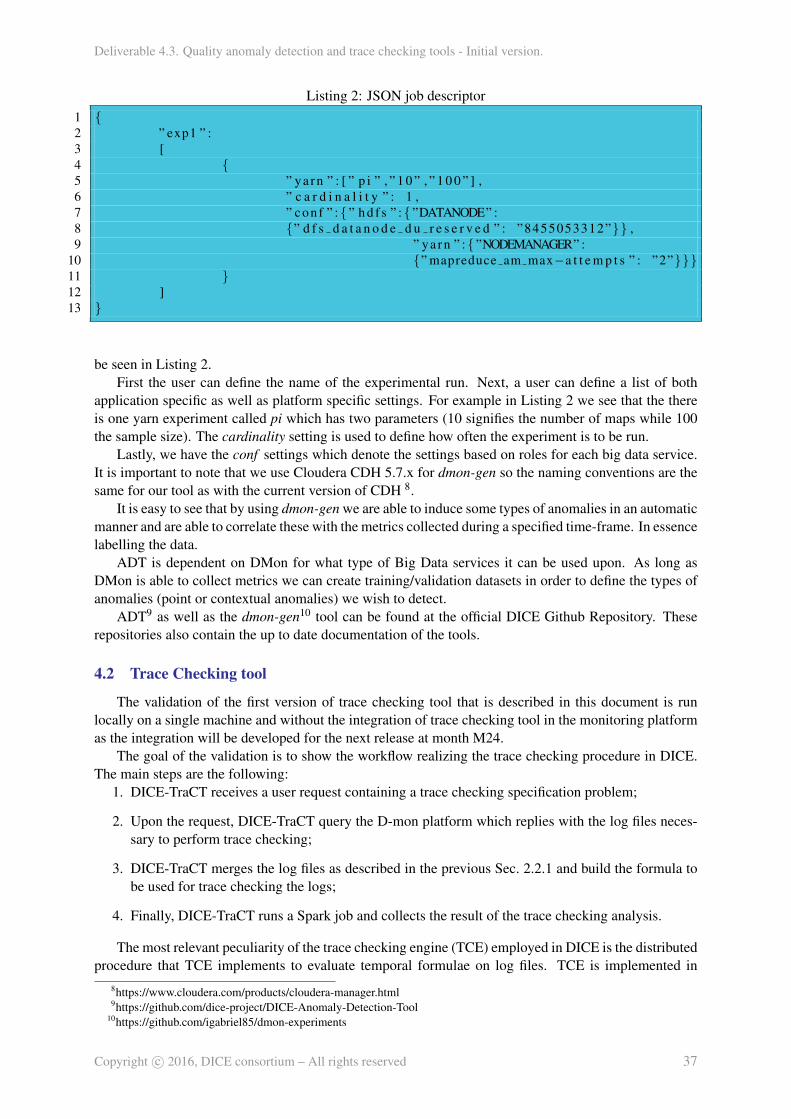
We have decided to create a semi automated way of creating labelled data. This is accomplishedby inducing different types of anomalies during job definition and execution. A specialized tool calleddmon-gen has been implemented which allows the changing of both runtime parameters as well as plat-form specific parameters of a Yarn, Spark job.
The tool dmon-gen has to be located on one of the VMs from the Yarn/Spark cluster. As input theuser has the ability to define a set of experiments using a JSON descriptor. An example descriptor can
Listing 2: JSON job descriptor1 {2 ” exp1 ” :3 [4 {5 ” ya rn ” : [ ” p i ” , ” 1 0 ” , ” 1 0 0 ” ] ,6 ” c a r d i n a l i t y ” : 1 ,7 ” con f ” :{ ” h d f s ” :{ ”DATANODE” :8 {” d f s d a t a n o d e d u r e s e r v e d ” : ”8455053312”}} ,9 ” ya rn ” :{ ”NODEMANAGER” :
10 {” mapreduce am max−a t t e m p t s ” : ”2”}}}11 }12 ]13 }
be seen in Listing 2.First the user can define the name of the experimental run. Next, a user can define a list of both
application specific as well as platform specific settings. For example in Listing 2 we see that the thereis one yarn experiment called pi which has two parameters (10 signifies the number of maps while 100the sample size). The cardinality setting is used to define how often the experiment is to be run.
Lastly, we have the conf settings which denote the settings based on roles for each big data service.It is important to note that we use Cloudera CDH 5.7.x for dmon-gen so the naming conventions are thesame for our tool as with the current version of CDH 8.
It is easy to see that by using dmon-gen we are able to induce some types of anomalies in an automaticmanner and are able to correlate these with the metrics collected during a specified time-frame. In essencelabelling the data.
ADT is dependent on DMon for what type of Big Data services it can be used upon. As long asDMon is able to collect metrics we can create training/validation datasets in order to define the types ofanomalies (point or contextual anomalies) we wish to detect.
ADT9 as well as the dmon-gen10 tool can be found at the official DICE Github Repository. Theserepositories also contain the up to date documentation of the tools.
4.2 Trace Checking tool
The validation of the first version of trace checking tool that is described in this document is runlocally on a single machine and without the integration of trace checking tool in the monitoring platformas the integration will be developed for the next release at month M24.
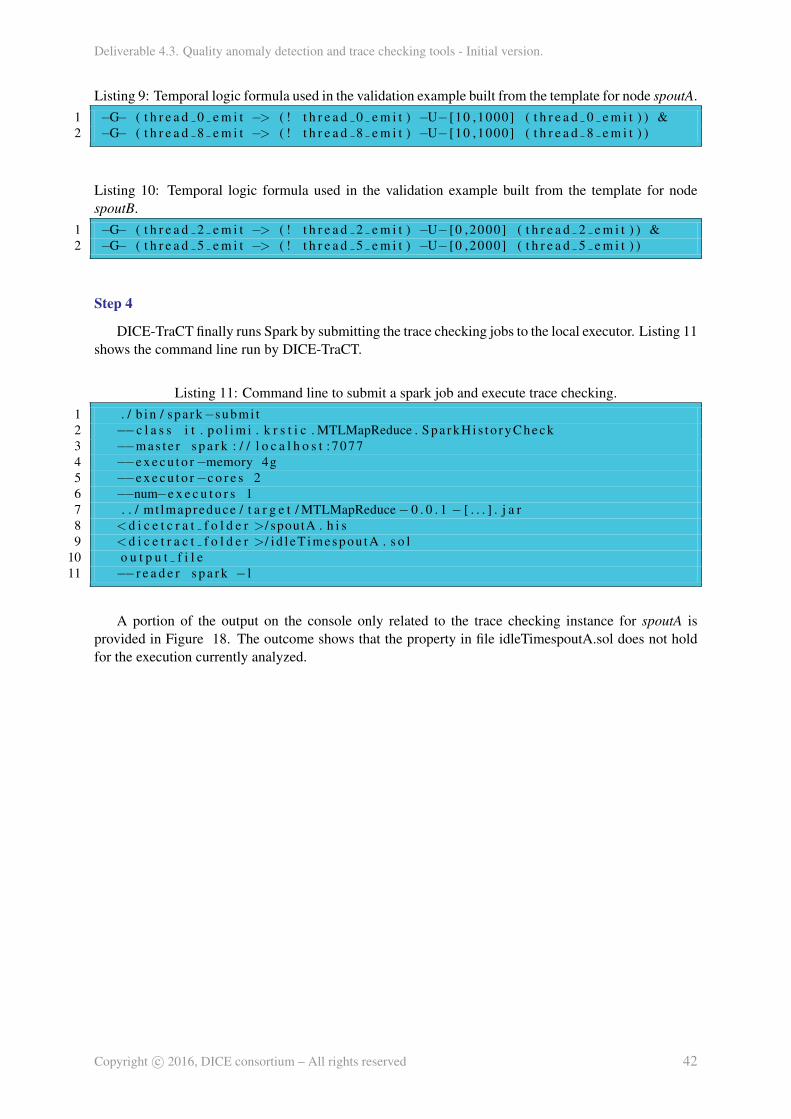
The goal of the validation is to show the workflow realizing the trace checking procedure in DICE.The main steps are the following:
1. DICE-TraCT receives a user request containing a trace checking specification problem;
2. Upon the request, DICE-TraCT query the D-mon platform which replies with the log files neces-sary to perform trace checking;
3. DICE-TraCT merges the log files as described in the previous Sec. 2.2.1 and build the formula tobe used for trace checking the logs;
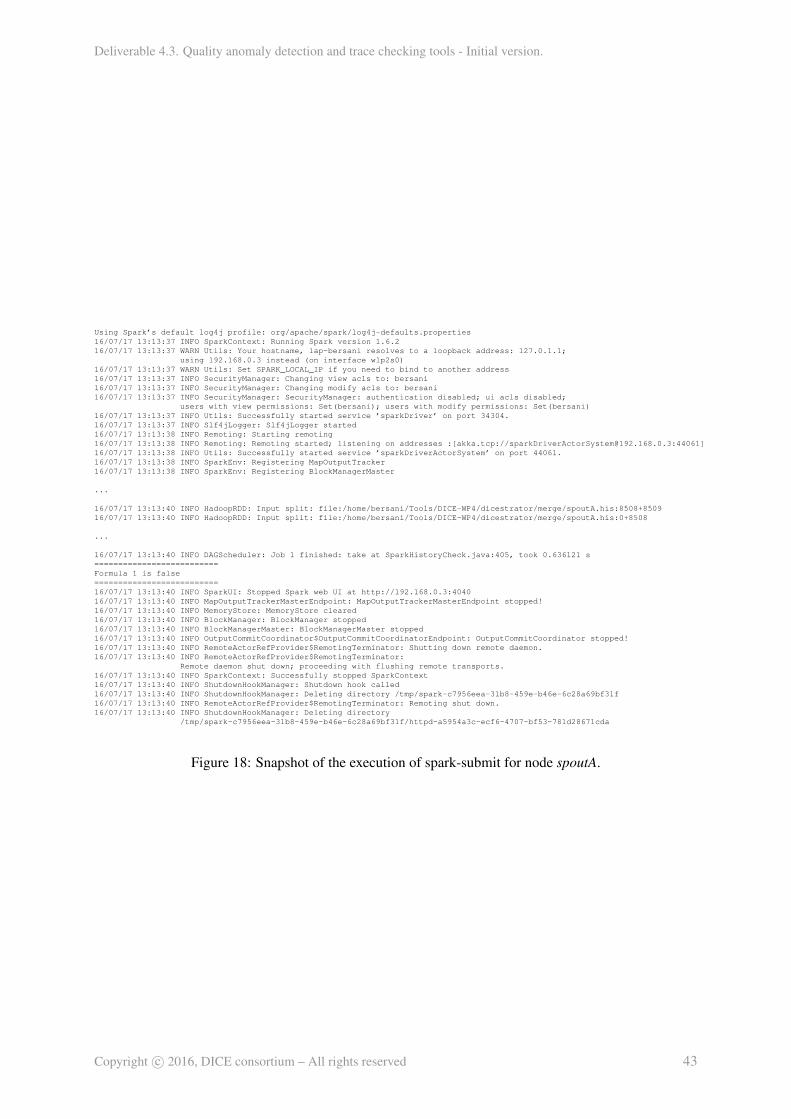
4. Finally, DICE-TraCT runs a Spark job and collects the result of the trace checking analysis.
The most relevant peculiarity of the trace checking engine (TCE) employed in DICE is the distributedprocedure that TCE implements to evaluate temporal formulae on log files. TCE is implemented in
Spark, a general engine for large-scale data processing which is also supported in DICE as technologyto build big-data applications. Stemming from a distributed implementation, TCE takes advantage froma distributed file system to run the trace checking procedure on a (pseudo-)distributed architecure (localexecutions might be multi-threaded).
To validate DICE-TraCT, a local installation of Apache Hadoop [22] and Apache Spark [23] is firstset up. The former allows the trace checking tool to work on top of HDFS, the distributed file systemthat Spark can access to store and retrieve data.
Next sections describe in detail the four steps mentioned before. The reference topology for thevalidation consists of 5 nodes: two spouts, called spoutA and spoutB, and three bolts, called boltA, boltBand boltC. The structure of the topology is not relevant to show the trace checking validation as the tracechecking procedure is run to analyze the behavior of single nodes only and the considered property isnot related to the topology graph.
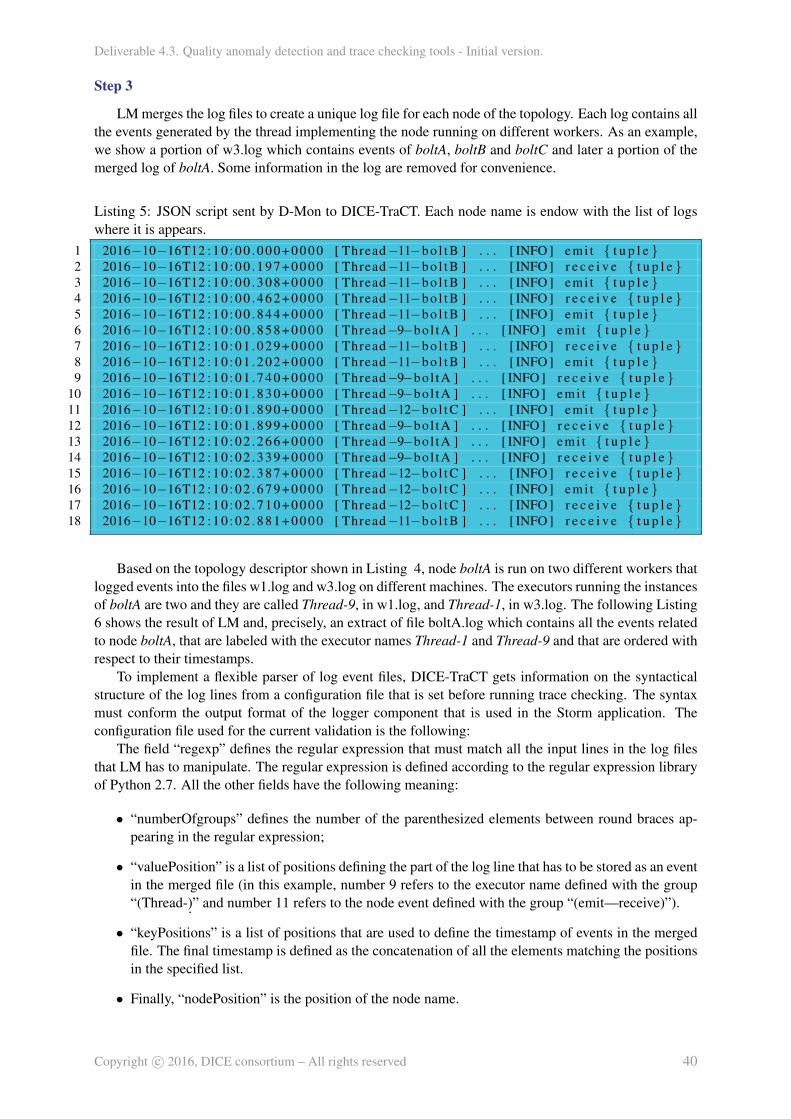
Step 1
The trace checking procedure is activated by the user through the DICE-IDE. DICE-TraCT receivesin input a descriptor which defines the parameters to run trace checking for the selected topology shownin the IDE. The descriptor is a JSON file that is built automatically through the IDE by the user whoactivates the analysis of the topology. The descriptor used to validate the tool is shown in Listing 3.
Listing 3: Field ”node” of the JSON script used for validation experiment.1 ” nodes ” : [2 {3 ”name ” : ” spoutA ” ,4 ” t y p e ” : ” s p o u t ” ,5 ” p a r a m e t e r ” : ” i d l e T i m e ” ,6 ” timewindow ” : 3600 ,7 ” method ” : ” ” ,8 ” r e l a t i o n ” : ” ” ,9 ” min ” : 10 ,
10 ”max ” : 100011 } ,12 {13 ”name ” : ” spoutB ” ,14 ” t y p e ” : ” s p o u t ” ,15 ” p a r a m e t e r ” : ” i d l e T i m e ” ,16 ” timewindow ” : 3600 ,17 ” method ” : ” ” ,18 ” r e l a t i o n ” : ” ” ,19 ” min ” : 0 ,20 ”max ” : 200021 }
The information stored in the descriptor are the following:
• The field called “topologyname” specifies the topology name which is used by DICE-TraCT toquery the monitoring platform. This field allows DICE-TraCT to obtain all the necessary log filesto perform trace checking.
• A list of descriptors that specify, for each node, a non-functional property that the user wants tocheck for a node on the logs collected from the running topology. The properties can be thosespecified in the verification model like, for instance, the ratio sigma between the number of mes-sages in input and the number of messages in output of a Storm node; or any user-defined propertywhich can be translated by DICE-TraCT into a trace checking instance. Each item defined by curlybrackets defines a list of data that are needed to collect the suitable set of logs from D-mon and
to define the temporal logical formula specifying the property to check. DICE-TraCT is equippedwith standard handlers which are able to manipulate predefined properties (like idleTime used later)but allows for defining new custom handlers based on user needs.
• A list of formulae descriptors that specify user-defined logical formulae to be used for trace-checking.
The query defined by the script in Fig. 3 contains two node descriptors (between curly brackets)associated with spoutA and spoutB nodes. Both specifies to verify that the value of the idleTime of thenode is between the values defined with min and max values. Each descriptor also defines the duration(in seconds) of the log to use for running trace checking. The length will be specified in the query to theDMon platform to collect, from the Storm deployment, the most recent events occurred in last the periodof that length (currently, we assume that the length is measured from the last timestamp recorded in thelogs of the Storm application).
Step 2
Being not integrated with the monitoring platform, DICE-TraCT simulates the query to DMonthrough an I/O operation on the local file system. We assume therefore that DMon provides:• A JSON descriptor which specifies, for each node of the topology, the log file name where Storm
logs its events. As already explained before, a node can reside on different machines within manyworkers; therefore, the events associated with a node might be stored on different logs. Listing 4shows the descriptor.
• The logs of the deployed topology. In the current example, they are called w1.log, w2.log andw3.log.
Listing 4: Json script sent by D-Mon to DICE-TraCT. Each node name is endow with the list of logswhere it appears.
1 {2 ” topologyname ” : ” ATopology ” ,3 ” l o g s ” : [4 {5 ” nodename ” : ” spoutA ” ,6 ” l o g s ” : ”w2 . l o g ”7 } ,8 {9 ” nodename ” : ” spoutB ” ,
10 ” l o g s ” : ”w1 . l o g ”11 } ,12 {13 ” nodename ” : ” bo l tA ” ,14 ” l o g s ” : ”w1 . log , w3 . l o g ”15 } ,16 {17 ” nodename ” : ” b o l t B ” ,18 ” l o g s ” : ”w3 . l o g ”19 } ,20 {21 ” nodename ” : ” b o l t C ” ,22 ” l o g s ” : ”w2 . log , w3 . l o g ”23 }24 ]25 }
LM merges the log files to create a unique log file for each node of the topology. Each log contains allthe events generated by the thread implementing the node running on different workers. As an example,we show a portion of w3.log which contains events of boltA, boltB and boltC and later a portion of themerged log of boltA. Some information in the log are removed for convenience.
Listing 5: JSON script sent by D-Mon to DICE-TraCT. Each node name is endow with the list of logswhere it is appears.
1 2016−10−16T12 : 1 0 : 0 0 . 0 0 0 + 0 0 0 0 [ Thread−11−b o l t B ] . . . [ INFO ] emi t { t u p l e }2 2016−10−16T12 : 1 0 : 0 0 . 1 9 7 + 0 0 0 0 [ Thread−11−b o l t B ] . . . [ INFO ] r e c e i v e { t u p l e }3 2016−10−16T12 : 1 0 : 0 0 . 3 0 8 + 0 0 0 0 [ Thread−11−b o l t B ] . . . [ INFO ] emi t { t u p l e }4 2016−10−16T12 : 1 0 : 0 0 . 4 6 2 + 0 0 0 0 [ Thread−11−b o l t B ] . . . [ INFO ] r e c e i v e { t u p l e }5 2016−10−16T12 : 1 0 : 0 0 . 8 4 4 + 0 0 0 0 [ Thread−11−b o l t B ] . . . [ INFO ] emi t { t u p l e }6 2016−10−16T12 : 1 0 : 0 0 . 8 5 8 + 0 0 0 0 [ Thread−9−bo l tA ] . . . [ INFO ] emi t { t u p l e }7 2016−10−16T12 : 1 0 : 0 1 . 0 2 9 + 0 0 0 0 [ Thread−11−b o l t B ] . . . [ INFO ] r e c e i v e { t u p l e }8 2016−10−16T12 : 1 0 : 0 1 . 2 0 2 + 0 0 0 0 [ Thread−11−b o l t B ] . . . [ INFO ] emi t { t u p l e }9 2016−10−16T12 : 1 0 : 0 1 . 7 4 0 + 0 0 0 0 [ Thread−9−bo l tA ] . . . [ INFO ] r e c e i v e { t u p l e }
10 2016−10−16T12 : 1 0 : 0 1 . 8 3 0 + 0 0 0 0 [ Thread−9−bo l tA ] . . . [ INFO ] emi t { t u p l e }11 2016−10−16T12 : 1 0 : 0 1 . 8 9 0 + 0 0 0 0 [ Thread−12−b o l t C ] . . . [ INFO ] emi t { t u p l e }12 2016−10−16T12 : 1 0 : 0 1 . 8 9 9 + 0 0 0 0 [ Thread−9−bo l tA ] . . . [ INFO ] r e c e i v e { t u p l e }13 2016−10−16T12 : 1 0 : 0 2 . 2 6 6 + 0 0 0 0 [ Thread−9−bo l tA ] . . . [ INFO ] emi t { t u p l e }14 2016−10−16T12 : 1 0 : 0 2 . 3 3 9 + 0 0 0 0 [ Thread−9−bo l tA ] . . . [ INFO ] r e c e i v e { t u p l e }15 2016−10−16T12 : 1 0 : 0 2 . 3 8 7 + 0 0 0 0 [ Thread−12−b o l t C ] . . . [ INFO ] r e c e i v e { t u p l e }16 2016−10−16T12 : 1 0 : 0 2 . 6 7 9 + 0 0 0 0 [ Thread−12−b o l t C ] . . . [ INFO ] emi t { t u p l e }17 2016−10−16T12 : 1 0 : 0 2 . 7 1 0 + 0 0 0 0 [ Thread−12−b o l t C ] . . . [ INFO ] r e c e i v e { t u p l e }18 2016−10−16T12 : 1 0 : 0 2 . 8 8 1 + 0 0 0 0 [ Thread−11−b o l t B ] . . . [ INFO ] r e c e i v e { t u p l e }
Based on the topology descriptor shown in Listing 4, node boltA is run on two different workers thatlogged events into the files w1.log and w3.log on different machines. The executors running the instancesof boltA are two and they are called Thread-9, in w1.log, and Thread-1, in w3.log. The following Listing6 shows the result of LM and, precisely, an extract of file boltA.log which contains all the events relatedto node boltA, that are labeled with the executor names Thread-1 and Thread-9 and that are ordered withrespect to their timestamps.
To implement a flexible parser of log event files, DICE-TraCT gets information on the syntacticalstructure of the log lines from a configuration file that is set before running trace checking. The syntaxmust conform the output format of the logger component that is used in the Storm application. Theconfiguration file used for the current validation is the following:
The field “regexp” defines the regular expression that must match all the input lines in the log filesthat LM has to manipulate. The regular expression is defined according to the regular expression libraryof Python 2.7. All the other fields have the following meaning:
• “numberOfgroups” defines the number of the parenthesized elements between round braces ap-pearing in the regular expression;
• “valuePosition” is a list of positions defining the part of the log line that has to be stored as an eventin the merged file (in this example, number 9 refers to the executor name defined with the group“(Thread-).” and number 11 refers to the node event defined with the group “(emit—receive)”).
• “keyPositions” is a list of positions that are used to define the timestamp of events in the mergedfile. The final timestamp is defined as the concatenation of all the elements matching the positionsin the specified list.
• Finally, “nodePosition” is the position of the node name.
Listing 6: Event log ready for trace checking built by LM for node boltA.1 20161016121000858 ; t h r e a d 9 e m i t2 20161016121001423 ; t h r e a d 1 e m i t3 20161016121001740 ; t h r e a d 9 r e c e i v e4 20161016121001830 ; t h r e a d 9 e m i t5 20161016121001899 ; t h r e a d 9 r e c e i v e6 20161016121002266 ; t h r e a d 9 e m i t7 20161016121002339 ; t h r e a d 9 r e c e i v e8 20161016121002513 ; t h r e a d 3 e m i t9 20161016121002776 ; t h r e a d 1 r e c e i v e
10 20161016121003097 ; t h r e a d 9 e m i t11 20161016121003295 ; t h r e a d 1 e m i t12 20161016121004054 ; t h r e a d 3 r e c e i v e13 20161016121005333 ; t h r e a d 1 r e c e i v e14 20161016121005436 ; t h r e a d 9 r e c e i v e15 20161016121005617 ; t h r e a d 9 e m i t16 20161016121005800 ; t h r e a d 1 e m i t17 20161016121005888 ; t h r e a d 9 r e c e i v e18 20161016121006086 ; t h r e a d 9 e m i t19 20161016121006185 ; t h r e a d 1 r e c e i v e20 20161016121006316 ; t h r e a d 1 e m i t21 20161016121006751 ; t h r e a d 9 r e c e i v e22 . . .
Listing 7: Descriptor of regular expression used to parse the files.1 {2 ” numberOfgroups ” : 12 ,3 ” v a l u e P o s i t i o n s ” : [ 9 , 1 1 ] ,4 ” k e y P o s i t i o n s ” : [ 1 , 2 , 3 , 4 , 5 , 6 , 7 ] ,5 ” n o d e P o s i t i o n ” : 10 ,6 ” r e ge x p ” : ” (\\ d{4})−(\\d{2})−(\\d {2} )T(\\ d {2} ) :7 (\\ d { 2 } ) : ( \ \ d {2} )\\ . (\\ d {3} )\\+8 (\\ d {4} ) \\ [ ( Thread−\\d + ) − ( .∗ )\\ ] . ∗ \\ [ INFO\\ ]9 ( emi t | r e c e i v e ) ( . ∗ ) ”
10 }11 . . .
After the merge phase and before launching an instance of trace checking on Spark, DICE-TraCTbuilds the property that TCE has to use to check the logs. DICE-TraCT reads a template file containingthe formula that has to be used to check, for the current experiment, the property called “idleTime” onthe logs of spoutA and spoutB, as required by the JSON trace checking descriptor of Listing 1. All thetemplate formulae that are used for (trace) checking standard predefined properties (like, for instance,idleTime) must be available before the execution of DICE-TraCT in the folder ./template. The templateformula for idleTime used for the current validation is shown in Listing 8:
Listing 8: Template of the temporal logic formula used in the validation example.1 −G− ( emi t −> ( ! emi t ) −U−[$a , $b ] emi t )
DICE-TraCT writes in a .sol file each property related to idleTime which now contains the eventsthat appear in the merged log file and, instead of the markers $a and $b, the values for min and maxthat are specified in the JSON trace checking descriptor. The output of this phase consists of two filescontaing a Soloist formula Listing 9 is the formula related to spoutA and Listing 10 the one for spoutB.
Listing 9: Temporal logic formula used in the validation example built from the template for node spoutA.1 −G− ( t h r e a d 0 e m i t −> ( ! t h r e a d 0 e m i t ) −U− [10 ,1000] ( t h r e a d 0 e m i t ) ) &2 −G− ( t h r e a d 8 e m i t −> ( ! t h r e a d 8 e m i t ) −U− [10 ,1000] ( t h r e a d 8 e m i t ) )
Listing 10: Temporal logic formula used in the validation example built from the template for nodespoutB.
1 −G− ( t h r e a d 2 e m i t −> ( ! t h r e a d 2 e m i t ) −U− [0 ,2000] ( t h r e a d 2 e m i t ) ) &2 −G− ( t h r e a d 5 e m i t −> ( ! t h r e a d 5 e m i t ) −U− [0 ,2000] ( t h r e a d 5 e m i t ) )
Step 4
DICE-TraCT finally runs Spark by submitting the trace checking jobs to the local executor. Listing 11shows the command line run by DICE-TraCT.
Listing 11: Command line to submit a spark job and execute trace checking.1 . / b i n / spa rk−su bmi t2 −−c l a s s i t . p o l i m i . k r s t i c . MTLMapReduce . S p a r k H i s t o r y C h e c k3 −−m a s t e r s p a r k : / / l o c a l h o s t :70774 −−e x e c u t o r−memory 4g5 −−e x e c u t o r−c o r e s 26 −−num−e x e c u t o r s 17 . . / mt lmapreduce / t a r g e t / MTLMapReduce− 0 . 0 . 1 − [ . . . ] . j a r8 <d i c e t c r a t f o l d e r >/ spoutA . h i s9 <d i c e t r a c t f o l d e r >/ i d l e T i m e s p o u t A . s o l
10 o u t p u t f i l e11 −−r e a d e r s p a r k − l
A portion of the output on the console only related to the trace checking instance for spoutA isprovided in Figure 18. The outcome shows that the property in file idleTimespoutA.sol does not holdfor the execution currently analyzed.
Using Spark’s default log4j profile: org/apache/spark/log4j-defaults.properties16/07/17 13:13:37 INFO SparkContext: Running Spark version 1.6.216/07/17 13:13:37 WARN Utils: Your hostname, lap-bersani resolves to a loopback address: 127.0.1.1;
using 192.168.0.3 instead (on interface wlp2s0)16/07/17 13:13:37 WARN Utils: Set SPARK_LOCAL_IP if you need to bind to another address16/07/17 13:13:37 INFO SecurityManager: Changing view acls to: bersani16/07/17 13:13:37 INFO SecurityManager: Changing modify acls to: bersani16/07/17 13:13:37 INFO SecurityManager: SecurityManager: authentication disabled; ui acls disabled;
users with view permissions: Set(bersani); users with modify permissions: Set(bersani)16/07/17 13:13:37 INFO Utils: Successfully started service ’sparkDriver’ on port 34304.16/07/17 13:13:37 INFO Slf4jLogger: Slf4jLogger started16/07/17 13:13:38 INFO Remoting: Starting remoting16/07/17 13:13:38 INFO Remoting: Remoting started; listening on addresses :[akka.tcp://[email protected]:44061]16/07/17 13:13:38 INFO Utils: Successfully started service ’sparkDriverActorSystem’ on port 44061.16/07/17 13:13:38 INFO SparkEnv: Registering MapOutputTracker16/07/17 13:13:38 INFO SparkEnv: Registering BlockManagerMaster
...
16/07/17 13:13:40 INFO HadoopRDD: Input split: file:/home/bersani/Tools/DICE-WP4/dicestrator/merge/spoutA.his:8508+850916/07/17 13:13:40 INFO HadoopRDD: Input split: file:/home/bersani/Tools/DICE-WP4/dicestrator/merge/spoutA.his:0+8508
...
16/07/17 13:13:40 INFO DAGScheduler: Job 1 finished: take at SparkHistoryCheck.java:405, took 0.636121 s==========================Formula 1 is false==========================16/07/17 13:13:40 INFO SparkUI: Stopped Spark web UI at http://192.168.0.3:404016/07/17 13:13:40 INFO MapOutputTrackerMasterEndpoint: MapOutputTrackerMasterEndpoint stopped!16/07/17 13:13:40 INFO MemoryStore: MemoryStore cleared16/07/17 13:13:40 INFO BlockManager: BlockManager stopped16/07/17 13:13:40 INFO BlockManagerMaster: BlockManagerMaster stopped16/07/17 13:13:40 INFO OutputCommitCoordinator$OutputCommitCoordinatorEndpoint: OutputCommitCoordinator stopped!16/07/17 13:13:40 INFO RemoteActorRefProvider$RemotingTerminator: Shutting down remote daemon.16/07/17 13:13:40 INFO RemoteActorRefProvider$RemotingTerminator:
Remote daemon shut down; proceeding with flushing remote transports.16/07/17 13:13:40 INFO SparkContext: Successfully stopped SparkContext16/07/17 13:13:40 INFO ShutdownHookManager: Shutdown hook called16/07/17 13:13:40 INFO ShutdownHookManager: Deleting directory /tmp/spark-c7956eea-31b8-459e-b46e-6c28a69bf31f16/07/17 13:13:40 INFO RemoteActorRefProvider$RemotingTerminator: Remoting shut down.16/07/17 13:13:40 INFO ShutdownHookManager: Deleting directory
This deliverable presented the initial versions of ADTas well as DICE-TraCT. The goal of the first pro-totypes (M18) of these tools to enable the definition and reporting of anomalies present in monitoredperformance and quality related data from Big Data technologies. This is directly related to milestoneMS3 ”DICE Tool Initial release”. Currently it has been tested on two frameworks. First the DICE-TraCTtool has been used on Storm worker logs while the Regression based AD has been tested on system met-rics as well as run time metrics for Apache Spark.
Furthermore we have defined a connector between the anomaly detection tool and the DICE mon-itoring platform. This connector can be used both to retrieve datasets and to send detected anomaliesto the Monitoring platform. It is important to note that at this time (M18) this integration is not fullyfunctional, data sets can be created however anomalies are not transmitted. For M24, milestone MS4”Integrated Framework First Release” these functionalities will be finalized.
5.2 Further work
Both the Trace Checking and Regression based AD are at the moment standalone tools. They do notuse the querying and anomaly signalling components from ADT. Future versions will have a tighterintegration between them. In particular the Regression based AD will be integrated as one of the anomalydetection methods in ADT. The Trace Checking tool requires log traces in order to function so integrationwill most likely be in the form of anomaly signalling.
The current version of ADT was meant as a prototype which enables the definition of training/vali-dating data as well several anomaly types. In M18 we did not define examples of contextual anomaliesnor the format in which these are indexed in DMon. This will be detailed in future deliverable.
[2] Martın Abadi, Ashish Agarwal, Paul Barham, Eugene Brevdo, Zhifeng Chen, Craig Citro, Greg S.Corrado, Andy Davis, Jeffrey Dean, Matthieu Devin, Sanjay Ghemawat, Ian Goodfellow, AndrewHarp, Geoffrey Irving, Michael Isard, Yangqing Jia, Rafal Jozefowicz, Lukasz Kaiser, ManjunathKudlur, Josh Levenberg, Dan Mane, Rajat Monga, Sherry Moore, Derek Murray, Chris Olah, MikeSchuster, Jonathon Shlens, Benoit Steiner, Ilya Sutskever, Kunal Talwar, Paul Tucker, VincentVanhoucke, Vijay Vasudevan, Fernanda Viegas, Oriol Vinyals, Pete Warden, Martin Wattenberg,Martin Wicke, Yuan Yu, and Xiaoqiang Zheng. Tensorflow: Large-scale machine learning onheterogeneous systems, 2015. Software available from tensorflow.org.
[3] Marcello Maria Bersani, Domenico Bianculli, Carlo Ghezzi, Srdan Krstic, and Pierluigi San Pietro.Smt-based checking of SOLOIST over sparse traces. In Fundamental Approaches to SoftwareEngineering - 17th International Conference, FASE 2014, Held as Part of the European Joint Con-ferences on Theory and Practice of Software, ETAPS 2014, Grenoble, France, April 5-13, 2014,Proceedings, pages 276–290, 2014.
[4] Andreas Brunnert, Andre van Hoorn, Felix Willnecker, Alexandru Danciu, Wilhelm Hasselbring,Christoph Heger, Nikolas Herbst, Pooyan Jamshidi, Reiner Jung, Joakim von Kistowski, AnneKoziolek, Johannes Kroß, Simon Spinner, Christian Vogele, Jurgen Walter, and Alexander Wert.Performance-oriented devops: A research agenda. Technical Report SPEC-RG-2015-01, SPECResearch Group — DevOps Performance Working Group, Standard Performance Evaluation Cor-poration (SPEC), August 2015.
[5] Emmanuel Candes and Terence Tao. The dantzig selector: Statistical estimation when p is muchlarger than n. Ann. Statist., 35(6):2313–2351, 12 2007.
[7] Varun Chandola, Arindam Banerjee, and Vipin Kumar. Anomaly detection: A survey. ACM Com-put. Surv., 41(3):15:1–15:58, July 2009.
[8] Matthias Gander, Michael Felderer, Basel Katt, Adrian Tolbaru, Ruth Breu, and Alessandro Mos-chitti. Anomaly detection in the cloud: Detecting security incidents via machine learning. InAlessandro Moschitti and Barbara Plank, editors, Trustworthy Eternal Systems via Evolving Soft-ware, Data and Knowledge, volume 379 of Communications in Computer and Information Science,pages 103–116. Springer Berlin Heidelberg, 2013.
[9] Pooyan Jamshidi Marc Gil Christophe Joubert Alberto Romeu Jose Merseguer Raquel Trillo Mat-teo Giovanni Rossi Elisabetta Di Nitto Damian Andrew Tamburri Danilo Ardagna Jose Vilar Si-mona Bernardi Matej Artac Madalina Erascu Daniel Pop Gabriel Iuhasz Youssef Ridene JosuahAron Craig Sheridan Darren Whigham Giuliano Casale, Tatiana Ustinova. D1.2 dice requirementspecification.
[10] Robert L. Grossman, Stuart Bailey, Ashok Ramu, Balinder Malhi, Philip Hallstrom, Ivan Pulleyn,and Xiao Qin. The management and mining of multiple predictive models using the predictivemodeling markup language. Information & Software Technology, 41(9):589–595, 1999.
[11] Mark Hall, Eibe Frank, Geoffrey Holmes, Bernhard Pfahringer, Peter Reutemann, and Ian H. Wit-ten. The weka data mining software: An update. SIGKDD Explor. Newsl., 11(1):10–18, November2009.
[12] Jerome H. Friedman Ildiko E. Frank. A statistical view of some chemometrics regression tools.Technometrics, 35(2):109–135, 1993.
[13] Gabriel Iuhasz and Daniel Pop. Monitoring and data warehousing tools – initial version. DICE EUH2020 Project Deliverable, 2016.
[14] AI Khuri, JA Cornell, and SS Sablani. Response surfaces: Designs and analyses, revised andexpanded. Drying Technology, 15(5):1657–1658, 1997.
[15] Francesco Marconi Marcello M. Bersani, Madalina Erascu. D3.5 dice verification tools initialversion.
[16] Mehryar Mohri, Afshin Rostamizadeh, and Ameet Talwalkar. Foundations of Machine Learning.The MIT Press, 2012.
[17] Animesh Patcha and Jung-Min Park. An overview of anomaly detection techniques: Existingsolutions and latest technological trends. Comput. Netw., 51(12):3448–3470, August 2007.
[18] F. Pedregosa, G. Varoquaux, A. Gramfort, V. Michel, B. Thirion, O. Grisel, M. Blondel, P. Pretten-hofer, R. Weiss, V. Dubourg, J. Vanderplas, A. Passos, D. Cournapeau, M. Brucher, M. Perrot, andE. Duchesnay. Scikit-learn: Machine learning in Python. Journal of Machine Learning Research,12:2825–2830, 2011.
[19] Hesam Sagha, Hamidreza Bayati, Jose Del R. Millan, and Ricardo Chavarriaga. On-line anomalydetection and resilience in classifier ensembles. Pattern Recogn. Lett., 34(15):1916–1927, Novem-ber 2013.
[20] Erich Schubert, Alexander Koos, Tobias Emrich, Andreas Zufle, Klaus Arthur Schmid, and ArthurZimek. A framework for clustering uncertain data. PVLDB, 8(12):1976–1979, 2015.
[21] Robert Tibshirani. Regression shrinkage and selection via the lasso: a retrospective. Journal of theRoyal Statistical Society: Series B (Statistical Methodology), 73(3):273–282, 2011.
[22] Tom White. Hadoop: The Definitive Guide. O’Reilly Media, Inc., 1st edition, 2009.
[23] Matei Zaharia, Mosharaf Chowdhury, Michael J. Franklin, Scott Shenker, and Ion Stoica. Spark:Cluster computing with working sets. In Proceedings of the 2Nd USENIX Conference on Hot Topicsin Cloud Computing, HotCloud’10, pages 10–10, Berkeley, CA, USA, 2010. USENIX Association.