Quality-Assurance Plan and Field Methods for Quality-of-Water Activities, U.S. Geological Survey, Idaho National Engineering Laboratory, Idaho By Larry J. Mann U.S. GEOLOGICAL SURVEY Open-File Report 96-615 Idaho Falls, Idaho October 1996
Transcript
Quality-Assurance Plan and Field Methods for Quality-of-Water Activities, U.S. Geological Survey, Idaho National Engineering Laboratory, Idaho
By Larry J. Mann
U.S. GEOLOGICAL SURVEY
Open-File Report 96-615
Idaho Falls, Idaho
October 1996
U.S. DEPARTMENT OF THE INTERIOR
BRUCE BABBITT, Secretary
U.S. GEOLOGICAL SURVEY
GORDON P. EATON, Director
Any use of trade, product, or firm names is for descriptive purposes only and does not imply endorsement by the U.S. Government.
For additional information write to:
U.S. Geological Survey INEL,MS4148 P.O. Box 2230 Idaho Falls, ID 83403
Copies of this report can be purchased from:
U.S. Geological Survey Box 25286Denver Federal Center Denver, CO 80225-0286
CONTENTS
Introduction...................................................................... 1Purpose of and responsibility for maintaining the quality-assurance plan ................... 1Scope........................................................................ 2
Methods ........................................................................ 3Sample containers and preservation methods ......................................... 3Field equipment................................................................ 4Decontamination procedures at the well head......................................... 5Sample collection .............................................................. 5
Quality assurance ................................................................. 9Analytical methods and quality control samples....................................... 9Review of analyses ............................................................. 12Performance audits ............................................................. 12Corrective actions .............................................................. 13Reporting of data............................................................... 18
Figure 1. Example of label attached to each sample bottle ................................. 62. Example of the analytical services request form for the National Water
Quality Laboratory ....................................................... 73. Example of sample record sheet for the Radiological and Environmental
Sciences Laboratory....................................................... 84. Example of sheet from the Water Quality Field Logbook ......................... 105. Example of chain-of-custody record ......................................... 11
TABLES
Table 1. Containers and preservatives used for water samples, Idaho NationalEngineering Laboratory and vicinity .......................................... 3
2. Maximum contaminant level of types of radioactivity and selected radionuclidesin drinking water ......................................................... 13
3. Maximum contaminant levels and minimum reporting levels of selected traceelements in drinking water................................................. 14
4. Maximum contaminant levels and minimum reporting levels of selected nutrients,dissolved organic carbon, and anionic surfactants in drinking water ................ 14
5. Maximum contaminant levels and minimum reporting levels of selectedinsecticides and gross poly chlorinated compounds in drinking water................ 15
6. Maximum contaminant levels and minimum reporting levels of chlorophenoxy-acid herbicides and other herbicides in drinking water ........................... 16
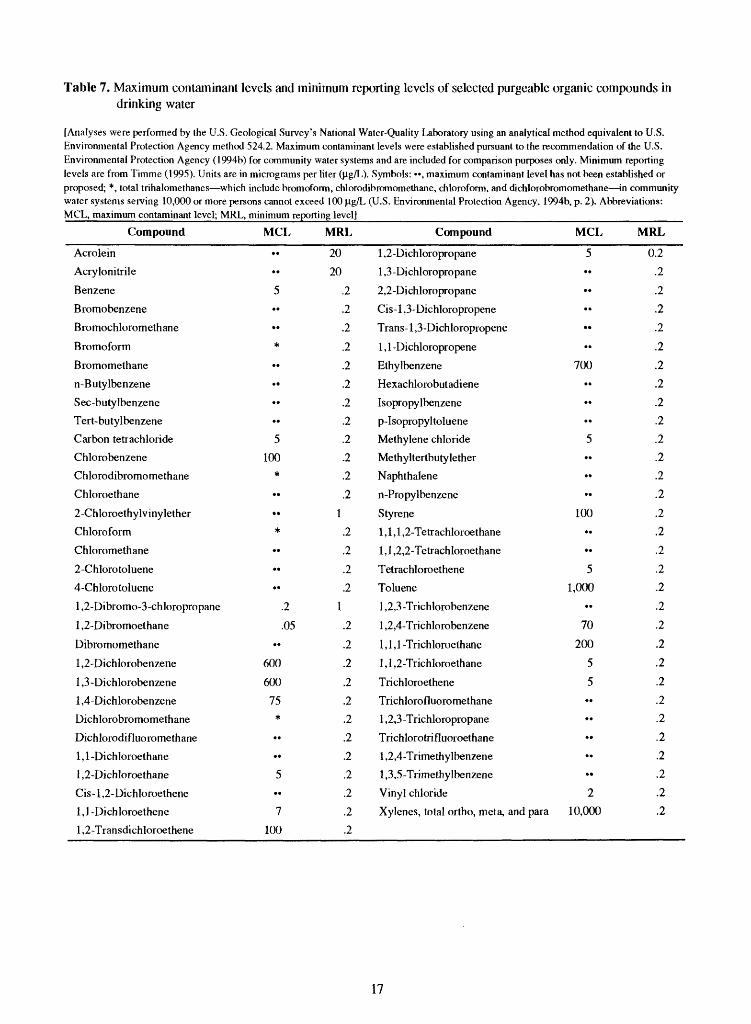
7. Maximum contaminant levels and minimum reporting levels of selectedpurgeable organic compounds in drinking water................................ 17
in
ATTACHMENTS
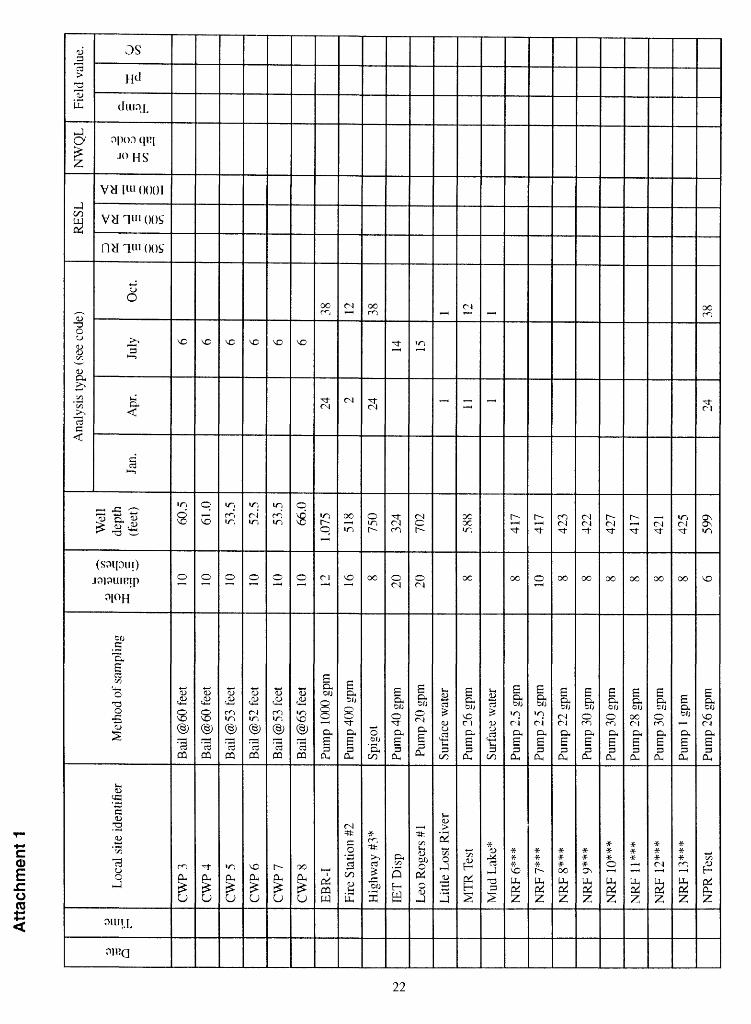
Attachment 1. Well and pump information and sampling schedules for selected wellsand streamflow sites (11 pages) ........................................ 21
2. Data-quality objectives for water samples analyzed by the National Water Quality Laboratory (1 page)...................................... 32
3. Data-quality objectives for radionuclides in water samples analyzed by the Radiological and Environmental Sciences Laboratory (4 pages).......... 33
4. Inventory of water-quality field equipment (1 page)......................... 37
IV
Quality-Assurance Plan and Field Methods for Quality-of-Water Activities, U.S. Geological Survey, Idaho National Engineering Laboratory, Idaho
by Larry J. Mann
INTRODUCTION
Water-quality activities at the Idaho National Engineering Laboratory (INEL) Project Office are part of the U.S. Geological Survey's (USGS) Water Resources Division (WRD) mission of appraising the quantity and quality of the Nation's water resources. The activities are conducted in cooperation with the U.S. Department of Energy's (DOE) Idaho Operations Office and the U.S. Environmental Protection Agency, Region 10. Results of the water-quality investigations are presented in various USGS publications or in refereed scientific journals. The results of the studies are highly regarded and are used with confidence by researchers, regulatory and managerial agencies, and interested civic groups.
In its broadest sense, quality assurance refers to doing the job right, the first time. It includes the functions of planning for products, review and acceptance of the products, and an audit designed to evaluate the system that produces the product. Quality assurance and quality control differ in that: quality control ensures that things are done correctly given the "state-of-the-art" technology; and quality assurance ensures that quality control is maintained within specified limits.
Purpose of and Responsibility for Maintaining the Quality-Assurance Plan
The purpose of the Quality Assurance Plan (QAP) for water-quality activities performed by
the INEL Project Office is to maintain and im prove the quality of technical products, and to provide a formal standardization, documentation, and review of the activities that lead to these pro ducts. The principles of this plan are as follows:
1. Water-quality programs will be planned in a competent manner and activities will be mon itored for compliance with stated objectives and approaches. The objectives and approach es are defined in an annual project work plan.
2. Field, laboratory, and office activities will be performed in a conscientious and professional manner in accordance with specified WRD practices and procedures by qualified and experienced employees who are well trained and supervised. If, or when, WRD practices and procedures are inadequate, data will be collected in a manner that its quality will be documented.
3. All water-quality activities will be reviewed for completeness, reliability, credibility, and con- formance to specified standards and guidelines.
4. A record of actions will be kept to document the activity and the assigned responsibility.
5. Remedial action will be taken to correct activities that are deficient.
The overall responsibility for maintaining this QAP belongs to the Chief of the INEL Project Office and the Quality-Assurance Officer. The principal investigators for geochemistry and radio- chemistry and the lead personnel for the water- quality monitoring network, however, are directly responsible for the day-to-day maintenance of the
QAP. The QAP will be formally revised and reprinted every 2 to 4 years; changes that take place in the interim, however, will be communi cated by memoranda to project office personnel on an as-needed basis.
Scope
The QAP for water-quality activities at the INEL defines procedures and tasks performed by project-office personnel that ensure the reliability of water-quality data. Virtually all of the princi ples of the plan have been in effect during past and current operations, but the QAP provides a method to formalize and communicate the plan to all employees of the project office and to users of the hydrologic data and interpretive reports. A comprehensive list of references that contains guidelines used in data collection is given in the section entitled "Selected References." Tasks not described by the references owing to field conditions are detailed in the following sections.
Information on water-quality sampling schedules, data quality objectives, and water- quality field equipment are included in attach ments 1 to 4.
Monitoring Networks
The water-quality monitoring network for the INEL consists of about 180 sites and include pro duction wells, wells dedicated to water-quality monitoring, and surface-water sites. The network originally was established to document the distri bution and concentration of radionuclides and industrial chemicals contained in wastewater discharged at the INEL either to the Snake River Plain aquifer or to the overlying perched ground- water zones. Disposal has taken place through deep disposal wells and shallow infiltration ponds. Recently, wells have been drilled to ascertain whether leachates from landfills have migrated to the aquifer. Additional monitoring sites will be selected if and when they are needed to better document the migration of solutes.
The frequency of sampling wells in the INEL network varies depending on the distance a particular well is from a disposal site, the historic
concentration of the radioactive or chemical waste in the ground water, and the location of the well relative to other wells. In general, water samples routinely are collected at 3- to 6-month intervals. The wells and streams at which water samples are collected, the method and frequency of sample collection, and the constituents routinely analyzed for are shown on attachment 1. In addition to the routine sampling, some wells periodically may be sampled for other constituents, including, chlorine-36, iodine-129, trace metals, and purge- able organic compounds. The frequency of sampling ranges from monthly to biannually depending on whether the constituent(s) of interest has been detected during previous sampling campaigns.
In addition to the INEL water-quality monitor ing network, 50 wells and 19 springs between the southern boundary of the INEL and the Hagerman area are sampled at 1- to 3-year intervals. This off- site water-quality network was established to mon itor natural contaminants and manmade pollutants in the aquifer that potentially could migrate from the INEL to hydraulically downgradient popu lated and agricultural areas.
Data-Quality Objectives
Data-quality objectives are qualitative and quantitative criteria that describe the data needed by managers or regulators to support environmen tal decisions and actions or by scientists to study natural or induced chemical processes in the Snake River Plain aquifer. The first steps of the scientific method are somewhat analogous to and are supported by data-quality objectives. Identify ing problems is followed by hypothesizing solu tions. Unbiased and thorough scientific experi ments are proposed and then conducted, analyzed, and reported in the literature for peer review and use by others.
Data-quality objectives for the water-sample analyses by the USGS's National Water Quality Laboratory (NWQL) are included in attachment 2; objectives for radionuclides in water sample analyzed by and for the U.S. Department of Energy's Radiological and Environmental Sciences Laboratory (RESL) are in attachment 3.
METHODS
Sample containers, sample-preservation meth ods, field equipment, and well-head decontamina tion and sample-collection procedures are integral and crucial steps in assuring that data-quality objectives are achieved at the field level. Equally important are the analytical methods, and quality- control and quality-assurance activities exercised by the laboratories that analyze the samples.
Sample Containers and Preservation Methods
Sample containers and preservation methods
differ depending on the chemistry of the con stituents being analyzed. Samples analyzed by the NWQL are containerized and preserved in accord ance with laboratory requirements specified by Timme (1995). Containers and chemical preserva tives are supplied by the NWQL, where they undergo a rigorous quality control to ensure that they are free of contamination (Pritt, 1989, p. 75). Samples analyzed by the RESL are containerized and preserved in accordance with requirements specified by the laboratory's Analytical Chemistry Measurements Team; changes in procedures are documented in writing. Containers and preservatives for selected constituents are summarized on table 1.
Table 1. Containers and preservatives used for water samples, Idaho National Engineering Laboratory and vicinity[Abbreviations: L, liter, mL, milliliter, HNO3, nitric acid; HjSO^ sulfuric acid; 1^20207^ potassium dichromate; C, degrees Celsius. Analyzing laboratory: NWQL U.S. Geological Survey's National Water Quality Laboratory; RESL U.S. Department of Energy's Radiological and Environmental Sciences Laboratory]
Type of constituent
Anions, dissolved
Cations, dissolved
Cations, total
Metals, dissolved
Metals, total
Mercury, dissolved
Mercury, total
Chromium, total
Chromium, dissolved and hexavalent
Nutrients, dissolved
Nutrients, total
Purgeable organic
Container
Type
Polyethylene
Polyethylene, acid- rinsed
Polyethylene, acid- rinsed
Polyethylene, acid- rinsed
Polyethylene, acid- rinsed
Glass, acid-rinsed
Glass, acid-rinsed
Polyethylene, acid- rinsed
Polyethylene, acid- rinsed
Polyethylene, brown
Polyethylene, brown
Polyethylene, brown
Glass, baked
Volume
250 mL
500 mL
500 mL
250 mL
250 mL
250 mL
250 mL
250ml
500ml
125 mL
125 mL
125 mL
40 mL
Preservative
Type
None
HN03
HN03
HN03
HNO3
K2Cr,207/
HN03
K2Cr2O7/HN03
HN03
HNO3
None
H2S04
H2S04
None
Volume
None
2mL
2mL
ImL
ImL
10 mL
10 mL
ImL
2mL
None
ImL
ImL
None
Othertreatment
Filter
Filter
None
Filter
None
Filter
None
None
Filter
Filter, chill 4°C
Filter, chill 4°C
Chill 4°C
Chill 4°C
Analyzing laboratory
NWQL
NWQL
NWQL
NWQL
NWQL
NWQL
NWQL
NWQL
NWQL
NWQL
NWQL
NWQL
NWQLcompounds
Semivolatile organic compounds
Glass, baked 1L None None Chill 4°C NWQL
Table 1. Containers and preservatives used for water samples, Idaho National Engineering Laboratory and vicinity Continued
Analytical and other associated equipment used in the field include: pH and specific- conductance meters; thermometers; titrators for dissolved oxygen and alkalinity; a peristaltic pump; an in-line disposable filter capsule with a 0.45-micron filter; and associated glassware. The analytical equipment is housed and usually oper ated in mobile field laboratories. The purpose of the mobile laboratories is threefold: (1) they pro vide a relatively clean area to measure field para meters while minimizing the potential for contam ination or degradation of the samples from the wind, dust, rain, snow and sunlight; (2) they are used as storage for sample and shipping con
tainers, chemical reagents and preservatives, analytical instrumentation, and deionized water used for decontaminating equipment in the field; and (3) they provide a place where samples can be containerized, preserved and placed in shipping containers within minutes after withdrawal from a well or stream.
Instruments used to measure field water- quality parameters, such as pH and specific con ductance, are maintained and calibrated in the field or in the laboratory in accordance with pro cedures specified by the instrument manufacturer. Instrument calibration is checked and, if neces sary, instruments are recalibrated at each sam pling site; calibration methods are recorded in a
field logbook (see figure 4 in section on sample collection.) A logbook that documents changes to equipment for example, modifications to pH and conductivity meters is kept in the office. An inventory of field equipment is given in attach ment 4.
Decontamination Procedures at the Well Head
Wells that are equipped with dedicated sub mersible or line-shaft turbine pumps do not require decontamination except for the equipment that is attached to the discharge pipe to accommo date the collection of a water sample. Addition ally, at least three wellbore volumes of water are pumped from the well to remove stagnant water and to rinse and equilibrate the pump and delivery line. Production wells generally have a spigot at or near the well head; decontamination consists of thoroughly rinsing the spigot with pumped ground water to remove foreign materials.
Sample collection is facilitated and excess water is diverted away from the well head by fitting wells equipped with dedicated pumps with a portable discharge pipe about 2 ft long. The discharge pipe has a 1.5-in. I.D. (inside diameter) and is equipped with a gate valve to control the flow rate. A T-joint is inserted into the pipe between the well head and the control valve and a series of nipples, a valve to control the flow rate of the sampling port, and connectors are attached to the T-joint to reduce the diameter so that a 1/4- in. I.D. delivery line can be attached as a sam pling point. The line is made up with two 1/4-in. I.D. nipples connected with a 90-degree elbow to facilitate sample collection. All fittings and pipes are stainless steel and are rinsed with deioni/ed water before installation at the well head. Subse quent flushing with several hundred to thousands of gallons of purged well water further reduces the possibility of cross-contamination with water from previously sampled wells.
At wells that are not equipped with dedicated pumps, one of two methods is used to collect water samples depending on the amount of water in the well and depth to water. A generator- powered portable pump is used to collect samples
from wells at which the depth to water is less than 200 ft. The portable pump and attendant hose routinely are decontaminated by flushing many cycles of water and detergent through them and then rinsing the equipment with about 30 gallons of tap water and about 25 gallons of deionized water; 1.5 gallons of water is enough to flush the pump and hose one time. Before the pump is installed in a well, it is thoroughly flushed by pumping deionized water through pump and discharge hose. Samples of the deionized-water rinsate periodically are collected and analyzed to document whether the portable pumps are contaminated by constituents of interest.
For wells without dedicated pumps and at which the depth to water exceeds 200 ft, and for wells with only a few feet of water in the well- bore, a bailer is used for collecting water samples. The bailer and that part of the bailer line that enters the well are washed with hot water and detergent and rinsed with deionized water prior to use; samples of the rinsate periodically are collected and analyzed to document whether the equipment is contaminated by constituents of interest. At some wells, bailers are dedicated to and stored in the well casing. This eliminates the possibility of cross-contamination of samples from different wells.
Sample Collection
At wells equipped with a dedicated pump or at which the portable pump is used to ensure that water representative of the Snake River Plain aquifer or perched ground-water zone is sampled, a volume of water equivalent to a minimum of 3 wellbore volumes is pumped prior to collecting the samples; at many wells, 5 to 10 wellbore volumes are pumped. The diameter of the well- bore, rather than the volume of the casing is used to calculate the minimum volume because of the potentially large difference between the two. In addition, temperature, specific conductance, and pH arc monitored periodically during pumping using methods described by Wood (1981) and Hardy and others (1989). Field measurements made immediately prior to sample collection are used to represent those for the sample. When
these measurements stabilize, indicating probable hydraulic and chemical stability, a water sample is collected using the following steps:
1. The field person responsible for collecting the water sample wears disposable vinyl gloves and stands in a position where neither the collector nor the sample can become contaminated.
2. The outside of the sample delivery line is thoroughly rinsed with water pumped from the well.
3. If appropriate, sample containers and filtration equipment are thoroughly rinsed with water pumped from the well or surface-water site before being used. A new, disposable capsule filter with a 0.45-micron membrane filter is used at each site. One liter of deionized water or water from the well is used to rinse the capsule filter prior to sample collection to remove any surfactants that are adhered to the filters. The capsule filter is inverted during rinsing to remove any trapped air bubbles.
4. For ground-water samples from wells equipped with dedicated pumps, the capsule filter is connected to the sample port with pre-cleaned Tygon tubing; unfiltered samples are collected directly from the sample port. For surface- water samples and bailer samples, a grab sample is collected in a pre-cleaned container and the inlet tubing of a peristaltic pump is placed into the container to supply sample water to the capsule filter. Unfiltered samples are collected by submersing the sample con tainer into the surface water-body or drawing water from a pre-cleaned container.
5. Samples are capped loosely and moved into the mobile field laboratory where they are un capped and preserved as described in Table 1.
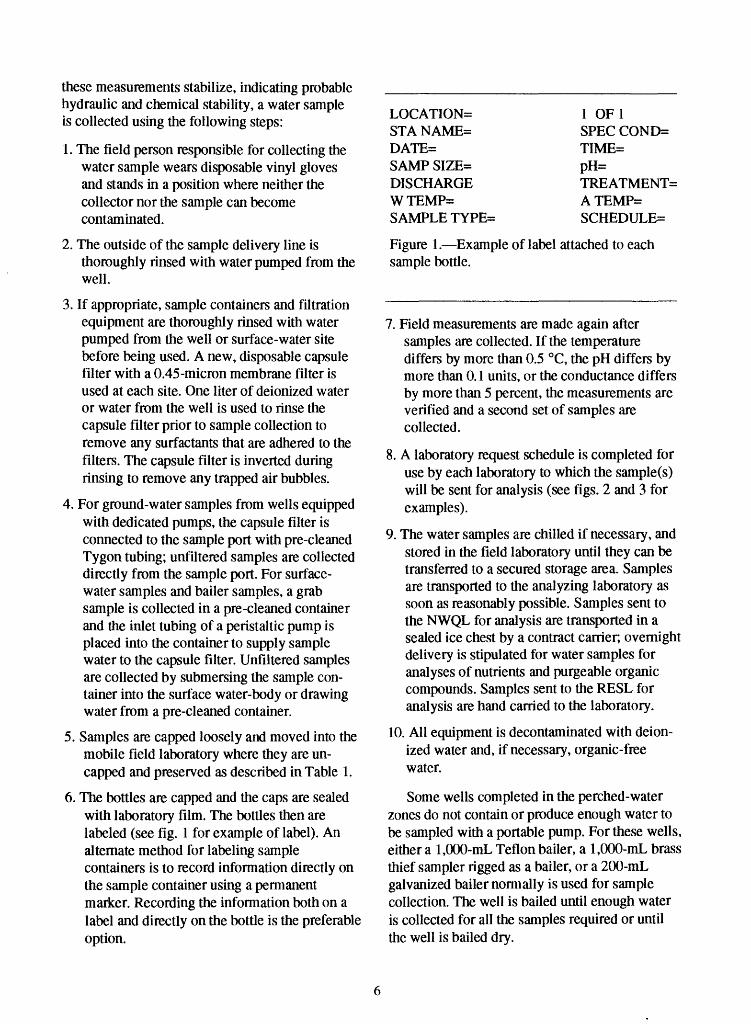
6. The bottles are capped and the caps are sealed with laboratory film. The bottles then are labeled (see fig. 1 for example of label). An alternate method for labeling sample containers is to record information directly on the sample container using a permanent marker. Recording the information both on a label and directly on the bottle is the preferable option.
LOCATION= STA NAME= DATE= SAMP SIZE= DISCHARGE WTEMP= SAMPLE TYPE=
1 OF1SPEC COND=TIME=PH=TREATMENTSATEMP=SCHEDULE=
Figure 1. Example of label attached to each sample bottle.
7. Field measurements are made again after samples are collected. If the temperature differs by more than 0.5 °C, the pH differs by more than 0.1 units, or the conductance differs by more than 5 percent, the measurements are verified and a second set of samples are collected.
8. A laboratory request schedule is completed for use by each laboratory to which the sample(s) will be sent for analysis (see figs. 2 and 3 for examples).
9. The water samples are chilled if necessary, and stored in the field laboratory until they can be transferred to a secured storage area. Samples are transported to the analyzing laboratory as soon as reasonably possible. Samples sent to the NWQL for analysis are transported in a sealed ice chest by a contract carrier, overnight delivery is stipulated for water samples for analyses of nutrients and purgeable organic compounds. Samples sent to the RESL for analysis are hand carried to the laboratory.
10. All equipment is decontaminated with deion ized water and, if necessary, organic-free water.
Some wells completed in the perched-water zones do not contain or produce enough water to be sampled with a portable pump. For these wells, either a 1,000-mL Teflon bailer, a 1,000-mL brass thief sampler rigged as a bailer, or a 200-mL galvanized bailer normally is used for sample collection. The well is bailed until enough water is collected for all the samples required or until the well is bailed dry.
U.S. GEOLOGICAL SURVEY - NATIONAL WATER-QUALITY LABORATORY ANALYTICAL SERVICES REQUEST FORM
PROGRAM/PROJECT:___NPDES NAWQA POSSIBLE HAZARDS____________________
APPROVAL NO..DRINKING WATER FILL IN OTHER
Md 11/34 -fCcBBvnt* to b* itorad by the laboratory Mandatory for acceptance for laboratory analyaii Mandatory for (tonga in N&TSTORB/NWIS
Figure 2. Analytical services request form for the National Water-Quality Laboratory.
00
" n o a c.
o'
o*
09 o' c.
tn I 3
£T 00 o cw I 3 S
C3
Ref
ID
548
4 1
RE
SL
Rou
tine
Urg
ent
No
n-R
ou
tine
..D
ate
Nee
ded.
UN
ITE
D S
TA
TE
S D
EP
AR
TM
EN
T O
F E
NE
RG
Y
IDA
HO
OP
ER
AT
ION
S O
FF
ICE
RA
DIO
LO
GIC
AL
AN
D E
NV
IRO
NM
EN
TA
L S
CIE
NC
ES
LA
BO
RA
TO
RY
SA
MP
LE
RE
CO
RD
SH
EE
T
Ons
ite
Offsi
te
Ser
ial
No.
Sam
ple
Fro
m:
Col
lect
ed B
y
Org
aniz
atio
n
Dat
e S
ent
Sam
ple
No.
Dat
eH
our
Sam
ple
Desc
riptio
n
Sam
p
Ana
ly
No
tifi
Ana
l, fo
r
es R
ec
sis
Cor
r
=d-
sivf
id-
plet
ed'
Date
:
Inst
. us
edQ
uant
, us
edD
ate
cntd
.C
ount
tim
eG
ross
co
unt
Bkg
d.
Ana
lyze
d
App
rove
c
Net
co
unt
By:
1 R
y
Res
ult
± 1S
;O (
atta
ched
)
When the bailer is retrieved, its contents either are placed directly in bottles for raw samples or in a pre-cleaned container as described in step 4. Field measurements are made on excess water from the bailer or in the pre-cleaned container. After the sample bottle is filled with either raw or filtered water, samples are preserved appropriate ly and labeled, stored, and shipped as described in steps 6-9.
Some perched-water wells contain enough water to use a portable pump, but have such low recovery rates that the wells pump dry before 2 or 3 wellbore volumes can be pumped. For these wells, a sample is collected when temperature, pH, and specific conductance measurements stabilize. If the well pumps dry before measure ments stabilize, the field person waits for the well to recover to collect a pumped or bailed sample, or, if the well does not recover, a grab sample is collected from the pre-rinsed bucket into which water is discharged while pumping. Exceptions such as these to usual sample-collection pro cedures are described in the field logbook.
An added precaution is used at wells that are sampled with a portable submersible pump or bailer. The concentrations of most contaminants are greatest in wells nearest disposal sites and the concentrations decrease with increasing distance from the disposal sites. Therefore, when con ditions permit, the most distant wells are sampled first. Wells closest to sources of contamination generally have the greatest contaminant concentrations and are sampled last. This process of sampling minimizes the potential for measurable amounts of cross contamination between wells because of the portable equipment.
Conditions at the well during sample collec tion are recorded in a bound field logbook (fig. 4) and a chain-of-custody record (fig. 5) is used to track samples from the time of collection until delivery to the RESL or until mailing to the NWQL. These records are available for inspection at the USGS Project Office at the INEL.
QUALITY ASSURANCE
The USGS's Quality-Assurance Program at the INEL Project Office incorporates the previ ously described methods with several other ele ments: (1) analytical methods used by the labora tories; (2) quality-control samples; (3) review of analytical results of chemical constituents provid ed by the laboratories; (4) audits of performance in the field and in the laboratory; (5) corrective actions to resolve problems with field and labora tory methods; and (6) reporting of data. These elements effectively are performed to assure the following: (1) reliability of the water-quality data; (2) compatibility of the data with data collected by other organizations at the INEL; and (3) the data meet the programmatic needs of the DOE and its contractors and the scientific and regula tory communities.
Analytical Methods and Quality- Control Samples
A detailed description of internal quality con trol and of the overall quality-assurance practices used by the NWQL is provided in reports by Friedman and Erdmann (1982) and Pritt and Raese (1992); quality-control practices at the laboratory are described by Jones (1987); and quality-assurance data for routine water analyses are presented in a report by Maloney and others (1993). Additional quality assurance instituted by the INEL Project Office includes collection and analysis of the following: (1) duplicate samples two or more samples collected concurrently or sequentially and sent to different laboratories; (2) blind replicates duplicate samples with different sample identification numbers submitted to a laboratory; (3) blank samples samples of deion- ized water sent to a laboratory and identified as routine samples; (4) equipment blanks rinsate collected during decontamination procedures; (5) splits large sample volumes divided into two or more equal volumes and sent to different labor atories for analysis; (6) trip blanks laboratory supplied samples of boiled deionized water that travel with water samples from time of collection to time of analysis; and (7) spiked samples samples to which a known concentration of a
Date:__ /___/___ Time:______ Weather conditions
Location: Latitude_________ Longitude____________ Sequence Number
Local Site Identification: ____________________________________________
Purpose of Sampling: ______________________________________________
Type of Sample (circle one): Ground water Surface water Other__
Number of Containers:_____ Size of Containers/Method of Preservation:
Fiigure 4. Sheet from Water-Quality Field Logbook.
10
IIcs>
CO
111
_£ I "
E "
Figure 5. Chain-of-custody record.
11
constituent is added. Analytical methods used by the NWQL are described by Bamett and Mallory (1981), Faires (1992), Fishman (1993), Fishman and Friedman (1989), Goerlitz and Brown (1972), Rose and Schroeder (1995), Skougstad and others (1979), Thatcher and others (1977), and Wershaw and others (1987). The lype of analysis and analytical procedure are specified on the NWQL services request form (fig. 2).
A discussion of procedures used by the RESL for the analysis of radionuclides in water is pro vided in reports by Bodnar and Percival [eds.] (1982) and U.S. Department of Energy (1995). Additional quality assurance implemented by the INEL Project Office for samples sent to the RESL is consistent with procedures used for samples sent to the NWQL. The type of analysis to be performed on a water sample is specified on the RESL sample record sheet (fig. 3).
In general, about 10 percent of the samples collected are dedicated to quality assurance. That is, for every 10 samples submitted to one of the laboratories for analysis, at least one is a blind replicate, a blank, a split, or another type of quality-assurance sample. For samples which are to be analyzed for non-routine constituents, 15 to 20 percent of the samples are dedicated to quality assurance.
Review of Analyses
After the analytical results are obtained from the analyzing laboratory, the concentration of each constituent of interest is reviewed by person nel at the INEL Project Office for consistency, precision, and accuracy. Factors considered during the review are:
1. The historical concentration of the solute at the site where the sample was collected;
2. The concentration of the solute in replicate, split, blank, or other quality-assurance samples;
3. The concentration of the solute in nearby wells that obtain water from the same aquifer or perched-water zone;
4. A review of waste-disposal records and changes in disposal techniques, land use, and recharge that may influence the concentration of a solute(s);
5. Cation-anion balance of analyses for which common ions are analyzed; and
6. Other accepted tests for accuracy of analytical results, when appropriate (Hem, 1985, p. 163- 165).
Constituents for which previous analyses have been made are reviewed for consistency with items 1, 2, and 3. If a constituent exceeds or is less than the historical trend, if it differs markedly from the concentration in water from nearby wells, or if an initial analysis for a solute exceeds 80 percent of the maximum contaminant level (MCL) for that constituent set by the Environmen tal Protection Agency, either a re-analysis by the laboratory is requested or a second sample is collected and analyzed to verify the concentration of the solute in the water. If resampling is neces sary, replicates generally are collected to evaluate laboratory precision. Constituents for which MCLs have been proposed or established are shown on tables 2-7.
If analytical results indicate that concentra tions in samples from one site vary by more than 50 percent for no obvious reason, the results are evaluated by replicate sampling. If the analytical results for the replicates do not agree, the analyzing laboratory is contacted to resolve the problem.
Performance Audits
Performance audits are conducted routinely at three levels: (1) at the field level, (2) at the laboratory level, and (3) through National Field Quality Assurance Tests. At the field level, the Project Chief or a designee routinely accompanies the field personnel to a selected number of sites to ascertain whether proper field techniques are used to collect and preserve the samples and to ensure safety procedures. Replicate and split samples are used to evaluate the precision of the field laboratory methods; spikes and reference samples are used to measure accuracy.
12
Table 2. Maximum contaminant levels for types of radioactivity and selected radionuclides in drinking water
[The maximum contaminant levels were established pursuant to the recommendations of the U.S. Hnvironmental Protection Agency (1994a) for community water systems and are for comparison purposes only. The maximum contaminant level given for gross alpha-particle radioactivity includes radium-226 but excludes radon and uranium. The maximum contaminant level given for gross beta-particle and gamma radioactivity excludes radioactivity from natural sources and should be used only for comparison. Maximum contaminant level values listed for strontium-90 and tritium are average annual concentrations assumed to produce a total body or organ dose of 4 mrem/year (millirem per year) of beta-particle radiation. Abbreviations: pCi/L picocuries per liter: |ig/L microgram per liter; mrem millirem]
Type of radioactivity or radionuclide Maximum contaminant level
Gross alpha-particle radioactivity
Gross beta-particle and gamma radioactivity
Radium-226 plus radium-228
Radium-226
Radium-228
Radon-222
Strontium-90
Total uranium
Tritium
15pCi/L
4 mrem/year
5pCi/L
20pCi/L
20pCi/L
300 pCi/L
8pCi/L
20ng/L
20,000 pCi/L
The INEL Project Office participates in the National Field Quality Assurance Program estab lished by the USGS to evaluate the accuracy of water-quality field measurements. Quality- assurance samples are sent to field personnel for testing. The results are sent back to the water qual ity service unit for evaluation. If field personnel or equipment do not pass the test, corrective action is taken. The program is described in detail by Erdmann and Thomas (1985).
In addition to the routine performance audits, water-quality activities at the INEL Project Office periodically are monitored and reviewed by other USGS personnel: the Water-Quality Specialists for the Idaho District, Boise, Idaho; personnel at the Office of the Regional Hydrologist, Western Region, Menlo Park, Calif.; and personnel at the Office of Water Quality at Headquarters, Reslon, Va. Reviews by personnel at the Idaho District take place at 1- to 2-year intervals and by the Western Region Office and Office of Water Quality at 2- to 3-year intervals. The reviews are summarized in writing and distributed to the Project Office, Regional Office, and the Office of Water Quality. If deficiencies are documented, a written reply outlining corrective action is required of the Project Office.
Corrective Actions
If the performance audits indicate inconsisten cies or inadequacies in field methods or in analyt ical results by the laboratories, the problems are documented and the field personnel or laborator ies are notified in writing of the inconsistencies or inadequacies. Training is provided to the field personnel as needed and the frequency of perform ance audits is increased until the performance is judged by the INEL Project Office Chief as suitable and consistent with written guidelines.
Inconsistencies and inadequacies in laboratory analyses are discussed with or submitted in writing to the appropriate laboratory director, and who is responsible for initiating the appropriate action to resolve the problem. To evaluate whether appropriate actions are taken, the fre quency and numbers of replicate, blank, split, other quality assurance samples are increased until it is demonstrated that problems in the laboratory methods are resolved.
If project-office personnel discover a problem with sampling procedures, equipment calibration, or data review analysis and interpretation that cannot be resolved at the project level, the Idaho District Water-Quality Specialist is notified of the problem. If he or she cannot resolve the problem in consultation with the Regional Water-Quality
13
Table 3. Maximum contaminant levels and minimum reporting levels of selected trace elements in drinking water[The maximum contaminant levels are for total measurements and were established pursuant to the recommendations of the U.S. Environmental Protection Agency (1994a, p. 753; 1994b) for community water systems and are for comparison purposes only. Secondary maximum contaminant levels in brackets are from U.S. Environmental Protection Agency (1994a, p. 836). Minimum reporting levels for the U.S. Geological Survey's National Water Quality Laboratory are from Timme (1995); concentrations for constituents for which two minimum reporting levels are shown, can be determined by two analytical methods. Units are in micrograms per liter (jag/L). Symbols: , maximum contaminant level has not been established; *, lead has an action level of 15 JJg/L]
Constituent
Aluminum
Arsenic
Barium
Beryllium
Cadmium
Chromium, dissolved
Chromium, hexavalent
Chromium, total
Cobalt
Copper
Iron
Lead
Lithium
Manganese
Mercury
Molybdenum
Nickel
Selenium
Silver
Strontium
Vanadium
Zinc
Maximum contaminant level
[50 to 200]
50
2,000
4
5
-
100
[1,000]
[300]*
[50]
2
100
50
[100]
[5,000]
Minimum reporting level
1,10
1
1
.5,1
1
5
1
1
1,3
1,10
3
1
4
1
.1
10
1,10
1
1
.5
6
1,3
Table 4. Maximum contaminant levels and minimum reporting levels of selected nutrients, dissolved organic carbon, and anionic surfactants in drinking water
[The maximum contaminant levels were established pursuant to the recommendations of the U.S. Environmental Protection Agency (1994a, p. 753) for community water systems and are included for comparison purposes only. The secondary maximum contaminant level in brackets is from U.S. Environmental Protection Agency (1994a, p. 836). Minimum reporting levels are from Timme (1995). Units are milligrams per liter. Symbol: , maximum contaminant level has not been established or proposed]
Constituent Maximum contaminant level Minimum reporting level
Ammonia (as nitrogen)
Nitrite (as nitrogen)
Nitrite plus nitrate (as nitrogen)
Orthophosphate (as phosphorus)
Dissolved organic carbon
Anionic surfactants
1
10
[0.5]
0.015
.01
.05
.01
.1
.02
14
Table 5. Maximum contaminant levels and minimum reporting levels of selected insecticides and gross polychlorinatcd compounds in drinking water
[The maximum contaminant levels, in micrograms per liter, were established pursuant to the recommendations of the U.S.
Environmental Protection Agency (1994b) for community water systems and are included only for comparison purposes.
Proposed maximum contaminant levels shown in parentheses are from U.S. Environmental Protection Agency (1994b).
Minimum reporting levels are from Timme (1995). Symbols: , indicates that a maximum contaminant level has not been
established or proposed for that compound. Abbreviation: \igJL, microgram per liter]
Carbamate insecticides: minimum reporting level is 0.5 (ig/L
Insecticide Maximum contaminant level Insecticide Maximum contaminant level
Aldicarb
Aldicarb sulfone
Aldicarb sulfoxide
Carbaryl (Sevin)
Carbofuran
7
7
7
40
3-Hydroxyearbofuran
Methomyl
1-Naphthol
Ox a my 1
Propham
200*
Organophosphorus insecticides: minimum reporting level is 0.01 |ig/L
Insecticide Maximum contaminant level Insecticide Maximum contaminant level
Chlorpyrifos; Dursban
Diazinon
Disulfoton
Ethion
Fonofos
Malathion
Methyl parathion
Methyl trithion
Parathion
Phorale
Trilhion
Organochlorine insecticides: minimum reporting level is 0.01 jig/L except for chlordane and perthane (0.1 ug/L),and toxaphene (1.0 |Jg/D
Insecticide
Aldrin
Chlordane
DDD
DDE
DDT
Dieldrin
Endosulfan
Endrin
Maximum contaminant level Insecticide
« Heptachlor
2 Heptachlor epoxide
Lindane
« Methoxychlor
Mirex
Perthane
« Toxaphene
2
Maximum contaminant level
0.4
.2
.2
40
3
Gross polychlorinated compounds, minimum reporting level is 0.1 ug/L
Compound Maximum contaminant level
Gross polychlorinated biphenyls (PCR)
Gross polychlorinated naphthalenes (PCN)
0.5
15
Table 6. Maximum contaminant levels and minimum reporting levels of chlorophenoxy-acid herbicides and other herbicides in drinking water
[Analyses were performed by the U.S. Geological Survey's National Water-Quality Laboratory. The maximum contaminant levels were established pursuant to the recommendations of the U.S. Environmental Protection Agency (1994b) for community water systems and are included for comparison purposes only. Minimum reporting levels are from Timme (1995). Units are in micrograms per liter. Symbol: , maximum contaminant level has not been established or proposed. Abbreviations: MCL, maximum contaminant level; MRL, minimum reporting level]
Chlorophenoxy-acid herbicides
Herbicide MCL MRL Herbicide MCL MRL
2,4-D
2,4-DP
Herbicide
Alachlor
Atrazine
Atrazine, Desethyl-
Benfluralin
Butylate
Cyanazine
DCPA (Dacthal)
Diethylanaline
EPTC (Eptam)
Ethalfluralin
Linuron
Metolachlor
Metribuzin
Molinate
70 0.01
.01
Other herbicides
MCL MRL
2 0.009
3 -017
.005
.013
.008
.013
.004
.006
.005
.013
.039
.009
.012
.007
Silvex
2,4,5-T
Herbicide
Napropamide
Pebulate
Pendimethalin
Prometon
Pron amide
Propachlor
Propanil
Simazine
Tebuthiuron
Terbacil
Thiobencarb
Triallate
Trifluralin
50 0.01
.01
MCL MRL
0.01
.009
.018
.008
.009
.015
.016
4 .008
.015
.03
.008
.008
.012
16
Table 7. Maximum contaminant levels and minimum reporting levels of selected purgeable organic compounds in drinking water
[Analyses were performed by the U.S. Geological Survey's National Water-Quality Laboratory using an analytical method equivalent to U.S. Environmental Protection Agency method 524.2. Maximum contaminant levels were established pursuant to the recommendation of the U.S. Environmental Protection Agency (1994b) for community water systems and are included for comparison purposes only. Minimum reporting levels are from Timme (1995). Units are in micrograms per liter (pg/L). Symbols: «, maximum contaminant level has not been established or proposed; *, total trihalomethanes which include bromoform, chlorodibromomethane, chloroform, and dichlorobromomethane in community water systems serving 10,000 or more persons cannot exceed 100 |Xg/L (U.S. Environmental Protection Agency, 1994b, p. 2). Abbreviations: MCL, maximum contaminant level; MRL. minimum reporting level]
Compound
Acrolein
Acrylonitrile
Benzene
Bromobenzene
Bromochloromethane
Bromoform
Bromomethane
n-Butylbenzene
Sec-butylbenzene
Tert-butylbenzene
Carbon tetrachloride
Chlorobenzene
Chlorodibromomethane
Chloroethane
2-Chloroethylvinylether
Chloroform
Chloromethane
2-Chloro toluene
4-Chloro toluene
1 ,2-Dibromo-3-chloropropane
1 ,2-Dibromoethane
Dibromomethane
1 ,2-Dichlorobenzene
1 ,3 -Dichlorobenzene
1 ,4-Dichlorobenzene
Dichlorobromomethane
Dichlorodifluoromethane
1 , 1 -Dichloroethane
1 ,2-Dichloroethane
Cis-l,2-Dichloroethene
1 , 1 -Dichloroethene
1 ,2-Transdichloroethene
MCL
**
**
5
*
**
*
**
**
5100
*
*
.2
.05**
600
60075
*
5**
7
100
MRL
20
20
.2
.2
.2
.2
.2
.2
.2
.2
.2
.2
.2
.2
1
.2
.2
.2
.2
1
.2
.2
.2
.2
.2
.2
.2
.2
.2
.2
.2
.2
Compound
1 ,2-Dichloropropane
1 ,3-Dichloropropane
2,2-Dichloropropane
Cis-1 ,3-Dichloropropene
Trans- 1 ,3-Dichloropropene
1 , 1 -Dichloropropene
Ethylbenzene
Hexachlorobutadiene
Isopropylbenzene
p-Isopropyltoluene
Methylene chloride
Methyltertbutylether
Naphthalene
n-Propylbenzene
Styrene
1,1,1 ,2-Tetrachloroethane
1 , 1 ,2,2-Tetrachloroethane
Tetrachloroethene
Toluene
1 ,2,3 -Trichlorobenzene
1 ,2,4-Trichlorobenzene
1,1,1 -Trichloroethane
1 , 1 ,2-Trichloroethane
Trichloroethene
Trichlorofluoromethane
1 ,2,3-Trichloropropane
Trichlorotrifluoroethane
1 ,2,4-Trimethylbenzene
1,3,5-Trimethylbenzene
Vinyl chloride
Xylenes, total ortho, meta, and para
MCL
5**
**
**
**
700**
**
5**
**
»
100**
**
51,000
*
70
200
5
5**
**
**
*
*
210,000
MRL
0.2.2
.2
.2
.2
.2
.2
.2
.2
.2
.2
.2
.2
.2
.2
.2
.2
.2
.2
.2
.2
.2
.2
.2
.2
.2
.2
.2
.2
.2
.2
17
Specialist, the problem may be referred to the Office of Water Quality or National Research Program, where research hydrologists and chemists will aid in resolving the problem.
Reporting of Data
Most data collected by the USGS are publish ed in data reports and used in interpretive reports. Water-quality information, subsequent to its review, is entered into a local data base and periodically merged with a nationally accessible data base. Data that suggests that there could be a human health or environmental problem are pro vided to managerial agencies such as the DOE and to regulatory agencies, such as the State of Idaho's Department of Health and Welfare and the U.S. Environmental Protection Agency, Region 10. After data have been reviewed and verified by resampling if necessary, they are available to the general public upon request.
SELECTED REFERENCES
Bamett, P.R., and Mallory, E.G., 1981, Deter mination of minor elements in water by emission spectroscopy: U.S. Geological Survey Techniques of Water-Resources Investigations, book 5, chap. A2, 31 p.
Bodnar, L.Z., and Percival, D.R., eds., 1982, Analytical Chemistry Branch procedures manual Radiological and Environmental Sciences Laboratory: U.S. Department of Energy Report IDO-12096, variously paged.
Claassen, H.C., 1982, Guidelines and techniques for obtaining water samples that accurately represent the water chemistry of an aquifer: U.S. Geological Survey Open-File Report 82-1024,49 p.
Currie, L.A., 1968, Limits for qualitative detec tion and quantitative determination application to radiochemistry: Analytical Chemistry, v. 40, no. 3, p. 586-593.
Erdmann, D.E., and Thomas, J.D., 1985, Quality assurance of the U.S. Geological Survey water-quality field measurements, in Taylor, J.K., and Stanley, T.W., eds., Quality assurance for environmental measurements: American Society for Testing and Materials Special Technical Testing Publication 867, p. 110-115.
Faires, L.M., 1992, Methods of analysis by the U.S. Geological Survey National Water Quality Laboratory determinations of metals in water by inductively coupled plasma-mass spectrometry: U.S. Geological Survey Open-File Report 92-634, 28 p.
Fishman, M.J., ed., 1993, Methods of analysis by the U.S. Geological Survey National Water Quality Laboratory determination of inorganic and organic constituents in water and fluvial sediments: U.S. Geological Survey Open-File Report 93-125, 217 p.
Fishman, M.J., and Friedman, L.C., 1989, Methods for determination of inorganic substances in water and fluvial sediments: U.S. Geological Survey Techniques of Water- Resources Investigations, book 5, chap. Al, 545 p.
Friedman, L.C., and Erdmann, D.E., 1982, Qual ity assurance practices for the chemical and biological analyses of water and fluvial sedi ments: U.S. Geological Survey Techniques of Water-Resources Investigations, book 5, chap A6, 181 p.
Goerlitz, D.F., and Brown, Eugene, 1972,Methods for analysis of organic substances in water: U.S. Geological Survey Techniques of Water-Resources Investigations, book 5, chap. A3,40 p.
Hardy, M.A., Leahy, P.P., and Alley, W.M., 1989, Well installation and documentation, and ground-water sampling protocols for the pilot National Water-Quality Assessment Program: U.S. Geological Survey Open-File Report 89-396, 36 p.
18
Hem, J.D., 1985, Study and interpretation of chemical characteristics of natural water: U.S. Geological Survey Water-Supply Paper2254,264 p.
Jones, B.E., 1987, Quality control manual of the U.S. Geological Survey's National Water Quality Laboratory: U.S. Geological Survey Open-File Report 87-457,17 p.
Lucey, K.J., 1989, Quality-assurance data for routine water analysis in the National Water Quality Laboratory of the U.S. Geological Survey for Water Year 1988: U.S. Geolog ical Survey Water-Resources Investigations Report 89-4166, 96 p.
Maloney, T.J., Ludtke, A.S., Krizman, T.L., 1993, Quality assurance for routine water analysis in the laboratories of the U.S. Geological Survey for water year 1990: U.S. Geological Survey Water-Resources Investigations Report 93-4082, 145 p.
Pritt, J.W., 1989, Quality assurance of sample containers and preservatives at the U.S. Geological Survey National Water Quality Laboratory, in Pederson, G.L, and Smith, M.M., compilers, U.S. Geological Survey Second National Symposium on Water Quality Abstracts of the technical sessions: U.S. Geological Survey Open-File Report 89-409, 111 p.
Pritt, J.W., and Raese, J.W., eds., 1992, Quality assurance/quality control manual, National Water Quality Laboratory: U.S. Geological Survey Open-File Report 92-495, 33 p.
Rose, D.L., and Schroeder, M.P., 1995, Methods of analysis by the U.S. Geological Survey National Water Quality Laboratory determination of volatile organic compounds in water by purge and trap capillary gas chromatography/mass spectrometry: U.S. Geological Survey Open-File Report 94-708, 26 p.
Skougstad, M.W., Fishman, M.J., Friedman, L.C., Erdmann, D.E., and Duncan, S.S., eds., 1979, Methods for determination of inor ganic substances in water and fluvial sedi ments: U.S. Geological Survey Techniques of Water-Resources Investigations, book 5, chap. Al, 626 p.
Stevens, H.H., Jr., Ficke, J.F., and Smoot, G.F., 1975, Water temperature influential factors, field measurement, and data presenta tion: U.S. Geological Survey Techniques of Water-Resources Investigations, book 1, chap. D 1,65 p.
Thatcher, L.L., Janzer, V.J., and Edwards, K.W., 1977, Methods for determination of radio active substances in water and fluvial sedi ments: U.S. Geological Survey Techniques of Water-Resources Investigations, book 5, chap. A5,95 p.
Timme, P.J., 1995, National Water Quality Laboratory, 1995 Services Catalog: U.S. Geological Survey Open-File Report 95-352, 120 p.
U.S. Department of Energy, 1995, Radiochem- istry manual, revision 10: Idaho Falls, Idaho, U.S. Department of Energy, Radiological and Environmental Sciences Laboratory, variously paged.
U.S. Environmental Protection Agency, 1987, Annual report, fiscal year 1986 methods validation report (radiation): U.S. Environ mental Protection Agency Report No.EPA/600/X-87/128, 55 p.
1994a, Protection of environment, Code of Federal Regulations 40: Office of the Federal Register, National Archives and Records Administration, pts. 100-149, 1,121 p.
1994b, EPA drinking water regulations and health advisories: U.S. Environmental Pro tection Agency, Office of Water, Report No. 822R-94-001,llp.
19
Wershaw, R.L., Fishman, M.J., Grabbe, R.R., and Lowe, L.E., eds., 1987, Methods for the determination of organic substances in water and fluvial sediments: U.S. Geological Survey Techniques of Water-Resources Investigations, book 5, chap. A3, 80 p.
Wood, W.W., 1981, Guidelines for collection and field analysis of ground-water samples for selected unstable constituents: U.S. Geological Survey Techniques of Water- Resources Investigations, book 1, chap. D2, 24 p.
ATTACHMENTS
Attachment 1 Field schedule showing well and pump information and sampling schedules for selected wells and streamflow sites.
23. 3H, 90Sr, Cl, NO3 ~24. 3H, a, P, T Spec, Cr, Na+, Cr, NO3 ~25. 3H, a, P, T Spec, Cr, Na+, Cr, NO3', TOC26. 3H, 90Sr, a, P, T Spec, Cl', Na+, Cr, NO3'27. 3H, 90Sr, a, P, T Spec, Cl", Na+ , Cr, NO,', TOC28. 3H, 90Sr, a, P, T Spec, 241 Am, 238Pu, 239>240pu, Cl~, Na+, Cr, NO3~, SO4", F, 129I, POC's29. 3H, 90Sr, a, P, T Spec, mAm, 238Pu, 239>240pu, Cl', Na+, Cr, NO3~, SO4", F, 129I, POC's,
TOC30. 3H, a, P, T Spec, Cl~, Na+, Cr, NO3 ", SO4", POC's31. 3H, a, P, T Spec, Cl', Na+, Cr, NO3 ", SO/", POC's, TOC32. 3H, 90Sr, a, p, T Spec, W1 Am, 238Pu, 239^°pu, Cl", Na+, Cr, NO3', POC's33. 3H, 90Sr, a, P, T Spec, 241Am, 238Pu, 239'240pu , Cl', Na+, Cr, NO3~, POC's, TOC, SO4~34. 3H, 90Sr, a, P, T Spec, Cl', Na+ , Cr, NO3', POC's, Sb, AT, Cr, Pb, Hg, Ni, Tl, Zn35. 3H, 90Sr, a, P, T Spec, Cl", Na+ , Cr, N(V, POC's, TOC, Sb, AT, Cr, Pb, Hg, Ni, Tl, Zn36. 3H, 90Sr, a, P, T Spec, 241Am, 238Pu, 239'240pu, Cl", Na+, Cr, NO3', SO4", POC's, Al, Ar,
Ba, Cd, Pb, Mn, Ni, Hg, Se, Ag, Zn37. 3H, 90Sr, a, P, T Spec, 241 Am, 238Pu, 239'240pu, Cl', Na+, Cr, NO3', SO4', POC's, TOC,
Al, Ar, Ba, Cd, Pb, Mn, Ni, Hg, Se, Ag, Zn38. 3H, a, P, T Spec, Cl", Na+, Cr, NO3', TOC, POC's39. 3H, 90Sr, Cr, POC'S40. 3H, 90Sr, a, P, T Spec, 241 Am, 238Pu, 239'240Pu, Q", Na+, Cr, NO3~, POC's, SH1043 metals41. 3 H, 90Sr, a, P, T Spec, 241Am, 238Pu, 239'240Pu, Cl', Na+, Cr, NO3', POC's, SH1043 metals,
TOC42. POC's43. 3H, 90Sr, Cr, Cr, Na+, NO3
30
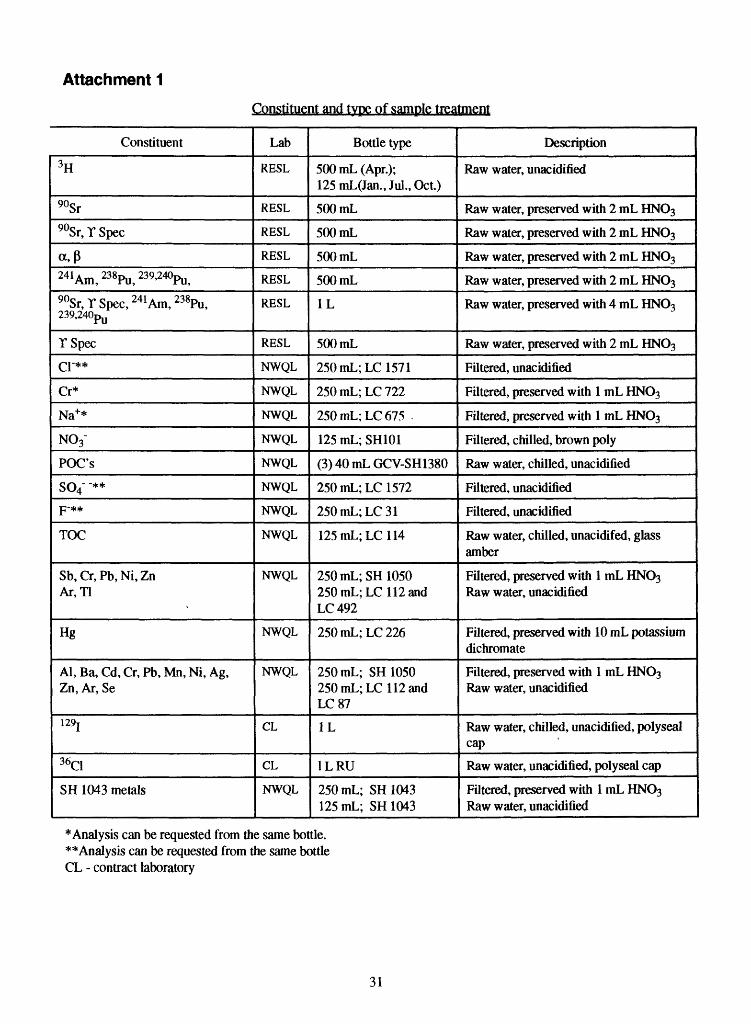
Attachment 1
Constituent and tvne of samole treatment
Constituent
3H
90Sr
90Sr,TSpec
a,p241Am, 238Pu, 239>240Pu,
90Sr,YSpec, 241 Am, 238Pu,239,240^
YSpeccr**Cr*
Na+*
NO3-
POC's
SO4 **
p-**
TOC
Sb,Cr,Pb,Ni,Zn Ar,Tl
Hg
Al, Ba, Cd, Cr, Pb, Mn, Ni, Ag, Zn, Ar, Se
129j
36C1
SH 1043 metals
Lab
RESL
RESL
RESL
RESL
RESL
RESL
RESL
NWQL
NWQL
NWQL
NWQL
NWQL
NWQL
NWQL
NWQL
NWQL
NWQL
NWQL
CL
CL
NWQL
Bottle type
500 mL (Apr.); 125mL(Jan.,Jul.,Oct)
500 mL
500 mL
500 mL
500 mL
1L
500 mL
250 mL;LC 1571
250 mL; LC 722
250 mL; LC 675
125 mL; SH101
(3)40mLGCV-SH1380
250 mL;LC 1572
250mL;LC31
125mL;LC114
250 mL; SH 1050 250mL;LC112and LC492
250 mL; LC 226
250 mL; SH 1050 250mL;LC112andLC87
1L
1LRU
250 mL; SH 1043 125 mL; SH 1043
Description
Raw water, unacidified
Raw water, preserved with 2 mL HNO3
Raw water, preserved with 2 mL HNO3
Raw water, preserved with 2 mL HNO3
Raw water, preserved with 2 mL HNO3
Raw water, preserved with 4 mL HNO3
Raw water, preserved with 2 mL HNO3
Filtered, unacidified
Filtered, preserved with 1 mL HNO3
Filtered, preserved with 1 mL HNO3
Filtered, chilled, brown poly
Raw water, chilled, unacidified
Filtered, unacidified
Filtered, unacidified
Raw water, chilled, unacidifed, glass amber
Filtered, preserved with 1 mL HNC>3 Raw water, unacidified
Filtered, preserved with 10 mL potassium dichromate
Filtered, preserved with 1 mL HNO3 Raw water, unacidified
Raw water, chilled, unacidified, polyseal cap
Raw water, unacidified, polyseal cap
Filtered, preserved with 1 mL HNO3 Raw water, unacidified
* Analysis can be requested from the same bottle.**Analysis can be requested from the same bottle CL - contract laboratory
31
Attachment 2 DATA-QUALITY OBJECTIVES FOR WATER SAMPLES ANALYZED BY THE NATIONAL WATER QUALITY LABORATORY
I.II.
III.
IV
Constituent
Purgeable organic compounds
Base/neutral extractable compounds, total recoverable
Inorganic compounds: (dissolved)
1 . Aluminum
2. Antimony
3. Arsenic
4. Barium
5. Beryllium
6. Cadmium
7. Calcium
8. Chromium
9. Hexavalent chromium
10. Cobalt
1 1 . Copper
12. Iron
13. Lead
14. Magnesium
15. Manganese
16. Nickel
17. Potassium
18. Selenium
19. Silica
20. Silver
21. Sodium
22. Thallium
23. Vanadium
24. Zinc
25. Mercury
26. Sulfate
27. Chloride
28. Nitrate (as N)
29. Phosphate
30. Ammonia (as N)
. Organic compounds
1. Polychlorinated biphenyls (PCB's)
2. Chlorinated phenols (PCP's), includes terra-, tri, and dichlorophenyls
Minimum reporting level (micrograms per liter)
1
10
10
1
1
1
5
1
20
5
1
3
10
3
10
10
1
10
100
1
10
1
100
0.5
6
3
0.1
100
1,000
50
10
15
1
30
Precision (± percent)
30
30
10
10
10
10
10
10
10
10
10
10
10
10
10
10
10
10
10
10
10
10
10
10
10
10
10
10
10
10
10
40
40
40
Accuracy* (percent)
70-130
70-130
90-110
90-110
90-110
90-110
90-110
90-110
90-110
90-110
90-110
90-110
90-110
90-110
90-110
90-110
90-110
90-110
90-110
90-110
90-110
90-110
90-110
90-110
90-110
90-110
90-110
90-110
90-110
90-110
90-110
60-140
60-140
60-140
Lab code/ schedule
SH 1380
SH 1385
SH 1050
SH 1050
LC 112
SH 1050
SH 1043
SH 121
SH 1043
LC722
LC16
SH 1043
SH1043
SH 1043
SH 1050
SH 121
SH 1050
SH 1050
SH 121
LC87
SH 121
SH 1050
LC59
LC492
SH 1043
SH 1050
LC226
LC 1572
LC 1571
SH 101
SH 101
SH 101
SH 1324 (PCB only)
SH 1385
*Coefficient of variance measured by replicate analysis; precision at 10% level.
32
Attachment 3 DATA-QUALITY OBJECTIVES FOR RADIONUCLIDES IN WATER SAMPLES ANALYZED BY THE RADIOLOGICAL AND ENVIRONMENTAL SCIENCES LABORATORY
For each radionuclide concentration, an associated analytical uncertainty, s, is calculated such that there is a 67-percent probability that the true concentration of a radionuclide in a sample is in the range of the reported concentration plus or minus the analytical uncertainty. For example, given an analytical result of 1.010.2 pCi/L (picocuries per liter), there is a 67 percent probability that the true concentration is in the range of 0.8 to 1.2 pCi/L. Some laboratories report the analytical uncertainty as 2s, at which there is a 95-percent probability that the true concentration is in the range of 0.6 to 1.4 pCi/L. Therefore, unlike analyses for most inorganic or organic constituents, the analytical uncertainty is specified for each analysis for a specified radionuclide. The following guidelines for interpreting analytical results are based on an extension of the method described by Currie (1968).
In the analysis for a selected radionuclide, laboratory measurements are made on a target sample and a prepared blank. Instrument signals for the sample and the blank vary randomly. Therefore, it is essential to distinguish between two key aspects of the problem of detection: (1) the instrument signal for the sample must be greater than the signal observed for the blank to make the decision that a selected radionuclide was detected; and (2) an estimation must be made of the minimum radionuclide concentration that will yield a sufficiently large observed signal to make the correct decision for detection or nondetection of that radionuclide most of the time. The first aspect of the problem is a qualitative decision based on an observed signal and a definite criterion for detection. The second aspect of the problem is an intuitive estimation of the detection capabilities of a given measurement process.
In the laboratory, instrument signals must exceed a critical level to make the qualitative decision whether a selected radionuclide was detected. Radionuclide concentrations that equal 1.6s meet this criterion; at 1.6s, there is a 95-percent probability that the correct decision not detected will be made. Given a large number of samples, up to 5 percent of the samples with true concentrations greater than or equal to 1.6s, which were concluded as being detected, might not contain the selected radionuclide. These measurements are referred to as false positives and are errors of the first kind in hypothesis testing.
Once the critical level of 1.6s has been defined, the minimum detectable concentration may be established. Radionuclide concentrations that equal 3s represent a measurement of the minimum detectable concentration. For true concentrations of 3s or greater, there is a 95-percent-or-more probability of correctly concluding that a selected radionuclide was detected in a sample. Given a large number of samples, up to 5 percent of the samples with true concentrations greater than or equal to 3s, which were concluded as being nondetected, could contain the selected radionuclide at the minimum detectable concentration. These measurements are referred to as false negatives and are errors of the second kind in hypothesis testing.
True radionuclide concentrations between 1.6s and 3s have larger errors of the second kind. That is, there is a greater-than-5-percent probability of false negative results for samples with true concentrations between 1.6s and 3s, and although the selected radionuclide might not have been detected, such nondetection may not be reliable; at 1.6s, the probability of a false negative is about 50 percent.
These guidelines are based on counting statistics alone and do not include systematic or random errors inherent in laboratory procedures. The values 1.6s and 3s vary slightly with background or blank counts and with the number of gross counts for individual analyses and for different selected radionuclides. The use of the critical level and minimum detectable concentration aid in the interpretation of analytical results and do not represent absolute concentrations of radioactivity which may or may not have been
33
detected. The minimum detectable concentration should not be confused with the detection limit, which is based on instrument sensitivity, sample volumes, analytical procedures and counting times used in the laboratory.
Bodnar and Percival (1982) summarized detection limits normally available from the RESL. Special arrangements can be made to achieve smaller detection limits for selected constituents. For example, by using a five-fold counting time for tritium in water, that is, increasing the counting time from 20 to 100 minutes, the detection limit can be reduced from 0.5 to 0.2 pCi/L.
Detection limits for selected types of radioactivity and nuclides as a function of sample size and detection method are shown on table 1; the limits are intended as guides to order-of-magnitude sensitivities and, in practice, can easily change by a factor of two or more even for the conditions specified.
34
Table 1 Detection limits for selected types of radioactivity and nuclides
Type of radioactivity or nuclide
Gross alpha
Gross beta
Po-210
Sr-90
Th-230
Tritium
U-234
Th-230
Pu-238
Am-241
Np-239
Tc-99
Te-132
Pb-212
Se-75
Sb-125
Ru-103
Tl-108
Sb-124
Ta-182
Co-60
Na-22
K-40
La-140
Co-56
Ce-144
Ce-141
Cr-51
1-131
Ba-140
Ru-106
Cs-137
Bi-212
Nb-95
Cs-134
Mo-99
Hg-203
Sample material
Water
Water
Water
Water
Water
Water
Water
Water
Water
Water
Water
Water
Water
Water
Water
Water
Water
Water
Water
Water
Water
Water
Water
Water
Water
Water
Water
Water
Water
Water
Water
Water
Water
Water
Water
Water
Water
Water
Water
Size of sample (milliliter)
100
250
100
5
100
400
500
10
1,000
1,000
1,000
1,000
400
400
400
400
400
400
400
400
400
400
400
400
400
400
400
400
400
400
400
400
400
400
400
400
400
400
400
Counting time (minutes)
60
20
20
20
60
50
60
20
1,000
1,000
1,000
1,000
60
60
60
60
60
60
60
60
60
60
60
60
60
60
60
60
60
60
60
60
60
60
60
60
60
60
60
Detection method or instrument
Scintillation
Low bkgd counter
Low bkgd counter
Low bkgd counter
Scintillation
Low bkgd counter
Scintillation
Liquid scintillation
Alpha spectrometry
Alpha spectrometry
Alpha spectrometry
Alpha spectrometry
Ge(Li)
Ge(Li)
Ge(Li)
Ge(Li)
Ge(Li)
Ge(Li)
Ge(Li)
Ge(Li)
Ge(Li)
Ge(Li)
Ge(Li)
Ge(Li)
Ge(Li)
Ge(Li)
Ge(Li)
Ge(Li)
Ge(Li)
Ge(Li)
Ge(Li)
Ge(Li)
Ge(Li)
Ge(Li)
Ge(Li)
Ge(Li)
Ge(Li)
Ge(Li)
Ge(Li)
Detection limit (picocuries per
milliliter)
3X10'3
5X10⁻³
4X10'3
0.1ixio-35X10-3
ixio-30.5
4X10'5
4X10⁻⁵
2X10'5
3X10'5
0.4
0.76X10'2
0.18X10'2
0.21X10'2
0.2
0.1
0.26X10⁻²
9X10'2
17X10'2
5X10⁻²
0.49X10'2
0.66X10'2
0.2
0.56X10'2
1.06X10⁻²
6X1 0-2
5X1 0'2
6X10⁻²
35
Table 1 Detection limits for selected types of radioactivity and nuclides continued
Type of radioactivity
or nuclide
Kr-85
Bi-214
Zr-95
Co-58
Mn-54
Ag-llOm
Ac-228
Fe-59
Zn-65
Sample material
Water
Water
Water
Water
Water
Water
Water
Water
Water
Size of sample (milliliter)
400
400
400
400
400
400
400
400
400
Counting time (minutes)
60
60
60
60
60
60
60
60
60
Detection method or instrument
Ge(Li)
Ge(Li)
Ge(Li)
Ge(Li)
Ge(Li)
Ge(Li)
Ge(Li)
Ge(Li)
Ge(Li)
Detection limit (picocuries per
milliliter)
21
0.49X1 0-2
6X1 0-2
5X10⁻²
7X1 0-2
0.2
0.1
0.1
36
Attachment 4 INVENTORY OF WATER-QUALITY FIELD EQUIPMENTType of meter