161


Quality Assurance Project Plan for the North Carolina Division of Air Quality
Particulate Matter Monitoring Program
Prepared for:
Carol Kemker Acting, EPA Region IV Director
Air and Radiation Division U.S. Environmental Protection Agency
Region IV Atlanta Federal Building
61 Forsyth Street Atlanta, Georgia 30303-8960
Submitted by:
Michael Abraczinskas, Director North Carolina Division of Air Quality
North Carolina Department of Environmental Quality 1641 Mail Service Center
Raleigh, North Carolina 27699-1641
ROY COOPER (;('.<tn:,,r
~UCHA.ELS. REGAN
"""'"' :IIJCJIJ\El A. 1\Blv\('2.INSKJ\S r.~
NORTI-I CAROLINA EnWO<'IIIMIUOl Q~Ol.ity
Nor(h Carolina Deparlmen( ofF.n,•irnnmental Quality I Division of Air Qualily
217 West Jones Street, Suite 4000 11641 Mail Service Center I Raleigh, No11h Carolina 27699-1641
919.707.8400

QAPP for the DAQ PM Monitoring Program Revision 2 8/8/2019
Page 2 of 160
DISCLAIMER
This Quality Assurance Project Plan (QAPP) covers the particulate matter (PM) monitoring network for the North Carolina Department of Environmental Quality Division of Air Quality (DAQ) and the Western North Carolina Regional Air Quality Agency (WNC). Throughout this document, the term “DAQ” includes this local program by reference.

QAPP for the DAQ PM Monitoring Program Revision 2 8/8/2019
Page 3 of 160
Quality Assurance Project Plan Acronym Glossary
ABS - acrylonitrile-butadiene-styrene ADQ - Audit of data quality AMTIC – Ambient Monitoring Technology Information Center AQI – Air Quality Index AQS - Air Quality System (EPA's Air database) ARM – Air Resources Manager ASC – Aerosols Sample Conditioner BAM – Beta attenuation monitor CAA – Clean Air Act CFR – Code of Federal Regulations Chief – Ambient Monitoring Section chief COC – Chain of custody CV – Coefficient of variation DAQ - North Carolina Division of Air Quality DAS – Data acquisition system °C – degrees Celsius DEQ – North Carolina Department of Environmental Quality DFU – Disposable Filter Unit DIT – North Carolina Department of Information Technology DQA - Data quality assessment DQI - Data quality indicators DQO - Data quality objectives ECB – Electronics and Calibration Branch e-log – electronic logbook EPA – United States Environmental Protection Agency FEM – Federal equivalent method FRM – Federal reference method FTP – file transfer protocol FTS - Flow Transfer Standard IBEAM – Internet-Based Enterprise Application Management IDL – Instrument Detection Limit km – Kilometers LAB – Laboratory Analysis Branch LC – Local conditions LMS – North Carolina Learning Management System LPM -Liters per minute LSASD – Laboratory Services and Applied Science Division m – Meters

QAPP for the DAQ PM Monitoring Program Revision 2 8/8/2019
Page 4 of 160
MDL – Method Detection Limit mg – Milligrams μg/m3 – micrograms per cubic meter µm - micrometers MQO – Measurement quality objective NAAQS - National ambient air quality standards NCore- National Ambient Air Monitoring Strategy - National Core Monitoring NIST - National Institute of Standards and Technology PEP – Performance evaluation program PM – Particulate matter PM2.5 – Particles with an average aerodynamic diameter of 2.5 microns or less, also known as fine
particles PM10 – Particles with an average aerodynamic diameter of 10 microns or less PM10c or PM10-2.5 – Coarse particles defined as particles with an average aerodynamic diameter of 10
microns or less (PM10) but greater than 2.5 microns (PM2.5) generally measured by subtracting PM2.5 measured at local conditions from PM10 measured at local conditions.
PPB – Projects and Procedures Branch PQAO – Primary quality assurance organization QA – Quality assurance QAM – Quality assurance manager QA/QC - Quality assurance/quality control QAPP - Quality assurance project plan QC – Quality control QMP – Quality management plan RCO – Raleigh central office RH – relative Humidity SD – standard deviation SLAMS - state and local air monitoring station SOP - standard operating procedure STP – standard temperature and pressure, which is 25 degrees Celsius and 760 millimeters mercury TSA - technical systems audit TSP – total suspended particles µg/m3 – micrograms per cubic meter VIP – value in performance VSCC – very sharp cut cyclone WNC – Western North Carolina Regional Air Quality Agency

QAPP for the DAQ PM Monitoring Program Revision 2 8/8/2019
PageSof 160
1.0 Quality Assurance Project Plan Identification and Approval Sheet
Title: Quality Assurance Project Plan for the Nonh Camffna Division of Air Quality Particulate Matter Monitoring Program, Revision 2
The DAO. hereby recommt!flds the attached Quality Assurance Project Pion for the North Carolina
Division of Air Quality Particulate Matter Monitoring Program, Revision 2 for approval and commits the State of North Carolina, Department of Environmental Quality (Division of Air Quality) to follow the elements described within.
Signature: -1...:.._!.:'....��::....;Lb..-.!:�-!::::;:....t=:=.=:-Wl Air Quality Division Director
Signature: _--...�------�--- Date 80
/ rz l l'f DAQ Quality Assurance Manager (Ambient Monitoring Section Chief)
58nalure: ?&L.Dj= Primary QAPP Author
Dale �, 11,
Slgnature:--1.,_.,.,._..""""c:::,,,,lf--=.c------7'��- Date� 4 Western North Ca Ir Quality Agency Director

QAPP for the DAQ PM Monitoring Program Revision 2 8/8/2019
Page 6 of 160
2.0 Table of Contents DISCLAIMER .................................................................................................................................................. 2
Quality Assurance Project Plan Acronym Glossary ....................................................................................... 3
1.0 Quality Assurance Project Plan Identification and Approval Sheet ........................................................ 5
2.0 Table of Contents .................................................................................................................................... 6 List of Tables and Figures ........................................................................................................................ 10
3.0 Distribution ........................................................................................................................................... 11
4.0 Project/Task Organization..................................................................................................................... 13 4.1 DAQ Director ..................................................................................................................................... 13 4.2 Ambient Monitoring Section ............................................................................................................. 14
4.2.1 Projects and Procedures Branch ................................................................................................ 15 4.2.2 Laboratory Analysis Branch ....................................................................................................... 17 4.2.3 Electronics and Calibration Branch ............................................................................................ 18
4.3 Regional Offices................................................................................................................................. 19 4.4 Western North Carolina Air Quality Agency ..................................................................................... 21 4.5 Other North Carolina Local and Tribal Programs .............................................................................. 22 4.6 Department of Information Technology ........................................................................................... 22 4.7 United States Environmental Protection Agency, Region 4 .............................................................. 23
5.0 Problem Definition and Background ..................................................................................................... 25
6.0 Project/Task Description ....................................................................................................................... 28 6.1 Field Activities ................................................................................................................................... 29 6.2 ECB Activities ..................................................................................................................................... 30 6.3 Laboratory Activities ......................................................................................................................... 30 6.4 Project Assessment Techniques ........................................................................................................ 30 6.5 Project Records ................................................................................................................................. 31 6.6 Site Locations .................................................................................................................................... 32
7.0 Quality Objectives and Criteria for Measurement Data ....................................................................... 41 7.1 Data Quality Objectives ..................................................................................................................... 41 7.2 Intended Use of Data ........................................................................................................................ 42 7.3 Type of Data Needed ........................................................................................................................ 42 7.4 Tolerable Error Limits ........................................................................................................................ 43 7.5 Measurement Quality Objectives ..................................................................................................... 44 7.6 Network Scale ................................................................................................................................... 46
8.0 Training Requirements .......................................................................................................................... 84
9.0 Documentation and Records ................................................................................................................ 86 9.1 Statewide Policy and Procedure Documentation ............................................................................. 88 9.2 Data Collection Records and Logbooks ............................................................................................. 89
9.2.1 Logbooks and Forms .................................................................................................................. 89 9.2.2 Chain of Custody ........................................................................................................................ 90 9.2.3 Electronic Data Collection .......................................................................................................... 90
9.3 QA/QC Records ................................................................................................................................. 90

QAPP for the DAQ PM Monitoring Program Revision 2 8/8/2019
Page 7 of 160
9.4 Reference Materials .......................................................................................................................... 91 9.5 Data Archiving and Retrieval ............................................................................................................. 91
10.0 Network Description ........................................................................................................................... 92 10.1 Network Objectives ......................................................................................................................... 92 10.2 Site Selection ................................................................................................................................... 93
10.2.1 Site Location ............................................................................................................................. 93 10.2.2. Inlet Siting Criteria .................................................................................................................. 94
10.3. Sampling Frequency ....................................................................................................................... 95 10.4. Rationale for the DAQ’s Particulate Matter Monitoring Networks ............................................... 96
11.0 Sampling Methods Requirements ...................................................................................................... 97 11.1 Sample Methodology ...................................................................................................................... 97
11.1.1. Particulate Matter (Intermittent Filter-Based Operation) ...................................................... 98 11.1.2. Particulate Matter (Continuous Operation, BAM) .................................................................. 99 11.1.3. Particulate Matter (Continuous Operation, T640X) ............................................................... 99
11.2 Sample Collection Methodology ................................................................................................... 100 11.2.1. Physical Collection ................................................................................................................ 101 11.2.2. Electronic Data Collection ..................................................................................................... 101
11.3 Support Facilities ........................................................................................................................... 101 11.3.1 Monitoring Station Design ..................................................................................................... 101 11.3.2 Shelter Criteria ....................................................................................................................... 101
12.0 Sample Handling and Custody .......................................................................................................... 103 12.1 Pre-Sample Custody ...................................................................................................................... 104 12.2 Post-Sample Custody .................................................................................................................... 105 12.3 Filter Archive ................................................................................................................................. 106
13.0 Analytical Methods ........................................................................................................................... 107 13.1 Purpose/Background..................................................................................................................... 107 13.2 Preparation of Samples ................................................................................................................. 107 13.3 Analysis Method for Gravimetric Samples .................................................................................... 108 13.4 Internal Quality Control and Corrective Actions for Measurement Systems ............................... 108
14.0 Quality Control Requirements and Procedures ................................................................................ 110 14.1 Adjusted Calibrations .................................................................................................................... 110 14.2 Precision Checks ............................................................................................................................ 111
14.2.1 Flow Rate Verifications .......................................................................................................... 111 14.2.2 Duplicate Filter Weights ........................................................................................................ 111
14.3 Quality Control Samples ................................................................................................................ 112 14.4 Accuracy or Bias Checks ................................................................................................................ 113
14.4.1 Field Flow Rate Audits............................................................................................................ 113 14.4.2 External Agency Audits .......................................................................................................... 113
14.5 Reference Membrane Span Foil Verification ................................................................................ 113 14.6 BAM Background Tests ................................................................................................................. 114 14.7 Filter Inspections ........................................................................................................................... 114 14.8 Balance Verification and Audits .................................................................................................... 114 14.9 Quarterly Verification of Weights ................................................................................................. 115 14.10 Filter Holding Times .................................................................................................................... 115

QAPP for the DAQ PM Monitoring Program Revision 2 8/8/2019
Page 8 of 160
14.11 Filter Conditioning Environment ................................................................................................. 115 14.12 Weights Original Spreadsheet Validation ................................................................................... 116 14.13 Corrective Actions ....................................................................................................................... 116 14.14 Documentation ........................................................................................................................... 117
15.0 Equipment Testing, Inspection, and Maintenance Requirements ................................................... 118 15.1 Testing ........................................................................................................................................... 118 15.2 Inspection ...................................................................................................................................... 119
15.2.1 Inspections in Conditioning/Weighing Room ......................................................................... 119 15.2.2 Inspections of Field Items ....................................................................................................... 119
15.3 Routine Maintenance .................................................................................................................... 120
16.0 Instrument Calibration and Frequency ............................................................................................. 121 16.1 Certification of Local Primary Standards ....................................................................................... 122
16.1.1. Local Primary Temperature Standard ................................................................................... 122 16.1.2. Local Primary Pressure Standard .......................................................................................... 122 16.1.3. Local Primary Time Standard ................................................................................................ 122
16.2 Calibration of Transfer Standards ................................................................................................. 123 16.2.1 Flow Transfer Standards ........................................................................................................ 123 16.2.2 Temperature Transfer Standards ........................................................................................... 123 16.2.3 Pressure Transfer Standards .................................................................................................. 123 16.2.4 Pressure Differential Transfer Standards ............................................................................... 123
16.3 Weighing Lab Calibration and Check Standards ........................................................................... 124 16.4 Analytical Balance ......................................................................................................................... 124 16.5 Lab Temperature and Relative Humidity ...................................................................................... 124 16.6 Documentation ............................................................................................................................. 124
17.0 Inspection/Acceptance of Supplies and Consumables ..................................................................... 125
18.0 Non-Direct Measurements ............................................................................................................... 126
19.0 Data Management ............................................................................................................................ 127 19.1 Purpose/Background..................................................................................................................... 127 19.2 Data Collection and Recording ...................................................................................................... 127 19.3 Data Transmittal and Transformation........................................................................................... 129 19.4 Data Verification and Validation ................................................................................................... 130 19.5 Data Reduction and Analysis ......................................................................................................... 131 19.6 Data Submission ............................................................................................................................ 131 19.7 Data Storage and Retrieval ........................................................................................................... 132
20.0 Assessments and Response Actions ................................................................................................. 134 20.1 Network Reviews and Assessments .............................................................................................. 134
20.1.1 Five-Year Network Assessment ............................................................................................. 136 20.2 External Performance Evaluations ................................................................................................ 136 20.3 Semi-annual Flow Rate Audits ...................................................................................................... 136 20.4 Quarterly Completeness Assessment ........................................................................................... 137 20.5 Annual Data Certifications ............................................................................................................ 137 20.6 Audit of Data Quality..................................................................................................................... 138 20.7 Data Quality Assessments ............................................................................................................. 138

QAPP for the DAQ PM Monitoring Program Revision 2 8/8/2019
Page 9 of 160
20.8 Technical Systems Audits .............................................................................................................. 138 20.9 Internal Systems Audits ................................................................................................................ 139
20.9.1 Post-Audit Activities ............................................................................................................... 140 20.9.2 Follow-up and Corrective Action Requirements .................................................................... 141 20.9.3 Audit Schedule ....................................................................................................................... 141
21.0 Reports to Management ................................................................................................................... 142 21.1 Quarterly Data Report ................................................................................................................... 142 21.2 Annual Network Review ................................................................................................................ 142 21.3 Annual Data Certification .............................................................................................................. 143 21.4 Annual Network Monitoring Plan ................................................................................................. 143 21.5 Five-Year Network Assessment ..................................................................................................... 143 21.6 Internal System Audit Reports ...................................................................................................... 144 21.7 Response/Corrective Action Report ............................................................................................. 144
22.0 Data Validation and Usability ............................................................................................................ 145 22.1 Sampling Design ............................................................................................................................ 145 22.2 Sample Collection Procedures ...................................................................................................... 146 22.3 Sample Handling ........................................................................................................................... 150 22.4 Analytical Procedures.................................................................................................................... 150 22.5 Quality Control .............................................................................................................................. 150 22.4 Calibration ..................................................................................................................................... 150 22.5 Data Reduction and Processing .................................................................................................... 151 22.6 Exceptional Events ........................................................................................................................ 151
23.0 Verification and Validation Methods ................................................................................................ 153 23.1 Validating and Verifying Data ....................................................................................................... 154
23.1.1 Continuous PM Data .............................................................................................................. 154 23.1.2 Intermittent PM Data ............................................................................................................ 154
23.2 Verification .................................................................................................................................... 155 23.2.1 Continuous PM Data .............................................................................................................. 155 23.2.2 Intermittent PM Data ............................................................................................................ 156
23.3 Validation ...................................................................................................................................... 156
24.0 Reconciliation with Data Quality Objectives ..................................................................................... 159
Revision History ........................................................................................................................................ 160
QAPP for the DAQ PM Monitoring Program Revision 2 8/8/2019
Page 10 of 160
List of Tables and Figures Table 1. DAQ Ambient Air Quality Monitoring Program QAPP Distribution List ........................................ 11 Table 2. National Ambient Air Quality Particulate Matter Standards ........................................................ 27 Table 3. Assessment Schedule .................................................................................................................... 30 Table 4. Critical Documents and Records ................................................................................................... 31 Table 5. North Carolina PM Site Locations ................................................................................................. 32 Table 6. Acceptable Precision as Measured by Coefficient of Variation (CV) and Bias .............................. 44 Table 7. Measurement Quality Objectives: PM2.5 (Gravimetric, Filter Based, Local Conditions) ............. 48 Table 8. Measurement Quality Objectives: PM2.5, PM10, PM10-2.5 (Continuous Met One BAM 1020, Local Conditions) .................................................................................................................................................. 56 Table 9. Measurement Quality Objectives: PM10 (Continuous Met One BAM 1020, Standard Temperature and Pressure, or STP) ............................................................................................................ 63 Table 10. Measurement Quality Objectives: PM2.5 (Continuous Met One BAM 1022, Local Conditions) 69 Table 11. Measurement Quality Objectives: PM2.5, PM10 and PM10-2.5 (Continuous T640X Local Conditions) .................................................................................................................................................. 75 Table 12. Measurement Quality Objectives: PM10 (Continuous T640X STP) ............................................ 79 Table 13. Documentation and Records Information .................................................................................. 86 Table 14. Requirements for Calculating Summary Statistics ...................................................................... 95 Table 15. PM Sampling Schedule and Frequency ....................................................................................... 96 Table 16. DAQ Particulate Matter Monitoring Network Analyzers ............................................................ 97 Table 17. List of SOPs Associated with this Quality Assurance Project Plan............................................. 100 Table 18. Corrective Actions ..................................................................................................................... 116 Table 19. Required AQS Data Reporting Periods ...................................................................................... 142 Table 20. Qualifier Code Description and Type ........................................................................................ 146
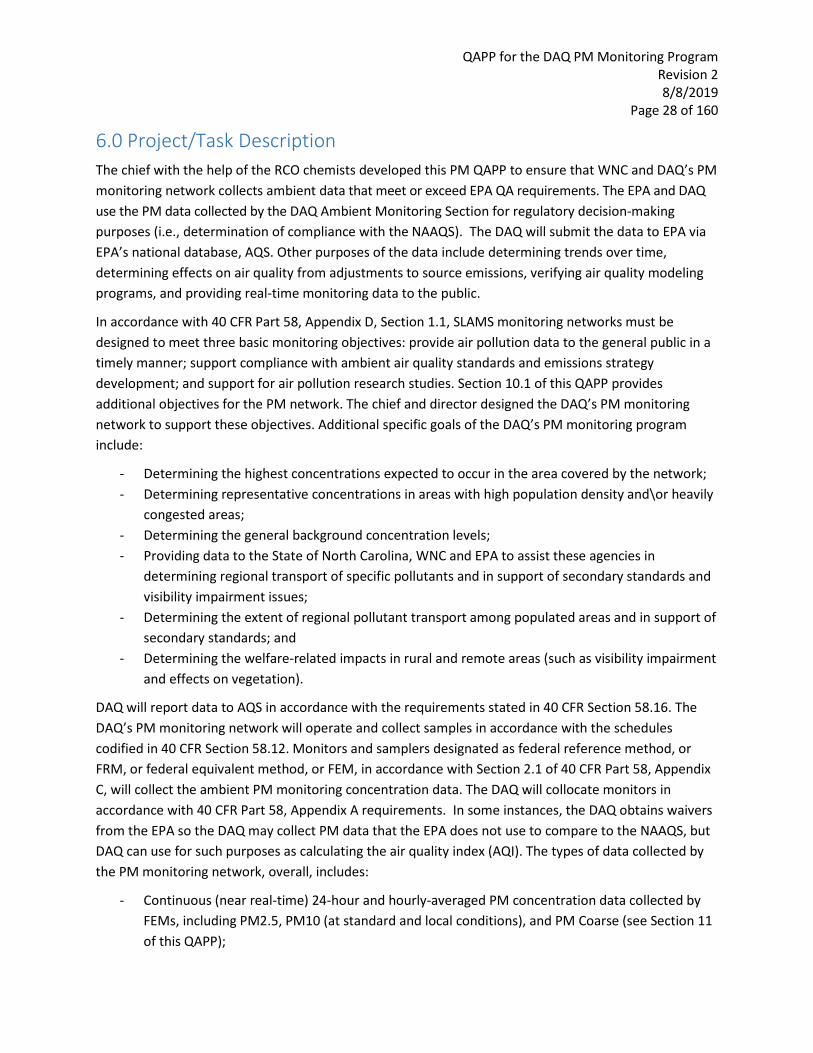
Figure 1. Project Organizational Chart ........................................................................................................ 24 Figure 2. Bryson City Site ............................................................................................................................ 34 Figure 3. Board of Education Site ................................................................................................................ 34 Figure 4. Spruce Pine Site............................................................................................................................ 35 Figure 5. Hickory Water Tower Site ............................................................................................................ 35 Figure 6. Lexington Water Tower Site......................................................................................................... 36 Figure 7. Candor Site ................................................................................................................................... 36 Figure 8. Mendenhall Site ........................................................................................................................... 37 Figure 9. William Owen School ................................................................................................................... 37 Figure 10. Durham Armory, Triple Oak and Millbrook Sites ....................................................................... 38 Figure 11. West Johnston Site ..................................................................................................................... 38 Figure 12. Leggett Site ................................................................................................................................ 39 Figure 13. Pitt County Ag Site ..................................................................................................................... 39 Figure 14. Castle Hayne Site........................................................................................................................ 40 Figure 15. Supply Chain of Custody (COC) Record Form for PM2.5 FRM Particle Samples........................ 103 Figure 16. Return Chain of Custody (COC) Record Form for PM2.5 FRM Particle Samples..................... 104 Figure 17. PM Data Flow ........................................................................................................................... 128 Figure 18. Data Verification and Validation Form for Intermittent Particle Data .................................... 155
QAPP for the DAQ PM Monitoring Program Revision 2 8/8/2019
Page 11 of 160
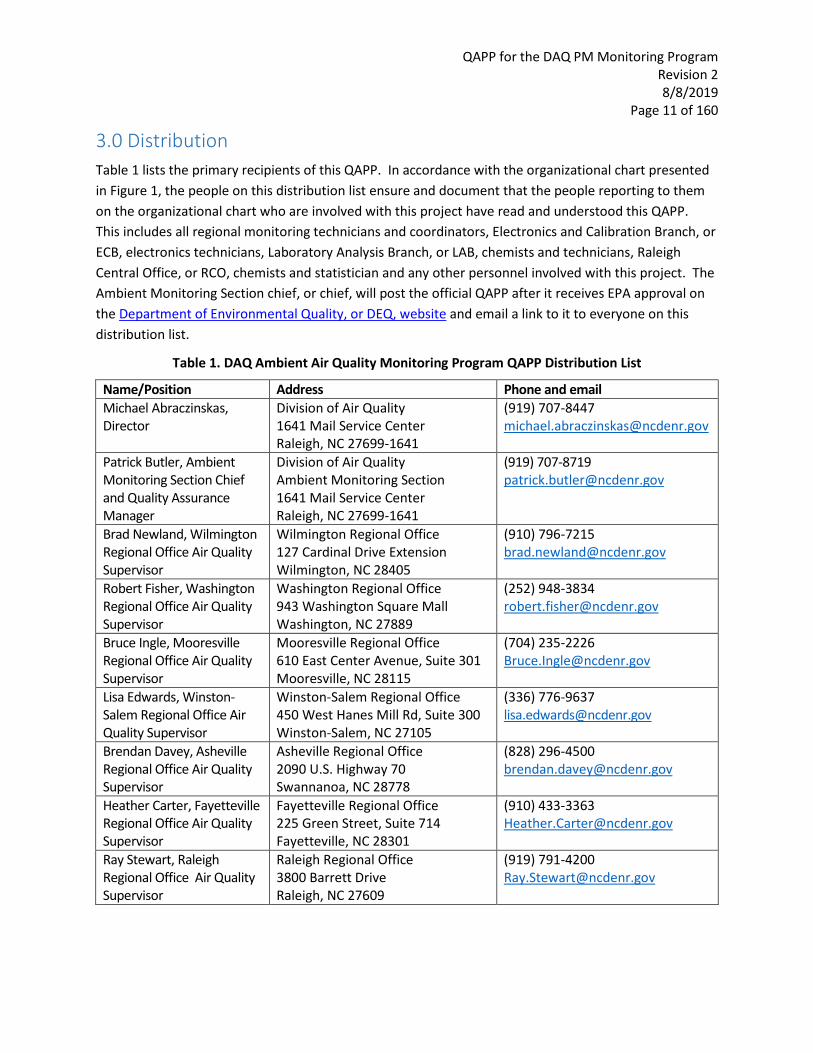
3.0 Distribution Table 1 lists the primary recipients of this QAPP. In accordance with the organizational chart presented in Figure 1, the people on this distribution list ensure and document that the people reporting to them on the organizational chart who are involved with this project have read and understood this QAPP. This includes all regional monitoring technicians and coordinators, Electronics and Calibration Branch, or ECB, electronics technicians, Laboratory Analysis Branch, or LAB, chemists and technicians, Raleigh Central Office, or RCO, chemists and statistician and any other personnel involved with this project. The Ambient Monitoring Section chief, or chief, will post the official QAPP after it receives EPA approval on the Department of Environmental Quality, or DEQ, website and email a link to it to everyone on this distribution list.
Table 1. DAQ Ambient Air Quality Monitoring Program QAPP Distribution List
Name/Position Address Phone and email Michael Abraczinskas, Director
Division of Air Quality 1641 Mail Service Center Raleigh, NC 27699-1641
(919) 707-8447 [email protected]
Patrick Butler, Ambient Monitoring Section Chief and Quality Assurance Manager
Division of Air Quality Ambient Monitoring Section 1641 Mail Service Center Raleigh, NC 27699-1641
(919) 707-8719 [email protected]
Brad Newland, Wilmington Regional Office Air Quality Supervisor
Wilmington Regional Office 127 Cardinal Drive Extension Wilmington, NC 28405
(910) 796-7215 [email protected]
Robert Fisher, Washington Regional Office Air Quality Supervisor
Washington Regional Office 943 Washington Square Mall Washington, NC 27889
(252) 948-3834 [email protected]
Bruce Ingle, Mooresville Regional Office Air Quality Supervisor
Mooresville Regional Office 610 East Center Avenue, Suite 301 Mooresville, NC 28115
(704) 235-2226 [email protected]
Lisa Edwards, Winston-Salem Regional Office Air Quality Supervisor
Winston-Salem Regional Office 450 West Hanes Mill Rd, Suite 300 Winston-Salem, NC 27105
(336) 776-9637 [email protected]
Brendan Davey, Asheville Regional Office Air Quality Supervisor
Asheville Regional Office 2090 U.S. Highway 70 Swannanoa, NC 28778
(828) 296-4500 [email protected]
Heather Carter, Fayetteville Regional Office Air Quality Supervisor
Fayetteville Regional Office 225 Green Street, Suite 714 Fayetteville, NC 28301
(910) 433-3363 [email protected]
Ray Stewart, Raleigh Regional Office Air Quality Supervisor
Raleigh Regional Office 3800 Barrett Drive Raleigh, NC 27609
(919) 791-4200 [email protected]

QAPP for the DAQ PM Monitoring Program Revision 2 8/8/2019
Page 12 of 160
Table 1. DAQ Ambient Air Quality Monitoring Program QAPP Distribution List
Name/Position Address Phone and email Derrick House, Electronics and Calibration Branch Supervisor
Division of Air Quality Electronics and Calibration Branch 1730 Mail Service Center Raleigh, NC 27699-1730
(919) 715-1761 [email protected]
James Bowyer, Laboratory Analysis Branch Supervisor
Division of Air Quality Lab Analysis Branch 1622 Mail Service Center Raleigh, NC 27699-1622
(919) 715-7484 [email protected]
Joette Steger, Projects and Procedures Branch Supervisor
Division of Air Quality Projects and Procedures Branch 1641 Mail Service Center Raleigh, NC 27699-1641
(919) 707-8449 [email protected]
Steven Rice, Database Manager
Division of Air Quality 1641 Mail Service Center Raleigh, NC 27699
(919) 715-7220 [email protected]
David Brigman, Western North Carolina Regional Air Quality Agency Director
Western North Carolina Regional Air Quality Agency 49 Mt. Carmel Road Asheville, NC 28806
(828) 250-6777 [email protected]
Ryan Brown, EPA Region 4 State Contact
U.S. Environmental Protection Agency, Region 4 Air and Radiation Division 61 Forsyth Street, S.W. Atlanta, GA 30303-8960
(404) 562-9147 [email protected]
Laura Ackerman, Quality Assurance Section Chief
U.S. Environmental Protection Agency, Region 4 Laboratory Services and Applied Science Division 980 College Station Road Athens, GA 30605-2720
706-355-8776 [email protected]

QAPP for the DAQ PM Monitoring Program Revision 2 8/8/2019
Page 13 of 160
4.0 Project/Task Organization The EPA is responsible for developing the national ambient air quality standards or NAAQS defining the quality of data necessary to make comparisons to the NAAQS and identifying a minimum set of quality control samples from which to judge the data quality. The state and local air monitoring organizations are responsible for taking this information and using it to develop and implement a quality assurance, or QA, program that will meet the data quality requirements. It is the responsibility of the EPA and the monitoring organizations to assess the quality of the data and take corrective action, when appropriate.
The State of North Carolina Division of Air Quality, or DAQ, ambient air monitoring program is an independent primary quality assurance organization, or PQAO, as defined in 40 CFR Part 58, Appendix A, Section 1.2. The DAQ operates the PM monitoring program as part of the DAQ PQAO.
The DAQ director has organized the Ambient Monitoring Section into three main branches: The Projects and Procedures Branch, or PPB, the LAB and ECB. The chief has responsibility for managing these branches per stated policy. The chief delegates the responsibility and authority to develop, organize, maintain and implement quality programs to the supervisors of each branch, in accordance with the EPA-approved quality management plan, or QMP. These supervisors have direct responsibility for assuring data quality. The Ambient Monitoring Section shares the monitoring responsibilities with regional monitoring staff in the seven regional offices (Asheville, Mooresville, Winston-Salem, Fayetteville, Raleigh, Washington and Wilmington), as well as with the Western North Carolina Regional Air Quality Agency, or WNC, which is under the DAQ PQAO.
The Ambient Monitoring Section also provides sequential PM media, laboratory analysis and technical assistance (upon request) to the Forsyth and Mecklenburg County local programs. The DAQ provides the Air Quality Management of the Eastern Band of Cherokee Indians the same support and data as the local county programs, with the addition of performing quarterly audits for their network.
Figure 1 displays the organizational structure for the implementation of the monitoring program. The following information lists the specific responsibilities of each significant position within the DAQ Ambient Monitoring Section and the regional offices and local programs.
4.1 DAQ Director
The DAQ director, or director, supervises the chief and regional office supervisors. The director is responsible for ensuring adequate human and financial resources are available to support DAQ’s particulate matter, or PM, monitoring program. The director has ultimate responsibility and final authority on all aspects of the PM monitoring program. In the event of an emergency or inclement weather, the director implements the Continuity of Operations Plan, including the hurricane readiness procedures. The director also serves as a liaison with other divisions in DEQ, with the North Carolina General Assembly, the North Carolina Department of Information Technology, or DIT, and with other regional air-monitoring organizations.

QAPP for the DAQ PM Monitoring Program Revision 2 8/8/2019
Page 14 of 160
4.2 Ambient Monitoring Section
The Ambient Monitoring Section contains the PPB, the LAB and ECB and is responsible for coordinating the QA, data collection, sample collection and analysis, and data processing of DAQ’s PM monitoring program.
Ambient Monitoring Section Chief: The chief serves as the quality assurance manager and reports directly to the DAQ director on all matters relating to DAQ’s PM ambient monitoring program. The chief’s duties include, but are not limited to the following:
- Serving as the QAM and maintaining oversight of all QA activities; - Supervising the ambient monitoring section staff and delegating responsibilities as
appropriate; - Serving as the liaison to EPA Region 4 air quality monitoring staff; - Maintaining overall responsibility for the monitoring network design and review, subject
to the director’s approval, including oversight and approval of the annual network plan and five-year assessment;
- Authorizing the installation and discontinuation of monitors within the network; - Approving and distributing division standard operating procedures, or SOPs, and QAPPs
to the personnel listed in Table 1; - Serving as the tie-breaker in the event of an impasse on how to handle corrective
actions or make a final judgment call on data validity; - Collaborating with DEQ staff in developing, administering and maintaining the QMP; - Overseeing training for the ambient monitoring staff; - Certifying the data every year in accordance with 40 CFR Section 58.15; - Reviewing the quarterly QA reports and the QC summaries to ensure the bias and
precision limits are attained; - Overseeing the management of the agency’s documents and records; - Tracking corrective actions and determining their success; - Participating in systems audits; - Assuring that QAPPs are established and effectively implemented for each project as
applicable; and - Reviewing budgets, contracts, grants and proposals.
If the chief is unavailable to perform these duties, the chief will assign someone to fulfill these duties, or if the chief is unable to make that assignment, the DAQ director will assign someone to fulfill these duties.
Database Manager: Although the database manager does not report directly to the chief, he has direct access to the chief on all matters relating to the management of DAQ’s PM ambient-air monitoring database. The database manager’s duties include, but are not limited, to the following:
- Ensuring correct data is being transferred to the DAQ Internet-Based Enterprise Application Management, or IBEAM, database and DAQ real-time air quality data webpage;
- Acting as the data-acquisition system manager for the continuous PM monitoring program;
QAPP for the DAQ PM Monitoring Program Revision 2 8/8/2019
Page 15 of 160
- Participating in systems audits; - Uploading environmental data to the United States Environmental Protection Agency’s (EPA’s)
Air Quality System (AQS) and AirNow-Tech databases; - Serving as the AQS administrator for DAQ; - Maintaining the Raleigh central office (RCO) data polling station (i.e., Envista Air Resources
Manager, or ARM), ensuring it polls hourly data for each hour of every day; - Maintaining and updating the RCO data polling software and AQS database when sites and
monitors are established or shut down; and - Other duties as assigned.
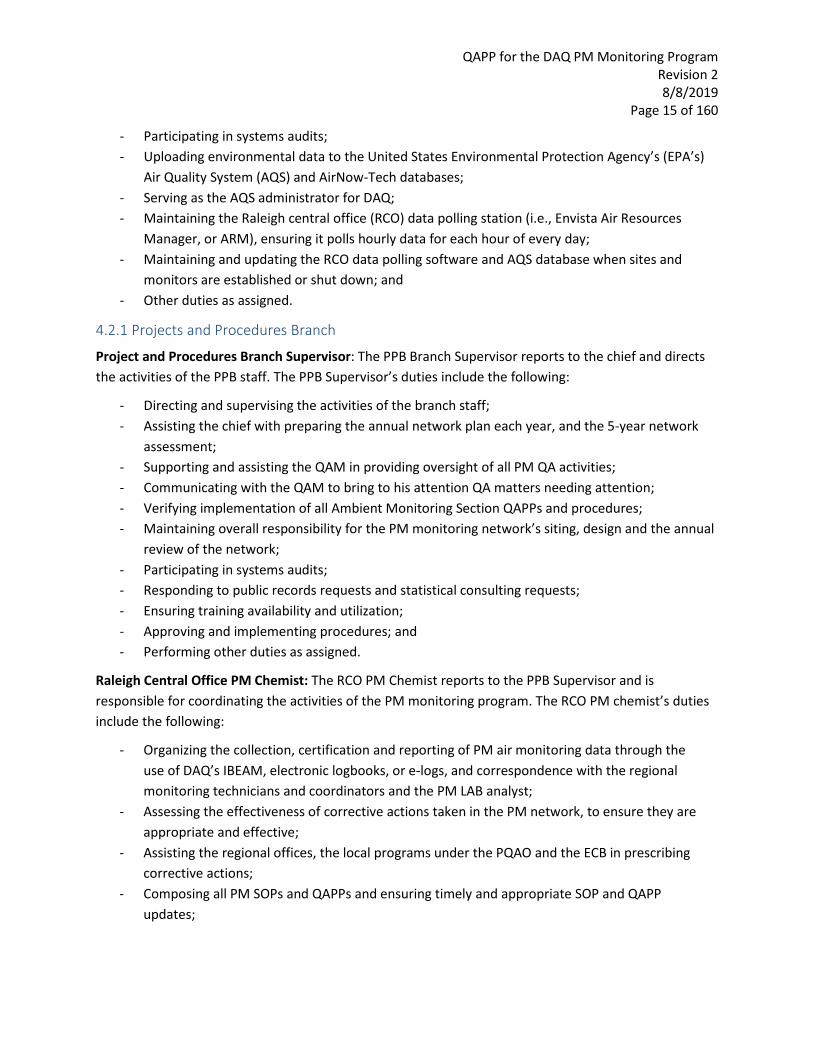
4.2.1 Projects and Procedures Branch
Project and Procedures Branch Supervisor: The PPB Branch Supervisor reports to the chief and directs the activities of the PPB staff. The PPB Supervisor’s duties include the following:
- Directing and supervising the activities of the branch staff; - Assisting the chief with preparing the annual network plan each year, and the 5-year network
assessment; - Supporting and assisting the QAM in providing oversight of all PM QA activities; - Communicating with the QAM to bring to his attention QA matters needing attention; - Verifying implementation of all Ambient Monitoring Section QAPPs and procedures; - Maintaining overall responsibility for the PM monitoring network’s siting, design and the annual
review of the network; - Participating in systems audits; - Responding to public records requests and statistical consulting requests; - Ensuring training availability and utilization; - Approving and implementing procedures; and - Performing other duties as assigned.
Raleigh Central Office PM Chemist: The RCO PM Chemist reports to the PPB Supervisor and is responsible for coordinating the activities of the PM monitoring program. The RCO PM chemist’s duties include the following:
- Organizing the collection, certification and reporting of PM air monitoring data through the use of DAQ’s IBEAM, electronic logbooks, or e-logs, and correspondence with the regional monitoring technicians and coordinators and the PM LAB analyst;
- Assessing the effectiveness of corrective actions taken in the PM network, to ensure they are appropriate and effective;
- Assisting the regional offices, the local programs under the PQAO and the ECB in prescribing corrective actions;
- Composing all PM SOPs and QAPPs and ensuring timely and appropriate SOP and QAPP updates;

QAPP for the DAQ PM Monitoring Program Revision 2 8/8/2019
Page 16 of 160
- As the Level 3 data reviewer, maintaining QA records, flagging suspect data and/or samples and validating laboratory data quality by verifying the weigh sessions data and ensuring the lab method has been followed appropriately, and validating that all required quality control (QC) field activities are performed by the regional monitoring staff within the data acquisition system (DAS) and e-logs;
- As the Level 3 data reviewer, maintaining QA records, flagging suspect continuous data, and certifying the sequential PM monitoring data within Envista ARM, IBEAM, e-logs and the PM laboratory data;
- Participating in systems audits; - Quickly identifying PM data quality problems and initiating actions that result in solutions; - Providing in-house PM technical systems audits, or TSAs, and in-person training to personnel
as needed; and - Performing other duties as assigned.
Raleigh Central Office LAB QA Chemist: The RCO LAB QA chemist reports to the PPB supervisor. This chemist works in conjunction with the PM laboratory and has the following responsibilities:
- Composing all PM weigh lab SOPs and ensuring timely and appropriate SOP updates; - As the Level 3 PM laboratory data reviewer, maintaining documentation, flagging suspect data
and/or samples and validating laboratory data quality; - As the Level 3 PM laboratory data reviewer, validating the weigh sessions data, ensuring the lab
method has been followed appropriately; - Participating in systems audits and assisting in the validation of the PM laboratory’s Weights
Original Excel spreadsheet; - Identifying data quality problems and initiating actions that result in solutions; and - Performing other duties as assigned.
Raleigh Central Office Audit Chemist: The RCO audit chemist reports to the PPB supervisor and is responsible for assessing, auditing and evaluating the DAQ PM monitoring program. The RCO audit chemist’s duties include the following:
- Assessing the effectiveness of the network system; - Tracking SOP and QAPP annual reviews and updates; - Verifying that all required quality assurance/quality control (QA/QC) activities are
performed, that measurement quality standards are met, and decisions are documented; - Maintaining QA/QC records and assessing and reporting on data quality; - Conducting quarterly completeness evaluations and audits of data quality; - Participating in systems audits; - Conducting internal systems audits, as needed; - Identifying data quality problems and initiating actions that result in solutions; - Providing training and certification to appropriate personnel; and - Performing other duties as assigned.

QAPP for the DAQ PM Monitoring Program Revision 2 8/8/2019
Page 17 of 160
Raleigh Central Office Statistician: The RCO statistician reports to the PPB supervisor. The RCO statistician provides statistical programming support to the PPB Supervisor, and other staff of the central and regional offices. The RCO statistician’s duties include the following:
- Assisting the PPB supervisor and DAQ with responses to consulting and PM data requests; - Participating in training and certification programs to keep current on technology; - Collecting all continuous PM data from the previous day and providing it to all of DAQ for
easy review in Excel via email; - Providing daily outlier and system failure warnings for PM data from the previous day via
email to all of DAQ; - Participating in systems audits; - Planning and conducting data quality assessments (DQAs); - Responding to public records requests and statistical consulting requests; and - Other duties as assigned.
4.2.2 Laboratory Analysis Branch
Laboratory Analysis Branch Supervisor: The Laboratory Analysis Branch (LAB) Supervisor reports to the chief. This supervisor supervises the analyst operating the particle filter-weighing laboratory and the LAB chemist doing the second level review of the PM laboratory data. The LAB Supervisor’s duties include the following:
- Supervising the LAB staff, including the PM lab staff, and delegating responsibilities as appropriate;
- Maintaining oversight of all PM laboratory activities, including corrective actions and their effectiveness;
- Approving all SOPs for the PM monitoring laboratory and verifying their implementation; - Acting as the liaison to RTI Laboratories if and when PM media and analysis is outsourced; - Preparing budgets, contracts, and proposals; - Ordering supplies and consumables when needed, procuring equipment for the PM lab; - Participating in systems audits; - Ensuring training availability and utilization for the DAQ PM Laboratory staff; and - Other duties as assigned.
PM Laboratory Analysis Branch Analyst: The PM LAB analyst reports to the LAB supervisor. The PM LAB analyst’s duties include the following:
- Preparing, shipping, receiving, weighing and tracking all sequential PM air sampling media; - Performing all required laboratory QC; - As the Level 1 data reviewer, maintaining QA records, flagging suspect data and/or samples
and verifying laboratory data quality; - As the Level 1 data reviewer, verifying the weigh sessions data, ensuring the lab method has
been followed appropriately;

QAPP for the DAQ PM Monitoring Program Revision 2 8/8/2019
Page 18 of 160
- Maintaining and the PM laboratory’s Weights Original Excel spreadsheet including periodic functional testing;
- Retention of filter data sheets and chain of custody, or COC; - Tracking inventory of consumables; - Participating in systems audits; - Performing and documenting all maintenance of laboratory equipment; - Ensuring the implementation of laboratory SOPs and sections of QAPPs as they pertain to filter
processing and sample analysis; - Serving as the sample custodian for all filter samples; - Identifying laboratory quality problems and initiating action that results in solutions; and - Performing other duties as assigned.
PM LAB Chemist: The LAB chemist, also referred to as level 2 reviewer in Figure 1 and in this QAPP, reports to the LAB supervisor. The LAB chemist’s duties include the following:
- Verifying data by serving as the level 2 reviewer for the PM laboratory; - Verifying that all required QA and quality control, or QA/QC, activities are performed and that
measurement quality standards are met for the PM laboratory; - Maintaining QA/QC records and reviewing flags for suspect data; - Assessing data quality and providing data quality reports to the RCO LAB QA chemist (level 3
reviewer); - Participating in systems audits and assisting in the validation of the PM laboratory’s Weights
Original Excel spreadsheet; - Identifying data quality problems and initiating actions that result in solutions; and - Performing other duties as assigned.
RTI Laboratories: RTI Laboratories communicates with the LAB Supervisor. In the case of a failure of the DAQ PM laboratory (such as laboratory closure, equipment failure, fire or natural disaster), RTI will be contracted to provide PM filter media and analysis for the DAQ PM monitoring program.
4.2.3 Electronics and Calibration Branch
Electronics and Calibration Branch Supervisor: The ECB supervisor reports to the chief and directs the activities of the ECB electronics technicians who maintain the infrastructure and equipment for PM monitoring. The ECB supervisor’s duties include the following:
- Maintaining oversight of all ECB activities, including overseeing corrective actions and their effectiveness;
- Directing the activities of the ECB electronics technicians; - Verifying implementation of all ECB SOPs; - Overseeing and approving the timely update of ECB SOPs; - Acting as the liaison to Airmetrics and Mesa Laboratories for calibrating and certifying all PM
flow transfer standards. - Participating in systems audits;

QAPP for the DAQ PM Monitoring Program Revision 2 8/8/2019
Page 19 of 160
- Preparing budgets, contracts, proposals and purchase orders for field equipment; - Providing training for ECB Staff on PM monitoring; and - Accomplishing other duties, as assigned.
ECB Electronics Technicians: The ECB electronics technicians report to the ECB supervisor. The ECB electronics technicians’ duties include the following:
- Installing all PM field equipment and monitoring sites; - Maintaining an inventory of monitoring/sampling spare parts, spare equipment and consumable
supplies to prevent unnecessary downtime of PM sampling; - Certifying all transfer standards through outside vendors and periodically checking calibration of
primary standards to ensure quality calibrations; - Assisting the DAQ Central Office PM Chemist, regional offices and local programs in prescribing
corrective actions for PM monitoring issues and Envista ARM communication; - Composing all ECB PM SOPs and ensuring timely and appropriate updates; - Recommending changes, when needed, in the QA program; - Participating in systems audits; - Performing and documenting all major repairs and maintenance of PM monitoring field
equipment as described by SOPs 2.24.1 and 2.37.1. (See Table 17 for SOP titles.); - Tracking inventory of consumables when needed; and - Completing other tasks as assigned.
Airmetrics: Airmetrics, or an equivalent vendor, provides the calibration and verification services for all of the flow transfer standard orifices used in the PM monitoring program. When used, Airmetrics communicates with the ECB supervisor.
Mesa Laboratories: Mesa Laboratories, or an equivalent vendor, provides the calibration and verification services for all of the flow transfer standard Tetra-Cals used in the PM monitoring program. When used, Mesa Laboratories communicates with the ECB supervisor.
4.3 Regional Offices
The DAQ has seven regional offices. Each regional office has an air quality supervisor, a regional monitoring coordinator, and one or more regional monitoring technicians.
Regional Office Air Quality Supervisors: The regional office air-quality supervisors report to the DAQ Director and has direct access to the DAQ director and chief on all matters relating to DAQ’s PM monitoring program. The regional office air-quality supervisor’s duties include:
- Assuring that division policies are maintained at the regional office level; - Acquiring needed monitoring resources; - Verifying that staff are implementing the SOPs and QAPPs; - Recommending changes when needed in the QA/QC program; - Providing input for the design of the PM monitoring network
QAPP for the DAQ PM Monitoring Program Revision 2 8/8/2019
Page 20 of 160
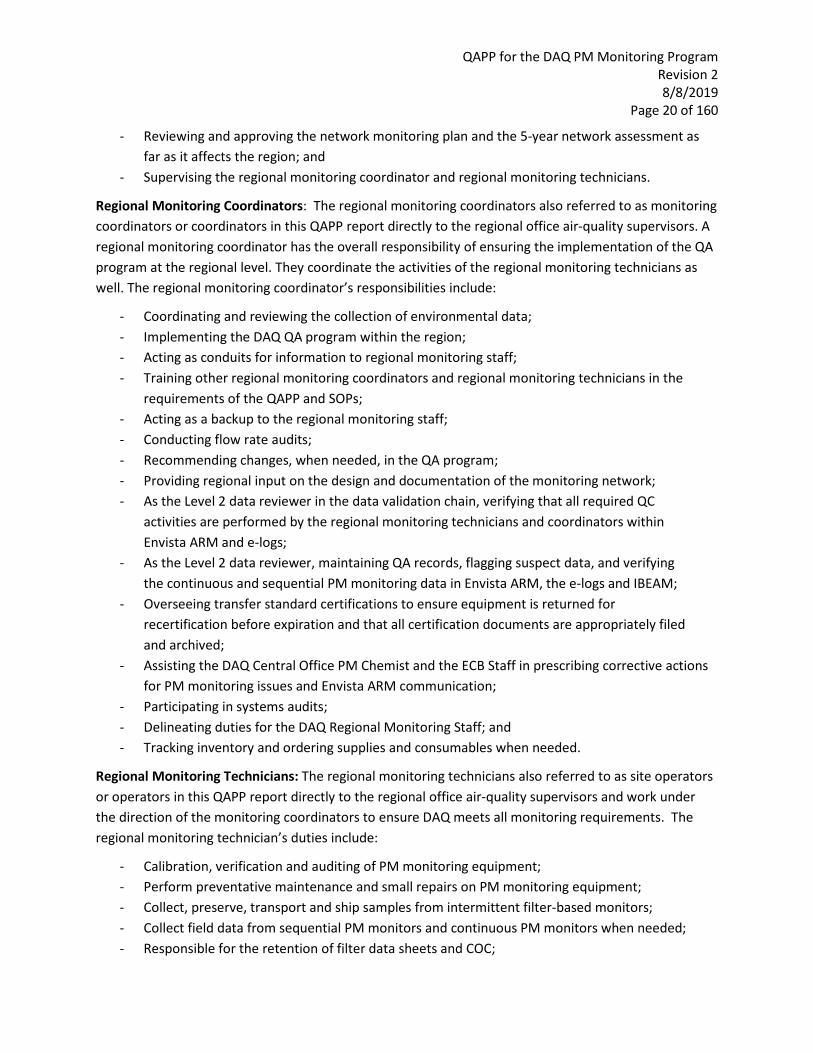
- Reviewing and approving the network monitoring plan and the 5-year network assessment as far as it affects the region; and
- Supervising the regional monitoring coordinator and regional monitoring technicians.
Regional Monitoring Coordinators: The regional monitoring coordinators also referred to as monitoring coordinators or coordinators in this QAPP report directly to the regional office air-quality supervisors. A regional monitoring coordinator has the overall responsibility of ensuring the implementation of the QA program at the regional level. They coordinate the activities of the regional monitoring technicians as well. The regional monitoring coordinator’s responsibilities include:
- Coordinating and reviewing the collection of environmental data; - Implementing the DAQ QA program within the region; - Acting as conduits for information to regional monitoring staff; - Training other regional monitoring coordinators and regional monitoring technicians in the
requirements of the QAPP and SOPs; - Acting as a backup to the regional monitoring staff; - Conducting flow rate audits; - Recommending changes, when needed, in the QA program; - Providing regional input on the design and documentation of the monitoring network; - As the Level 2 data reviewer in the data validation chain, verifying that all required QC
activities are performed by the regional monitoring technicians and coordinators within Envista ARM and e-logs;
- As the Level 2 data reviewer, maintaining QA records, flagging suspect data, and verifying the continuous and sequential PM monitoring data in Envista ARM, the e-logs and IBEAM;
- Overseeing transfer standard certifications to ensure equipment is returned for recertification before expiration and that all certification documents are appropriately filed and archived;
- Assisting the DAQ Central Office PM Chemist and the ECB Staff in prescribing corrective actions for PM monitoring issues and Envista ARM communication;
- Participating in systems audits; - Delineating duties for the DAQ Regional Monitoring Staff; and - Tracking inventory and ordering supplies and consumables when needed.
Regional Monitoring Technicians: The regional monitoring technicians also referred to as site operators or operators in this QAPP report directly to the regional office air-quality supervisors and work under the direction of the monitoring coordinators to ensure DAQ meets all monitoring requirements. The regional monitoring technician’s duties include:
- Calibration, verification and auditing of PM monitoring equipment; - Perform preventative maintenance and small repairs on PM monitoring equipment; - Collect, preserve, transport and ship samples from intermittent filter-based monitors; - Collect field data from sequential PM monitors and continuous PM monitors when needed; - Responsible for the retention of filter data sheets and COC;

QAPP for the DAQ PM Monitoring Program Revision 2 8/8/2019
Page 21 of 160
- Maintain inventories of consumable goods provided by the ECB and orders supplies and consumables when needed;
- Perform all required QC activities and ensures that measurement quality objectives, or MQOs, are met as prescribed in the QAPP and SOPs;
- Perform corrective actions to address any activities that do not meet the acceptance criteria as prescribed in the QAPP and SOPs;
- Document deviations from established procedures and methods; - Report nonconforming conditions, monitor failures and corrective actions to the regional office
air quality supervisor, the regional monitoring coordinator, the RCO PM chemist and the ECB electronics technicians;
- As the Level 1 data reviewer in the data validation chain, the Regional Monitoring Staff verifies that all required QC activities are performed within Envista ARM and e-logs;
- As the Level 1 data reviewer, the regional monitoring technicians maintain QA records, flags suspect data and verifies the continuous and sequential PM monitoring data within Envista ARM and the e-logs;
- Assist the RCO PM chemist and the ECB electronics technicians in prescribing corrective actions for PM monitoring issues and Envista ARM communication;
- Send all PM flow transfer standards to ECB for calibration and certification, and for checking calibration of primary standards to ensure quality calibrations;
- Ensuring all transfer standards used are within their expiration dates; - Conducts annual site evaluations and takes measurements of monitor and sampler inlets to
ensure compliance with 40 Code of Federal Regulations (CFR) Part 58 Appendix E requirements; - Participate in systems audits; - Recommend changes, when needed, in the QA program; and - Participate in provided training activities.
4.4 Western North Carolina Air Quality Agency
The WNC local program is under the PQAO of the DAQ Ambient Monitoring Section.
WNC Local Program Director: The WNC local program director reports to the Buncombe County board and primarily interacts with DAQ through the DAQ director. The WNC local program director also has access to the chief when needed. The WNC local program director’s duties include:
- Communicating with the WNC Monitoring Staff about proper policies and processes with regards to PM monitoring;
- Supervising the WNC Monitoring Staff; - Acting as the liaison to EPA, Region 4; - Acting as the liaison to the DAQ director; - Acquiring needed monitoring resources for the WNC program; - Recommending changes when needed in the QA/QC program; - Verifying implementation of quality programs; and

QAPP for the DAQ PM Monitoring Program Revision 2 8/8/2019
Page 22 of 160
- Providing and approving input for the PM monitoring network plan and the 5-year network assessment.
WNC Monitoring Staff: The WNC monitoring staff report directly to the WNC director and have access to the chief when needed. The WNC monitoring staff perform the same roles as the regional monitoring technicians and this QAPP includes them by reference when it uses the term regional monitoring technician, site operator or operator:
- Performs calibrations, verifications and audits of PM monitoring equipment; - Performs preventative maintenance and small repairs on PM monitoring equipment; - Collects, preserves, transports and ships samples from intermittent filter-based monitors; - Collects field data from sequential PM monitors and continuous PM monitors when needed; - Maintains inventories of consumable goods provided by the ECB and orders supplies and
consumables when needed; - Performs all required QC activities and ensures that the MQOs are met as prescribed in the
QAPP and SOPs; - Performs corrective actions to address any activities that do not meet the acceptance criteria as
prescribed in the QAPP and SOPs; - Assists the RCO PM Chemist and the ECB electronics technicians in prescribing corrective
actions for PM monitoring issues and Envista ARM communications; - Reports nonconforming conditions, monitor failures and corrective actions to the WNC director,
the RCO PM Chemist and the ECB electronics technicians; - As the Level 1 data reviewer in the data validation chain, verifies and validates that all
required QC activities are performed within Envista ARM and e-logs; - As the Level 1 data reviewer, maintains QA records, flags suspect data and verifies the
continuous and sequential PM monitoring data within Envista ARM and e-logs; - Conducts annual site evaluations and takes measurements of sampler and monitor inlets to
ensure compliance with 40 CFR Part 58, Appendix E requirements; - Participates in systems audits; - Recommends changes, when needed, in the QA program; and - Participates in training activities.
4.5 Other North Carolina Local and Tribal Programs
Eastern Band of Cherokee Indians, Forsyth and Mecklenburg County Local Programs: These local programs receive sequential PM sampling media, as well as analysis of said media, from the DAQ PM Laboratory. The official point of contact for these programs will be the chief.
4.6 Department of Information Technology
The DIT provides security for the ambient monitoring computers. They manage, in cooperation with the regional monitoring and ECB electronics technicians and database manager, the computers located at the monitoring sites as well as the primary server that houses the Envista ARM database. Their responsibilities include ensuring the security of the computers and network, updating of the operating

QAPP for the DAQ PM Monitoring Program Revision 2 8/8/2019
Page 23 of 160
system and other standard software on the computer and ensuring that the technicians maintain adequate access to the computers to perform all necessary monitoring functions.
4.7 United States Environmental Protection Agency, Region 4
The DAQ will operate the PM monitors following the procedures in 40 CFR Part 58. As a result, the chief will include information on these monitors in the annual network-monitoring plan and the five-year network assessment and the EPA Region 4 Air and Radiation Division director will review, comment on and respond to the network plan each year. Likewise, the chief will include the data from these monitors in the annual certification request. The EPA Region 4 Air and Radiation Division director will review and apply concurrence codes in AQS in response to DAQ’s data certification request. The chief will also submit a QAPP to the EPA Region 4 Laboratory Services and Applied Science Division, or LSASD, for EPA approval. The EPA Region 4 LSASD will include the PM monitors in the Performance Evaluation Program (PEP).

QAPP for the DAQ PM Monitoring Program Revision 2 8/8/2019
Page 24 of 160
Figure 1. Project Organizational Chart
DEQ Director of Air Quality
Regional Office Air Quality Supervisor
Regional Monitoring Coordinator
(Level 2 Reviewer)
Regional Monitoring Technicians
(Level 1 Reviewer)
DAQ Ambient Monitoring Section Chief and QAM
ECB Electronics Technicians
DAQ Projects and Procedures Branch
Supervisor
DAQ RCO LAB QA Chemist
(Level 3 Reviewer) DAQ RCO
Statistician
WNC Director
WNC Monitoring Staff (Level 1 Reviewer)
DAQ Laboratory Analysis Branch
Supervisor
DAQ RCO Audit Chemist
DAQ RCO PM Chemist
(Level 3 Reviewer)
Mesa Laboratories
Mecklenburg County Local Program Director
Forsyth County Local Program Director
RTI Laboratories
Eastern Band of Cherokee Indians
Airmetrics
Electronics and Calibration Branch
Supervisor
USA EPA, Region 4 LSASD and ARD
Database Manager
Department of Information Technology
PM LAB Analyst (Level 1 Reviewer)
LAB Chemist (Level 2 Reviewer)

QAPP for the DAQ PM Monitoring Program Revision 2 8/8/2019
Page 25 of 160
5.0 Problem Definition and Background In 1970, the president signed the Clean Air Act (CAA) into law. Sections 108 and 109 of the CAA govern the establishment of and revision of the National Ambient Air Quality Standards, or NAAQS, for air pollutants (i.e., PM) that are determined to contribute to air pollution that is harmful to public health and welfare. The CAA and its amendments provide the framework for the monitoring of PM by state, local, and tribal air monitoring organizations. Under the area designations process, the EPA uses data from PM ambient air monitors to characterize air concentrations for identification of areas that are either meeting or violating the PM pollutant standard. EPA and the state and local agencies typically designate monitors and samplers used for comparisons against a NAAQS State and Local Air Monitoring Stations (SLAMS) monitors, which must meet the requirements stipulated in 40 CFR Parts 50, 53, and 58. For PM, DAQ must collect three years of valid, quality-assured data for comparison against the NAAQS.
The DAQ Ambient Monitoring Section initiated air quality PM monitoring in 1971 as part of an integrated, statewide survey effort. At that time, total suspended particle (TSP) sampling was the driver in the PM NAAQS. The standards consisted of a 24-hour and annual mean of 260 micrograms per cubic meter (µg/m3), and 75 µg/m3, respectively, and a particle size limit of 50 µm. For 15 years, this was the basis for compliance with the NAAQS concerning PM.
In 1985, the DAQ Ambient Monitoring Section began adding sampling for PM with aerodynamic diameters of 10 µm or smaller (PM10) to the monitoring network. Two years later, EPA adopted PM10
standards over TSP for compliance with the NAAQS. In 1988, the DAQ adopted those same standards and began transitioning the TSP sampling network over to PM10 sampling; the DAQ completed that process in 1991.
EPA again updated its PM NAAQS in 1998 by commissioning sampling for PM 2.5 µm or smaller (PM2.5). Once again, the DAQ Ambient Monitoring Section began the addition of PM2.5 sampling to the monitoring network, and in later years, transitioned even more sites from PM10 to PM2.5, even adding the ability to render PM data in real time. Currently, DAQ measures continuous PM10, continuous and filter based PM2.5 and PM Coarse using continuous methods.
The EPA defines particulate matter with aerodynamic diameters between 2.5 and 10 micrometers, or µm, as coarse PM. Because of its impacts on respiratory and cardiac health, the EPA looked on this PM pollutant variety with renewed interest in 2006. On October 17, 2006, as published in the Federal Register, the EPA provided final rule revisions to ambient monitoring regulations as contained in 40 CFR, Parts 53 and 58. Included in these revised rules were the requirements for establishing National Ambient Air Monitoring Strategy - National Core Monitoring, or NCore, sites. NCore is a multipollutant network that integrates several advanced measurement systems for particles, pollutant gases and meteorology. Each state was required to operate at least one NCore site beginning January 1, 2011. The NCore sites must measure, at a minimum, mass of coarse particles with an average aerodynamic diameter between 2.5 and 10 microns or PM10-2.5 particle mass.

QAPP for the DAQ PM Monitoring Program Revision 2 8/8/2019
Page 26 of 160
The WNC came under DAQ’s PQAO in 2007, along with the Forsyth and Mecklenburg county local programs. At the time, EPA Region 4 made each state one PQAO to conserve both state and EPA resources. In 2014/2015, EPA Region 4 held that the DAQ Ambient Monitoring Section was not meeting the needed PQAO requirements, and Forsyth and Mecklenburg chose to become their own PQAOs.
Table 2 shows the present day designated NAAQS for PM 2.5 microns and smaller, and 10 microns and smaller. Primary standards are set at a level adequate to protect public health within an acceptable margin of safety, while secondary standards are set a level that is requisite to protect public welfare.
The objective of the DAQ Ambient Monitoring Section is to protect the health and sustainability of the State of North Carolina by identifying any violations of the PM NAAQS, locating the highest ambient particle pollution concentrations across the area and determining the general PM background concentration. The PM monitoring data collected supports the local, state, regional and federal air monitoring programs and the general population.
Health scientists have linked the size of particles directly to their potential for causing health problems. Small particles less than 10 µm in aerodynamic diameter pose the greatest problems, because they can get deep into your lungs, and some may even get into your bloodstream (coarse particles, i.e. PM10-2.5, are of less concern, although they can irritate a person's eyes, nose, and throat). Exposure to such particles can affect both your lungs and your heart. People with heart or lung diseases, children, and older adults are the most likely to be affected by particle pollution exposure. Numerous scientific studies have linked particle pollution exposure to a variety of problems, including:
- Premature death in people with heart or lung disease; - Nonfatal heart attacks; - Irregular heartbeat; - Aggravated asthma; - Decreased lung function; and - Increased respiratory symptoms, such as irritation of the airways, coughing or difficulty
breathing.
Fine particles (PM2.5) are also the main cause of reduced visibility (haze) in parts of the United States, including many of our treasured national parks and wilderness areas. The wind can carry particles over long distances and these transported particles can then settle on the ground or water. Depending on their chemical composition, the effects of this settling may include:
- making lakes and streams acidic; - changing the nutrient balance in coastal waters and large river basins; - depleting the nutrients in soil; - damaging sensitive forests and farm crops; - affecting the diversity of ecosystems; - contributing to acid rain effects; - PM can stain and damage stone and other materials, including culturally important objects such
as statues and monuments.

QAPP for the DAQ PM Monitoring Program Revision 2 8/8/2019
Page 27 of 160
In light of these problems, the DAQ Ambient Monitoring Section’s goals are to encourage the wise and beneficial use of the natural environment of the State of North Carolina, to minimize the adverse impact of PM contaminants on human health and welfare, and to foster public awareness.
The EPA regulations require agencies plan, document and prepare an approved QAPP for all projects involving the generation, acquisition and use of environmental data. The QAPP is a compilation of QA/QC requirements, procedures and guidelines designed to achieve a high percentage of valid data samples, while maintaining integrity and accuracy. Adherence to the requirements set forth in this QAPP will ensure consistent, repeatable results and improve the reliability and comparability of all data collected. All regional monitoring technicians and coordinators, ECB electronics technicians, LAB technicians and chemist, RCO PM, LAB QA and audit chemists, statistician and supervisors will use this QAPP as a reference document, providing the framework for the monitoring network’s QA program. Additional details and technical specifications are set forth in individual PM SOPs used by the people involved in this program for each aspect of the PM monitoring program, such as instrument operations and data handling. This QAPP will reference these SOPs in later sections of this QAPP. It is the responsibility of all people involved with this program to ensure that they properly implement all procedures and guidelines in this QAPP.
The DAQ will review this PM QAPP annually and revise it if procedures have changed or when it needs updating; at a minimum, the DAQ will revise and update the PM QAPP every 5 years. QAPP changes are subject to the approval of EPA’s Region 4 QA staff. The DAQ Ambient Monitoring Section will adhere to the principles and procedures herein.
Table 2. National Ambient Air Quality Particulate Matter Standards
Pollutant Standard Value Standard Type Particulate Matter (PM2.5) Particulate matter with aerodynamic diameters of 2.5 micrometers or less Annual Arithmetic Mean 12 µg/m3 Primary 15 µg/m3 Secondary 24-hour Average 35 µg/m3 Primary and Secondary Particulate Matter (PM10) Particulate matter with aerodynamic diameters of 10 micrometers or less 24-hour Average 150 µg/m3 Primary and Secondary
QAPP for the DAQ PM Monitoring Program Revision 2 8/8/2019
Page 28 of 160
6.0 Project/Task Description
The chief with the help of the RCO chemists developed this PM QAPP to ensure that WNC and DAQ’s PM monitoring network collects ambient data that meet or exceed EPA QA requirements. The EPA and DAQ use the PM data collected by the DAQ Ambient Monitoring Section for regulatory decision-making purposes (i.e., determination of compliance with the NAAQS). The DAQ will submit the data to EPA via EPA’s national database, AQS. Other purposes of the data include determining trends over time, determining effects on air quality from adjustments to source emissions, verifying air quality modeling programs, and providing real-time monitoring data to the public.
In accordance with 40 CFR Part 58, Appendix D, Section 1.1, SLAMS monitoring networks must be designed to meet three basic monitoring objectives: provide air pollution data to the general public in a timely manner; support compliance with ambient air quality standards and emissions strategy development; and support for air pollution research studies. Section 10.1 of this QAPP provides additional objectives for the PM network. The chief and director designed the DAQ’s PM monitoring network to support these objectives. Additional specific goals of the DAQ’s PM monitoring program include:
- Determining the highest concentrations expected to occur in the area covered by the network; - Determining representative concentrations in areas with high population density and\or heavily
congested areas; - Determining the general background concentration levels; - Providing data to the State of North Carolina, WNC and EPA to assist these agencies in
determining regional transport of specific pollutants and in support of secondary standards and visibility impairment issues;
- Determining the extent of regional pollutant transport among populated areas and in support of secondary standards; and
- Determining the welfare-related impacts in rural and remote areas (such as visibility impairment and effects on vegetation).
DAQ will report data to AQS in accordance with the requirements stated in 40 CFR Section 58.16. The DAQ’s PM monitoring network will operate and collect samples in accordance with the schedules codified in 40 CFR Section 58.12. Monitors and samplers designated as federal reference method, or FRM, or federal equivalent method, or FEM, in accordance with Section 2.1 of 40 CFR Part 58, Appendix C, will collect the ambient PM monitoring concentration data. The DAQ will collocate monitors in accordance with 40 CFR Part 58, Appendix A requirements. In some instances, the DAQ obtains waivers from the EPA so the DAQ may collect PM data that the EPA does not use to compare to the NAAQS, but DAQ can use for such purposes as calculating the air quality index (AQI). The types of data collected by the PM monitoring network, overall, includes:
- Continuous (near real-time) 24-hour and hourly-averaged PM concentration data collected by FEMs, including PM2.5, PM10 (at standard and local conditions), and PM Coarse (see Section 11 of this QAPP);

QAPP for the DAQ PM Monitoring Program Revision 2 8/8/2019
Page 29 of 160
- 24-hour PM2.5 samples collected by FRMs in the field, and subsequently analyzed at the PM laboratory using the appropriate analytical method;
- Continuous (near real-time) hourly-averaged PM2.5 concentration data collected by non-FEMs in order to report data to the AQI;
- Meteorological data (average 24-hour temperature and pressure readings) from the FRM sampling runs;
- 5-minute average readings of temperature and relative humidity for the gravimetric lab: - Bias measurements; and, - Geographic measurements (e.g. locational, demographic, topographical).
The work required to collect, document, and report this data includes, but is not limited to, the following:
- Establishing a monitoring network that has: o Appropriate density, location, and sampling frequency; o Accurate and reliable monitors, data recording equipment, and software;
- Developing encompassing documentation for: o Data and report format, content, and schedules; o Quality objectives and criteria;
- Establishing standard operating procedures, or SOPs, which provide activities and schedules for: o Equipment operation and preventative maintenance; o Instrument calibrations, precision checks, and accuracy evaluations;
- Establishing assessment criteria and schedules; - Verifying and validating the data produced by network monitors in accordance with the criteria
and schedules established herein; and - Certifying data.
6.1 Field Activities
The DAQ Regional Monitoring Staff and WNC Monitoring Staff will perform those activities that support continued successful operation and expansion of the statewide PM monitoring network. The DAQ Regional Monitoring Staff will perform field activities that include, but are not necessarily limited to, the following:
- Conducting calibrations, verifications and audits on PM monitors; - Conducting periodic maintenance and servicing of PM monitoring equipment; - Performing routine site operations and servicing activities that include, but are not limited to:
o Verifying the sampler or monitor status and diagnostics to ensure PM data collection; o Recording pertinent field data and measurements in e-logs and on required DAQ forms; o Restocking consumables, such as filter tape and cleaning supplies;
- Locating suitable monitoring sites for relocation of existing monitoring equipment or the location of new PM monitoring stations, when needed; and,
- Collecting sequential PM samples, shipping them to the laboratory for subsequent analysis,

QAPP for the DAQ PM Monitoring Program Revision 2 8/8/2019
Page 30 of 160
while following correct COC procedures.
6.2 ECB Activities
The ECB electronics technicians will perform those activities necessary to support the successful operation of the PM monitoring network. They will perform electronic laboratory activities consistent with certifying, calibrating and testing all equipment before installing it in the field. In addition, ECB electronics technicians will perform any functions necessary to support the deployed field equipment. Section 4.2.3 Electronics and Calibration Branch provides a more complete description of the activities the ECB electronics technicians may perform.
6.3 Laboratory Activities
The DAQ PM Laboratory Staff will perform those activities that support continued successful operation of the statewide PM monitoring network. Additionally, where analysis of samples is required, the laboratory personnel shall perform those duties such that the data quality provided meets or exceeds EPA QA requirements. Laboratory personnel shall be responsible for preparing sequential filters for field use. This may include, but not be limited to:
- Scheduling, preparing, weighing, shipping and receiving, and archiving filters for PM sampling; - Preparing and analyzing control samples (e.g. trip blanks, field blanks and lab blanks); - Maintaining consumable inventories; - Maintaining COC and filter data sheet records; - Conducting microbalance daily weight checks, quarterly weight checks and semi-annual weight
checks; and - Maintaining rolling temperature and humidity data records for lab.
The RTI Laboratory serves as a backup laboratory. RTI will weigh filters for DAQ should an emergency arise such that the NCDAQ gravimetric laboratory is unable to operate for an extended period.
6.4 Project Assessment Techniques
An assessment is an evaluation process used to measure the performance or effectiveness of a system and its elements. As used here, “assessment” is an all-inclusive term used to denote any of the following: audit, performance evaluation, peer review, inspection, or surveillance. Section 20 discusses the details of assessments. Table 3 provides information on the parties implementing assessments and their frequency.
Table 3. Assessment Schedule
Assessment Type Assessment Agency Frequency
Network Review EPA Region 4 and DAQ
Annually
Network Assessment DAQ Every 5 Years

QAPP for the DAQ PM Monitoring Program Revision 2 8/8/2019
Page 31 of 160
Table 3. Assessment Schedule
Assessment Type Assessment Agency Frequency
QAPP Review DAQ Annually
Standard Operating Procedures Review
DAQ Annually
Data Quality Review DAQ Monthly
Quarterly Completeness DAQ Quarterly
Annual Data Certification DAQ Annually
Data Quality Assessment DAQ Quarterly
Instrument Performance Audits
DAQ Quarterly
Internal Systems Audits DAQ Every 3 years, minimum
Technical Systems Audit EPA Region 4 Every 3 years
PM2.5 Performance Evaluation Program
EPA designated contractor 8 valid audits per
year/each monitor audited every 6 years
6.5 Project Records
The DAQ Ambient Monitoring Section will establish and maintain procedures for the timely preparation, review, approval, issuance, use, control, revision and maintenance of documents and records. Table 4 presents the categories and types of records and documents applicable to document control for ambient air quality information. Section 9.0 Documentation and Records explains information on key documents in each category in more detail.
Table 4. Critical Documents and Records
Categories Record/Document Type
Site Information
Network Descriptions Site Files Site Maps Site Pictures
Environmental Data Operations Quality Assurance Project Plans Standard Operating Procedures Field Notebooks and e-logs

QAPP for the DAQ PM Monitoring Program Revision 2 8/8/2019
Page 32 of 160
Table 4. Critical Documents and Records
Categories Record/Document Type Chain of Custody Records Inspection/Maintenance Records
Raw Data
Original Continuous PM Data (Manual Downloads) Sequential PM Field Data Downloads Polled Continuous PM Data PM Laboratory Weigh and Environmental Data
Data Reporting
Annual Data Certification Package Air Quality Index Reports Annual AQS Reports Data/Summary Reports
Data Management Data Algorithms Data Management Plans/Flowcharts Data Management Systems
Quality Assurance
Network Reviews Data Quality Assessments Quality Assurance Reports Technical Systems Audits Response/Corrective Action Documentation Annual Site Evaluations Certification Documentation
6.6 Site Locations
At the time of this QAPP revision, Table 5 provides the location and information on the type of monitors located at each PM monitoring station maintained and operated by DAQ and WNC. Figure 2 through Figure 14 provide aerial views of each site.
Table 5. North Carolina PM Site Locations
Site Name City/County AQS ID Types of Monitors Operator
Board of Education
Asheville/ Buncombe
37-021-0034
Collocated PM2.5 FRM and BAM
1022 WNC
Hickory Water Tower
Hickory/ Catawba
37-025-0004
Collocated PM2.5 BAM 1022s
DAQ Mooresville
Regional Office
William Owen School
Fayetteville/ Cumberland
37-051-0009
Collocated PM2.5 FRMs, BAM 1022
and PM10 BAM 1020
DAQ Fayetteville
Regional Office
Lexington Water Tower
Lexington/ Davidson
37-057-0002
Collocated PM2.5 FRM and PM2.5
BAM 1020
DAQ Winston-Salem Regional
Office

QAPP for the DAQ PM Monitoring Program Revision 2 8/8/2019
Page 33 of 160
Table 5. North Carolina PM Site Locations
Site Name City/County AQS ID Types of Monitors Operator
Durham Armory Durham/Durham 37-063-0015
PM2.5 FRM, BAM 1020 coarse
DAQ Raleigh Regional Office
Leggett Tarboro/ Edgecombe
37-065-0099
BAM 1022 with sharp cut cyclone
DAQ Raleigh Regional Office
Mendenhall Greensboro/ Guilford
37-081-0013
BAM 1022 and PM10 BAM 1020
DAQ Winston-Salem Regional
Office
West Johnston Clayton/ Johnston
37-101-0002 BAM 1022 DAQ Raleigh
Regional Office
Millbrook Raleigh/ Wake
37-183-0014
PM2.5 FRM, BAM 1020 coarse, T640X
DAQ Raleigh Regional Office
Spruce Pine Spruce Pine/ Mitchell
37-121-0004 BAM 1022 DAQ Asheville
Regional Office
Triple Oak Raleigh/ Wake
37-183-0021 BAM 1022 DAQ Raleigh
Regional Office
Candor Candor/ Montgomery 37-123-0001 PM2.5 BAM 1020
DAQ Fayetteville
Regional Office
Castle Hayne Castle Hayne/ New Hanover 37-129-
0002 PM2.5 BAM 1020 DAQ
Wilmington Regional Office
Pitt County Ag Center
Greenville/ Pitt
37-147-0006
PM2.5 FRM, BAM 1022
DAQ Washington
Regional Office
Bryson City Bryson City/ Swain
37-173-0002 PM2.5 BAM 1020 DAQ Asheville
Regional Office

QAPP for the DAQ PM Monitoring Program Revision 2 8/8/2019
Page 34 of 160
Figure 2. Bryson City Site
Figure 3. Board of Education Site

QAPP for the DAQ PM Monitoring Program Revision 2 8/8/2019
Page 35 of 160
Figure 4. Spruce Pine Site
Figure 5. Hickory Water Tower Site

QAPP for the DAQ PM Monitoring Program Revision 2 8/8/2019
Page 36 of 160
Figure 6. Lexington Water Tower Site
Figure 7. Candor Site
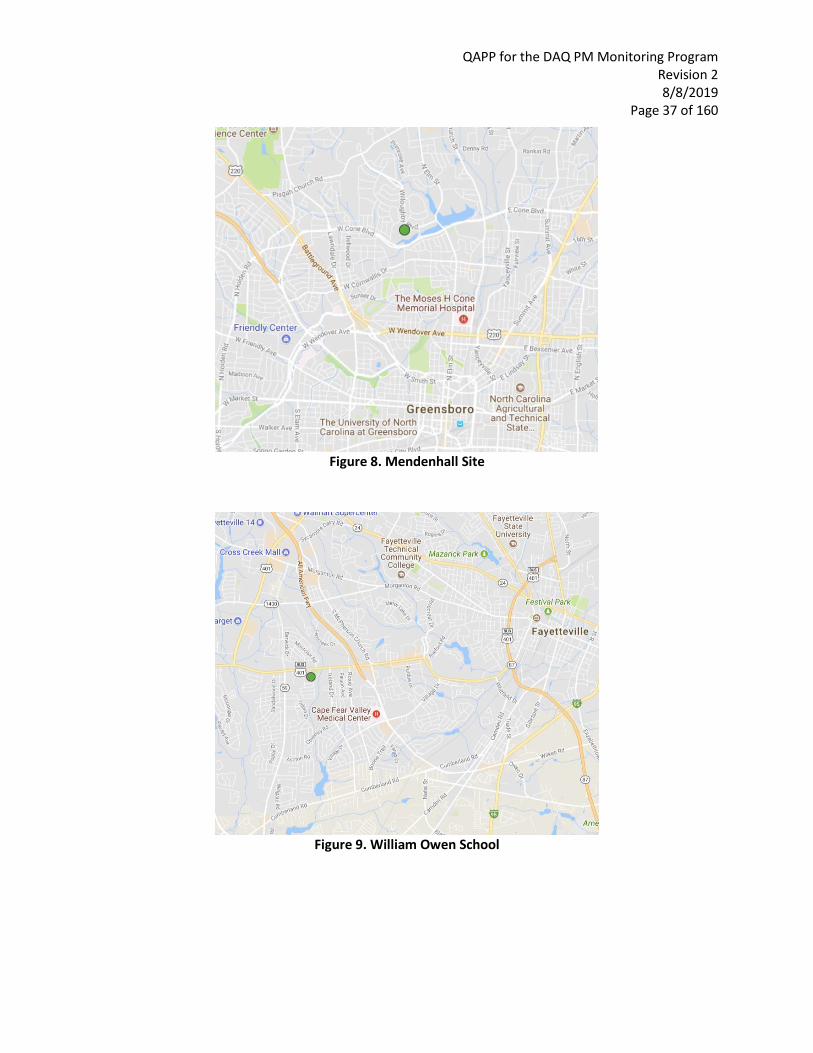
QAPP for the DAQ PM Monitoring Program Revision 2 8/8/2019
Page 37 of 160
Figure 8. Mendenhall Site
Figure 9. William Owen School

QAPP for the DAQ PM Monitoring Program Revision 2 8/8/2019
Page 38 of 160
Figure 10. Durham Armory, Triple Oak and Millbrook Sites
Figure 11. West Johnston Site

QAPP for the DAQ PM Monitoring Program Revision 2 8/8/2019
Page 39 of 160
Figure 12. Leggett Site
Figure 13. Pitt County Ag Site

QAPP for the DAQ PM Monitoring Program Revision 2 8/8/2019
Page 40 of 160
Figure 14. Castle Hayne Site

QAPP for the DAQ PM Monitoring Program Revision 2 8/8/2019
Page 41 of 160
7.0 Quality Objectives and Criteria for Measurement Data The DAQ and WNC operate under an EPA-approved QMP that describes the agencies’ system for communicating and implementing quality within the PQAO.
A quality system is a structured and documented set of management activities in which an organization applies sufficient QC practices to ensure the data produced by an operation will be of the type and quality needed and expected by the data user. Quality control defines the procedures implemented to assure that the agency obtains and maintains acceptability in the generated data set. Quality control procedures, when properly executed, provide data that meet or exceed the minimally acceptable quality criteria established to assist management in making confident decisions. The policies of the DAQ and WNC are to implement QA programs to assure that DAQ and WNC collect data of known and acceptable precision, bias, sensitivity, completeness, comparability and representativeness within their ambient air quality monitoring programs.
The EPA, DAQ and WNC use precision, bias, completeness, comparability, sensitivity and representativeness as the principle data-quality indicators (DQI) that provide qualitative and quantitative descriptions in interpreting the degree of acceptability of data. Section 7.5 Measurement Quality Objectives defines these DQIs. Establishing acceptance criteria for these DQIs sets quantitative goals for the quality of data generated in the measurement process. Of the six principal DQIs, precision, sensitivity and bias are the quantitative measures, representativeness and comparability are qualitative measures and completeness is a combination of both qualitative and quantitative measures. The DAQ establishes the specific requirements of these six DQIs before data collection starts. The goal is to locate and eliminate (or minimize) bias, so the data collected show the true conditions of the area being sampled. This includes consideration of siting criteria, spatial scales, monitoring objectives, climatic change, source configurations and the duration of the study.
All individuals must adhere to the written procedures and methodologies in the QAPP for operating air monitoring instruments and handling data to assure quality data for purposes of DAQ and WNC’s air quality designations concerning attainment of the NAAQS. EPA-approved FRMs are the designated methodologies and basis for operating pollutant-monitoring equipment, although agencies may use FEMs as well.
7.1 Data Quality Objectives
This section provides a description of the data quality objectives (DQO) for the PM monitoring program for DAQ and WNC. Data quality objectives are qualitative and quantitative statements that:
- Clarify the intended use of the data, - Define the type of data needed, and - Specify the tolerable limits on the probability of making an erroneous decision due to
uncertainty in the data.

QAPP for the DAQ PM Monitoring Program Revision 2 8/8/2019
Page 42 of 160
7.2 Intended Use of Data
The EPA, DAQ and WNC will use the data collected in this PM monitoring network to:
- Evaluate compliance with the NAAQS, - Establish an historical baseline concentration of natural and anthropogenic PM pollution; - Monitor the current dynamic concentrations of PM air pollutants; - Monitor progress made toward meeting ambient air quality standards for PM; - Activate emergency control procedures that prevent or alleviate PM pollution episodes; - Provide data upon which long term PM control strategies can be reliably developed; - Support daily AQI forecasting efforts, including the activation of burn bans when high PM
levels are observed (i.e., AQI color orange or higher), in accordance with NC law; - Observe pollution trends throughout the region; and - Provide a database for researching and evaluating effects.
7.3 Type of Data Needed
The DAQ determines the type of data needed by its intended use. Because the primary use of the DAQ and WNC PM monitoring program data is for comparison to the NAAQS, data must be collected in accordance with 40 CFR Parts 50, 53, and 58 requirements, and be of such quality that decision makers can make comparisons to the NAAQS with confidence and certainty. The monitoring data compiled by the DAQ PM monitoring program includes the following: PM 2.5, PM 10 and PM 10-2.5 (otherwise known as PM coarse). 40 CFR Section 58.16 specifies the data reporting requirements that the DAQ PM monitoring program will follow, and the appendices to 40 CFR Part 50 explain the data handling conventions and computations necessary for determining whether the NAAQS are met for PM.
The DAQ will collect PM data for comparison to the NAAQS using 24-hour PM concentration data from continuous FEM monitoring and 24-hour filter samples from FRM monitoring. For each of these methods, quarterly data capture will need to be ≥75 percent completeness, as shown in the following subsections. The collection of precision and bias data is also required. In addition to these requirements, the data needed for the DAQ PM monitoring program will meet the following principle quality objectives:
- All data should be traceable to a National Institute of Science and Technology (NIST) primary standard.
- All data shall be of a known and documented quality. As noted above, two key quantitative indicators for assessing data quality are precision and bias. This QAPP establishes the precision and bias requirements.
- All data shall be comparable. This means DAQ shall produce all data in a similar and scientific manner. The use of the standard methodologies for sampling, calibration, auditing, etc. found in the QAPP should achieve this goal.
- All data shall be representative of the parameters DAQ measures with respect to time, location and the conditions from which DAQ obtained the data. The use of the standard

QAPP for the DAQ PM Monitoring Program Revision 2 8/8/2019
Page 43 of 160
methodologies contained in the QAPP should ensure that the data generated are representative.
The QAPP and its associated SOPs must be dynamic to continue to achieve its stated goals as techniques, systems, concepts and technology change.
Title 40 CFR Part 50, Appendix K provides specific information on PM10 NAAQS calculations. The CFR appendix explains the computations necessary for analyzing PM10 data to determine attainment of the 24-hour standard specified in 40 CFR Section 50.6, using the reference method based on 40 CFR Part 50, Appendix J, or a designated equivalent method per 40 CFR Part 53. In accordance with Appendix K, an PM10 exceedance means a daily value that is above the level of the 24-hour standard after rounding to the nearest 10 micrograms per cubic meter, or μg/m3, (i.e., values ending in 5 or greater are to be rounded up).
The EPA based the information in Appendix K on high-volume sampling. In the DAQ network, the PM10 samplers are FEMs which collect low-volume, continuous (hourly) PM10 data. Therefore, DAQ will use the protocols of the low-volume PM2.5 method found in 40 CFR Part 50, Appendix N, for general guidance, which follows.
- Keep each hourly data point with at least one decimal place in units of μg/m3. - Calculate a 24-hour period in a day from midnight to midnight for the daily average. - The EPA shall consider a 24-hour average concentration valid if at least 75 percent of the hourly
averages (i.e., 18 hourly values) for the 24-hour period are available. - The EPA shall also consider twenty-four-hour periods with seven or more missing hours valid if,
after substituting zero for all missing hourly concentrations, the resulting 24-hour average daily value is greater than the level of the 24-hour PM2.5 NAAQS.
- Twenty-four-hour average PM2.5 mass concentrations that are averaged in AQS from hourly values will be truncated to one decimal place, consistent with the data handling procedure for the reported hourly (and also 24-hour filter-based) data.
- For 24-hour filter-based samples, the sampler must have operated for 23-25 hours or the day will not be valid (unless a sample with less than 23 hours run time has a concentration that exceeds the NAAQS).
- The EPA refers to the 3-year average of PM2.5 annual mean mass concentrations for each eligible monitoring site as the “annual PM2.5 NAAQS DV” and compares it to the annual standard.
- The 3-year average of annual 98th percentile 24-hour average PM2.5 mass concentration values recorded at each eligible monitoring site is referred to as the “24-hour (or daily) PM2.5 NAAQS DV” and compared to the daily standard.
Title 40 CFR Part 50, Appendix N provides specific information on PM2.5 NAAQS calculations.
7.4 Tolerable Error Limits
The Data Quality Objective (DQO) process defines tolerable limits on the probability of making a decision error due to uncertainty in the data. That is, limits on the probability of measuring a false positive or

QAPP for the DAQ PM Monitoring Program Revision 2 8/8/2019
Page 44 of 160
false negative error. Concerning air quality data, a false positive error occurs when data indicates a NAAQS violation when in fact, due to random deviations in the data, a violation has not occurred. Alternatively, a false negative error occurs when data indicate that no NAAQS violation has occurred when in fact, due to random deviations in the data, a violation has occurred.
Utilizing the formal DQO process, EPA established the tolerable error limits for ambient air monitoring precision and bias data in order to reduce the probability of decision errors. Title 40 CFR Part 58 Appendix A, Section 2.3.1 sets the DQOs for the PM measured within the WNC and NC network and defines the goal for acceptable measurement uncertainty for precision as an upper 90 percent confidence limit for the coefficient of variation, or CV, of 10 percent and ±10 percent for total bias. The EPA has not completed a formal DQO process for PM10; however, the EPA has provided DQOs for these parameters in the QA Handbook. The PM monitoring program has established the acceptable precision, as measured by coefficient of variation, or CV, and acceptable bias for each pollutant as listed in Table 6. The DAQ has chosen to adopt the DQOs provided by the EPA.
Table 6. Acceptable Precision as Measured by Coefficient of Variation (CV) and Bias
Pollutant Acceptable Precision Acceptable Bias
PM2.5 upper 90 percent confidence limit for the CV of ≤10 percent
Within ±10 percent
PM10‐2.5 upper 90 percent confidence limit for the CV of ≤10 percent
upper 95 percent confidence limit for the absolute bias of ≤10 percent
PM10 upper 90 percent confidence limit for the CV of ≤10 percent
Within ±10 percent
7.5 Measurement Quality Objectives
The DQO process functions to identify the allowable measurement uncertainty for a given objective. Once DAQ establishes a DQO, DAQ must evaluate and control the quality of the data to ensure that DAQ maintains the DQO within the established acceptance criteria. The EPA designed the MQOs to evaluate and control various phases (sampling, preparation, analysis) of the measurement process to ensure that total measurement uncertainty is within the range prescribed by the DQOs. The EPA derived the MQOs from the DQOs, and established them to evaluate overall measurement uncertainty, as well as uncertainty for individual phases of the measurement process. The EPA defines the MQOs for the DAQ PM monitoring program in terms of the following DQIs: precision, bias, comparability, sensitivity, representativeness, and completeness.
Precision ‐ “Precision is a measure of agreement between two replicate measurements of the same property, under prescribed similar conditions. This agreement is calculated as either the range or as the standard deviation” (US EPA QA/G‐5, Appendix B). This is the random component of error. For the DAQ, standard deviation and percent difference serve as methods of determining precision.

QAPP for the DAQ PM Monitoring Program Revision 2 8/8/2019
Page 45 of 160
• Bias - “Bias is the systematic or persistent distortion of a measurement process that causes errors in one direction” (US EPA QA/G-5, Appendix B). Bias is determined by estimating the positive and negative deviation from the true value as a percentage of the true value.
• Comparability - “Comparability is the qualitative term that expresses the confidence that two data sets can contribute to a common analysis and interpolation. Comparability must be carefully evaluated to establish whether two data sets can be considered equivalent in regard to the measurement of a specific variable or groups of variables.” (US EPA QA/G-5, Appendix B)
• Sensitivity – “The capability of a method or instrument to discriminate between measurement responses representing different levels of the variable of interest” (US EPA QA/G-5, Appendix B). The minimum concentration or attribute that can be measured by a method (method detection limit), by an instrument (instrument detection limit), or by a laboratory (quantitation limit).
• Representativeness - “Representativeness is a measure of the degree to which data accurately and precisely represent a characteristic of a population parameter at a sampling point or for a process condition or environmental condition. Representativeness is a qualitative term that should be evaluated to determine whether in situ or other measurements are made and physical samples collected in such a manner that the resulting data appropriately reflect the media and phenomenon measured or studied.” (US EPA QA/G-5, Appendix B).
• Completeness - Completeness is a metric quantifying the amount of valid data obtained from a measurement system compared to the amount that were expected to be obtained under correct, normal conditions. The DAQ expresses completeness as a percentage. Data completeness requirements are included in 40 CFR Part 50, Appendix N and K.
The EPA developed acceptance criteria for these DQIs using various parts of 40 CFR Parts 50, 53, and 58 and EPA guidance documents. Specifically, the EPA has compiled the MQOs for the criteria pollutants into “validation templates” found in the EPA Quality Assurance Handbook for Air Pollution Measurements Systems, Volume II (i.e., QA Handbook). The DAQ has reproduced the validation templates here in Table 7 through Table 12. The DAQ PM monitoring program adopts these tables and establishes them as the MQOs for the PM monitoring program. DAQ has made modifications to some operational criteria in the tables, where permissible, to reflect more accurately the procedures followed by the DAQ PM monitoring program or to clarify intent.
As described in the QA Handbook and implemented here, the tables that follow list three validation criteria for each criteria pollutant: critical, operational, and systematic. The tables discriminate between:
• Criteria that DAQ must meet to ensure the quality of the data (i.e., critical criteria), • Criteria that indicate issues may exist with the quality of the data and further investigation is
warranted before making a determination about the validity of the sample or samples (i.e., operational criteria), and

QAPP for the DAQ PM Monitoring Program Revision 2 8/8/2019
Page 46 of 160
• Criteria indicating a potentially systematic problem with the environmental data collection activity that may affect the ability to make decisions with the data (i.e., systematic criteria).
For each criterion, the tables include: (1) the requirement, (2) the frequency with which compliance is to be evaluated, (3) the acceptance criteria, and (4) information where the requirement can be found or additional guidance on the requirement.
The DAQ defines control limits as the level of allowable imprecision before data is invalidated. The DAQ cannot set control limits higher than the MQOs. The DAQ uses these limits when validating ambient air measurements. The use of control limits strengthens the precision of these measurements and improves the data validation practices to meet regulatory requirements.
The DAQ has adopted and implemented EPA Region 4’s LSASD recommended warning limits for PM monitoring. The DAQ defines warning limits as the level of allowable imprecision before Regional Monitoring Staff must calibrate an analyzer or take other corrective action. The DAQ set the warning limits lower than the control limits to reduce imprecision and bias and enhance data completeness (note: warning limits have not been developed for all methodologies at the time of this QAPP revision).
Other elements, as well as the SOPs associated with this QAPP that are specific to each monitor type, provide more detailed descriptions of these MQOs and how they will be used to control and assess measurement uncertainty.
7.6 Network Scale
The EPA defines representativeness as a measure of the degree to which data accurately and precisely represent a selected characteristic of a monitored system. The DAQ achieves representativeness through adhering to the requirements provided in:
- 40 CFR Part 58, Appendix D (Network Design Criteria for Ambient Air Quality Monitoring); and
- 40 CFR Part 58, Appendix E (Probe and Monitoring Path Siting Criteria for Ambient Air Quality Monitoring).
The chief with the assistance of the regional monitoring coordinators and PPB supervisor assigns each monitor operated a scale of representativeness based on the definitions in 40 CFR Part 58, Appendix D.
- Micro Scale - describes air volumes associated with area dimensions ranging from several meters up to about 100 meters (m).
- Middle Scale - describes air volumes associated with area dimensions up to several city blocks in size with dimensions ranging from about 100 m to 500 m (0.5 kilometer [km]).
- Neighborhood Scale - describes air volumes associated with an area of a city that has relatively uniform land use with dimensions in the 500 to 4,000 m (0.5 to 4.0 km) range.
- Urban Scale - describes air volumes within cities with dimensions about 4,000 m to 50,000 m (4.0 km to 50 km). This scale would usually require more than one site for definition.
QAPP for the DAQ PM Monitoring Program Revision 2 8/8/2019
Page 47 of 160
- Regional Scale - describes air volumes associated with rural areas of reasonably homogeneous geography that extends for tens to hundreds of kilometers.
Of these, the majority of the representative scales used in the DAQ PM monitoring program are either neighborhood or urban, with sporadic use of the micro scale for special studies such as near road PM monitoring and regional scale for general background or transport monitors.

QAPP for the DAQ PM Monitoring Program Revision 2 8/8/2019
Page 48 of 160
Table 7. Measurement Quality Objectives: PM2.5 (Gravimetric, Filter Based, Local Conditions) 1) Criteria (PM2.5 LC) 2) Frequency 3) Acceptable Range Information /Action
CRITICAL CRITERIA - PM2.5 Filter Based, Local Conditions Field Activities
Filter Holding Times Pre-sampling all filters < 30 days before sampling 1,2 and 3) 40 CFR Part 50, Appendix L, Section 8.3.5
Sample Recovery all filters ≤7 days 9 hours from sample end date
1, 2 and 3) 40 CFR Part 50, Appendix L, Section 10.10
Sampling Period (including multiple power failures) all filters
1380-1500 minutes, or value if < 1380 and exceedance of
NAAQS*, midnight to midnight local standard time
1, 2 and 3) 40 CFR Part 50, Appendix L, Section 3.3 and 40 CFR Part 50, Appendix N, Section 1.0 *See CFR details if less than 1380 minutes sampled
Sampling Instrument
Sampler/ Monitor not applicable Meets requirements listed in FRM/FEM designation
1) 40 CFR Part 58 Appendix C, Section 2.1 2) Not applicable 3) 40 CFR Part 53 and FRM/FEM method list
Average Flow Rate every 24 hours of operation
average within 5 percent of 16.67 LPM 1, 2 and 3) 40 CFR Part 50, Appendix L, Section 7.4.3.1
Variability in Flow Rate every 24 hours of operation CV ≤ 2 percent 1, 2 and 3) 40 CFR Part 50, Appendix L, Section 7.4.3.2
One-point Flow Rate Verification
Every 30 days each separated by 14 days (DAQ goal
is 2/month separated by 14 to
18 days)
<± 4.1 percent of transfer standard <± 5.1 percent of flow rate design
value (DAQ warning limit <±3 percent of
transfer standard and <±4 percent of flow design value)
1) 40 CFR Part 50, Appendix L, Section 9.2.5 and 7.4.3.1 and 40 CFR Part 58, Appendix A Section 3.2.1 2 and 3) 40 CFR Part 50, Appendix L, Section 9.2.5 and 7.4.3.1, 40 CFR Part 58, Appendix A Section 3.2.1 and DAQ 2025i SOP Section 7.0
Design Flow rate Adjustment
after multi-point verification or
calibration <± 2.1 percent of design flow rate 1, 2 and 3) 40 CFR Part 50, Appendix L, Section 9.2.6
Individual Flow Rates every 24 hours of operation
no flow rate excursions > ± 5 percent for > 5 minutes 1, 2 and 3) 40 CFR Part 50, Appendix L, Section 7.4.3.1

QAPP for the DAQ PM Monitoring Program Revision 2 8/8/2019
Page 49 of 160
Table 7. Measurement Quality Objectives: PM2.5 (Gravimetric, Filter Based, Local Conditions) 1) Criteria (PM2.5 LC) 2) Frequency 3) Acceptable Range Information /Action
Filter temp Sensor every 24 hours of operation
no excursions of > 5o C lasting longer than 30 minutes 1, 2 and 3) 40 CFR Part 50, Appendix L, Section 7.4.11.4
External Leak Check
before each flow rate verification or calibration, before
and after PM2.5 separator
maintenance
<80.1 mL/min (DAQ goal is < 25mmHg/minute)
1) 40 CFR Part 50, Appendix L, Section 7.4.6.1 2) 40 CFR Part 50, Appendix L, Section 9.2.3 and Method 2.12 ,
Section 7.4.3 3) 40 CFR Part 50, Appendix L, Section 7.4.6.1, DAQ QAPP, PM 2.5,
2.24 Fine Particles, Section 2, Operator Responsibilities for DAQ limits
Internal Leak Check If failure of
external leak check
<80.1 mL/min < 140 mmHg/minute
1) 40 CFR Part 50, Appendix L, Section 7.4.6.2 2) Method 2.12, Section 7.4.4 3) 40 CFR Part 50, Appendix L, Section 7.4.6.2, DAQ QAPP, PM 2.5,
2.24 Fine Particles, Section 2, Operator Responsibilities for DAQ limits
Laboratory Activities Filter Visual Defect Check (unexposed) all filters Correct type and size and for
pinholes, particles or imperfections 1, 2 and 3) 40 CFR Part 50, Appendix L, Section 10.2
Determine Deadline for Post-Sampling Weighing all filters
Protected from temperatures above 25°C from sample retrieval to
conditioning. ≤10 days from sample end date if shipped at ambient
temperature, or ≤30 days if shipped < average ambient (or 4°C or below for average sampling temperature < 4° C)
from sample end date. >25°C receiving temperature = void
1, 2 and 3) 40 CFR Part 50, Appendix L, Section 8.3.6 and 10.13. See technical note on holding time requirements at: https://www3.epa.gov/ttn/amtic/pmpolgud.html Check the DAQ QAPP, PM 2.5, 2.24 Fine Particles, Section 3, Laboratory Responsibilities for laboratory activities
Filter Conditioning Environment Equilibration all filters 24-hour minimum 1, 2 and 3) 40 CFR Part 50, Appendix L, Section 8.2.5
Temperature Range all filters 24-hour mean 20.0-23.0° C (DAQ goal is 21.0 to 23.0 ° C)
1 and 2) 40 CFR Part 50, Appendix L, Section 8.2.1 3) 40 CFR Part 50, Appendix L, Section 8.2.1 and DAQ SOP 2.24.3
Fine Particles, Laboratory Responsibilities

QAPP for the DAQ PM Monitoring Program Revision 2 8/8/2019
Page 50 of 160
Table 7. Measurement Quality Objectives: PM2.5 (Gravimetric, Filter Based, Local Conditions) 1) Criteria (PM2.5 LC) 2) Frequency 3) Acceptable Range Information /Action
Temp. Control all filters < 2.1° C SD** over 24 hours 1, 2 and 3) 40 CFR Part 50, Appendix L, Section 8.2.2
Humidity Range all filters
24-hour mean 30.0 – 40.0 percent RH or ≤ 5.0 percent sampling RH but >
20.0 percent RH (DAQ’s RH range goal is 35-40
percent)
1, 2 and 3) 40 CFR Part 50, Appendix L, Section 8.2.3 3) 40 CFR Part 50, Appendix L, Section 8.2.3 and DAQ SOP 2.24.3
Fine Particles, Laboratory Responsibilities
Humidity Control all filters ± 5.0 percent SD** over 24 hours. 1, 2 and 3) 40 CFR Part 50, Appendix L, Section 8.2.4 SD use is a recommendation
Pre/post Sampling RH all filters difference in 24-hour means < ± 5.1 percent RH 1, 2 and 3) 40 CFR Part 50, Appendix L, Section 8.3.3
Balance all filters located in filter conditioning environment 1, 2 and 3) 40 CFR Part 50, Appendix L, Section 8.3.2
Microbalance Auto-Calibration
Prior to each weighing session Manufacturer’s specification
1) 40 CFR Part 50, Appendix L, Section 8.1 2) 40 CFR Part 50, Appendix L, Section 8.1 and Method 2.12
Section 10.6 3) NA
OPERATIONAL EVALUATIONS TABLE - PM2.5 Filter Based, Local Conditions Field Activities
One-Point Temperature Verification 1/30 days ± 2.1°C
1) 40 CFR Part 50, Appendix L, Section 9.3 2) Method 2.12, 7.4.5 3) Recommendation
Pressure Verification 1/30 days ± 10.1 millimeters mercury 1) 40 CFR Part 50, Appendix L, Section 9.3 2) Method 2.12, 7.4.6 3) Recommendation
Annual Multi-Point Calibrations
Temperature multi-point Verification/Calibration
on installation, then every 365 days and once a
calendar year
± 2.1°C 1) 40 CFR Part 50, Appendix L, Section 9.3 2 and 3) Method 2.12, section 6.4.4

QAPP for the DAQ PM Monitoring Program Revision 2 8/8/2019
Page 51 of 160
Table 7. Measurement Quality Objectives: PM2.5 (Gravimetric, Filter Based, Local Conditions) 1) Criteria (PM2.5 LC) 2) Frequency 3) Acceptable Range Information /Action
Pressure Verification/Calibration
on installation, and on one-point verification failure
< + 10.1 millimeters mercury
1) 40 CFR Part 50, Appendix L, Section 9.3 2 and 3) Method 2.12 Section 6.5 Sampler barometric pressure verified against an independent standard verified against a laboratory primary standard that is certified as NIST-traceable 1/365 days
Flow Rate Multi-Point Verification or Calibration
Electro-mechanical
maintenance or transport or every 365 days and once
a calendar year
< + 2.1 percent of transfer standard
1) 40 CFR Part 50, Appendix L, Section 9.2. 2) 40 CFR Part 50, Appendix L, Section 9.1.3, Method 2.12 Section
6. 3) Recommendation
Other Monitor Calibrations
per manufacturers’ op
manual per manufacturers’ operating manual 1, 2 and 3) Recommendation
Precision
Collocated Samples
every 12 days for 15 percent of sites
by method designation
CV < 10.1 percent of samples > 3.0 μg/m3
1) and 2) 40 CFR Part 58, Appendix A, Section 3.2.3 3) Recommendation based on DQO in 40 CFR Part 58, Appendix A,
Section 2.3.1.1
Accuracy
Temperature Audit 1/180 days ± 2°C 1, 2 and 3) Method 2.12, Section 11.2.2 and Table 11-1 Pressure Audit 1/180 days ±10 millimeters mercury 1, 2 and 3) Method 2.12, Section 11.2.3 and Table 11-1
Semi-Annual Flow Rate Audit
Twice a calendar year and between 5-7 months apart
(DAQ’s goal is 1/90 days)
± 4.1 percent of audit standard (DAQ’s warning limit is ≤±3 percent)
± 5.1 percent of design flow rate (DAQ’s warning limit is ≤±4 percent)
1) 40 CFR Part 58, Appendix A, Section 3.3.3 2) 40 CFR Part 58, Appendix A, Section 3.3.3 and DAQ 2025i SOP Section 7.0 3) Method 2.12 Section 11.2.1 and Table 11-1 and DAQ 2025i SOP Section 7.0

QAPP for the DAQ PM Monitoring Program Revision 2 8/8/2019
Page 52 of 160
Table 7. Measurement Quality Objectives: PM2.5 (Gravimetric, Filter Based, Local Conditions) 1) Criteria (PM2.5 LC) 2) Frequency 3) Acceptable Range Information /Action
Monitor Maintenance Very Sharp Cut Cyclone every 30 days cleaned/changed 1,2 and 3) Method 2.12, Section 8.3.3 Inlet Cleaning 1/30 days cleaned 1,2 and 3) Method 2.12, Section 8.3 Downtube Cleaning 1/90 days cleaned 1,2 and 3) Method 2.12, Section 8.4 Filter Housing Assembly Cleaning
1/30 days cleaned 1, 2 and 3) Method 2.12, Section 8.3
Fan Filter Cleaning 1/90 days cleaned/changed 1, 2 and 3) Method 2.12, Section 8.3 Manufacturer-Recommended Maintenance
per manufacturers’
SOP per manufacturers’ SOP
Laboratory Activities Filter Checks
Lot Blanks 9 filters per lot < ±15.1 μg change between each weighing
1, 2, 3) Recommendation and used to determine filter stability of the lot of filters received from EPA or vendor. Method 2.12 Section 10.5
Exposure Lot Blanks 3 filters per lot < ±15.1 μg change between each weighing
1, 2 and 3) Method 2.12 Section 10.5 Used for preparing a subset of filters for equilibration
Filter Integrity (exposed) each filter no visual defects 1, 2 and 3) Method 2.12 Section 10.7 and 10.3 Lab QC Checks
Field Filter Blank 10 percent or 1
per weighing session
<± 30.1 μg change between each weighing
1) 40 CFR Part 50, Appendix L, Section 8.3.7.12 and 3) Method 2.12 Section 10.5
Lab Filter Blank 10 percent or 1
per weighing session
<± 15.1 μg change between each weighing
1) 40 CFR Part 50, Appendix L, Section 8.3.7.22 and 3) Method 2.12 Section 10.5
Balance Check (working standards)
beginning, 10th sample, end < ± 3.1 μg from certified value
1, 2 and 3) Method 2.12 Section 10.6 Standards used should meet specifications in Method 2.12, Section 4.3.7

QAPP for the DAQ PM Monitoring Program Revision 2 8/8/2019
Page 53 of 160
Table 7. Measurement Quality Objectives: PM2.5 (Gravimetric, Filter Based, Local Conditions) 1) Criteria (PM2.5 LC) 2) Frequency 3) Acceptable Range Information /Action
Routine Filter re-weighing 1 per weighing session
<± 15.1 μg change between each weighing 1, 2 and 3) Method 2.12 Section 10.8
Microbalance Audit every 365 days
and once a calendar year
<± 0.003 mg or manufacturers specs, whichever is tighter 1, 2 and 3) Method 2.12 Section 11.2.7
Lab Temp Check 1/90 days < ± 2.1oC 1, 2 and 3) Method 2.12 Section 4.3.8 and 9.4 Lab Humidity Check 1/90 days < ± 2.1 percent 1, 2 and 3) Method 2.12 Section 4.3.8 and 9.4 Verification/Calibration
Microbalance Calibration
At installation every 365 days
and once a calendar year
Manufacturer’s specification
1) 40 CFR Part 50, Appendix L, Section 8.1 2) 40 CFR Part 50, Appendix L, Section 8.1 and Method 2.12,
Section 10.11 3) Not applicable
Lab Temperature Certification
every 365 days and once a year < ± 2.1oC 1, 2 and 3) Method 2.12 Section 4.3.8 and 9.4
Lab Humidity Certification every 365 days and once a year < ± 2.1oC 1, 2 and 3) Method 2.12 Section 4.3.8 and 9.4
Calibration & Check Standards Working Mass Standards Verification Compared to Primary Standards
1/90 days < ±2.1 µg 1, 2 and 3) Method 2.12, Section 9.7
Primary standards certification
every 365 days and once a
calendar year 0.025 mg tolerance (Class 2) 1, 2 and 3) Method 2.12, Section 4.3.7
SYSTEMATIC CRITERIA - PM2.5 Filter Based, Local Conditions
Siting 1/365 days and 1/calendar year
Meets siting criteria or waiver documented
1) 40 CFR Part 58 Appendix E, sections 2-6 2) Recommendation (See DAQ Annual Network Review SOP) 3) 40 CFR Part 58 Appendix E, sections 2-6
Data Completeness Annual Standard ≥ 75 percent scheduled sampling days in each quarter 1, 2 and 3) 40 CFR Part 50, Appendix N, Section 4.1 (b) 4.2 (a)

QAPP for the DAQ PM Monitoring Program Revision 2 8/8/2019
Page 54 of 160
Table 7. Measurement Quality Objectives: PM2.5 (Gravimetric, Filter Based, Local Conditions) 1) Criteria (PM2.5 LC) 2) Frequency 3) Acceptable Range Information /Action
24- Hour Standard ≥ 75 percent scheduled sampling days in each quarter 1, 2 and 3) 40 CFR Part 50, Appendix N, Section 4.1 (b) 4.2 (a)
Reporting Units all filters µg/m3 at ambient temperature and pressure 1. 2 and 3) 40 CFR Part 50, Appendix N, Section 3.0 (b)
Rounding convention for design value calculation all filters to one decimal place, with additional
digits being truncated
1. 2 and 3) 40 CFR Part 50, Appendix N, Section 3.0 (b) The rounding convention is for averaging values for comparison to the NAAQS and not for reporting individual values.
Annual 3-yr average all concentrations nearest 0.1 µg/m3 (≥ 0.05 round up) 1,2 and 3) 40 CFR Part 50, Appendix N, Section 3 and 4 Rounding convention for data reported to AQS is a recommendation
24-hour, 3-year average all concentrations nearest 1 µg/m3 (≥ 0.5 round up) 1,2 and 3) 40 CFR Part 50, Appendix N, Section 3 and 4 Rounding rule for AQS data is a recommendation
Detection Limit Lower Detection Limit all filters ≤ 2 µg/m3 1,2 and 3) 40 CFR Part 50, Appendix L, Section 3.1 Upper Concentration Limit all filters ≥ 200 µg/m3 1,2 and 3) 40 CFR Part 50, Appendix L, Section 3.2 Precision Single analyzer (collocated monitors) 1/90 days.
CV*** < 10.1 percent for values > 3.0 µg/m3
1, 2 and 3) Recommendation to provide early (quarterly) evaluation of achievement of DQOs.
Primary Quality Assurance Organization
Annual and 3 year estimates
90 percent confidence limit of CV*** < 10.1 percent for values > 3.0 µg/m3 1, 2 and 3) 40 CFR Part 58, Appendix A, Section 4.3.1 and 2.3.1.1.
Bias
Performance Evaluation Program (PEP)
5 audits for PQAOs with < 5 sites
8 valid audits for PQAOs with > 5 sites and each PQAO primary
monitor audited every 6 years
< ± 10.1 percent for values > 3.0 μg/m3
1,2 and 3) 40 CFR Part 58, Appendix A, Section 3.2.4, 4.2.5 and 2.3.1.1

QAPP for the DAQ PM Monitoring Program Revision 2 8/8/2019
Page 55 of 160
Table 7. Measurement Quality Objectives: PM2.5 (Gravimetric, Filter Based, Local Conditions) 1) Criteria (PM2.5 LC) 2) Frequency 3) Acceptable Range Information /Action
Field Activities
Verification/Calibration Standards Recertification – All standards should have multi-point certifications against NIST-Traceable standards
Flow Rate Transfer Standard
1/365 days and 1/calendar year
<± 2.1 percent of NIST-Traceable Standard
1) 40 CFR Part 50, Appendix L, Section 9.1 and 9.2 2) Method 2-12 Section 6.3.3 3) 40 CFR Part 50, Appendix L, Section 9.1 and 9.2
Field Thermometer 1/365 days and 1/calendar year ± 0.1° C resolution, ± 0.5° C accuracy 1, 2 and 3) Method 2.12, Section 4.2.2 and Table 4-1
Field Barometer 1/365 days and 1/calendar year
± 1 millimeter mercury resolution, ± 5 millimeters mercury accuracy 1, 2 and 3) Method 2.12, Section 4.2.2 and Table 4-1
Field Manometer 1/365 days and 1/calendar year
± 0.1 inches water resolution, ± 1.0 inch water accuracy 1, 2 and 3) Method 2.12, Section 4.2.2 and Table 4-1
Clock/timer Verification 1/30 days ± 1 minute/month 1and 2) Method 2.12, Table 8-1 3) 40 CFR Part 50, Appendix L, Section 7.4.12
Laboratory Activities Microbalance Readability at purchase ± 1 microgram 1, 2 and 3) 40 CFR Part 50, Appendix L, Section 8.1
Microbalance Repeatability at purchase 1 microgram
1) Method 2.12, Section 4.3.6 2) Recommendation 3) Method 2.12, Section 4.3.6
Primary Mass/Working Mass Verification and Calibration Standards
At purchase 0.025 mg (Tolerance for the weight, Class 2 or better) 1, 2 and 3) Method 2.12, Section 4.3.7 and Table 4-2
Comment: The associated leak test procedure shall require that for successful passage of this test, the difference between the two pressure measurements shall not be greater than the number of mm of Hg specified for the sampler by the manufacturer, based on the actual internal volume of the sampler, that indicates a leak of less than 80 mL/min. *DAQ must flag the value. **SD= Standard Deviation. CV= Coefficient of Variation

QAPP for the DAQ PM Monitoring Program Revision 2 8/8/2019
Page 56 of 160
Table 8. Measurement Quality Objectives: PM2.5, PM10, PM10-2.5 (Continuous Met One BAM 1020, Local Conditions)
1) Criteria (PM 1020 LC) 2) Frequency 3) Acceptable Range Information /Action CRITICAL CRITERIA - PM2.5, PM10, PM10-2.5 Continuous, BAM 1020, Local Conditions
Sampler/Monitor Not applicable
meets requirements listed in FRM/FEM designation
Confirm method designation on front panel or just inside
instrument
1) 40 CFR Part 58, Appendix C, Section 2.1 2) Not applicable 3) 40 CFR Part 53 and FRM/FEM method list
Firmware of monitor At setup
1. Must be the firmware (or later version) as identified in the published method designation summary. 2. Firmware settings must be set for flowrate to operate and report at “local conditions” (i.e., not STP).
40 CFR Part 50, Appendix N, section 1 (c)
Data Reporting Period Report every hour
1. The calculation of an hour of data is dependent on the design of the method. 2. A 24-hour period is calculated in AQS if 18 or more valid hours are reported for a day
See operator’s manual. Hourly data are always reported as the start of the hour on local standard time 40 CFR Part 50 App N. Sec 3 (c)
Sampling Instrument
PM10 Inlet At setup
Must be a Louvered PM10 size selective inlet as specified in 40 CFR Part 50, appendix L, Figures L-2 through L-19
1, 2 and 3) 40 CFR Part 50, Appendix L, Figures L-2 through L-19
PM2.5 second stage separator At setup
Must be a BGI Incorporated Very Sharp Cut Cyclone (VSCCTM) or Tisch TE-PM2.5C particle size separator.
1, 2 and 3) FRM/FEM method list

QAPP for the DAQ PM Monitoring Program Revision 2 8/8/2019
Page 57 of 160
Table 8. Measurement Quality Objectives: PM2.5, PM10, PM10-2.5 (Continuous Met One BAM 1020, Local Conditions)
1) Criteria (PM 1020 LC) 2) Frequency 3) Acceptable Range Information /Action
Average Flow Rate every 24 hours of
operation, each hour can be checked
average within ± 5 percent of 16.67 LPM at local conditions 1, 2 and 3) 40 CFR Part 50, Appendix L, Section 7.4.3.1
Variability in Flow Rate every 24 hours of operation CV* ≤ 2 percent 1, 2 and 3) 40 CFR Part 50, Appendix L, Section 7.4.3.2
One-point Flow Rate Verification
1/30 days, separated by 14 days (DAQ’s goal is 2/month separated by
14 to 18 days)
< ± 4.1 percent of transfer standard; < ± 5.1 < percent of flow rate design value (DAQ’s warning limit for percent of transfer standard and flow
design value is 3 and 4 percent respectively)
1) 40 CFR Part 50, Appendix L, Section 9.2.5 and 7.4.3.1 and 40 CFR Part 58, Appendix A, Section 3.2.1 and 3.3.1
2 and 3) 40 CFR Part 50, Appendix L, Section 9.2.5 and 7.4.3.1, 40 CFR Part 58, Appendix A, Section 3.2.1 and 3.3.1, and DAQ BAM SOP, Section 7.0
Design Flow Rate Adjustment
After multi-point calibration or verification
< ± 2.1 percent of design flow rate 1,2 and 3) 40 CFR Part 50, Appendix L, Section 9.2.6
External Leak Check
Before each flow rate verification or calibration and before and after PM2.5 separator maintenance
< 1.0 LPM
1) 40 CFR Part 50, Appendix L, Section 7.4.6.1 2) 40 CFR Part 50, Appendix L, Section 9.2.3 and Method 2-12
Section 7.4.3 3) 40 CFR Part 50, Appendix, L, Section 7.4.6.1
Internal Leak Check If failure of external leak check < 1.0 LPM
1) 40 CFR Part 50, Appendix L, Section 7.4.6.2 2) Method 2-12 Section 7.4.4 3) 40 CFR Part 50, Appendix L, Section 7.4.6.2
OPERATIONAL CRITERIA - PM2.5, PM10, PM10-2.5 Continuous, BAM 1020, Local Conditions Annual Multi-point Verifications/Calibrations
Leak Check Every 30 days < 1.0 LPM 1) 40 CFR Part 50, Appendix L, Section 7.4.6.1 2) Recommendation 3) DAQ BAM SOP Section 4.1.
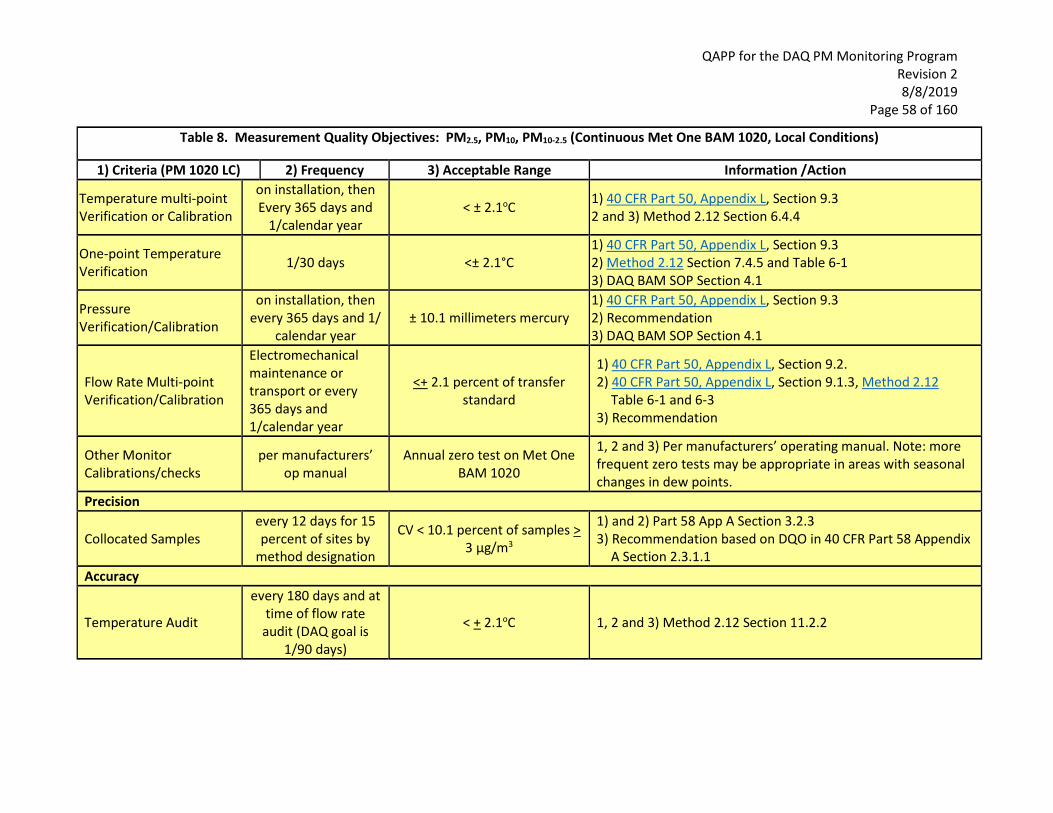
QAPP for the DAQ PM Monitoring Program Revision 2 8/8/2019
Page 58 of 160
Table 8. Measurement Quality Objectives: PM2.5, PM10, PM10-2.5 (Continuous Met One BAM 1020, Local Conditions)
1) Criteria (PM 1020 LC) 2) Frequency 3) Acceptable Range Information /Action
Temperature multi-point Verification or Calibration
on installation, then Every 365 days and
1/calendar year < ± 2.1oC 1) 40 CFR Part 50, Appendix L, Section 9.3
2 and 3) Method 2.12 Section 6.4.4
One-point Temperature Verification 1/30 days <± 2.1°C
1) 40 CFR Part 50, Appendix L, Section 9.3 2) Method 2.12 Section 7.4.5 and Table 6-1 3) DAQ BAM SOP Section 4.1
Pressure Verification/Calibration
on installation, then every 365 days and 1/
calendar year ± 10.1 millimeters mercury
1) 40 CFR Part 50, Appendix L, Section 9.3 2) Recommendation 3) DAQ BAM SOP Section 4.1
Flow Rate Multi-point Verification/Calibration
Electromechanical maintenance or transport or every 365 days and 1/calendar year
<+ 2.1 percent of transfer standard
1) 40 CFR Part 50, Appendix L, Section 9.2. 2) 40 CFR Part 50, Appendix L, Section 9.1.3, Method 2.12
Table 6-1 and 6-3 3) Recommendation
Other Monitor Calibrations/checks
per manufacturers’ op manual
Annual zero test on Met One BAM 1020
1, 2 and 3) Per manufacturers’ operating manual. Note: more frequent zero tests may be appropriate in areas with seasonal changes in dew points.
Precision
Collocated Samples every 12 days for 15 percent of sites by
method designation
CV < 10.1 percent of samples > 3 μg/m3
1) and 2) Part 58 App A Section 3.2.3 3) Recommendation based on DQO in 40 CFR Part 58 Appendix
A Section 2.3.1.1 Accuracy
Temperature Audit
every 180 days and at time of flow rate
audit (DAQ goal is 1/90 days)
< + 2.1oC 1, 2 and 3) Method 2.12 Section 11.2.2

QAPP for the DAQ PM Monitoring Program Revision 2 8/8/2019
Page 59 of 160
Table 8. Measurement Quality Objectives: PM2.5, PM10, PM10-2.5 (Continuous Met One BAM 1020, Local Conditions)
1) Criteria (PM 1020 LC) 2) Frequency 3) Acceptable Range Information /Action
Pressure Audit
every 180 days and at time of flow rate
audit (DAQ goal is 1/90 days)
< + 10.1 millimeters mercury 1, 2 and 3) Method 2.12 Section 11.2.3
Semi-Annual Flow Rate Audit
Twice a calendar year and 5-7 months apart (DAQ goal is 1/90 days)
< + 4.1 percent of audit standard (DAQ’s warning limit
is ≤±3 percent) < + 5.1 percent of design flow
rate (DAQ’s warning limit is ≤±4 percent)
1) 40 CFR Part 58, Appendix A, Section 3.2.2 and 3.3.3 2) 40 CFR Part 58, Appendix A, Section 3.2.2 and 3.3.3 and DAQ
BAM SOP Section 5.0 3) Method 2.12 Section 11.2.1 and DAQ BAM SOP Section 5.0
Shelter Temperature Temperature Range At set-up Per operator manual Temperature Control Daily (hourly values) < 2.1o C SD over 24 hours 1, 2 and 3) QA Handbook Volume 2 Section 7.2.2
Temperature Device Check
Every 180 calendar days and twice a
calendar year < + 2.1o C 1, 2 and 3) QA Handbook Volume 2 Section 7.2.2
Monitor Maintenance
PM2.5 Separator (VSCC) every 30 days cleaned/changed 1,2 and 3) Method 2.12 Section 8.3.3
Inlet Cleaning every 30 days cleaned/changed 1,2 and 3) Method 2.12 Section 8.3
Downtube Cleaning every 90 days cleaned 1,2 and 3) Method 2.12 Section 8.4 Filter Housing Assembly Cleaning every 30 days cleaned 1,2 and 3) Method 2.12 Section 8.3
Circulating Fan Filter Cleaning every 30 days cleaned 1,2 and 3) Method 2.12 Section 8.3
Manufacturer-Recommended Maintenance
per manufacturers’ SOP per manufacturers’ SOP 1, 2, and 3) Per operator manual

QAPP for the DAQ PM Monitoring Program Revision 2 8/8/2019
Page 60 of 160
Table 8. Measurement Quality Objectives: PM2.5, PM10, PM10-2.5 (Continuous Met One BAM 1020, Local Conditions)
1) Criteria (PM 1020 LC) 2) Frequency 3) Acceptable Range Information /Action Met One 1020 BAM Specific Operational Criteria
BAM check of membrane span foil Daily Average < + 5.1 percent of ABS 1, 2 and 3) Applies on the BAM 1020
BAM electrical grounding At setup
1. Ground the chassis of the BAM 2. Ground the downtube to the chassis at the collar (i.e., with setscrews)
1, 2, and 3) Per operator manual
Nozzle cleaning Every 30 days, or more often as needed cleaned Per operator manual
Zero test Yearly Standard deviation of the data from a 72-hour zero test
< 2.4 μg/m3 1,2 and 3) Per operator manual
SYSTEMATIC CRITERIA- PM2.5, PM10, PM10-2.5 Continuous Met One BAM 1020, Local Conditions
Siting 1/365 days and 1/calendar year
meets siting criteria or waiver documented
1) 40 CFR Part 58 Appendix E, sections 2-6 2) Recommendation (See DAQ Annual Network Review SOP) 3) 40 CFR Part 58 Appendix E, sections 2-6
Data Completeness Annual standard ≥ 75 percent 1), 2), and 3) 40 CFR Part 50, Appendix N, Section 4.1 (b) 4.2 (a)
24-hour standard ≥ 75 percent 1), 2), and 3) 40 CFR Part 50, Appendix N, Section 4.1 (b) 4.2 (a)
Reporting Units all hourly and 24-hour values
µg/m3 at ambient temperature and pressure 1. 2 and 3) 40 CFR Part 50, Appendix N, Section 3.0 (b)
Rounding convention for design value calculation all hourly averages
to one decimal place, with additional digits to the right
being truncated
1. 2 and 3) 40 CFR Part 50, Appendix N, Section 3.0 (b) The rounding convention is for averaging values for comparison to the NAAQS not for reporting individual values.
Annual 3-yr average all concentrations nearest 0.1 µg/m3 (≥ 0.05 round up)
1,2 and 3) 40 CFR Part 50, Appendix N, Section 3 and 4 Rounding rule for AQS data is a recommendation
24-hour, 3-year average all concentrations nearest 1 µg/m3 (≥ 0.5 round 1,2 and 3) 40 CFR Part 50, Appendix N, Section 3 and 4

QAPP for the DAQ PM Monitoring Program Revision 2 8/8/2019
Page 61 of 160
Table 8. Measurement Quality Objectives: PM2.5, PM10, PM10-2.5 (Continuous Met One BAM 1020, Local Conditions)
1) Criteria (PM 1020 LC) 2) Frequency 3) Acceptable Range Information /Action up) Rounding rule for AQS data is a recommendation
Recertification of Standard Verifications and Calibrations - All standards should have multi-point certifications against NIST-Traceable standards
Flow Rate Transfer Standard
Every 365 days and once a year
<± 2.1 percent of NIST-Traceable Standard
1) 40 CFR Part 50, Appendix L, Section 9.1 and 9.2 2) Method 2.12 Section 4.2.3 and 6.3.3 3) 40 CFR Part 50, Appendix L, Section 9.1 and 9.2
Field Thermometer Every 365 days and once a year
± 0.1° C resolution, ± 0.5° C accuracy 1, 2 and 3) Method 2.12 Section 4.2.2
Field Barometer Every 365 days and once a year
± 1-millimeters mercury resolution, ± 5 millimeters
mercury accuracy 1, 2 and 3) Method 2.12 Section 4.2.2
Field Manometer Every 365 days and once a year
± 0.1 inches water resolution, ± 1.0 inch water accuracy 1, 2 and 3) Method 2.12 Section 4.2.2
Clock/timer Verification 1/30 days ± 1 minute/month 1and 2) Method 2.12 Table 8-1 3) 40 CFR Part 50, Appendix L, Section 7.4.12
Precision Single analyzer (collocated monitors) 1/91 days. CV ≤ 10.1 percent for values >
3.0 µg/m3 1, 2 and 3) Recommendation to provide early (quarterly) evaluation of achievement of DQOs.
Primary Quality Assurance Organization
Annual and 3 year estimates
90 percent confidence limit of CV < 10.1 percent for values >
3.0 µg/m3
1, 2 and 3) 40 CFR Part 58, Appendix A, Section 4.2.1 and 2.3.1.1.
Bias
Performance Evaluation Program (PEP)
5 audits for PQAOs with < 5 sites
8 valid audits for PQAOs with > 5 sites
<±10.1 percent for values ≥ 3.0 µg/m3
1,2 and 3) 40 CFR Part 58, Appendix A, Section 3.2.4, 4.2.5 and 2.3.1.1

QAPP for the DAQ PM Monitoring Program Revision 2 8/8/2019
Page 62 of 160
Table 8. Measurement Quality Objectives: PM2.5, PM10, PM10-2.5 (Continuous Met One BAM 1020, Local Conditions)
1) Criteria (PM 1020 LC) 2) Frequency 3) Acceptable Range Information /Action and each PQAO primary monitor
audited every 6 years

QAPP for the DAQ PM Monitoring Program Revision 2 8/8/2019
Page 63 of 160
Table 9. Measurement Quality Objectives: PM10 (Continuous Met One BAM 1020, Standard Temperature and Pressure, or STP)
1) Criteria (PM10 STP) 2) Frequency 3) Acceptable Range Information /Action CRITICAL CRITERIA - PM10 Continuous, BAM 1020, STP
Sampler/Monitor Not applicable
meets requirements listed in FRM/FEM designation
Confirm method designation on front panel or just inside instrument
1) 40 CFR Part 58, Appendix C, Section 2.1 2) Not applicable 3) 40 CFR Part 53 and FRM/FEM method list
Firmware of monitor At setup
1. Must be the firmware (or later version) as identified in the published method designation summary. 2. Firmware settings must be set for flowrate to operate and report at STP.
1, 2 and 3) 40 CFR Part 50, Appendix J, Section 2.2
Data Reporting Period Report every hour
1. The BAM 1020 bases the calculation of a valid hour of data on the collection of 42 valid minutes of data per hour. 2. A 24-hour period is calculated in AQS if 18 or more valid hours are reported for a day
1) and 2) 40 CFR Part 50, Appendix N, Section 3 (c) 3) See BAM 1020 operator’s manual and 40 CFR Part 50, Appendix N, Section 3 (c) Hourly data are always reported as the start of the hour on local standard time
Sampling Instrument
PM10 Inlet At setup Must be a Louvered PM10 size selective inlet as specified in 40 CFR Part 50, appendix L, Figures L-2 through L-19
1, 2 and 3) 40 CFR Part 50, Appendix L, Figures L-2 through L-19
Average Flow Rate every 24 hours of operation, each hour
can be checked average within ± 5 percent of 16.67 LPM at local
conditions 1, 2 and 3) 40 CFR Part 50, Appendix L, Section 7.4.3.1
Variability in Flow Rate every 24 hours of operation CV ≤ 2 percent 1, 2 and 3) 40 CFR Part 50, Appendix L, Section
7.4.3.2

QAPP for the DAQ PM Monitoring Program Revision 2 8/8/2019
Page 64 of 160
Table 9. Measurement Quality Objectives: PM10 (Continuous Met One BAM 1020, Standard Temperature and Pressure, or STP)
1) Criteria (PM10 STP) 2) Frequency 3) Acceptable Range Information /Action Verification/Calibration
One-point Flow Rate Verification
Every 30 days, each separated by 14 days (DAQ goal is 2/month separated by 14 to 18
days)
< ± 4.1 percent of transfer standard (DAQ’s warning limit is ≤± 3 percent of transfer
standard); < ± 5.1 percent of flow rate design value (DAQ’s warning limit is ≤± 4 percent of
flow rate design value)
1 and 2) 40 CFR Part 58, Appendix A, Section 3.3.1 and DAQ BAM SOP, Section 7.0 3) 40 CFR Part 50, Appendix L, Section 9.2.5 and 7.4.3.1 and DAQ BAM SOP, Section 7.0
Design Flow Rate Adjustment
After multi-point calibration or verification
< ± 2.1 percent of design flow rate 1,2 and 3) 40 CFR Part 50, Appendix L, Section 9.2.6
External Leak Check Before each flow rate Verification or calibration
< 1.0 LPM
1) 40 CFR Part 50, Appendix L, Section 7.4.6.1 2) 40 CFR Part 50, Appendix L, Section 9.2.3 and
Method 2-12 Section 7.4.3 3) 40 CFR Part 50, Appendix L, Section 7.4.6.1 and
DAQ BAM SOP Section 4.1
Internal Leak Check If failure of external leak check < 1.0 LPM
1) 40 CFR Part 50, Appendix L, Section 7.4.6.2 2) Method 2-12 7.4.4 3) 40 CFR Part 50, Appendix L, Section 7.4.6.2 and
DAQ BAM SOP Section 4.1 OPERATIONAL CRITERIA - PM10 Continuous, BAM 1020, STP
Annual Multi-point Verifications/Calibrations
Temperature multi-point Verification or Calibration
On installation, electromechanical
maintenance, transport or every 365 days and
1/calendar year
< ± 2.1oC 1) 40 CFR Part 50, Appendix L, Section 9.3 2 and 3) Method 2.12 Section 6.4.4

QAPP for the DAQ PM Monitoring Program Revision 2 8/8/2019
Page 65 of 160
Table 9. Measurement Quality Objectives: PM10 (Continuous Met One BAM 1020, Standard Temperature and Pressure, or STP)
1) Criteria (PM10 STP) 2) Frequency 3) Acceptable Range Information /Action
One Point Pressure Verification or Calibration
On installation, electromechanical
maintenance, transport or every 365 days and
1/calendar year
< ± 10.1 millimeters mercury
1) 40 CFR Part 50, Appendix L, Section 9.3 2 and 3) Method 2.12, Section 6.5 Barometric pressure verified against an independent standard verified against a laboratory primary standard that is certified NIST-traceable 1/365 days
Flow Rate Multi-point Verification or Calibration
On installation, electromechanical
maintenance, transport or every 365 days and
1/calendar year
< + 2.1 percent of transfer standard
1) 40 CFR Part 50, Appendix L, Section 9.2. 2) 40 CFR Part 50, Appendix L, Section 9.1.3, Method 2.12 Table 6-1 and 6-3 3) Recommendation
Routine One-point Verifications
Leak Check 1/30 days < 1.0 LPM
1) 40 CFR Part 50, Appendix L, Section 7.4.6.1 2) DAQ BAM SOP Section 4.1. 3) DAQ BAM SOP Section 4.1.
One-point Temperature Verification 1/30 days <± 2.1°C
1) 40 CFR Part 50, Appendix L, Section 9.3 2) Method 2.12 Section 7.4.5 and Table 6-1 3) DAQ BAM SOP Section 4.1
One-point Pressure Verification 1/30 days < ± 10.1 millimeters mercury
1) 40 CFR Part 50, Appendix L, Section 9.3 2) DAQ BAM SOP Section 4.1 3) DAQ BAM SOP Section 4.1
Other Monitor Calibrations/checks
per manufacturers’ op manual Annual zero test on Met One BAM 1020
1, 2 and 3) Per manufacturers’ operating manual. Note: more frequent zero tests may be appropriate in areas with seasonal changes in dew points.

QAPP for the DAQ PM Monitoring Program Revision 2 8/8/2019
Page 66 of 160
Table 9. Measurement Quality Objectives: PM10 (Continuous Met One BAM 1020, Standard Temperature and Pressure, or STP)
1) Criteria (PM10 STP) 2) Frequency 3) Acceptable Range Information /Action Precision
Collocated Samples every 12 days for 15 percent of sites by
method designation CV < 10.1 percent of samples > 3 μg/m3
1) and 2) 40 CFR Part 58, Appendix A, Section 3.2.3 3 Recommendation based on DQO in 40 CFR Part 58, Appendix A, Section 2.3.1.1
Accuracy
Temperature Audit
every 180 days and at time of flow rate
audit (DAQ goal is 91 days)
< + 2.1oC
1) Method 2.12 Section 11.2.2 2) Method 2.12 Section 11.2.2 (and DAQ BAM SOP Section 5.0) 3) Method 2.12 Section 11.2.2
Pressure Audit
every 180 days and at time of flow rate
audit (DAQ goal is 91 days)
< + 10.1 millimeters mercury
1) Method 2.12 Section 11.2.3 2) Method 2.12 Section 11.2.3 (and DAQ BAM SOP Section 5.0) 3) Method 2.12 Section 11.2.3
Semi-Annual Flow Rate Audit
Twice a calendar year and 5-7 months apart (DAQ goal is 91 days)
< + 4.1 percent of audit standard; < + 5.1 percent of design flow rate (DAQ’s warning
limit for percent of transfer standard and flow design value is ≤±3.0 and ≤±4.0 percent
respectively)
1) 40 CFR Part 58, Appendix A, Section 3.3.3 2) 40 CFR Part 58, Appendix A, Section 3.3.3
(and DAQ BAM SOP Section 5.0) 3) Method 2.12 Section 11.2.1 (and DAQ BAM
SOP Section 5.0) Cabinet Temperature Temperature Range At set-up 0 to 50 o C 1, 2 and 3) BAM 1020 Operation Manual Temperature Control Hourly values Within ± 2 o C 1, 2 and 3) BAM 1020 Operation Manual
Temperature Device Check
Every 180 calendar days and twice a
calendar year < + 2.1o C 1, 2 and 3) QA Handbook Volume 2 Section
7.2.2
Monitor Maintenance Inlet Cleaning every 30 days cleaned 1,2 and 3) Method 2.12 Section 8.3 Downtube Cleaning every 90 days cleaned 1,2 and 3) Method 2.12 Section 8.4

QAPP for the DAQ PM Monitoring Program Revision 2 8/8/2019
Page 67 of 160
Table 9. Measurement Quality Objectives: PM10 (Continuous Met One BAM 1020, Standard Temperature and Pressure, or STP)
1) Criteria (PM10 STP) 2) Frequency 3) Acceptable Range Information /Action Filter Housing Assembly Cleaning every 30 days cleaned 1,2 and 3) Method 2.12 Section 8.3
Circulating Fan Filter Cleaning every 30 days Cleaned or changed 1,2 and 3) Method 2.12 Section 8.3
Manufacturer-Recommended Maintenance
per manufacturers’ SOP per manufacturers’ SOP
MetOne 1020 BAM Specific Operational Criteria Check of membrane span foil Daily Average < + 5.1 percent of ABS 1, 2 and 3) BAM 1020 Operations Manual
BAM electrical grounding At setup
1. Ground the chassis of the BAM 2. Ground the downtube to the chassis at the collar (i.e., with setscrews)
1, 2 and 3) BAM 1020 Operations Manual
Nozzle and vane cleaning
Every 30 days, or more often as needed cleaned 1, 2 and 3) DAQ BAM SOP Section 8.0
Zero test Yearly Standard deviation of the data from a 72-hour zero test < 2.4 μg/m3 1, 2 and 3) DAQ BAM SOP Section 7.0
SYSTEMATIC CRITERIA – PM10 Continuous, BAM 1020, STP
Siting 1/365 days and 1/calendar year meets siting criteria or waiver documented
1) 40 CFR Part 58 Appendix E, sections 2-6 2) Recommendation (See DAQ Annual Network
Review SOP) 3) 40 CFR Part 58 Appendix E, sections 2-6
Data Completeness 24-hour quarterly ≥ 75 percent of hours per day and scheduled sampling days in each quarter
1, 2 and 3) 40 CFR Part 50, Appendix K, Section 2.3 (a)
Reporting Units all hourly and 24-hour values µg/m3 at STP 1, 2 and 3) 40 CFR Part 50, Appendix K
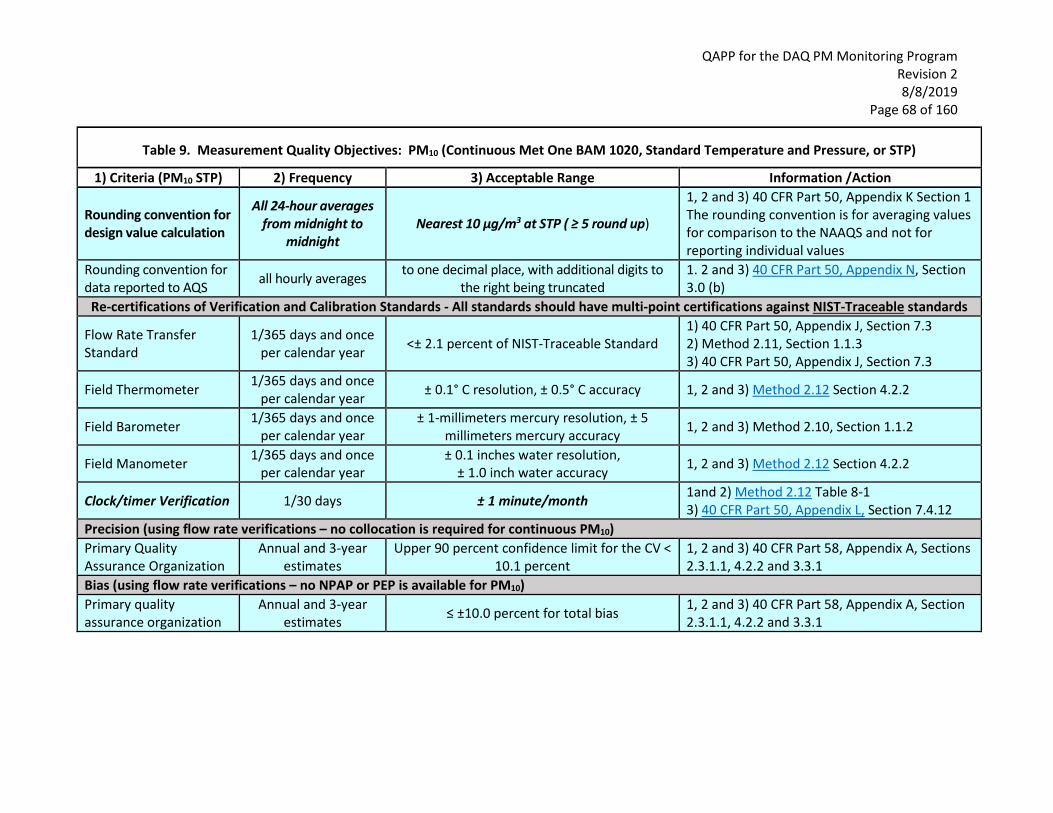
QAPP for the DAQ PM Monitoring Program Revision 2 8/8/2019
Page 68 of 160
Table 9. Measurement Quality Objectives: PM10 (Continuous Met One BAM 1020, Standard Temperature and Pressure, or STP)
1) Criteria (PM10 STP) 2) Frequency 3) Acceptable Range Information /Action
Rounding convention for design value calculation
All 24-hour averages from midnight to
midnight Nearest 10 µg/m3 at STP ( ≥ 5 round up)
1, 2 and 3) 40 CFR Part 50, Appendix K Section 1 The rounding convention is for averaging values for comparison to the NAAQS and not for reporting individual values
Rounding convention for data reported to AQS all hourly averages to one decimal place, with additional digits to
the right being truncated 1. 2 and 3) 40 CFR Part 50, Appendix N, Section 3.0 (b)
Re-certifications of Verification and Calibration Standards - All standards should have multi-point certifications against NIST-Traceable standards
Flow Rate Transfer Standard
1/365 days and once per calendar year <± 2.1 percent of NIST-Traceable Standard
1) 40 CFR Part 50, Appendix J, Section 7.3 2) Method 2.11, Section 1.1.3 3) 40 CFR Part 50, Appendix J, Section 7.3
Field Thermometer 1/365 days and once per calendar year ± 0.1° C resolution, ± 0.5° C accuracy 1, 2 and 3) Method 2.12 Section 4.2.2
Field Barometer 1/365 days and once per calendar year
± 1-millimeters mercury resolution, ± 5 millimeters mercury accuracy 1, 2 and 3) Method 2.10, Section 1.1.2
Field Manometer 1/365 days and once per calendar year
± 0.1 inches water resolution, ± 1.0 inch water accuracy 1, 2 and 3) Method 2.12 Section 4.2.2
Clock/timer Verification 1/30 days ± 1 minute/month 1and 2) Method 2.12 Table 8-1 3) 40 CFR Part 50, Appendix L, Section 7.4.12
Precision (using flow rate verifications – no collocation is required for continuous PM10) Primary Quality Assurance Organization
Annual and 3-year estimates
Upper 90 percent confidence limit for the CV < 10.1 percent
1, 2 and 3) 40 CFR Part 58, Appendix A, Sections 2.3.1.1, 4.2.2 and 3.3.1
Bias (using flow rate verifications – no NPAP or PEP is available for PM10) Primary quality assurance organization
Annual and 3-year estimates ≤ ±10.0 percent for total bias 1, 2 and 3) 40 CFR Part 58, Appendix A, Section
2.3.1.1, 4.2.2 and 3.3.1

QAPP for the DAQ PM Monitoring Program Revision 2 8/8/2019
Page 69 of 160
Table 10. Measurement Quality Objectives: PM2.5 (Continuous Met One BAM 1022, Local Conditions)
1) Criteria (PM 1022 LC) 2) Frequency 3) Acceptable Range Information /Action CRITICAL CRITERIA - PM2.5 Continuous, BAM 1022, Local Conditions
Sampler/Monitor Not applicable
meets requirements listed in FRM/FEM designation
Confirm method designation on front panel or just inside instrument
1) 40 CFR Part 58, Appendix C, Section 2.1 2) Not applicable 3) 40 CFR Part 53 and FRM/FEM method list
Firmware of monitor At setup
1. Must be the firmware (or later version) as identified in the published method designation summary. 2. Firmware settings must be set for flowrate to operate and report at “local conditions” (i.e., not STP).
40 CFR Part 50 Appendix N, section 1 (c)
Data Reporting Period Report every hour
1. The calculation of an hour of data is dependent on the design of the method. 2. A 24-hour period is calculated in AQS if 18 or more valid hours are reported for a day
See operator’s manual. Hourly data are always reported as the start of the hour on local standard time 40 CFR Part 50 Appendix N, Section 3 (c)
Sampling Instrument
PM10 Inlet (if applicable to method designated) At setup
Must be a Louvered PM10 size selective inlet as specified in 40 CFR Part 50, Appendix L, Figures L-2 through L-19
1, 2 and 3) 40 CFR Part 50, Appendix L, Figures L-2 through L-19
PM2.5 second stage separator (if applicable to method designated)
At setup
Must be a BGI Inc. Very Sharp Cut Cyclone (VSCCTM) or equivalent second stage separator approved for the method.
The other approved second stage separator option for select FEMs is the Dichot. +

QAPP for the DAQ PM Monitoring Program Revision 2 8/8/2019
Page 70 of 160
Table 10. Measurement Quality Objectives: PM2.5 (Continuous Met One BAM 1022, Local Conditions)
1) Criteria (PM 1022 LC) 2) Frequency 3) Acceptable Range Information /Action
Average Flow Rate
every 24 hours of operation, each
hour can be checked
average within 5 percent of 16.67 LPM at local conditions 1, 2 and 3) 40 CFR Part 50, Appendix L, Section 7.4.3.1
Variability in Flow Rate every 24 hours of operation
CV ≤ 2 percent 1, 2 and 3) 40 CFR Part 50, Appendix L, Section 7.4.3.2
One-point Flow Rate Verification
1/30 days, separated by 14
days
< ± 4.1 percent of transfer standard (DAQ’s warning limit is ≤± 3 percent
of transfer standard); < ± 5.1 percent of flow rate design value (DAQ’s
warning limit is ≤± 4 percent of flow rate design value)
1, 2 and 3) 40 CFR Part 50, Appendix L, Section 9.2.5 and 7.4.3.1 and 40 CFR Part 58, Appendix A, Section 3.2.3 and 3.3.2 3) DAQ’s warning limit for percent of transfer standard and flow design value is 3 and 4 percent respectively, DAQ BAM SOP, Section 7.0
Design Flow Rate Adjustment
After multi-point calibration or verification
< ± 2.1 percent of design flow rate 1,2 and 3) 40 CFR Part 50, Appendix L, Section 9.2.6
External Leak Check
Before each flow rate verification or calibration and before and after PM2.5 separator maintenance
Method specific. See operator’s manual.
1) 40 CFR Part 50, Appendix L, Section 7.4.6.1 2) 40 CFR Part 50, Appendix L Section 9.2.3 and Method 2-12 Section 7.4.3 3) 40 CFR Part 50, Appendix L, Section 7.4.6.1
Internal Leak Check If failure of
external leak check
Method specific. See operator’s manual.
1) 40 CFR Part 50, Appendix L, Section 7.4.6.2 2) Method 2-12 7.4.4 3) 40 CFR Part 50, Appendix L, Section 7.4.6.2
OPERATIONAL CRITERIA - PM BAM 1022, Local Conditions Annual Multi-point Verifications/Calibrations
Leak Check 1/30 days < 1.0 LPM 1) 40 CFR Part 50, Appendix L, Section 7.4.6.1 2) Recommendation 3) DAQ BAM SOP Section 4.1.

QAPP for the DAQ PM Monitoring Program Revision 2 8/8/2019
Page 71 of 160
Table 10. Measurement Quality Objectives: PM2.5 (Continuous Met One BAM 1022, Local Conditions)
1) Criteria (PM 1022 LC) 2) Frequency 3) Acceptable Range Information /Action
Temperature multi-point Verification/Calibration
on installation, then Every 365
days and 1/ calendar year
< ± 2.1oC 1) 40 CFR Part 50, Appendix L, Section 9.3 2 and 3) Method 2.12 Section 6.4.4
One-point Temperature Verification 1/30 days <± 2.1°C
1) 40 CFR Part 50, Appendix L, Section 9.3 2) Method 2.12 Section 7.4.5 and Table 6-1 3) Recommendation
Pressure Verification/Calibration
on installation, then every 365
days and 1/ calendar year
± 10.1 millimeters mercury 1) 40 CFR Part 50, Appendix L, Section 9.3 2) Recommendation 3) DAQ BAM SOP Section 4.1
Flow Rate Multi-point Verification/Calibration
Electromechanical maintenance or transport or every 365 days and 1/calendar year
<+ 2.1 percent of transfer standard
1) 40 CFR Part 50, Appendix L, Section 9.2. 2) 40 CFR Part 50, Appendix L, Section 9.1.3, Method 2.12 Table 6-1 and 6-3 3) Recommendation
Other Monitor Calibrations/checks
per manufacturers’ op
manual
Annual zero test on Met One BAM 1020
1, 2, 3) Per manufacturers’ operating manual. Note: more frequent zero tests may be appropriate in areas with seasonal changes in dew points.
Precision
Collocated Samples
every 12 days for 15 percent of sites
by method designation
CV < 10.1 percent of samples > 3 μg/m3
1) and 2) 40 CFR Part 58, Appendix A, Section 3.2.3 3 Recommendation based on DQO in 40 CFR Part 58, Appendix A, Section 2.3.1.1
Accuracy
Temperature Audit every 180 days and at time of flow rate audit
< + 2.1oC 1, 2 and 3) Method 2.12 Section 11.2.2

QAPP for the DAQ PM Monitoring Program Revision 2 8/8/2019
Page 72 of 160
Table 10. Measurement Quality Objectives: PM2.5 (Continuous Met One BAM 1022, Local Conditions)
1) Criteria (PM 1022 LC) 2) Frequency 3) Acceptable Range Information /Action
Pressure Audit every 180 days and at time of flow rate audit
< + 10.1 millimeters mercury 1, 2 and 3) Method 2.12 Section 11.2.3
Semi-Annual Flow Rate Audit
Twice a calendar year and 5-7 months apart
< + 4.1 percent of audit standard; < + 5.1 percent of design flow rate
(DAQ’s warning limit for percent of transfer standard and flow design value is ≤±3.0 and ≤±4.0 percent
respectively)
1 and 2) 40 CFR Part 58, Appendix A, Section 3.3.3 3) Method 2.12 Section 11.2.1, DAQ’s warning limit for percent of transfer standard and flow design value is ±3 and ±4 percent respectively, DAQ BAM SOP Section 5.0
Monitor Maintenance PM2.5 Separator (VSCC) every 30 days cleaned/changed 1,2 and 3) Method 2.12 Section 8.3.3 Inlet Cleaning every 30 days cleaned/changed 1,2 and 3) Method 2.12 Section 8.3 Downtube Cleaning every 90 days cleaned 1,2 and 3) Method 2.12 Section 8.4 Filter Housing Assembly Cleaning every 30 days cleaned 1,2 and 3) Method 2.12 Section 8.3
Circulating Fan Filter Cleaning every 30 days cleaned 1,2 and 3) Method 2.12 Section 8.3
Manufacturer-Recommended Maintenance
per manufacturers’
SOP per manufacturers’ SOP
Design Flow Rate Adjustment
at multi-point calibration ± 2 percent of design flow rate 1,2 and 3) 40 CFR Part 50, Appendix L, Section 9.2.6
MetOne 1022 BAM Specific Operational Criteria BAM check of membrane span foil Quarterly Average < + 5.1 percent of ABS 1, 2 and 3) Applies on the BAM 1022
BAM electrical grounding At setup
1. Ground the chassis of the BAM. 2. Ground the downtube to the chassis at the collar (i.e., with setscrews)
1, 2, 3) Per operator manual
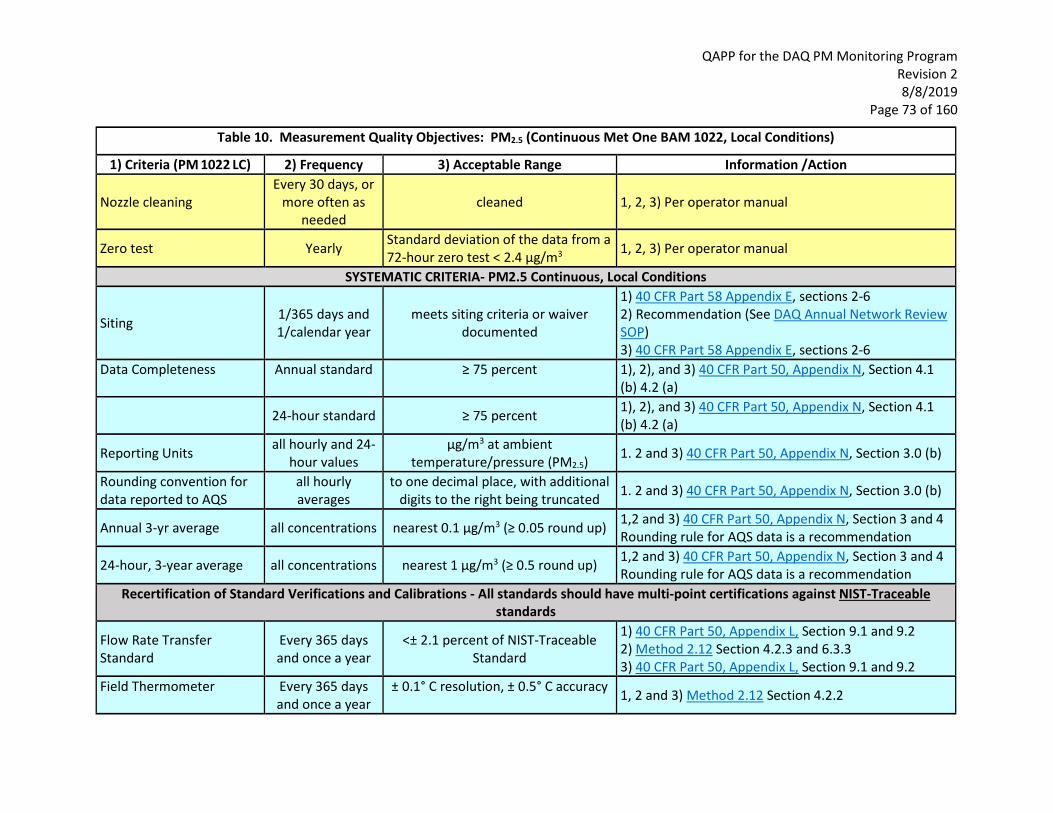
QAPP for the DAQ PM Monitoring Program Revision 2 8/8/2019
Page 73 of 160
Table 10. Measurement Quality Objectives: PM2.5 (Continuous Met One BAM 1022, Local Conditions)
1) Criteria (PM 1022 LC) 2) Frequency 3) Acceptable Range Information /Action
Nozzle cleaning Every 30 days, or
more often as needed
cleaned 1, 2, 3) Per operator manual
Zero test Yearly Standard deviation of the data from a 72-hour zero test < 2.4 μg/m3 1, 2, 3) Per operator manual
SYSTEMATIC CRITERIA- PM2.5 Continuous, Local Conditions
Siting 1/365 days and 1/calendar year
meets siting criteria or waiver documented
1) 40 CFR Part 58 Appendix E, sections 2-6 2) Recommendation (See DAQ Annual Network Review SOP) 3) 40 CFR Part 58 Appendix E, sections 2-6
Data Completeness Annual standard ≥ 75 percent 1), 2), and 3) 40 CFR Part 50, Appendix N, Section 4.1 (b) 4.2 (a)
24-hour standard ≥ 75 percent 1), 2), and 3) 40 CFR Part 50, Appendix N, Section 4.1 (b) 4.2 (a)
Reporting Units all hourly and 24-hour values
µg/m3 at ambient temperature/pressure (PM2.5)
1. 2 and 3) 40 CFR Part 50, Appendix N, Section 3.0 (b)
Rounding convention for data reported to AQS
all hourly averages
to one decimal place, with additional digits to the right being truncated 1. 2 and 3) 40 CFR Part 50, Appendix N, Section 3.0 (b)
Annual 3-yr average all concentrations nearest 0.1 µg/m3 (≥ 0.05 round up) 1,2 and 3) 40 CFR Part 50, Appendix N, Section 3 and 4 Rounding rule for AQS data is a recommendation
24-hour, 3-year average all concentrations nearest 1 µg/m3 (≥ 0.5 round up) 1,2 and 3) 40 CFR Part 50, Appendix N, Section 3 and 4 Rounding rule for AQS data is a recommendation
Recertification of Standard Verifications and Calibrations - All standards should have multi-point certifications against NIST-Traceable standards
Flow Rate Transfer Standard
Every 365 days and once a year
<± 2.1 percent of NIST-Traceable Standard
1) 40 CFR Part 50, Appendix L, Section 9.1 and 9.2 2) Method 2.12 Section 4.2.3 and 6.3.3 3) 40 CFR Part 50, Appendix L, Section 9.1 and 9.2
Field Thermometer Every 365 days and once a year
± 0.1° C resolution, ± 0.5° C accuracy 1, 2 and 3) Method 2.12 Section 4.2.2

QAPP for the DAQ PM Monitoring Program Revision 2 8/8/2019
Page 74 of 160
Table 10. Measurement Quality Objectives: PM2.5 (Continuous Met One BAM 1022, Local Conditions)
1) Criteria (PM 1022 LC) 2) Frequency 3) Acceptable Range Information /Action
Field Barometer Every 365 days and once a year
± 1-millimeters mercury resolution, ± 5 millimeters mercury accuracy 1, 2 and 3) Method 2.12 Section 4.2.2
Field Manometer Every 365 days and once a year
± 0.1 inches water resolution, ± 1.0 inch water accuracy 1, 2 and 3) Method 2.12 Section 4.2.2
Clock/timer Verification 1/30 days ± 1 minute/month 1and 2) Method 2.12 Table 8-1 3) 40 CFR Part 50, Appendix L, Section 7.4.12
Precision Single analyzer (collocated monitors) 1/91 days. CV ≤ 10.1 percent for values > 3.0
µg/m3 1, 2 and 3) Recommendation to provide early (quarterly) evaluation of achievement of DQOs.
Primary Quality Assurance Organization
Annual and 3 year estimates
90 percent confidence limit of CV < 10.1 percent for values > 3.0 µg/m3
1, 2 and 3) 40 CFR Part 58, Appendix A, Section 4.2.1 and 2.3.1.1.
Bias
Performance Evaluation Program (PEP)
5 audits for PQAOs with < 5
sites 8 valid audits for PQAOs with > 5
sites, each PQAO primary monitor audited every 6
years
<±10.1 percent for values > 3.0 µg/m3 1,2 and 3) 40 CFR Part 58, Appendix A, Section 3.2.4, 4.2.5 and 2.3.1.1

QAPP for the DAQ PM Monitoring Program Revision 2 8/8/2019
Page 75 of 160
Table 11. Measurement Quality Objectives: PM2.5, PM10 and PM10-2.5 (Continuous T640X Local Conditions)
Note: At the time of the revision of this QAPP, EPA has not yet provided an approved MQO table for the T640 series of monitors. At the time when such tables become available, the DAQ will adopt the criteria therein as its own. 1) Criteria (PM T640X LC) 2) Frequency 3) Acceptable Range Information /Action
CRITICAL CRITERIA - PM2.5, PM10 and PM10-2.5 Continuous T640X, Local Conditions
Sampler/Monitor Not applicable meets requirements listed in FRM/FEM designation
1) 40 CFR Part 58, Appendix C, Section 2.1 2) Not applicable 3) 40 CFR Part 53 and FRM/FEM method list
Average Flow Rate every 24 hours of operation, each hour can be checked
average within 10 percent of 5.0 LPM for sample flow, average
within 5 percent of 11.67/16.67 LPM for bypass/total flow
1, 2 and 3) DAQ T640X SOP, Section 7.0
Variability in Flow Rate every 24 hours of operation CV* ≤ 2 percent 1, 2 and 3) 40 CFR Part 50, Appendix L, Section 7.4.3.2
One-point Flow Rate Verification
1/30 days, separated by 14 days (DAQ goal is 2/month separated by 14 to 18 days)
± 10 percent of standard for main flow
± 5 percent of standard for bypass/total flow
1, 2 and 3) 40 CFR Part 50, Appendix L, Section 9.2.5 and 7.4.3.1 and 40 CFR Part 58, Appendix A, Section 3.2.3 and 3.3.2
3) DAQ T640X SOP, Section 7.0 OPERATIONAL CRITERIA - PM2.5, PM10 and PM10-2.5 Continuous T640X, Local Conditions
Routine Verifications
Mid-Month Flow Rate Verification 1/30 days
± 10 percent of standard for main flow
± 5 percent of standard for bypass/total flow
1) 40 CFR Part 50, Appendix L, Section 9.2.5 2) Recommendation 3) DAQ T640X SOP, Section 7.0
Temperature Verification 1/30 days ± 2°C 1) 40 CFR Part 50, Appendix L, Section 9.3 2) Recommendation 3) DAQ T640X SOP, Section 7.0
Pressure Verification 1/30 days ± 10 millimeters mercury 1) 40 CFR Part 50, Appendix L, Section 9.3 2) Recommendation 3) DAQ T640X SOP, Section 7.0

QAPP for the DAQ PM Monitoring Program Revision 2 8/8/2019
Page 76 of 160
Table 11. Measurement Quality Objectives: PM2.5, PM10 and PM10-2.5 (Continuous T640X Local Conditions) – Continued 1) Criteria (PM T640X LC) 2) Frequency 3) Acceptable Range Information /Action
Leak Check every 30 days 0.0 µg/m3
1) 40 CFR Part 50, Appendix L, Section 7.4.6.1 2) Recommendation 3) DAQ T640X SOP, Section 7.0. DAQ designates this as an operational criterion.
Annual Multi-Point Calibrations
Pressure Calibration
On installation, electromechanical
maintenance or transport or 1/365 days and 1/calendar
year
<+ 10.1 millimeters mercury
1) 40 CFR Part 50, Appendix L, Section 9.3 2 and 3) Method 2.12, section 6.5 Barometric pressure verified against an independent standard verified against a laboratory primary standard that is certified NIST-traceable 1/365 days
Flow Rate Multi-Point Calibration
Electromechanical maintenance or transport or 1/365 days and 1/calendar
year
<+ 2.1 percent of transfer standard for all flows
1) 40 CFR Part 50, Appendix L, Section 9.2. 2) 40 CFR Part 50, Appendix L, Section 9.1.3, Method 2.12 Table 6-1 3) 40 CFR Part 50, Appendix L, Section 9.2.5
Accuracy Temperature Audit 1/90 days ± 2°C 1, 2 and 3) Method 2.12, Section 11.2.2 Pressure Audit 1/90 days ±10 millimeters mercury 1, 2 and 3) Method 2.12, Section 11.2.3
Semi-Annual Flow Rate Audit 1/90 days
± 10.1 percent of standard for main flow, ± 5.1 percent of
standard for bypass/total flow
1 and 2) 40 CFR Part 58, Appendix A, Section 3.3.3 3) Method 2.12 Section 11.2.1
Monitor Maintenance
Clean PM10 Head Every 30 days cleaned 1 and 3) DAQ T640X SOP Section 8.0 2) DAQ practice
Empty Water Collection Bottle Every 30 days cleaned 1 and 3) DAQ T640X SOP Section 8.0
2) DAQ practice
Inspect O-rings Every 30 days Visual inspection 1 and 3) DAQ T640X SOP Section 8.0 2) DAQ practice

QAPP for the DAQ PM Monitoring Program Revision 2 8/8/2019
Page 77 of 160
Table 11. Measurement Quality Objectives: PM2.5, PM10 and PM10-2.5 (Continuous T640X Local Conditions) – Continued 1) Criteria (PM T640X LC) 2) Frequency 3) Acceptable Range Information /Action Clean Temperature Probe Solar Shield 1/90 days cleaned 1 and 3) DAQ T640X SOP Section 8.0
2) DAQ practice
Clean Optical Chamber 1/182 days cleaned or changed 1 and 3) DAQ T640X SOP Section 8.0 2) DAQ practice
Internal/External Data Logger Data
Every month highest value on three
randomly selected days
agree exactly (digital) and ± 1 µg/m3 (analog)
1 and 3) DAQ T640X SOP Section 9.0 2) DAQ practice
ASC Test 1/30 days heater turns on when forced off
1 and 3) DAQ T640X SOP Section 8.0 2) DAQ practice
Check Pump Performance As needed 1 and 3) DAQ T640X SOP Section 8.0 2) DAQ practice
Replace DFU’s As needed 1 and 3) DAQ T640X SOP Section 8.0 2) DAQ practice
SYSTEMATIC CRITERIA - PM2.5, PM10 and PM10-2.5 Continuous T640X, Local Conditions
Siting 1/365 days and 1/calendar year
meets siting criteria or waiver documented
1) 40 CFR Part 58 Appendix E, sections 2-6 2) Recommendation (See DAQ Annual Network Review SOP) 3) 40 CFR Part 58 Appendix E, sections 2-6
Data Completeness 24-hour averages ≥ 75 percent 40 CFR Part 50, Appendix N, Section 4.1 (b) 4.2 (a)
Reporting Units all hourly and 24-hour values µg/m3 at ambient temperature/pressure (PM2.5)
1. 2 and 3) 40 CFR Part 50, Appendix N, Section 3.0 (b)
Rounding convention for data reported to AQS all 1-hour averages
to one decimal place, with additional digits to the right
being truncated
1. 2 and 3) 40 CFR Part 50, Appendix N, Section 3.0 (b)
Annual 3-yr average all concentrations nearest 0.1 µg/m3 (≥ 0.05 round up)
1,2 and 3) 40 CFR Part 50, Appendix N, Section 3 and 4 Rounding rule for AQS data is a recommendation

QAPP for the DAQ PM Monitoring Program Revision 2 8/8/2019
Page 78 of 160
Table 11. Measurement Quality Objectives: PM2.5, PM10 and PM10-2.5 (Continuous T640X Local Conditions) – Continued 1) Criteria (PM T640X LC) 2) Frequency 3) Acceptable Range Information /Action
24-hour, 3-year average all concentrations nearest 1 µg/m3 (≥ 0.5 round up)
1,2 and 3) 40 CFR Part 50, Appendix N, Section 3 and 4 Rounding rule for AQS data is a recommendation
Precision Single analyzer (collocated monitors) 1/91 days. CV ≤ 10 percent for values > 3
µg/m3 1, 2 and 3) Recommendation to provide early (quarterly) evaluation of achievement of DQOs.
Primary Quality Assurance Organization Annual and 3 year estimates
90 percent confidence limit of CV* < 10.1 percent for values ≥
3.0 µg/m3
1, 2 and 3) 40 CFR Part 58, Appendix A, Section 4.2.1 and 2.3.1.1.
Bias
Performance Evaluation Program (PEP)
8 valid audits per year for PQAO/each PQAO primary
monitor audited every 6 years
<±10.1 percent for values ≥ 3.0 µg/m3
1,2 and 3) 40 CFR Part 58, Appendix A, Section 3.2.4, 4.2.5 and 2.3.1.1
Field Activities
Flow Rate Transfer Standard
Every 365 days and once a year
< ± 2.1 percent of NIST-Traceable Standard
1) 40 CFR Part 50, Appendix L, Section 9.1 and 9.2 2) Method 2-12 Section 4.2.2 and 6.4.3 3) 40 CFR Part 50, Appendix L, Section 9.1 and 9.2
Field Thermometer Every 365 days and once a year
± 0.1° C resolution, ± 0.5° C accuracy 1, 2 and 3) Method 2.12 Section 4.2.2
Field Barometer Every 365 days and once a year
± 1 millimeter mercury resolution, ± 5 millimeters
mercury accuracy 1, 2 and 3) Method 2.12 Section 4.2.2
Field Manometer Every 365 days and once a year
± 0.1 inches water resolution, ± 1.0 inch water accuracy 1, 2 and 3) Method 2.12 Section 4.2.2
Clock/timer Verification 1/30 days ± 1 minute/month 1and 2) Method 2.12 Table 3-1 3) 40 CFR Part 50, Appendix L, Section 7.4.12

QAPP for the DAQ PM Monitoring Program Revision 2 8/8/2019
Page 79 of 160
Table 12. Measurement Quality Objectives: PM10 (Continuous T640X STP)
Note: At the time of the revision of this QAPP, EPA has not yet provided an approved MQO table for the T640 series of monitors. At the time when such tables become available, the DAQ will adopt the criteria therein as its own. 1) Criteria (PM T640X STP) 2) Frequency 3) Acceptable Range Information /Action
CRITICAL CRITERIA - PM10 Continuous T640X, STP
Sampler/Monitor Not applicable
meets requirements listed in FRM/FEM designation
Confirm method designation on front panel or just inside
instrument
1) 40 CFR Part 58, Appendix C, Section 2.1 2) Not applicable 3) 40 CFR Part 53 and FRM/FEM method list
PM10 Inlet At setup
Must be a Louvered PM10 size selective inlet as specified in 40 CFR
Part 50, appendix L, Figures L-2 through L-19
1, 2 and 3) 40 CFR Part 50, Appendix L, Figures L-2 through L-19
Average Flow Rate every 24 hours of
operation, each hour can be checked
average within 10 percent of 5.0 LPM for sample flow, average
within 5 percent of 11.67/16.67 LPM for bypass/total flow
1, 2 and 3) DAQ T640X SOP, Section 7.0
Variability in Flow Rate every 24 hours of operation CV* ≤ 2 percent 1, 2 and 3) 40 CFR Part 50, Appendix L, Section
7.4.3.2
One-point Flow Rate Verification
Every 30 days, each separated by 14 days (DAQ goal is 2/month separated by 14 to 18
days)
± 10 percent of standard for main flow
± 5 percent of standard for bypass/total flow
1 and 2) 40 CFR Part 58, Appendix A, Section 3.3.1 and DAQ T640X SOP, Section 7.0
3) 40 CFR Part 50, Appendix L, Section 9.2.5 and 7.4.3.1 and 40 CFR Part 58, Appendix A Section 3.2.3 and 3.3.2 and DAQ T640X SOP, Section 7.0
OPERATIONAL CRITERIA - CRITICAL CRITERIA - PM10 Continuous T640X, STP Routine Verifications
Mid-Month Flow Rate Verification 1/30 days
± 10 percent of standard for main flow
± 5 percent of standard for bypass/total flow
1) 40 CFR Part 50, Appendix L, Section 9.2.5 2) Recommendation 3) DAQ T640X SOP, Section 7.0

QAPP for the DAQ PM Monitoring Program Revision 2 8/8/2019
Page 80 of 160
Table 12. Measurement Quality Objectives: PM10 (Continuous T640X STP)– Continued 1) Criteria (PM T640X STP) 2) Frequency 3) Acceptable Range Information /Action
Temperature Verification 1/30 days <± 2.1°C 1) 40 CFR Part 50, Appendix L, Section 9.3 2) Recommendation 3) DAQ T640X SOP, Section 7.0
Pressure Verification 1/30 days <± 10.1 millimeters mercury 1) 40 CFR Part 50, Appendix L, Section 9.3 2) Recommendation 3) DAQ T640X SOP, Section 7.0
Leak Check every 30 days 0.0 µg/m3
1) 40 CFR Part 50, Appendix L, Section 7.4.6.1 2) Recommendation 3) DAQ T640X SOP, Section 7.0. DAQ designates this as an operational criterion.
Annual Multi-Point Calibrations
Pressure Calibration
On installation, electromechanical
maintenance or transport or 1/365
days and 1/calendar year
<+ 10.1 millimeters mercury
1) 40 CFR Part 50, Appendix L, Section 9.3 2 and 3) Method 2.12, section 6.5 Barometric pressure verified against an independent standard verified against a laboratory primary standard that is certified NIST-traceable 1/365 days
Flow Rate Multi-Point Calibration
Electromechanical maintenance or transport or 1/365 days and 1/calendar year
<+ 2.1 percent of transfer standard for all flows
1) 40 CFR Part 50, Appendix L, Section 9.2. 2) 40 CFR Part 50, Appendix L, Section 9.1.3, Method 2.12 Table 6-1 3) 40 CFR Part 50, Appendix L, Section 9.2.5
Accuracy Temperature Audit 1/90 days ± 2°C 1, 2 and 3) Method 2.12, Section 11.2.2 Pressure Audit 1/90 days ±10 millimeters mercury 1, 2 and 3) Method 2.12, Section 11.2.3
Semi-Annual Flow Rate Audit 1/90 days
± 10.1 percent of standard for main flow, ± 5.1 percent of
standard for bypass/total flow
1 and 2) 40 CFR Part 58, Appendix A, Section 3.3.3 3) Method 2.12 Section 11.2.1
Monitor Maintenance

QAPP for the DAQ PM Monitoring Program Revision 2 8/8/2019
Page 81 of 160
Table 12. Measurement Quality Objectives: PM10 (Continuous T640X STP) – Continued 1) Criteria (PM T640X STP) 2) Frequency 3) Acceptable Range Information /Action
Clean PM10 Head Every 30 days cleaned 1) DAQ T640X SOP Section 8.0 2) DAQ practice 3) DAQ T640X SOP Section 8.0
Empty Water Collection Bottle Every 30 days cleaned
1) DAQ T640X SOP Section 8.0 2) DAQ practice 3) DAQ T640X SOP Section 8.0
Inspect O-rings Every 30 days Visual inspection 1) DAQ T640X SOP Section 8.0 2) DAQ practice 3) DAQ T640X SOP Section 8.0
Clean Temperature Probe Solar Shield 1/90 days cleaned
1) DAQ T640X SOP Section 8.0 2) DAQ practice 3) DAQ T640X SOP Section 8.0
Clean Optical Chamber 1/182 days cleaned or changed 1) DAQ T640X SOP Section 8.0 2) DAQ practice 3) DAQ T640X SOP Section 8.0
Internal/External Data Logger Data
Every month highest value on three
randomly selected days
agree exactly (digital) and ± 1 µg/m3 (analog)
1) DAQ T640X SOP Section 9.0 2) DAQ practice 3) DAQ T640X SOP Section 9.0
ASC Test 1/30 days heater turns on when forced off 1) DAQ T640X SOP Section 8.0 2) DAQ practice 3) DAQ T640X SOP Section 8.0
Check Pump Performance As needed 1) DAQ T640X SOP Section 8.0
2) DAQ practice 3) DAQ T640X SOP Section 8.0
Replace DFU’s As needed 1 and 3) DAQ T640X SOP Section 8.0
2) DAQ practice
SYSTEMATIC CRITERIA - CRITICAL CRITERIA - PM10 Continuous T640X, STP

QAPP for the DAQ PM Monitoring Program Revision 2 8/8/2019
Page 82 of 160
Table 12. Measurement Quality Objectives: PM10 (Continuous T640X STP) – Continued 1) Criteria (PM T640X STP) 2) Frequency 3) Acceptable Range Information /Action
Siting 1/365 days and 1/calendar year
meets siting criteria or waiver documented
1) 40 CFR Part 58 Appendix E, sections 2-6 2) Recommendation (See DAQ Annual Network Review SOP) 3) 40 CFR Part 58 Appendix E, sections 2-6
Data Completeness 24-hour averages and quarterly
≥ 75 percent of hours per day and scheduled sampling days in each
quarter
1, 2 and 3) 40 CFR Part 50, Appendix K, Section 2.3 (a)
Reporting Units all hourly and 24-hour values µg/m3 at STP 1, 2 and 3) 40 CFR Part 50, Appendix K
Rounding convention for data reported to AQS all 1-hour averages
to one decimal place, with additional digits to the right being
truncated
1, 2 and 3) 40 CFR Part 50, Appendix N, Section 3.0 (b)
Rounding rule for AQS data is a recommendation Rounding Convention for design value calculation
24-hour, 3-year average all 24-hour averages nearest 10 µg/m3 (≥ 5 round up)
1, 2 and 3) 40 CFR Part 50, Appendix K, Section 1 The rounding convention is for averaging values for comparison to the NAAQS and not for reporting individual values to AQS.
Precision (using flow rate verifications – no collocation is required for continuous PM10) Primary Quality Assurance Organization
Annual and 3 year estimates
Upper 90 percent confidence limit of CV* < 10.1 percent
1, 2 and 3) 40 CFR Part 58, Appendix A, Section 4.2.2, 3.3.1 and 2.3.1.1.
Bias (using flow rate verifications – no NPAP or PEP is available for PM10) Primary quality assurance organization
Annual and 3-year estimates ≤ ±10.0 percent for total bias 1, 2 and 3) 40 CFR Part 58, Appendix A, Section
2.3.1.1, 4.2.2 and 3.3.1 Field Activities
Flow Rate Transfer Standard Every 365 days and once a year
< ± 2.1 percent of NIST-Traceable Standard
1) 40 CFR Part 50, Appendix J Section 7.3 2) Method 2.11 Section 1.1.3 3) 40 CFR Part 50, Appendix J Section 7.3
Field Thermometer Every 365 days and once a year
± 0.1° C resolution, ± 0.5° C accuracy 1, 2 and 3) Method 2.12 Section 4.2.2

QAPP for the DAQ PM Monitoring Program Revision 2 8/8/2019
Page 83 of 160
Field Barometer Every 365 days and once a year
± 1 millimeter mercury resolution, ± 5 millimeters mercury accuracy 1, 2 and 3) Method 2.10 Section 1.1.2
Field Manometer Every 365 days and once a year
± 0.1 inches water resolution, ± 1.0 inch water accuracy 1, 2 and 3) Method 2.12 Section 4.2.2
Clock/timer Verification 1/30 days ± 1 minute/month 1 and 2) Method 2.12 Table 8-1 3) 40 CFR Part 50, Appendix L Section 7.4.12

QAPP for the DAQ PM Monitoring Program Revision 2 8/8/2019
Page 84 of 160
8.0 Training Requirements Adequate education and training are integral to any PM monitoring program that strives for reliable and comparable data. The DAQ and WNC personnel will meet the educational requirements, accountability standards and training requirements for their positions. The DAQ requires all staff to take specific, mandatory governmental training courses, such as safety training, defensive driving and harassment awareness courses, among others. The DAQ and WNC maintain records on personnel qualifications and training in several locations, dependent upon the applicability of the information. For example, staff may maintain copies of certificates received from classes or workshops, whereas human resources will keep records of personnel qualifications.
The DAQ PM monitoring program pursues training that increases the effectiveness of employees as well as the efficacy of DAQ as a whole. In general, training for the PM monitoring program consists of a combination of required reading, the monthly ambient monitoring workgroup call, active cross-training amongst staff, completion of EPA-led training classes and attendance at DAQ and EPA workshops and conferences. Observations made during internal systems audits or EPA TSAs may result in the need for specific refresher training provided by the DAQ staff.
Concerning required reading, documents that PM monitoring personnel must read shall include this QAPP, SOPs (see Table 17), EPAs Quality Assurance Guidance Document 2.12, and instrument-specific manuals for the equipment personnel will be working with or servicing. Employee supervisors may document required reading on a form indicating the employee has read and understood the PM QAPP or SOPs. Alternatively, the employee will document training in the North Carolina Learning Management System (LMS). Employees will also document reading of the PM QAPP and SOPs in the employee Value in Performance (VIP) management system; however, at the time of this QAPP revision the DAQ is working with DEQ management to develop alternate procedures.
The DAQ and WNC supervisors actively encourage all employees to pursue training opportunities whenever possible and as needed, since the chief continually evaluates DAQ’s PM monitoring network to ensure it continues to meet its objectives. Because of these evaluations, the chief could add new equipment, procedures or new personnel to the PM monitoring plan. The DAQ provides vendor based training for its personnel when obtaining new equipment. The employees document this training in the LMS.
Additionally, personnel are encouraged to periodically identify, request, and attend pertinent courses and seminars. The DAQ may provide these courses and seminars in a variety of formats, including web based real-time interaction, videotapes, closed circuit transmissions and/or live instruction. Organizations that provide these training opportunities include local and regional universities, the Air and Waste Management Association, the Mid Atlantic Regional Air Management Association and EPA. The DAQ supervisors also may track and document this form of training in both the LMS and VIP.
The DAQ PM monitoring staff, along with the DAQ PM Laboratory Staff, provide new personnel the necessary on the job training for their individual monitoring responsibilities. Most on the job training

QAPP for the DAQ PM Monitoring Program Revision 2 8/8/2019
Page 85 of 160
consists of mentoring or apprentice style training for new or reassigned employees by their mentor or trainer prior to allowing them to perform the task on their own.
The chief invites the regional monitoring technicians and coordinators and WNC monitoring staff to the DAQ ambient monitoring workshop held each year. This workshop provides an opportunity to discuss and train on PM monitoring and challenge the QC and QA processes to ensure the collection of valid data. The vendor provides training when DAQ purchases new PM monitors and other equipment. The DAQ and the knowledgeable and talented staff EPA also provides training annually during the ambient monitoring workshop.
All positions have a training guide that provides suggested training for the employee to complete for competency in that position. The DAQ makes efforts to ensure all employees receive timely training and periodic refreshers in accordance with the established training guide. Experienced staff members provide on-the-job training. As the RRO has the largest ambient monitoring staff with the most diversified monitoring equipment, the chief and supervisors often call upon the RRO to provide hands-on training when needed. The chief or one of the supervisors typically arranges this training. In some cases, the chief or one of the supervisors calls upon other regional offices, the ECB and RCO chemists to provide hands-on training.
DEQ - DAQ Training Links
Air Monitoring: http://www.epa.gov/ttn/amtic/training.html Professional Skills: http://oshr.nc.gov/state-employee-resources/training

QAPP for the DAQ PM Monitoring Program Revision 2 8/8/2019
Page 86 of 160
9.0 Documentation and Records The following information describes DAQ’s management of documents and records, including this QAPP, for the DAQ and WNC PM monitoring program. The chief must approve QAPP and SOP revisions, including changes to forms, before monitoring personnel use them. The DAQ also ensures sufficient document control of all of these records. Additionally, SOPs must not conflict with any part of this QAPP or with any other relevant local, state or federal regulation.
Table 13 lists the documents and records pertaining to all data that the EPA requires the DAQ PM monitoring program to collect, and all other data deemed important by DAQ’s policies and records management procedures, including documents and records required to support the concentration data reported to EPA.
Table 13. Documentation and Records Information
Categories Record/Document Type File Locations
Management and Organization
State Implementation Plan Reporting agency information EPA directives Grant allocations Support contracts
Raleigh, NC – Raleigh Central Office, WNC Office
Quality Management Plan DEQ Website
Organizational structure Ambient Monitoring
Administration Page on SharePoint
Personnel qualifications and training DEQ HR and DAQ Training page on SharePoint , WNC Office
Training records and certification Learning Management System
and Value In Performance, WNC Office
Site Information
Network descriptions Site files Site maps Site pictures
Raleigh Central Office group drive, Regional Office group drives, IBEAM General Documents Module, WNC Office
Environmental Data Operations
Quality Assurance Project Plans Standard Operating Procedures
DEQ Website for official repository. Other file locations include IBEAM General Documents Module, NC Ambient Monitoring Section QAPP page on SharePoint or Raleigh Central Office group drive (see below)

QAPP for the DAQ PM Monitoring Program Revision 2 8/8/2019
Page 87 of 160
Table 13. Documentation and Records Information
Categories Record/Document Type File Locations
Field and site notebooks
Raleigh Central Office group drive, Regional Office group drives, WNC Office, individual PM monitoring sites
Inspection/Maintenance Records Raleigh Central Office group drive, Regional Office group drives, WNC Office, ECB Office
Raw Data
Any original data (routine and QC) Including data entry forms Weights Original lab Excel spreadsheet Lab RH and temperature data
Raleigh, NC – Raleigh Central Office, Regional Offices, ECB Office, WNC Office Raleigh Central Office Weigh Lab
Data Reporting
Air Quality Index Reports DAQ Website, IBEAM General Documents Module
Annual Data Certification Report IBEAM General Documents Module
Data/summary reports DAQ Website, IBEAM General Documents Module
Journals/articles/papers/presentations Raleigh Central Office group
drive, IBEAM General Documents Module
Data Management
Data algorithms Data Management Plans/Flowcharts Data Management Systems
Raleigh Central Office
Pollutant data Envista ARM database
Traffic data Raleigh Central Office group drive, Regional Office group
drives, ECB, WNC Office
Quality Assurance
Network reviews Control charts Certification documentation Data Quality Assessments Quality Assurance Reports Technical Systems Audit reports Internal systems audit reports Response/corrective action reports Site audits Emails related to QA activities and assessments
Raleigh Central Office, Regional Offices, WNC Office
IBEAM General Documents
Module

QAPP for the DAQ PM Monitoring Program Revision 2 8/8/2019
Page 88 of 160
As of this QAPP revision, the State of North Carolina considers all emails as official records and retains all email correspondence for a minimum of 10 years. In addition, DAQ archives in IBEAM critical emails for documenting official decisions regarding network and data quality decisions.
The majority of documentation and records produced by DAQ’s PM monitoring program consist of data and information gathered to support the data collection activities. Documentation and records include:
• QAPPs; • SOPs, • Logbooks and data collection records in electronic and written format, • Instrument and equipment calibration information, • QA documentation in electronic and written format and • Documentation that supports data review, validation and certification activities.
Section 19.0 Data Management contains detailed information regarding how DAQ will manage data from the PM monitoring program, including information on data recording, transmittal, storage and retrieval.
9.1 Statewide Policy and Procedure Documentation
The DAQ maintains records of program policy and procedure documentation. The DAQ publishes documents in this category with the date and revision information clearly noted, generally in a document header. Documents in this category include:
• QAPPs, • SOPs, • Electronic QA/QC data forms that technicians must document, and • QA and technical notes, which provide air monitoring policy interpretations or best practices.
As of this QAPP revision, DAQ is in the process of revising the document and record storage procedures and locations. The DAQ currently uses IBEAM for an internal locale for new and past revisions of SOPs and QAPPs. In IBEAM documents that are archived are marked as *OBSOLETE* in the title so that staff know not to use them for procedures. The QAM or his designee is responsible for changing the title to *OBSOLETE* when a new version is approved. The DEQ website is the official DAQ repository for controlled documents, i.e., current approved versions. All other documents not on the website are uncontrolled and therefore not considered official.
In addition, at the time of this QAPP revision, DAQ uses the group drive and SharePoint as repositories for working documents. Draft documents will be watermarked as *DRAFT* so that no confusion arises as to the finality of an SOP. The QAM or designee receives final versions for review and approval. Once the chief and other signatories sign the QAPPs and SOPs, the QAM or designee will ensure that someone uploads the documents to the website and IBEAM. The QAM will notify staff of the issuance of the new

QAPP for the DAQ PM Monitoring Program Revision 2 8/8/2019
Page 89 of 160
document via email and on the next ambient monitoring work group call. The chief and RCO chemists will revise these procedures to streamline them and will revise the QAPP when they implement the new framework.
9.2 Data Collection Records and Logbooks
Table 13 lists the documents and records the DAQ and WNC must retain. The appropriate sections of this QAPP will discuss the details of these various documents and records. The DAQ will collect all raw data required for calculations, the submissions to the AQS database and QA/QC data electronically or on data forms included in the field; see Section 11.0 Sampling Methods Requirements.
All Regional Monitoring Staff, Regional Monitoring Coordinators, Central Office PM Chemist and other DAQ and WNC personnel, shall fill out hardcopy information in indelible ink. They shall make corrections by inserting one line through the incorrect entry, initialing and dating this correction and placing the correct entry alongside the incorrect entry, if they can accomplish this legibly, or by providing the information on a new line if the above is not possible.
9.2.1 Logbooks and Forms
The Regional and WNC Monitoring Staff will be responsible for obtaining, maintaining and documenting the appropriate logbooks or associated QA/QC data forms. Each variety of PM monitor has a rolling e-log, created for that specific monitor type. After each use, the Regional and WNC Monitoring Staff document any QA and QC activities, site status and other actions before saving them to a storage device such as a laptop computer. From the laptop computer, the Regional and WNC Monitoring Staff will transfer the e-log to the Regional Office SharePoint drive. The Regional and WNC Monitoring Staff will use these e-logs to record information about the site operations, as well as document routine operations.
Completion of e-logs, instrument maintenance logbooks and 109 forms associated with all routine environmental data operations, are required even when the site logbooks contain all appropriate and associated information required for the routine operations performed.
- Field Logbooks – The DAQ uses a combination of bound paper and/or e-logs for record keeping for each sampling site, sampling instrument, specific program or individual. Each paper logbook should be hardbound and paginated. The DAQ uses paper logbooks to document site visits and other activities, including who is at a site, when and why. Every visitor must sign the site logbook. The e-logs capture monitor maintenance and QA/QC activities, including calibrations.
- Lab Logbooks – A combination of bound paper logbooks and electronic databases exist in which the state laboratory retains all records pertaining to PM gravimetric analysis.
At the time of this QAPP revision, DAQ is in the process of developing logbooks that meet EPA’s guidance for electronic records.
QAPP for the DAQ PM Monitoring Program Revision 2 8/8/2019
Page 90 of 160
9.2.2 Chain of Custody
The PM network collects PM samples from the sequential samplers and ships them to the DAQ gravimetric laboratory for analysis. The DAQ retains COC records at the RCO and at the DAQ regional and WNC offices. Currently, the laboratory analyst sends a batch COC form with each consignment of filters to the DAQ regional and WNC offices.
The DAQ regional and WNC offices retain the PM laboratory batch COC forms. In addition, the regional monitoring technicians produce a departure COC form when returning the sampled filters. The regional monitoring technicians retain copies of these departure COC forms at the DAQ regional and WNC offices. For more about COC see Section 12.0 Sample Handling and Custody. Please note that COC procedures are under revision at the time of the writing of this QAPP.
9.2.3 Electronic Data Collection
Certain instruments can provide an automated means for collecting information that the DAQ regional or WNC monitoring technicians would otherwise record on data entry forms. Section 19.0 Data Management details information on these systems. To reduce the potential for data entry errors, the DAQ will use automated systems where appropriate and will record the same information the DAQ regional and WNC monitoring technician would record on data entry forms. To provide a backup, the RCO statistician and chemists will store electronic copies of the automated data collection information (daily poll) for 5 years on the group drive. Electronic backup copies of automated data collection information will also be stored on the site computers and in the western data center operated by the DIT. The chief and database manager are currently reviewing this collection process and will revise the QAPP when they implement a new process.
9.3 QA/QC Records The DAQ achieves QA/QC through the performance of periodic activities such as:
• EPA TSAs, • Internal systems audits, • Verification/calibration procedures, • Maintenance activities, • Annual performance evaluations, • EPA performance audits such as the PEP, • Traceability certifications and calibrations, and • Corrective actions.
The EPA and DAQ document TSAs and internal systems audits in the form of written reports. The DAQ typically documents and maintains most of the other QA/QC activities using a variety of methods, including emails, Excel spreadsheets used as electronic logbooks, fillable PDF data forms, worksheets and data management systems such as Envidas and Envista ARM. The associated SOPs describe the use of these methods to create air monitoring QA/QC records. The DAQ and WNC retain and archive these records according to the procedures identified in Section 9.5 Data Archiving and Retrieval. The DAQ and WNC correct records by crossing out the incorrect information with a single line and entering the correct

QAPP for the DAQ PM Monitoring Program Revision 2 8/8/2019
Page 91 of 160
information followed by the person’s initials or by creating a new form with the correct information and retaining both forms on the RCO group drive. The regional monitoring technician or coordinator names the revised document following naming conventions in the operator SOPs.
The vendors typically provide the certificates of calibration that accompany flow transfer standards in paper format. The regional monitoring coordinators store these certifications at the regional offices and in IBEAM. The DAQ is currently reviewing this record retention process and will revise the QAPP when a new process is implemented.
Records of certification for the weigh lab (e.g. IR temperature guns, RH monitors, weight standards) are to be retained at the weigh lab and made available upon request. Data in the weights original Excel spreadsheet is housed here as well. At the time of this QAPP revision, DAQ is in the process of developing its QA/QC oversite of the lab. Results of future internal audits and weigh session data validation will be retained at the lab.
9.4 Reference Materials
Because of the technical nature of PM monitoring, DAQ requires numerous reference materials to administer the PM monitoring program effectively. This category includes publications such as instrument operation manuals, troubleshooting guides, EPA guidance documentation, EPA technical memoranda and various other reports. The DAQ maintains access to applicable reference materials as long as the DAQ and WNC have an administrative need for them. DAQ retains these documents at the RCO, in the IBEAM general documents module, or on the RCO SharePoint drive.
9.5 Data Archiving and Retrieval
The DAQ classifies documentation according to its intended use, future applicability and regulatory requirement for retention. The DAQ will retain all the information listed in Table 13 for four complete calendar years from the date of collection in accordance with 2 CFR Section 200.333. However, if any litigation, claim, negotiation, audit or other action involving the records has been started before the expiration of the four-year period, the DAQ will retain the records until completion of the action and resolution of all issues that arise from it, or until the end of the regular four-year period, whichever is later.
The DAQ stores electronic records within the data management systems located at the PM monitoring sites, or Envidas, the RCO, or Envista ARM, and on network servers in the regional and WNC offices. The DIT backs up data stored in Envista ARM as well as records on the network server in the RCO and regional offices nightly and stores these back-ups off-site. The database manager regularly backs up the Envista ARM database to SharePoint. Similarly, records that are stored in IBEAM, including the weights original spreadsheet, are also backed-up off-site nightly. Section 19.7 Data Storage and Retrieval provides more details on the Envista ARM archival process.

QAPP for the DAQ PM Monitoring Program Revision 2 8/8/2019
Page 92 of 160
10.0 Network Description The primary function of the PM monitoring program is to verify compliance with the NAAQS in highly populated areas throughout the state. Other purposes for the program possibly include (1) determining trends over time, (2) determining effects on air quality from adjustments to source emissions, (3) verifying air quality modeling programs, (4) providing real-time pollutant data to the public and (5) correlating health effects to air quality levels.
Sampling network design and monitoring site selection comply with the following appendices of 40 CFR Part 58:
- 40 CFR Part 58, Appendix A - Quality Assurance Requirements for Monitors Used in Evaluations of National Ambient Air Quality Standards
- 40 CFR Part 58, Appendix D - Network Design Criteria for Ambient Air Quality Monitoring - 40 CFR Part 58, Appendix E - Probe and Monitoring Path Siting Criteria for Ambient Air Quality
Monitoring - 40 CFR Part 58, Appendix G – Uniform Air Quality Index (AQI) and Daily Reporting
10.1 Network Objectives
The DAQ director and chief designed the PM monitoring network to meet a minimum of six basic monitoring objectives. These basic monitoring objectives include determining:
- The highest concentrations expected to occur in the area covered by the network, - Representative concentrations in areas of high population density, - The impact of significant sources or source categories on ambient pollution levels, - General background concentration levels, - The extent of regional pollutant transport among populated areas and in support of
secondary standards, and - The welfare-related impacts in rural and remote areas (such as visibility impairment and
effects on vegetation).
The PM network may be comprised of one or more of the basic site types. A variety of factors, such as pollutant of interest, monitoring objective, geographic location, and meteorology, may determine the site type requirements for the PM network. The annual network-monitoring plan, available at this link, covers this specifically and in detail.
Data collected within the PM monitoring network must be representative of the spatial area under study. The goal in siting a monitoring station is to match the spatial scale represented by the samples obtained with the spatial scale most appropriate for the monitoring objective of the station. For a discussion of the representative measurement scale for the PM sites, see Section 7.6 Network Scale.

QAPP for the DAQ PM Monitoring Program Revision 2 8/8/2019
Page 93 of 160
10.2 Site Selection
The DAQ and WNC adhere to the site selection criteria specified in 40 CFR Part 58, Appendix D. The selection of a specific monitoring site includes the following activities:
- Developing and understanding the monitoring objective and appropriate DQOs; - Identifying the spatial scale most appropriate for the monitoring objective of the site; - Identifying potential locations where the monitoring site could be placed; and - Identifying the specific monitoring site.
The DAQ evaluates each monitoring site to assure it adheres to the site selection criteria specified in 40 CFR Part 58, Appendix E.
10.2.1 Site Location
The regional monitoring technicians and coordinators, ECB electronics technicians and RCO chemists consider four criteria when evaluating potential sites. Monitoring sites should be oriented to measure the following (singly or in combination as appropriate for the sampling objective):
- Impacts of known pollutant emission categories on air quality; - Population density relative to receptor-dose levels, both short- and long-term; - Impacts of known pollutant emission sources (area and point) on air quality; and - Representative air quality.
Selection per these criteria requires detailed information concerning the location of sources, geographic variability of ambient pollutant concentrations, meteorological conditions, and population density. Selection of the number, geographic locations, and types of sampling stations is, therefore, a complex process. The sampling site selection process also involves consideration of the following factors:
- Economics - The quantity of resources required to accomplish all data collection activities, including instrumentation, installation, maintenance, data retrieval, data analysis, QA, and data interpretation, must be established.
- Security - In some cases, a preferred location may have associated problems that compromise the security of monitoring equipment (i.e., high risk of theft, vandalism, etc.). If such problems cannot be remedied using standard measures such as additional lighting, fencing, etc., then an attempt to locate the site as near to the preferred location as possible shall be made.
- Logistics - This process includes procurement, maintenance, and transportation of material and personnel for the monitoring operation. The logistics process requires full knowledge of all aspects of the data collection operation: planning, reconnaissance, training, scheduling, safety, staffing, procuring goods and services, communications, and inventory management.
- Atmospheric Considerations - These considerations may include spatial and temporal variability of pollutants and their transport. Effects of buildings, terrain, and heat sources or sinks on air trajectories can produce localized anomalies of pollutant concentrations. The DAQ considers meteorology in determining the geographic location of a site as well as the

QAPP for the DAQ PM Monitoring Program Revision 2 8/8/2019
Page 94 of 160
height, direction, and extension of monitoring and sampling inlets. Evaluation of a local wind rose is essential to locate properly many monitoring sites (e.g., siting to either detect or avoid emissions from specific sources).
- Topography – The DAQ must complete evaluation of the local topography based upon land use maps, U.S. Geological Survey topographic maps, and other available resources. The DAQ must also identify and evaluate minor and major topological features that affect both the transport and diffusion of air pollutants. Minor features may include an adjacent tree lined stream or tall structures upwind or downwind of a point source, each of which may exert small influences on pollutant dispersion patterns. Major features include river canyons or deep valleys, mountain ranges, and large lakes. Major features significantly affect the prevailing wind patterns or create their own local weather such as katabatic or anabatic winds.
- Pollutant Considerations – The monitoring site location for a specific pollutant may or may not be appropriate for another pollutant. To determine the applicability of each site for a specific pollutant, the DAQ must evaluate the changes pollutants undergo temporally and spatially.
An interdependence exists between all the factors listed above. Consequently, the DAQ must employ an iterative procedure to select appropriate sites successfully that can provide the data necessary to accomplish the stated objectives of the project. In situations where the sites do not specifically meet the requirements necessary to obtain the project objectives, reevaluation of the site priorities may be necessary before the final monitoring site selection. Experience in the operation of air quality measurement systems; estimates of air quality, field, and theoretical studies of air diffusion; and considerations of atmospheric chemistry and air pollution effects make up the expertise required to select the optimum sampling site for obtaining data necessary to fulfill the monitoring objectives. The Ambient Monitoring Section shares these responsibilities amongst the Ambient Monitoring Section staff as well as with other DAQ staff.
10.2.2. Inlet Siting Criteria
General inlet siting criteria for PM monitors at the DAQ and WNC sites shall adhere to the requirements in 40 CFR Part 58, Appendix E.
The inlet is to be located from 2 to 15 m above the ground; 2 to 7 m above the ground for micro and middle scale, and near road monitoring. The inlet is to be more than 2 meter horizontally or vertically away from any supporting structures, and greater than 1 m from other monitoring inlets. Because of their ability to alter normal wind flow patterns and provide surfaces for particulate adsorption or discharge, a monitor inlet must be located greater than 10 m away from trees and shrubs. Also, the distance between the inlet and any obstruction must be at least twice the height that the obstruction extends above the probe. The ECB electronics technicians measure the tree to inlet distance from the drip-line, or outside edge of the crown, of any tree, not the trunk. For monitors operated at the same site for several years, it is best to allow some additional space for vegetation

QAPP for the DAQ PM Monitoring Program Revision 2 8/8/2019
Page 95 of 160
growth. Particulate matter sites should not be located in an unpaved area unless there is vegetative ground cover year round, so that the impact of wind-blown dusts will be kept to a minimum. The monitor must have unrestricted airflow in at least a 270° arc around the monitor. The arc must include the predominant wind direction for the season of maximum concentration. 40 CFR Part 58, Appendix E gives the required separation distance from the nearest traffic lane. The defined monitoring objective generally determines the placement of each monitor (continuous instrument) and sampler (intermittent or manual instrument). Thus, the ECB electronics technicians usually place monitors and samplers according to potential exposure to pollution. Due to the various factors discussed above, tradeoffs are often necessary to locate a site for collection of optimally representative data. Final placement of a monitor or sampler at a selected site is dependent on physical obstructions and activities in the immediate area. The ECB electronics technicians must place both the monitors and the samplers away from obstructions such as trees and fences to avoid their effects on airflow. To prevent sampling bias, airflow around monitor and sampler inlets must be representative of the general airflow in the area. In addition, the availability of utilities (i.e., electricity and cellular telephone services) is critical.
10.3. Sampling Frequency
The EPA establishes minimum sampling frequencies, which DAQ follows. In instances requiring every third, sixth or twelfth day sampling, the EPA requires specific sampling days so that the entire nation samples on the same day. Thus, the DAQ accomplishes this intermittent sampling by following a national sampling schedule published annually by the EPA.
The DAQ should take the minimum number of samples required for appropriate summary statistics. At least 75 percent of the total possible observations must be present before summary statistics are calculated. The exact requirements appear in Table 14. For filter-based PM 2.5 monitoring, DAQ follows EPA guidance for collecting makeup samples. Makeup samples can be collected either before the next scheduled sample or one week later. Table 15 provides the sampling schedule and frequency for each PM method.
Table 14. Requirements for Calculating Summary Statistics
Pollutant Completeness Requirement Time Frame PM10 75 Percent Per quarter
PM2.5 75 Percent
Hours per day for continuous monitors; days per quarter
4 Complete quarters per year

QAPP for the DAQ PM Monitoring Program Revision 2 8/8/2019
Page 96 of 160
Table 15. PM Sampling Schedule and Frequency
Pollutant Time Frame (Local Standard Time) Frequency Monitor Type PM10 Midnight to Midnight 24 hours a day / 7 days a week Continuous PM10 Midnight to Midnight 1 day in 6 days Filter Based PM2.5 Midnight to Midnight 24 hours a day / 7 days a week Continuous PM2.5 Midnight to Midnight 1 day in 3 days or 1 day in 6 days Filter Based
PM10-2.5 Midnight to Midnight 24 hours a day / 7 days a week Continuous
10.4. Rationale for the DAQ’s Particulate Matter Monitoring Networks
The primary rationale for the operation of the WNC and DAQ PM monitoring network is to determine compliance with the NAAQS and provide the public with information on current air quality in agreement with 40 CFR Part 58, Appendix D.

QAPP for the DAQ PM Monitoring Program Revision 2 8/8/2019
Page 97 of 160
11.0 Sampling Methods Requirements 11.1 Sample Methodology
In accordance with 40 CFR Part 58, Appendix C, Section 2.1, a criteria pollutant monitoring method used for making NAAQS decisions at a SLAMS site must be a reference or equivalent method. The WNC and DAQ PM monitoring program uses only EPA-approved FRM or FEM instrumentation for determining pollutant concentrations for NAAQS compliance determinations. An instrument that has received FRM or FEM status has been rigorously tested, in accordance with 40 CFR Part 53 requirements and found to meet (or be comparable to) the reference methods codified in 40 CFR Part 50. The AMTIC website (https://www3.epa.gov/ttn/amtic/criteria.html) provides the List of Designated Reference and Equivalent Methods, issued by the EPA Office of Research and Development, which provides the detailed specifications upon which a specific monitoring method has received its FRM or FEM status. The DAQ will operate each analyzer in accordance with these designation specifications. To ensure the monitors meet these specifications DAQ uses the criteria in the validation templates in Section 7.0. Table 16 lists the analyzers used in the DAQ PM monitoring network. The method for filter-based PM2.5 data collection is dual designated as a FRM and FEM method. The DAQ may use alternative non-FEM or non-FRM methods for Air Quality Index (AQI) reporting. Otherwise, the methods DAQ uses for measuring PM are FEMs.
Table 16. DAQ Particulate Matter Monitoring Network Analyzers
Pollutant Analyzer
AQS Method Codes
EPA Reference/Equivalence
PM2.5 local conditions, filter based
Rupprecht and Patashnick Partisol-Plus Model 2025 Sequential Air Sampler (with PM10 head and VSCC)
Thermo Model 2025 i Sequential Air Sampler (with PM10 head and VSCC)
145 RFPS-1006-145
PM2.5 local conditions, continuous
Met One BAM 1020 (with PM10 head and VSCC) Met One BAM 1022 (with PM10 head and VSCC)
Teledyne T640x (with PM10 head)
170 209 236
EQPM-0308-170 EQPM-1013-209 EQPM-0516-236
PM10 local conditions, continuous
Met One Instruments BAM 1020 (with PM10 head alone)
Teledyne T640x (with PM10 head)
122
238
EQPM-0798-122
EQPM-0516-238
PM10 STP, continuous
Met One Instruments BAM 1020 (with PM10 head and downtube)
Teledyne T640x (with PM10 head)
122
239
EQPM-0798-122
EQPM-0516-239
Acceptable PM2.5 AQI
Met One BAM 1020 (with PM10 head and VSCC) Met One BAM 1022 (with PM10 head and VSCC Met One BAM 1022 (with PM10 head and SCC)
733 733 171
Not a reference method

QAPP for the DAQ PM Monitoring Program Revision 2 8/8/2019
Page 98 of 160
Table 16. DAQ Particulate Matter Monitoring Network Analyzers
Pollutant Analyzer
AQS Method Codes
EPA Reference/Equivalence
PM10-2.5 , local conditions continuous
Met One BAM 1020 (one unit with PM10 head and VSCC paired with
a unit with PM10 head alone) Teledyne T640x (with PM10 head)
185
238
EQPM-0709-185
EQPM-0516-238
This subsection describes the sampling methods used in the DAQ PM monitoring network. The DAQ categorizes sampling methods for PM into two general categories:
- Intermittent sample collection (non-continuous or static) – A physical sample is collected using a monitoring device that passes ambient air through a filter, collects a sample in a container, or exposes a sample collection media to a sample stream. The sample containing media (i.e., filter) is then removed and analyzed via laboratory methods to identify and/or quantify the pollutant of interest.
- Real-time or near real-time sample analysis (continuous) – Physical samples are not collected. Instead, the analyzer itself performs “In situ” analysis of the composition of the sample using a specific methodology.
Additionally, the annual monitoring network plan at this link lists the instrument methods located at each monitoring station within the WNC/DAQ network.
This section provides a brief overview of the theories of operation of the various sampling methods used. The instrument manuals provide detailed descriptions of these principles for the specific analyzers, including theories of operation. The vendor provides copies of these manuals online. DAQ also maintains copies on the RCO group drives, SharePoint and Regional/WNC Office group drives.
11.1.1. Particulate Matter (Intermittent Filter-Based Operation)
The sequential air sampler provides a convenient means of collecting high quality samples of ambient PM. The EPA designed the sampler so agencies could install it at outdoor sampling locations without needing to install a shelter to protect it from the elements. It draws a PM-laden ambient air stream at a flow of 16.67 LPM through a sample inlet (that is size-selective for PM10), a secondary size-selective device (that is size-selective for PM2.5) and then through a pre-weighed 47 mm diameter filter with a pore size of 2 µm (volumetric flow is dependent on temperature and pressure). These pre-weighed weighed filters are in the air stream for a specified period time. The combination of flow and duration identify a controlled volume of air that passes through the filter. After sampling, the PM LAB analyst precisely weighs the filters once again, at the same humidity level as at the initial weighing. The resulting difference yields the mass trapped during sampling. Determining the amount of mass added and dividing by the volume of air filtered, yields a PM concentration averaged over the time the flow occurred.

QAPP for the DAQ PM Monitoring Program Revision 2 8/8/2019
Page 99 of 160
11.1.2. Particulate Matter (Continuous Operation, BAM)
A beta attenuation monitor (BAM) is composed of sensing and control units. The carbon 14 beta radiation source and glass-fiber filter tape, which form the heart of the sensing unit, combine in a measurement technique for making near-real-time direct measurement of particle mass collected on the filter tape. This measuring equipment can determine the fine changes in mass that accumulate on the filter tape as a constant stream of air passes through it. The ECB electronics technicians configure the Met One BAM 1020 to operate on 1-hour cycles. During this one-hour cycle, the unit makes two 8-minute beta measurements (one for the background or blank and one for the sample) and collects one 42-minute sample for a combined total of 58 minutes. The monitor uses the remaining 2-minutes of each hour for filter tape and nozzle movements. The combination of the difference between blank and sample radiation counts, coupled with the air’s known volumetric flow rate, yields an accurate method of determining the concentration of PM in the air. The equipment can calculate the 1-hour, 8-hour and 24-hour averages. The control unit employs a microprocessor system, flow control hardware, temperature and humidity sensors, transformers, power supplies and a software algorithm to determine when to advance the filter tape.
Initially, an inertial separator filters the air stream. The EPA designed the inertial separator specifically to eliminate particles with aerodynamic diameters either greater than 10 µm, or greater than 2.5 µm, depending upon the data EPA and North Carolina desires to collect. This equipment draws in 16.7 liters per minute, or LPM (1.0 cubic meters per hour) of air. After the air stream exits the inertial separator, the stream passes through a defined spot on the filter tape. The mass transducer is a radiation scintillation counter. The system measures the accumulated mass every hour. Information required for installing and maintaining the BAM PM monitor is available in SOP 2.37.1 and the Met One BAM 1020 Continuous PM Monitor manual.
The Met One Instruments Model BAM 1022 Continuous PM Monitoring System uses the principal of beta ray attenuation, just the same as the Met One Instruments Model BAM 1020. However, the Model 1022 the particle mass load is continuously monitored throughout the measurement cycle. The monitor uses the degree of beta ray attenuation to determine the mass of PM deposited on the filter tape. During sampling, the flow rate is precisely controlled. Having determined both mass and sample volume, the BAM 1022 calculates and reports the ambient PM concentration, expressed as μg/m3 or milligrams per cubic meter.
11.1.3. Particulate Matter (Continuous Operation, T640X)
The Model T640X PM Mass Monitor is an optical aerosol spectrometer that converts optical measurements to mass measurements by determining sampled particle size via scattered light at the single particle level according to Lorenz-Mie Theory. Briefly, the sampling head draws in ambient air, which is dried (i.e., brought below 35 percent RH) with the Aerosol Sample Conditioner (ASC) and moved into the optical particle sensor where scattered light intensity is measured to determine particle size diameter. The particles move separately into the T-aperture through an optically differentiated measurement volume homogeneously illuminated with polychromatic light. The polychromatic light

QAPP for the DAQ PM Monitoring Program Revision 2 8/8/2019
Page 100 of 160
source, an LED, combined with a 90 degree scattered light detection, achieves a precise and unambiguous calibration curve in the Mie range, resulting in a large size resolution.
Each particle generates a scattered light impulse detected at an 85 degree to 95-degree angle where amplitude (height) and signal length are measured; the amplitude of the scattered light impulse directly relates to the particle size diameter. The T-aperture and simultaneous signal length measurements eliminate border zone error, characterized by the partial illumination of particles at the border of the measurement range.
The T640x operates at 16.7 LPM and uses an EPA-approved PM10 inlet. The EPA approved this configuration as an FEM for PM10, PM2.5 and PM10-2.5 (North Carolina uses the T640X for all three). The T640 operates at 5.0 LPM with a TSP inlet. The EPA approved this configuration as an FEM for PM2.5; however, it also provides data (not approved as an FEM) for PM10 and PM10-2.5. The monitor reports sample volume in actual conditions by using the instrument’s ambient temperature and barometric sensor data.
11.2 Sample Collection Methodology
Table 17 lists the specific SOP titles used in the PM monitoring network.
Table 17. List of SOPs Associated with this Quality Assurance Project Plan
Section 2.3.3 Certification and Accuracy Check of Field Barometers and Thermometers, Revision 7, Nov. 1, 2011
Section 2.24.1 Particulate Matter 2.5 Standard Operating Procedures for the Electronics and Calibration Branch, Revision 2011, Jan. 1, 2011
Section 2.24.2 Particulate Matter 2.5 Standard Operating Procedures for Operators, Revision 2014, Jan. 1, 2014
Section 2.24.3 Particulate Matter 2.5 Standard Operating Procedures for Laboratory Responsibilities, Revision 2017, Jan. 1, 2017
Section 2.24.4 Particulate Matter 2.5 Standard Operating Procedures for Raleigh Central Office, Revision 1, Sept. 1, 2002
Section 2.37.1 Installation, Calibration and Maintenance Responsibilities of the Electronics and Calibration Branch for the Met One Instruments Beta Attenuation Monitor, Revision 0, Oct. 8, 2008
Section 2.37.2 Site Operator’s Responsibilities for the Operation of the Met One Instruments Beta Attenuation Monitor (BAM 1020) and BAM 1020 with Touch Screen Option, Revision 4, Jan. 1, 2015
Section 2.39 SOP for Preparing SOPs for the DAQ, Revision 0, Nov. 1, 2010 Section 2.41.3 Regional Office Polling and Data Review: Envidas set-up; Retrieval, Review, Correction
and Storage of Data; Report Submission; QA SOPs, Revision 0, March 31, 2018 Section 2.41.4 Data Review and Validation for Continuous Gaseous and Non-Speciated Particulate
Monitors, Raleigh Central Office Responsibilities, Revision 1.6, Oct. 15, 2014 Section 2.43 SOP for Completing the Annual Network Review for the DAQ, Revision 1, Aug. 7, 2015
BGI TetraCal Standard Procedures for Operators, Revision 2019 Thermo Scientific 2025i Standard Procedures for Operators, Revision 2019

QAPP for the DAQ PM Monitoring Program Revision 2 8/8/2019
Page 101 of 160
Table 17. List of SOPs Associated with this Quality Assurance Project Plan
Section 2.46.2 Met One BAM 1022 Standard Procedures for Operators, Revision 0, November 10, 2016
Section 2.61 SOP for Quarterly Completeness Data Review, Revision 0, February 27, 2019
11.2.1. Physical Collection
The physical collection of intermittent (i.e. filter based) samples, sample transport and preservation techniques adhere to the requirements of 40 CFR Part 50, Appendix L. Particulate matter data that are collected via continuous monitoring do not produce a physical sample, therefore no handling requirements are necessary.
11.2.2. Electronic Data Collection
Electronic data collection is possible for the continuous PM monitors through the network’s DAS, which is currently Envidas Ultimate and wireless modems. This equipment is in shelters where the DAS records the data history and the modems provide a path to download the data for analysis. The database manager configures the computer in the RCO or Western Data Center, managed by DIT, to connect automatically to the stations periodically to retrieve these data for analysis. Monitoring personnel can contact the stations manually to retrieve data, or determine the status of the systems.
For sites where the regional monitoring technicians operate sequential PM samplers, the regional monitoring technicians download data on a weekly basis and upload it to IBEAM. In the case of WNC, the WNC monitoring staff send the downloaded data to the RCO PM Chemist.
With both monitors and samplers, DAQ and WNC monitoring personnel can contact the stations manually to retrieve data or determine the status of the systems, if needed. Section 19.0 Data Management of this QAPP discusses this in more detail.
The Envista ARM data software automatically sends all data to AirNow-Tech and the IBEAM database for real time reporting of ambient concentrations and the AQI to the public via EPA’s AirNow website and the DEQ real-time web page.
11.3 Support Facilities
This subsection describes the monitoring shelters used in the DAQ PM monitoring network.
11.3.1 Monitoring Station Design
The monitoring station design must 1) encompass the operational needs of the equipment, 2) provide an environment that supports sample integrity, 3) allow the operator to service, and maintain the equipment safely and easily. The chief considers winter weather conditions during site selection to meet the station safety and serviceability requirements.
11.3.2 Shelter Criteria
The ECB electronics technicians should house the BAM 1020 in a cabinet shelter capable of fulfilling these requirements:

QAPP for the DAQ PM Monitoring Program Revision 2 8/8/2019
Page 102 of 160
- As is recommended by DAQ, the shelter temperature should be maintained between 28 and 32 degrees Celsius (°C);
- The power supply should not vary more than ±10 percent from 117 alternating current voltage. It is best to provide some type of voltage regulation to accomplish this;
- The shelter should protect the instrumentation from precipitation and excessive dust and dirt, provide third wire grounding as in modern electrical codes, meet federal Occupational Safety and Health Administration (OSHA) regulations, and be cleaned regularly to prevent a buildup of dust; and
- The shelter should protect the instrumentation from any environmental stress such as vibration, corrosive chemicals, intense light, or radiation.
Filter-based samplers and the BAM 1022 and T640x monitors, which operate unprotected from ambient conditions, do not require a shelter capable of fulfilling these requirements.

QAPP for the DAQ PM Monitoring Program Revision 2 8/8/2019
Page 103 of 160
12.0 Sample Handling and Custody The DAQ network collects PM2.5 samples from the sequential samplers and ships them to the DAQ gravimetric laboratory, where the lab analyst conducts the analysis following EPA regulations, and in accordance with this QAPP and SOP 2.24.3. Due to the potential use of data for comparison to the NAAQS and the requirement for extreme care in sample collection, the lab analyst and site operators must follow sample custody procedures. Figure 15 and Figure 16 present examples of the COC record forms used to track the stages of filter handling throughout the data collection operation. The PM LAB analyst supplies the site operators with these forms when necessary. The individual SOPs 2.24.2 and 2.24.3 detail custody procedures. At the time of this QAPP revision, the PM LAB analyst and RCO LAB QA chemist are modifying some of these procedures and streamlining them to provide a COC that is true, bona fide, unbroken COC.
Figure 15. Supply Chain of Custody (COC) Record Form for PM2.5 FRM Particle Samples

QAPP for the DAQ PM Monitoring Program Revision 2 8/8/2019
Page 104 of 160
Figure 16. Return Chain of Custody (COC) Record Form for PM2.5 FRM Particle Samples
12.1 Pre-Sample Custody The analyst initially equilibrates and weighs filters used for PM2.5 sampling in the gravimetric laboratory maintained by DAQ. Due to the small size of measured mass, the analyst takes extreme care to prevent contamination of the samples. The EPA provides filters used in the PM2.5 program. Upon receipt of the new filter lot each year, the DAQ analyst will inspect and test the filters, and then store them until needed for sampling. At that time, the filters will be conditioned and subsequently weighed. The lab analyst is responsible for documenting the laboratory conditions during the weigh sessions. The analyst documents filter conditioning data (e.g. weigh date, initial temperature mean, temperature control (i.e., standard deviation, or SD), initial relative humidity (RH) mean, RH control (SD), etc.).

QAPP for the DAQ PM Monitoring Program Revision 2 8/8/2019
Page 105 of 160
After the initial (tare) weighing, the analyst will prepare the PM2.5 filters for field use, including any blanks. The lab analyst will place filters into filter support cassettes, and then place the filters/cassettes into a sample magazine(s). The lab analyst then places the magazine(s) into a cooler and prepares the cooler for shipment to the regional offices and the WNC. The lab analyst provides a COC Record Form (Figure 16) with the shipment that contains the identification numbers for all filters in the magazine(s). The site operator signs and dates the COC upon receipt.
Regional and WNC monitoring staff inspect the FRM PM2.5 filters received from the DAQ Lab for possible shipping and handling damage or other atypical characteristics. The regional monitoring technicians do not use compromised or damaged filters to collect samples in the field. Evidence of compromised or damaged filters include visible damage noted on the filter substrate (e.g. - pinholes, rips, etc.), damage to the filter screen, or damage to the filter cassette. The regional monitoring technicians return compromised or damaged filters to the DAQ weighing laboratory.
12.2 Post-Sample Custody
Site operators collect PM2.5 samples using procedures outlined in the DAQ 2025 and 2025i PM2.5 SOPs. In general, site operators collect exposed PM2.5 samples from the FRM samplers in the field within 177 hours of sample collection. The regional monitoring technicians remove samples from the samplers in the protective magazines and then transfer the protective magazines into a cooler containing frozen blue ice packs (or equivalent). From there, the regional monitoring technicians take the samples to the regional or WNC office. Site operators observe the exposed filters for possible instrument processing or sample handling damage. They note compromised or damaged filters on the associated filter data sheet. If it is determined that damage to the filter is significant, such as a breach in the filter substrate, the sample is invalid.
Using the PM2.5 e-logs, the regional monitoring technicians prepare shipment reports for the filters going back to the laboratory, along with the completed and signed COC (The regional monitoring technician prints a separate shipment report for each individual filter shipped back to the laboratory, see Figure 16). However, if the regional monitoring technicians do not ship the filters back immediately, then they store the filters in a designated refrigerator in the regional or WNC office, along with the paperwork, until they do ship them. Table 7 of this QAPP provides filter-holding requirements for the samples.
When preparing the exposed samples for shipment, the site operator places a digital thermometer into the shipment cooler, along with the sample magazines (in their metal transport boxes), surrounded by frozen ice packs. The shipment report(s), signed by the operator, is included in the cooler. The regional monitoring technicians then seal the cooler with duct tape and address it to the DAQ PM LAB analyst. The regional monitoring technicians or coordinators ship the coolers via state courier (or equivalent) using overnight delivery service to the PM laboratory.
Upon receipt, the PM LAB analyst documents the date he or she received the samples and records the cooler shipment temperature using an IR gun to measure it. The PM LAB analyst will determine the analytical holding time based upon the shipment temperature. Filters are subsequently conditioned and prepared for weighing. Filter conditioning data (e.g. weigh date, final temperature mean, temperature control (SD), final RH mean, RH control (SD), etc.) are documented during the final weigh session. During this process, the PM LAB analyst also inspects samples for damage. He or she notes

QAPP for the DAQ PM Monitoring Program Revision 2 8/8/2019
Page 106 of 160
compromised or damaged filters and notifies the regional office or WNC regarding filters he or she deems as significantly affected by damage or other atypical characteristics. The PM LAB analyst also notifies the regional offices and WNC when the PM laboratory relative humidity and temperature data loggers record out-of-specification conditions in the PM laboratory. The PM LAB analyst provides filter-conditioning information, and other weigh session data, to the regional offices and the WNC in the form of a PM2.5 weigh lab summary Excel spreadsheet.
Regional monitoring technicians may miss scheduled samples due to a variety of situations including sampler malfunction; power outage; and filter problems, among others. Adequate numbers of PM2.5 measurements are important to maintain high data capture, in accordance with 40 CFR Part 50, Appendix N. Specifically, the EPA requires a minimum of 75 percent of scheduled samples per quarter to show that a site meets the standard. The EPA allows agencies to use replacement samples (i.e., make-ups) to help monitoring organizations achieve desirable data capture goals.
DAQ collects PM2.5 samples in accordance with the scheduled specified in 40 CFR Section 58.12. The national sampling scheduled is set each year by EPA. A “make-up” sample becomes a replacement for a scheduled day. The number of make-up samples permitted by EPA in any calendar quarter is limited to five samples. When make-up samples are necessary, site operators will document the reason why the original sample was invalidated. The following is the approach DAQ site operators will take when selecting the make-up sampling day. In all cases, the make-up sampling day must be no later than 1 week from the missed sampling day.
Preferred choice for make-up sampling day: Sample before the next scheduled sampling day.
- For monitoring sites sampling every sixth day, the preferred replacement day is the next scheduled every third-day sample. This provides the benefit of additional spatial resolution of network measurements and is likely to be most convenient for site operators. Otherwise, the EPA suggests a day closest to the missed sampling day.
- For monitoring sites sampling every third day, the EPA suggests the earliest possible day before the next scheduled sample at the monitoring site. Although there are only two possible make-up days with 1-in-3-day sampling, selection of a replacement day as close as possible to the missing day increases the chances of a replacement day with similar meteorological conditions.
Alternative approach: Sample one week later, on the same calendar day. This provides a replacement day on the same day of the week, thereby helping with temporal balance for the quarterly data set to reduce any potential day of the week effect of emissions.
12.3 Filter Archive
The PM LAB analyst archives the PM2.5 filters in a refrigerator in the DAQ laboratory for one year and then moves them to a DAQ indoor storage location for an additional four years.

QAPP for the DAQ PM Monitoring Program Revision 2 8/8/2019
Page 107 of 160
13.0 Analytical Methods In accordance with 40 CFR Part 58, Appendix C, Section 2.1, a criteria pollutant monitoring method used for making NAAQS decisions at a SLAMS site must be a reference or equivalent method. Towards that end, the DAQ uses only EPA-approved FRM or FEM instrumentation to measure criteria pollutants at the PM monitoring sites. Criteria pollutant analyzer methods that have received FRM or FEM status have been rigorously tested, in accordance with 40 CFR Part 53 requirements and found to meet or be comparable to the EPA reference methods codified in 40 CFR Part 50. The AMTIC website (https://www3.epa.gov/ttn/amtic/criteria.html) provides the List of Designated Reference and Equivalent Methods, issued by the EPA Office of Research and Development, which provides the detailed specifications upon which a specific monitoring method has received its FRM or FEM status. The DAQ will operate each analyzer in accordance with these designation specifications. To ensure the monitors meet these specifications DAQ uses the criteria in the validation templates in Section 7.0.
This section identifies the equipment and analytical methods required to complete the analyses of the samples obtained by the sequential samplers. Please note that continuous PM monitors do not generate physical samples that regional monitoring technicians send to a laboratory for analysis. The DAQ uses one analytical method for analyzing all filters collected using a sequential monitor: Appendix L to 40 CFR Part 50—Reference Method for the Determination of Fine Particulate Matter as PM2.5 in the Atmosphere.
13.1 Purpose/Background
The analytical method employed for PM evaluation is dependent upon the monitoring technology used. The PM2.5 FRM samples do require analytical methods to evaluate the captured sample to establish the pollutant concentrations present in the environment.
The low volume PM10, PM2.5 and PM10-2.5 FRM monitors employed for PM monitoring use gravimetric analyses. The Green Square laboratory will conduct these analyses. A filter’s net weight gain identifies the sample characteristic of interest, captured PM mass. The laboratory analyst obtains this net weight gain by subtracting the initial filter weight from the final weight of the exposed filter. Once calculated, the RCO PM chemist combines the net weight gain with the total filter volume to calculate the concentration for comparison to the daily and annual NAAQS. Since the method is non-destructive, and due to possible interest in sample composition (e.g., subsequent chemical analyses), the analyst archives the filters for a minimum of five years, after final gravimetric analyses has occurred.
13.2 Preparation of Samples
The analyst will follow 2.24.3 Particulate Matter 2.5 Standard Operating Procedures for Laboratory Responsibilities, Revision 2017, Jan. 1, 2017, outlining activities associated with preparing pre-sample batches. In addition to the primary and collocated sampler filters, field blanks, lab blanks, and trip blank filters will also be prepared as required in Appendix L, Section 8.3.7 of 40 CFR Part 50.

QAPP for the DAQ PM Monitoring Program Revision 2 8/8/2019
Page 108 of 160
Upon delivery of EPA-approved filters as specified in 40 CFR Part 50, Appendix L, Section 6, the analyst will document their receipt and store the filters in the conditioning/weighing room. The analyst will label each box of filters with the date of receipt, will open each box one at a time and use each box completely before opening another. The analyst will use all filters in a lot before opening a case containing another lot. The analyst will visually inspect filters according to SOP 2.24.3 Particulate Matter 2.5 Standard Operating Procedures for Laboratory Responsibilities.
13.3 Analysis Method for Gravimetric Samples
The DAQ uses an analytical instrument (analytical microbalance) that meets the requirements of 40 CFR Part 50, Appendix L, Section 8.1. An outside vendor sets up the microbalance when needed and calibrates it yearly under an ongoing maintenance contract.
The primary support facility for the DAQ and WNC gravimetric network is the filter conditioning and semi-clean weighing room at the Green Square laboratory. The DAQ uses this laboratory to conduct pre-exposure weighing and post-exposure weighing of each PM filter sample as required in Appendix L, Section 8.2 of 40 CFR Part 50.
The laboratory is an environmentally controlled room with temperature and humidity controls. The DAQ keeps the temperature between 20 and 23 °C and controls the RH between 35 and 40 percent. This RH range is not the criteria found in 40 CFR Part 58, Appendix L. The DAQ has opted for a set of constraints that are more rigorous than the requirements found in 40 CFR Part 58, Appendix L to provide an additional measure to meet the pre and post 5 percent pre and post RH. The DAQ measures and records temperature and RH every 5 minutes. The internally grounded analytical microbalance is located on a marble slab and is protected from or located out of the path of any sources of drafts. It is also collocated with an ionizing bar for additional static control measures.
13.4 Internal Quality Control and Corrective Actions for Measurement Systems
A QC notebook or an Excel spreadsheet (with backups) will be maintained which will contain QC data, including the microbalance calibration and maintenance information, routine internal QC checks of mass reference standards and laboratory and field filter blanks, and external QA audits. These data will duplicate data recorded on chain-of-custody laboratory data forms but will consolidate them so long-term trends can be identified.
At the beginning of each weighing session, for both filter pre-sampling weigh and post-sampling weigh, the analyst will zero and calibrate the analytical balance and weigh the working standards before the filters. The analyst will weigh one lab blank and one field blank for every 10 pre-samples weighed. The analyst will weigh a minimum of one lab and one field blank per each pre-weighing session. The balance will be re-zeroed between each pre or post-weighing. After every tenth filter weighing, the analyst will reweigh one of the working standards. The analyst will record the zero, working standard and blank measurements in the laboratory QC Excel spreadsheet. If the working standard measurements differ from the certified values by more than 3 µg, the analyst will repeat the working standard measurements. If the blank measurements differ from the pre-exposure values by more than 15 µg, the

QAPP for the DAQ PM Monitoring Program Revision 2 8/8/2019
Page 109 of 160
analyst will repeat the blank measurements. If the two measurements still disagree, the analyst will contact the LAB supervisor, who may direct the analyst to:
- Reweigh some or all the previously weighed filters, - Recertify the working standard against the laboratory primary standard, - Conduct diagnostic troubleshooting, and/or - Arrange to have the original vendor or an independent, authorized service technician
troubleshoot or repair the analytical balance or microbalance.
Laboratory personnel will take corrective action measures in the PM2.5 systems to ensure good quality data. Filter weighing must not occur if the weigh-room does not meet climate control conditions, and may only resume once the analyst satisfactorily implements appropriate corrective actions. Section 14.0 Quality Control Requirements and Procedures of this QAPP covers more of the lab QC.

QAPP for the DAQ PM Monitoring Program Revision 2 8/8/2019
Page 110 of 160
14.0 Quality Control Requirements and Procedures Quality control is the overall system of technical activities that measure the attributes and performance of a process, item or service against defined standards to verify they meet the stated requirements established by the end user. This section contains QA/QC information regarding the specifications and performance criteria for the field and laboratory operations used in the DAQ network.
To assure the quality of data from air monitoring measurements, the DAQ performs two distinct and important interrelated functions. One function is the control of the measurement process through broad QA activities, such as establishing policies and procedures, developing DQOs, assigning roles and responsibilities, conducting oversight and reviews, and implementing corrective actions. The other function is the control of the measurement process through the implementation of specific QC procedures, such as audits, calibrations, checks, replicates, routine self-assessments, etc.
For the PM monitoring network, DAQ uses QC activities to ensure DAQ maintains measurement uncertainty, as discussed in Section 7.0 Quality Objectives and Criteria for Measurement Data within acceptance criteria for the attainment of the DQOs. The SOPs in Table 17 and instrument manuals provide lists of pertinent QC checks.
The DAQ achieves QC through annual, or as needed, multipoint calibrations, daily review of instrument measurements, periodic maintenance, flow rate audits, accuracy, bias, and precision checks, collocated instruments, e-log control charts, acceptance test procedures and other verification techniques. Table 7 through Table 12 provide specific QC measures, with frequencies and acceptance criteria. In the sections that follow, the RCO PM chemist embedded the calculations for the following QC procedures in e-log books. Regional monitoring and ECB electronics technicians do not compute any calculations by hand to reduce human error to the extent possible. The RCO PM chemist derived formulas from relevant sections of 40 CFR Part 58 and the appendices to 40 CFR Part 50. With regards to the laboratory, calculations are performed by the analyst at this time. See the SOP for the formulas.
14.1 Adjusted Calibrations
An adjusted calibration, which DAQ calls a calibration, is the process used to change an instrument’s measurements to minimize deviation from a standard. This multiphase process begins with certifying a calibration or transfer standard against an authoritative standard such as a NIST-traceable standard. The operator compares the PM instrument’s measurements to this calibration/transfer standard. If significant deviations exist between the instrument’s measurements and the calibration/transfer standard’s measurements, the operator implements corrective action (i.e. adjustments) to rectify the instrument’s measurements.
The SOPs in Table 17 and in the specific instruments’ operations manuals provide calibration procedures for the critical field and laboratory equipment. For the particle monitors, the operator adjusts flow rate when performing a calibration. The design (desired) flowrate of low-volume particle samplers is 16.67 LPM. After the operator has adjusted the flow rate, the operator verifies the flow rate to ensure the calibration is successful. Using a certified flow transfer standard (FTS), flow rate is measured and a

QAPP for the DAQ PM Monitoring Program Revision 2 8/8/2019
Page 111 of 160
comparison between the known (transfer standard) and the measured (sampler) is calculated using percent difference. For the regional monitoring technician to consider the calibration successful, the calibration verification value must be within 2 percent.
Besides calibrating the monitors, the DAQ maintains a vendor-contract for calibration of the analytical microbalance. At least once a year, the vendor examines the microbalance and performs a calibration. The calibration meets both DAQ and vendor requirements.
14.2 Precision Checks
Precision is the measure of mutual agreement among individual measurements of the same property, usually under prescribed similar conditions. To meet the DQOs for precision, DAQ will ensure the entire measurement process is within statistical control. To do this, DAQ will employ various tools in evaluating and monitoring precision measurements. Employing collocated monitoring, and monitoring data integrity with e-log flow control charts, will provide evidence of deviations from the required precision measurement. Since an atmosphere of a known PM concentration cannot be made (such as in gaseous Ozone monitoring), collocated monitors are the best way to test field precision comparing one monitor against another. The DAQ places collocated monitors at 15 percent of all intermittent PM2.5 monitor sites as well as at 15 percent of each continuous monitoring sites to support precision evaluations. The DQOs, contained in Table 6 of this QAPP, for the PM network are based on the precision estimates of the collocated monitors. At the time of this QAPP revision, DAQ is in the process of developing a collocated monitoring program, much like that of EPA’s performance evaluation program (PEP).
14.2.1 Flow Rate Verifications
In accordance with 40 CFR Part 58, Appendix A, Sections 3.2 and 3.3, the regional monitoring technician must perform a one-point flow rate verification check at least once every month on each sampler used to measure PM2.5 and low-volume PM10. In the DAQ network, the goal is to complete these verifications every 14- 18 days, except during audit months. The regional monitoring technicians complete the verification by checking the operational flow rate of the sampler. If the regional monitoring technicians complete the verification in conjunction with a flow rate adjustment (calibration), they must complete it before making the adjustment. They compare the flow rate measured by the transfer standard to the flow rate reported by the sampler. The regional monitoring technicians calculate percent and compare the results to the acceptance criteria. They also calculate percent difference between the design flow rate of the sampler (i.e., 16.67 LPM) and the flow rate measured by the transfer standard during the check. These QC checks verify (confirm) the PM sampler is in good working order and, therefore, support the defensibility of the data.
14.2.2 Duplicate Filter Weights
In accordance with Quality Assurance Guidance Document 2.12, the analyst must complete a duplicate filter weighing each sampling batch. The analyst randomly selects a duplicate filter from among the routine sample filters to reweigh at the end of the batch. Although the acceptance criteria in 2.12 is that the duplicate weighing must be within 15 micrograms of the initial weighing, DAQ has established more

QAPP for the DAQ PM Monitoring Program Revision 2 8/8/2019
Page 112 of 160
robust criteria for the duplicate weighing of less than a plus or minus five microgram change between the initial and final weights. At the time of this QAPP revision, the PM LAB analyst and RCO LAB QA chemist are modifying some of the lab duplicate filter weighing procedures (namely the number of filters per batch) to more closely follow the guidance provided in Method 2.12.
14.3 Quality Control Samples
Collecting blanks is required under 40 CFR Part 50, Appendix L Section 8.3.7.1. As such, DAQ will collect field, trip, lab and lot blank samples as a QC check. The analyst pre-weighs a field blank filter with routine sample filters; the regional monitoring technician then installs this pre-weighed filter in the field sampler without any flow passing over the filter; the analyst then re-weighs the field blank filter with routine sample filters; and then the RCO PM chemist compares the initial and final weights. The purpose of blanks is to provide an estimate of total measurement system contamination, such as for transport or field activities. Through a comparison of laboratory blanks against field blanks, DAQ can assess contamination from field activities. The acceptance criterion for field blanks is ± 30 micrograms between the initial and final weighing. The DAQ network collects field blanks within its network at a frequency of approximately 10 percent of the sampling runs scheduled per site. For example, for a sampler operating on a 1-in-6 day operating schedule, DAQ would collect six field blanks over the course of a year. The DAQ takes field blanks throughout the duration of the sampling schedule (spaced evenly across the year) and not concentrated in a short period.
As an additional QC check, DAQ will also collect trip blank filters. Collecting trip blanks is not a requirement under 40 CFR Part 50, Appendix L; however, collecting trip blanks is a best practice. The site operator treats a trip blank exactly as a field blank, but the operator never places the filter into the sampler or exposes it to the ambient environment. The purpose of the trip blank is to assess possible contamination to filters during packing and transport to and from the laboratory to the sampling location. The acceptance criterion for trip blanks is ± 15 micrograms between the initial and final weighing. If the weight change exceeds 30 micrograms, contamination in the laboratory or during shipping may be occurring and further assessment of the lab blank data is necessary to identify the contaminant source. As with field blanks, the DAQ collects trip blanks in the PM network at a frequency of approximately 10 percent of the sampling runs.
The DAQ gravimetric laboratory issues field blanks and trip blanks to the regions and WNC. The lab analyst prepares batches of and tracks the issuance and number of blanks.
Lot blanks are conditioned, un-sampled filters used to determine filter weight stability for a new supply of filters. The analyst randomly selects nine filters, from the manufacturer’s lot sent by the EPA at the beginning of the year, to use to determine conditioning time of all filters in the new lot. The procedure includes weighing the nine filters over the course of several days until the change in mass is less than ± 15 µg. The number of hours needed to achieve this becomes the conditioning time of the whole lot. At a minimum, filters must be conditioned for 24 hours.
The LAB technician weighs laboratory blanks with each batch of filters. These laboratory blanks must meet the criterion of ± 15 µg, compared to the original mass measurement made when the blank filter

QAPP for the DAQ PM Monitoring Program Revision 2 8/8/2019
Page 113 of 160
was first pre-conditioned. If the blanks are not within the specifications after weighing, the LAB technician should check the balance and filter to see if there are any unusual debris. The SOP suggests the LAB technician brush off the balance, perform an internal adjustment, and then re-zero the balance.
14.4 Accuracy or Bias Checks
The EPA defines accuracy as the degree of agreement between an observed value and an accepted reference value. Accuracy is a combination of random error (precision), and systematic error (bias). Although the DAQ primarily uses collocated monitors for evaluating and controlling precision, the DAQ can use the data from the collocated monitors to determine accuracy or bias. With that in mind, by employing percent difference calculations and monitoring patterns of collocated PM2.5 samplers, the DAQ can observe trends that indicate bias occurring within the measurements. Percent difference measurements, using flow rates in lieu of concentrations, obtained during flow rate verifications are used to assess the bias as described in 40 CFR Part 58, Appendix A, Section 4.2.2.
14.4.1 Field Flow Rate Audits
For instruments that measure flow, a member of the regional office staff who is not the regular operator will perform a flow rate audit at least every 6 months and preferably every quarter. The auditor does the audit measuring the analyzer's normal operating flow rate using a certified flow-rate transfer standard. The flow rate standard used for auditing must not be the same flow rate standard used to calibrate the monitor or sampler. However, both the calibration standard and the audit standard may be referenced to the same primary flow rate or volume standard. The applicable instruments’ operations manuals and the appropriate SOPs in Table 17 provide details for implementing flow audits.
14.4.2 External Agency Audits
The DAQ participates in the EPA Performance Evaluation Program (PEP). For PM2.5, the PEP is a QA activity, which the DAQ uses to evaluate measurement system bias of the PM monitoring network. The EPA defines a performance evaluation as a type of audit in which an independent party obtains the quantitative data generated in a measurement system and compares it with routinely obtained data to evaluate the proficiency of the analyst or laboratory. In the case of the PM PEP, the goal is to evaluate total measurement system bias, which includes measurement uncertainties from the field and the laboratory activities. The strategy is to collocate a portable PM2.5 air-sampling instrument within 2 to 4 m of an air-monitoring instrument, operate both monitors in exactly the same manner, and then compare the results. Further information on the PEP is available at this link.
14.5 Reference Membrane Span Foil Verification
For the BAM 1022 instruments, the operator must perform a reference-membrane span foil verification once every 90 days. The reference-membrane span foil verification monitors the stability and performance of the beta counter. If the verification fails, the operator will call the ECB to have the BAM 1022 replaced.
For the BAM 1020 instruments, the monitor must perform an automated reference-membrane span foil verification once every 24 hours. The reference-membrane span foil verification monitors the stability
QAPP for the DAQ PM Monitoring Program Revision 2 8/8/2019
Page 114 of 160
and performance of the beta counter. If the verification fails, the operator will call the ECB to have the BAM 1020 replaced.
14.6 BAM Background Tests
The operator must perform a zero background test on the BAM (1020 or 1022), after the initial installation and calibration, as soon as the weather conditions meet the minimum weather requirements: 72 hours of clear weather with no precipitation forecasted. The ECB electronics technicians may also perform a zero background test indoors before they install the monitor: they do not have to follow the weather requirements in this circumstance, yet they must still use the smart heater. This test corrects the background value to compensate for minor variations caused by local conditions such as grounding and shelter characteristics. The regional monitoring technicians will perform subsequent background tests on an annual basis in early spring (March/April/May) or fall (September/October/November) when dew points are generally at a low point. The test collects data for 72 consecutive hours having the PM10 and PM2.5 inlets replaced with a HEPA filter (BX-302) on a flow audit adapter. At the end of a completed 72-hour period, the regional monitoring technician must download the data and statistically analyze it using an Excel spreadsheet template. After the regional monitoring technician has calculated a new background value and compared it with the factory zero, the monitoring technician should audit the new coefficient for 24 hours before resuming normal data collection, especially if the BAM is close to failing the background test.
14.7 Filter Inspections
The analyst will inspect all filters before use to ensure that the filters are the correct type and size and do not have pinholes, particle contamination, or other imperfections. The analyst will discard any filter that fails the initial visual defect check. When the operators return the sampled filters to the lab, the analyst will again inspect each filter to ensure it has no visual defects. The PM chemist will void sampled filters with visual defects.
14.8 Balance Verification and Audits
Balance checks are frequent checks of the balance working standards against the laboratory balance to ensure precision throughout weighing sessions in order to test the micro-balance repeatability. The laboratory will use American Society for Testing and Materials Class 1 weights for its primary and secondary (working) standards. The analyst will measure both working standards at the beginning of each weighing session. Additionally, the analyst will weigh standards after every 10 filters and at the end of each weighing session.
At the time of this QAPP revision, DAQ is developing a plan of auditing the weigh lab for processes and procedures, including performance audits of the equipment.

QAPP for the DAQ PM Monitoring Program Revision 2 8/8/2019
Page 115 of 160
14.9 Quarterly Verification of Weights
Although the analyst has the working standards re-certified annually against a NIST-traceable standard at an accredited metrology laboratory, minimally, the analyst must verify the working standards’ masses against the laboratory’s in-house primary standards every 90 days to check for mass shifts associated with handling or contamination. The analyst must record the verified values of the working standards as measured relative to the laboratory primary standards in a laboratory QC log and use them to check the integrity of the working standards.
The double substitution method is the method for conducting quarterly verifications of the working mass reference standards. This procedure is a version of SOP Number 4 in NIST Handbook Number 14521. In this method, the laboratory analyst weighs a set of primary standards against a set of working standards to generate a reference point. The working and primary standards are each weighed twice.
Whenever the analyst computes the double substitution, he or she compares the new calculation to the previous calculation to determine if there has been a significant shift in mass. The analyst does not use the double substitution method to generate a “new mass” for any weight standard; the double substitution method serves only as a verification (check) of the standards. The acceptance criterion is 2 µg from the certified weights.
14.10 Filter Holding Times
The analyst and PM chemist will evaluate all filters to ensure each step of the process met its holding time. Operators must only use filters to collect samples that are within 30 days of their initial weighing. If an operator collects a sample on a filter 31 days after its initial weighing, the PM chemist will void the sample. The operator must recover all sampled filters within 7 days and 9 hours from the sample end data. The PM chemist will void any samples recovered later than that. The analyst must weigh all received filters within a specified time. The holding time on received filters vary depending on the temperature of the sample during collection and when received at the lab. The analyst must weigh samples shipped at ambient temperature within 10 days of the sample date. If shipped at less than the average ambient temperature or at less than 4 °C, the analyst must weigh the sample within 30 days of the collection date. The analyst and PM chemist will void any samples received above 25 °C.
14.11 Filter Conditioning Environment
The analyst will equilibrate all filters in a temperature and humidity controlled environment for a minimum of 24 hours. The controlled environment must meet the following conditions:
• The 24-hour mean temperature must fall between 21 and 23 °C;• The SD in the temperature over a 24-hour period must be less than ± 2.1 °C;• The 24-hour mean RH must fall between 35 and 40 percent or less than or equal to 5 percent
sample RH but great than 20 percent RH;• The SD in the RH over a 24-hour period must be ± 5.0 percent; and• The difference in the 24-hour mean RH must be less than 5.1 percent between when the
analyst takes the initial and final weights.

QAPP for the DAQ PM Monitoring Program Revision 2 8/8/2019
Page 116 of 160
These are not the criteria found in 40 CFR Part 50, Appendix L. The DAQ has opted for a set of constraints that are more rigorous than the constraints found in Appendix L to have a warning level for corrective actions in the lab.
14.12 Weights Original Spreadsheet Validation
At the time of this QAPP update, a formal process for the challenging and validation of the Weights Original spreadsheet is in the process of being created. Individuals within DAQ have already been tasked with this quality control requirement and procedure (see sections 4.2.1 and 4.2.2) and are developing a suitable process.
14.13 Corrective Actions
The DAQ takes corrective action measures as necessary to ensure DAQ attains the MQOs. Given the number of monitors, the diversity of monitoring activities, and the complexity of the instruments, a potential exists that issues may arise with sampling and measurement systems. In a properly functioning monitoring network, the DAQ anticipates certain issues in advance, and prepares and equips staff to address issues as they arise.
Corrective actions may also be implemented on an "as-necessary" basis when unexpected or unforeseen circumstances are encountered, such as a failed QA/QC check. The DAQ SOPs contain examples of corrective actions that the regional monitoring or ECB electronics technicians may need to complete under certain circumstances. Site operators should consult the appropriate SOP in Table 17 for technique-specific checks, required frequency of checks, acceptance criteria, and additional corrective action guidance. Table 18 is an abridged list for typical problems that require corrective action. It is the DAQ policy for monitoring and ECB staff and RCO chemists to report the need for corrective actions to the appropriate monitoring coordinator or supervisor within two business days and address the issue as soon as possible, ideally within five business days. Most problems can be resolved within one or two business days, but occasionally it takes longer to identify what is causing the problem and find a solution. When equipment is down, staff must work to repair the problem as quickly as possible to limit the amount of data loss.
Table 18. Corrective Actions
Activity Problem Likely Actions
QA/QC Check
Out of specification;
flow rate check or
failed flow rate audit exceeds
acceptance criteria
1) Verify / reproduce performance check findings. Use an alternate transferstandard to confirm failures.
2) Perform alternate performance checks to determine cause (for example – leaktests to aid in flow rate issues).
3) Recalibrate monitor using standard operating procedures.4) Identify any required procedural changes to prevent the occurrence.5) Document actions on an e-log as appropriate.6) Notify the regional monitoring coordinator and RCO PM chemist, of
performance audit failures as soon as practical.
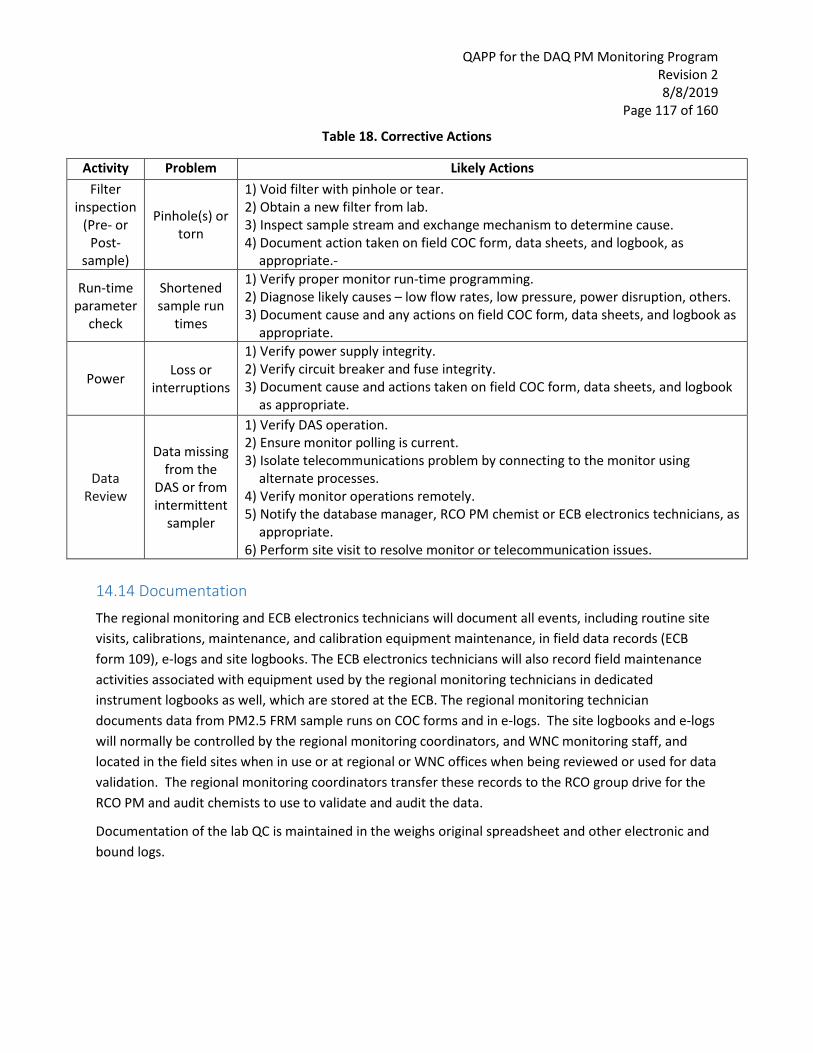
QAPP for the DAQ PM Monitoring Program Revision 2 8/8/2019
Page 117 of 160
Table 18. Corrective Actions
Activity Problem Likely Actions Filter
inspection (Pre- or
Post-sample)
Pinhole(s) or torn
1) Void filter with pinhole or tear. 2) Obtain a new filter from lab. 3) Inspect sample stream and exchange mechanism to determine cause. 4) Document action taken on field COC form, data sheets, and logbook, as
appropriate.-
Run-time parameter
check
Shortened sample run
times
1) Verify proper monitor run-time programming. 2) Diagnose likely causes – low flow rates, low pressure, power disruption, others. 3) Document cause and any actions on field COC form, data sheets, and logbook as
appropriate.
Power Loss or interruptions
1) Verify power supply integrity. 2) Verify circuit breaker and fuse integrity. 3) Document cause and actions taken on field COC form, data sheets, and logbook
as appropriate.
Data Review
Data missing from the
DAS or from intermittent
sampler
1) Verify DAS operation. 2) Ensure monitor polling is current. 3) Isolate telecommunications problem by connecting to the monitor using
alternate processes. 4) Verify monitor operations remotely. 5) Notify the database manager, RCO PM chemist or ECB electronics technicians, as
appropriate. 6) Perform site visit to resolve monitor or telecommunication issues.
14.14 Documentation
The regional monitoring and ECB electronics technicians will document all events, including routine site visits, calibrations, maintenance, and calibration equipment maintenance, in field data records (ECB form 109), e-logs and site logbooks. The ECB electronics technicians will also record field maintenance activities associated with equipment used by the regional monitoring technicians in dedicated instrument logbooks as well, which are stored at the ECB. The regional monitoring technician documents data from PM2.5 FRM sample runs on COC forms and in e-logs. The site logbooks and e-logs will normally be controlled by the regional monitoring coordinators, and WNC monitoring staff, and located in the field sites when in use or at regional or WNC offices when being reviewed or used for data validation. The regional monitoring coordinators transfer these records to the RCO group drive for the RCO PM and audit chemists to use to validate and audit the data.
Documentation of the lab QC is maintained in the weighs original spreadsheet and other electronic and bound logs.
QAPP for the DAQ PM Monitoring Program Revision 2 8/8/2019
Page 118 of 160
15.0 Equipment Testing, Inspection, and Maintenance Requirements Preventative maintenance is a foundational element to an effective QA program. The ECB electronics technicians maintain a maintenance and repair shop in the Maywood facility for off-site repair, maintenance, and field or lab readiness certification of equipment. This section discusses the procedures used to verify that the ECB electronics technicians maintain all instruments and equipment in sound operating condition so they can operate at acceptable performance levels. Refer to the instrument specific SOPs (listed in Table 17) for more details on the specific preventative maintenance and repair activities. The monitoring and ECB electronics technicians must document and file all instrument inspection and maintenance activities. See Section 9.0 Documentation and Records for document and record details.
15.1 Testing
The DAQ PM monitoring program uses established procedures to verify that the regional monitoring and ECB electronics technicians maintain all instruments and equipment in sound operating condition and capable of operating at acceptable performance levels. Refer to the instrument specific SOPs (listed in Table 17 of this QAPP) for more details on the specific preventative maintenance activities. In general, the ECB electronics technicians perform the following acceptance and testing activities upon receipt of new monitors and samplers and after a monitor or sampler has undergone significant repair. If the equipment is new and fails to meet the field readiness certification described below, the ECB electronics technicians will contact the vendor.
- Verify that instrument contains its EPA equivalent or reference method decal and meets thespecifications of the purchase request.
- Verify that all expected parts arrived with the instrument and that nothing is physically broken.Contact the vendor if there are issues.
- Perform field readiness “certification” testing, summarized as follows. Although the designationof the FRM/FEM status ensures the make/model of the instrument meets EPA requirements foruse in the network, DAQ must still ensure individual instruments perform as expected beforethe ECB electronics technician deploy them in the field.
o Check the diagnostics of the sampler, looking for any fault lights or warnings, anddocument the status.
o Check, and if need be, calibrate, the temperature and pressure sensors.o Perform flow rate checks and make sure they fall within the acceptance criteria.o Run the intermittent sampler at the ECB for a short period of time (e.g., a week) and
track the sampler’s operational performance. For example, these tests confirm thefunctionality of the filter exchange mechanism in the sampler and verify that thesoftware is working appropriately. For continuous PM samplers, the ECB electronicstechnician runs the sampler in the lab and observes the ambient concentration values;these values should be low (as this is indoor air) and track steadily.

QAPP for the DAQ PM Monitoring Program Revision 2 8/8/2019
Page 119 of 160
If an instrument has undergone significant repair and fails to meet the field readiness certification (testing), the ECB electronics technician will contact the vendor. If after working with the vendor, the instrument cannot be repaired such that it passes performance testing, then the instrument will be shelved (i.e., discontinued from service). At that point, the ECB electronics technician tags the instrument as inoperable, sets it on the shelf and uses it for spare parts. If the shelved and tagged instrument served as a back-up instrument, then the ECB will begin the process to purchase a new instrument to replace that backup, such that a spare is once again available for use.
15.2 Inspection
This subsection provides a discussion of the necessary inspections of various equipment and components. The two subsections located here cover conditioning and weighing room issues and field activities.
15.2.1 Inspections in Conditioning/Weighing Room
Several items need routine inspection in the gravimetric laboratory, including the relative humidity and temperature sensors, sticky mats and functioning of the antistatic devices. The SOP 2.24.3 details what to inspect and how to document appropriately the inspections. At the time of this QAPP revision, the PM LAB analyst and RCO LAB QA chemist are revising the inspection procedures to clarify and streamline them, along with providing procedures to document them properly.
15.2.2 Inspections of Field Items
Several items periodically require field inspection. The applicable equipment SOPs 2.17.1, 2.36.1 and 2.46.2 (see Table 11.2 for SOP titles) and operations manuals present details on these items and procedures. In general, the following inspection activities are used:
- The regional monitoring technicians inspect monitoring shelters, sample inlets, and otherenclosures quarterly to ensure conditions do not adversely affect monitor operation or dataintegrity. The ECB electronics technicians inspect monitoring shelters, sample inlets and otherenclosures during each site visit and at least once a year to ensure conditions do not adverselyaffect monitor operation or data integrity.
- The regional monitoring technicians and coordinators and RCO PM Chemist and statisticianreview data collection and data quality each business day, inspecting the data for trends andsigns of problems with continuous PM monitors. Data trends that signal inspection wouldinclude such issues as frozen numbers for multiple hours in a row, or erratic spikes or valleys inthe concentrations obtained.
- Inspections on equipment also occur during site visits to verify the entire system is in goodworking order. The RCO PM chemist incorporated the site visit checklists into the e-logs.
- The regional monitoring technicians review the site and monitors annually to ensure continuingcompliance with 40 CFR Part 58, Appendices A, D and E. The regional monitoring techniciansdocument the review on the DAQ site review form.

QAPP for the DAQ PM Monitoring Program Revision 2 8/8/2019
Page 120 of 160
15.3 Routine Maintenance
With regard to routine maintenance, the following are general protocols:
- The ECB electronics technicians maintain a limited supply of critical spare parts in the ECB to aid in rapid response to issues. For example, pump rebuild kits, spare pumps, sample media and expendable kits are routinely on hand.
- Preventive maintenance is scheduled ahead of time so all parts/tools can be easily available to complete the tasks and data loss is kept at a minimum.
- The regional monitoring and ECB electronics technicians typically perform preventive maintenance activities in the field, although the ECB electronics technicians complete some activities in the ECB.
The routine preventive activities and schedules are detailed in the specific equipment SOPs (see Table 17) and supplemented by the equipment user manuals. The regional monitoring technicians service all PM inlet heads monthly, VSCCs monthly and down-tubes at least quarterly.
The major piece of equipment in the laboratory is the analytical microbalance. The vendor performs routine maintenance on the microbalance every six months. The DAQ maintains a service contract for the climate control equipment located in the ceiling of the PM laboratory. The service provider does routine maintenance and service on the equipment as well as repairs when the equipment fails. The weighs lab itself is cleaned weekly or whenever the lab analyst deems necessary.

QAPP for the DAQ PM Monitoring Program Revision 2 8/8/2019
Page 121 of 160
16.0 Instrument Calibration and Frequency The EPA defines “calibration” as the comparison of a measurement standard, instrument or item with a standard or instrument of higher accuracy to detect and quantify inaccuracies and to report or eliminate those inaccuracies by adjustment. Use of the term “calibration” indicates that an adjustment in either the instrument or the software occurred. The EPA recommends that agencies minimize adjustments to prevent introducing measurement uncertainty and that verifications, “i.e., checks without correction (adjustment),” be used to confirm whether an instrument is operating within its acceptance range. Thus, the purpose of calibration is to minimize bias. Section 14.0 Quality Control Requirements and Procedures discusses calibrations in more detail. The operator SOPs listed in Table 17 describe calibration procedures for each specific pollutant analyzer or sampler.
The ECB electronics technicians are responsible for procuring and maintaining dedicated traceable standards for the certification of the ambient air quality monitoring systems. These standards provide a direct link to established national standards, i.e. NIST, and are the foundation for the collection of the highest quality ambient air pollution data possible in accordance with current procedures and existing federal regulations and guidelines.
Traceability is defined in 40 CFR Parts 50 and 58 as meaning that a local standard (i.e., one maintained by a monitoring organization) has been compared and certified, either directly or via not more than one intermediate standard, to a primary standard such as a NIST standard. Similarly, traceability is the property of a measurement result whereby the agency can relate the result to a stated reference through a documented unbroken chain of calibrations, each contributing to the measurement uncertainty. Standard traceability, therefore, is the process of transferring the accuracy or authority of a primary standard to a field-usable standard, resulting in a documented unbroken chain of calibrations and certifications. Specific calibration procedures for and timeframes for certifications of field equipment can be found in SOP 2.3.3 or operation manuals.
To achieve and ensure traceability, DAQ adheres to the following principles:
• DAQ recertifies devices at least annually. The DAQ and WNC keeps records of thesecertifications in the PM laboratory, at the ECB, in the regional offices and at the WNC office.
• Where applicable, in-house certification procedures (i.e., certifying a transfer standard against acertified primary standard - i.e., one of higher authority) are performed. The DAQ maintainsdocumentation of these procedures in the PM Laboratory or ECB shop on appropriate forms.
• The DAQ maintains records of all instrument calibrations, using the traceable standards (withinstrument identification numbers clearly documented), on the regional or RCO share drives.
In this manner, documentation exists that provides a documentation trail that links all DAQ calibrations back to NIST.
The following summarizes the standards used in the DAQ network and their recertification process. The DAQ field staff and ECB staff monitor all certification periods to ensure operators and auditors do not

QAPP for the DAQ PM Monitoring Program Revision 2 8/8/2019
Page 122 of 160
use equipment beyond the documented certification expiration dates. The regional monitoring technicians are responsible for verifying the equipment they are using is within certification and contacting the ECB at least 30 days prior to being out of certification. Likewise, the PM LAB analyst is responsible for ensuring all equipment used in the PM laboratory is within its certification period.
16.1 Certification of Local Primary Standards
A primary standard is a standard that is sufficiently accurate such that it is not calibrated by or subordinate to other standards. The vendors and ECB electronics technicians use primary standards to calibrate other standards referred to as working standards.
The DAQ uses “local primary standards” or standards certified against NIST-traceable standards and kept in the ECB shop for the sole purpose of certifying transfer standards used in the field to calibrate equipment and verify equipment calibrations. The DAQ owns two “local primary standards” for each type of device. The ECB sends each “local primary standard” to the vendor for recertification in alternate years ensuring that one local primary standard is always available for use and has been certified within 365 days. DAQ staggers the rotation of standards such that one device remains in certification at all times. An ECB electronics technician compares the “local primary standard” that did not return to the vendor to the one that did return to the vendor to certify it and uses it to certify equipment for the next year.
16.1.1. Local Primary Temperature Standard
The ECB uses an Omega Digital Thermometer DPT-1 with a bridge sensor as a local primary temperature standard to verify the accuracy of the field temperature transfer-standards. An ECB electronics technician sends one of the local primary standard to the vendor for recertification against a NIST primary standard every 365 days. SOP Section 2.3.3 provides information on and procedures for the certification and verification of the local primary temperature standards.
16.1.2. Local Primary Pressure Standard
The ECB uses a Sensor Model # 2500 as a local secondary pressure standard used to verify the accuracy of the field barometer transfer-standards. An ECB electronics technician sends it to the vendor for recertification every 365 days. SOP Section 2.3.3 provides information on and procedures for the certification and verification of the local primary barometer standards.
16.1.3. Local Primary Time Standard
The ECB and regional monitoring technicians use the WWV NIST atomic clock in Boulder, Colorado (telephone number: 1-303-499-7111) as a primary time standard. They can also obtain the correct time via the website http://nist.time.gov.
Regional monitoring technicians can also call the ECB electronics technicians to request the NIST Time. The DIT configures all state network resources and devices, including site computers at PM monitoring stations, to receive time settings from the web clock at nist.gov (primary) and the Internet Time Service at bldroc.gov (backup). The DIT also configures the site computers at PM monitoring stations to remain

QAPP for the DAQ PM Monitoring Program Revision 2 8/8/2019
Page 123 of 160
on Eastern Standard Time, which is the local standard time for all of North Carolina, throughout the year.
16.2 Calibration of Transfer Standards
The DAQ certifies all transfer standards against either a primary standard or the “local primary standard.” This establishes the traceability of the calibration.
16.2.1 Flow Transfer Standards
The field flow-transfer standards used for flow rate calibration and flow rate verification will have their own certifications and will be NIST-traceable to the factory primary flow rate standard. The ECB electronics technicians will supply either a TetraCal or streamline FTS for field calibrations and flow rate verifications of the flow rates of the network samplers. Both devices have the advantage of providing volumetric flow rate values directly, without requiring conversion for mass flow measurements, temperature, pressure or water vapor content. The manufacturer establishes (and verifies as needed) a calibration relationship for the flow rate standard, such as an equation, curve or family of curves, as accurate to within 2 percent over the expected range of ambient temperatures and pressures at which the flow rate standard is used. The vendor shall recalibrate and recertify flow rate standards at least annually and provide a certificate of traceability to DAQ.
16.2.2 Temperature Transfer Standards
The regional monitoring technicians use either mineral thermometers or Tetra-Cals as field-temperature transfer standards. The Tetra-Cals have their own certification by the vendor. An ECB electronics technician will re-verify or recertify the mineral thermometers at least annually against the local primary temperature standard or auditor’s transfer standard, to within 1°C, over the expected range of ambient temperatures at which the temperature standard is to be used. SOP Section 2.3.3 provides information on and procedures for the certification and verification of the field temperature transfer-standards. ECB will provide a certificate of traceability to DAQ field staff.
16.2.3 Pressure Transfer Standards
The field pressure transfer-standards will be handheld digital barometers or Tetra-Cals that will have their own certification by the vendor. An ECB electronic technician re-verifies or recertifies the handheld digital barometers at least annually against the local primary pressure standard. SOP Section 2.3.3 provides information on and procedures for the certification and verification of the field pressure transfer-standards. ECB will provide a certificate of traceability to DAQ field staff.
16.2.4 Pressure Differential Transfer Standards
The field manometers will have their own certification. The ECB re-verifies or recertifies them at least annually against the local primary pressure standard or auditor’s transfer standard, to within 1 millimeters mercury, over the expected range of pressures at which the standard is to be used. SOP Section 2.3.3 provides information on and procedures for the certification and verification of the manometer transfer-standards. ECB will provide a certificate of traceability to DAQ field staff.

QAPP for the DAQ PM Monitoring Program Revision 2 8/8/2019
Page 124 of 160
16.3 Weighing Lab Calibration and Check Standards
The DAQ recertifies the working and primary weights used to calibrate the laboratory microbalance annually. The DAQ sends the weights to a certified metrology lab. The lab documents these actions in a certification and provides a copy of the certificate to the laboratory analyst, who after reviewing the report, files it in a filing cabinet in the gravimetric laboratory. This process is currently undergoing review and revision at the time of this QAPP revision.
16.4 Analytical Balance
The vendor calibrates the analytical microbalance at installation and at least once every 365 days. The analyst verifies the calibration before each weighing session. SOP Section 2.24.3 provides further details on the calibration procedures.
16.5 Lab Temperature and Relative Humidity
The analyst verifies the calibration of the sensors that monitor lab temperature and RH every 182 days with independent traceable devices. The sensor that monitors lab temperature must be within ± 2 °C of the NIST transfer standard. The sensor that monitors lab RH must be within ± 2 percent of the NIST transfer standard. SOP Section 2.24.3 provides further details on the calibration procedures. This process is currently undergoing review and revision at the time of this QAPP revision to include proper documentation and recertification of standards leading to a solid traceability.
16.6 Documentation
See the appropriate SOP (Sections 2.24.2 and 2.37.2, for example) for field QC checks that include frequency and acceptance criteria and references for calibration and verification tests of sampler flow rates, temperature, pressure, and time synchronization. The field sampler flow rate, temperature, and pressure-sensor verification checks include one-point checks at least monthly and multipoint calibrations at least annually, as documented by tracking on control charts.
All these events, as well as sampler and calibration equipment maintenance, will be documented in field data records and logbooks. The technical staff will keep field activities associated with the equipment they use in record logbooks as well. The records will normally be controlled by the regional coordinator and located in the field site when in use or at the regional office when being reviewed or used for data validation.
Please reference Table 13 for the storage location of all documentation.

QAPP for the DAQ PM Monitoring Program Revision 2 8/8/2019
Page 125 of 160
17.0 Inspection/Acceptance of Supplies and Consumables DAQ SOPs itemize the apparatus, equipment, materials, and supplies required for various monitoring equipment. In general, the ECB electronics technicians procure supplies and consumables directly from the vendor manufacturing the monitors used by DAQ. Most manufacturers' operating manuals itemize parts lists, including recommended replacement schedules, as well. The DAQ uses this information to determine the appropriate procurement schedule and volume of consumables required to support continuing operations.
The regional monitoring technicians and PM LAB analyst track supplies and consumables. When they need replacements, the regional monitoring technicians notify the ECB electronics technicians or the PM LAB analyst, who then purchase most needed supplies. The ECB electronics technicians and PM LAB analyst maintain an inventory of supplies in the ECB shop and PM laboratory for later distribution. They inspect received materials to ensure they received the proper part number as ordered. They data the parts received so that they can easily determine storage duration. The ECB electronics technicians and PM LAB analyst use a revolving inventory system (first in, first out) to ensure that storage times do not affect the material's integrity. If a manufacturer or EPA requirement indicates a specific expiration period for supplies, the ECB electronics technicians and PM LAB analyst discard those supplies exceeding expiration dates if they have not used them within the acceptable period.
The lab analyst must properly handle and condition the air sampling filters used to collect PM2.5 samples and the integrity of the filter is of primary concern. The EPA provides vendor lot certification of filters used to support the ambient air quality monitoring programs before distributing the filters to monitoring organizations. The PM LAB analyst receives documents, and inspects and conditions air-sampling filters for use in the PM2.5 sampling program. The PM LAB analyst removes filters that do not meet initial QC specifications from service in accordance with SOP 2.24.3.
QAPP for the DAQ PM Monitoring Program Revision 2 8/8/2019
Page 126 of 160
18.0 Non-Direct Measurements This section addresses data not obtained by direct measurement from the PM monitoring program. This includes data from outside sources and historical monitoring data. Possible databases and types of data and information that the DAQ might use include:
- Core-based statistical area boundaries - Chemical and physical properties data - Sampler manufacturers' operational literature - Geographic location data - Historical monitoring information - External monitoring databases - Lead and speciated particulate data - Census data - Dispersion modeling - National Weather Service and State Climate Office meteorological data and - Annual average daily traffic count data from the North Carolina Department of
Transportation
Any use of outside data is quality controlled to the extent possible following QA procedures outlined in this document and in applicable EPA guidance documents.

QAPP for the DAQ PM Monitoring Program Revision 2 8/8/2019
Page 127 of 160
19.0 Data Management 19.1 Purpose/Background
The primary work product of the DAQ ambient air-quality PM monitoring program is data. Accordingly, formalized procedures are required to ensure successful data management. Data management describes an inter-related set of standardized processes used to acquire, transmit, transform, reduce, analyze, store, and retrieve data. When documented and followed, a data management system helps maintain the integrity and validity of the data throughout its entire life cycle. DAQ's air monitoring data follows a documented flow path. The data life cycle starts before sample collection begins and ends with use of the data. The following subsections identify the processes and procedures to follow to acquire, transmit, transform, reduce, analyze, store, and retrieve data. These processes and procedures maintain the data integrity and validity through application of the identified data custody protocols.
Figure 17 shows the generalized flow path of the DAQ ambient air monitoring data, as well as the QA/QC data collected within the network. All regional monitoring technicians and coordinators, the RCO PM Chemist, and database manager acquire and process ambient air PM monitoring data. Section 4.0 Project/Task Organization describes staff responsibilities.
19.2 Data Collection and Recording
The DAQ will use only ambient air monitoring analyzers, which the EPA has designated as FRMs or FEMs, to collect data used for NAAQS compliance. The DAQ may use other continuous PM monitors that do not meet FRM or FEM requirements to provide real-time and AQI data. Upon installation and at regular intervals as specified, the regional monitoring technicians calibrate the ambient air monitoring instrumentation in accordance with the specific pollutant SOPs identified in Table 17 of this QAPP. Note: When DAQ establishes a new site, the regional monitoring coordinator and ECB electronics technicians manually collect metadata for the site (GPS coordinates, etc.). The database manager maintains the metadata and uploads it into AQS, as appropriate. The regional monitoring technicians and coordinators review the metadata annually during the network review and update it as needed.
DAQ records continuous run-data electronically. The site computer is equipped with a DAS, called Envidas Ultimate, and a wireless modem used to transmit data to the master polling system, i.e., the Envista ARM data storage database, which is a separate software package located on a state server. The DAS/site computer has the capability to record the output of the monitors at the site, perform any required data transformation, and format the resulting data in preparation for downloading to the Envista ARM database. The Envidas and Envista ARM databases do not allow the deletion of raw (original) data. The DAQ uses the Envista ARM database for data verification, validation, and reporting; the database uses replicate versions of the raw data to avoid violating the integrity of the original dataset. The database manager and level 1, 2 and 3 reviewers can modify, flag or void data stored in the Envista ARM “edit” database, as needed; an edit history is recorded and available to track changes made to the data.

QAPP for the DAQ PM Monitoring Program Revision 2 8/8/2019
Page 128 of 160
Figure 17. PM Data Flow

QAPP for the DAQ PM Monitoring Program Revision 2 8/8/2019
Page 129 of 160
The DAQ also collects data manually. Regional monitoring and ECB electronics technicians keep e-logs for most parameters, documenting QA/QC activities and preventive maintenance. For example, the operators document activities such as operational checks, leak check results, flow check results, audit results, filter changes and calibrations in these spreadsheets. The regional monitoring technicians upload the resulting e-logs to the regional office group drive. Then the regional monitoring coordinators transfer the e-logs to the RCO group drive for subsequent incorporation into the data validation process, discussed in Section 23 of this QAPP. Additionally, the regional monitoring technicians and RCO PM Chemist manually compile the results of the QA/QC checks from these e-logs for submission into the AQS database.
IBEAM (Internet-Based Enterprise Application Management) is a Java-based web application system used by DAQ as a primary repository and tracking system for many of the division’s business processes, including ambient monitoring data, forecast data, and DAQ business documents, among others. The DAQ modeled the design architecture of IBEAM after the standard n-tier architecture supported by Tomcat Application Server running on a Windows Server. The system uses a thin client interface for presenting information, via HTML and Java Server Pages, or JSP’s, in Internet Explorer. The DAQ designed the system in a modular format with each module containing sub categories as appropriate. The DAQ defined security at the module level with a range of security options appropriate to staff requirements. Although IBEAM displays systems in a modular format, it stores the data in the background in an integrated data structure managed by the Oracle Relational Database Management System, or RDBMS. This means no duplication of data or data entry and a single point source for reporting and information dissemination.
For the intermittent filter-based method, DAQ manually determines 24-hour concentration values. This process combines manually generated data during the gravimetric laboratory activities with data collected by the field instrument during a 24-hour sampling event. For filter-based sampling, the lab analyst enters initial filter weights and climate conditions into the Weights Original Excel spreadsheet at the PM Laboratory. The Weights Original Excel spreadsheet synchronizes with IBEAM, transferring the data into the PM module, which stores and archives it. The operator downloads the field data generated directly from the site sampler; these data represent the conditions of the 24-hour sampling event. The regional monitoring coordinators transfer these data electronically to IBEAM using a File Transfer Protocol (FTP) twice a month. The operator also manually transfers sampler runtime data unto the filter data sheets (e-logs) and these filter data sheets accompany exposed filters back to the PM Laboratory, as discussed in Section 13 of this QAPP. Once the LAB analyst completes the post-sampling analysis, IBEAM combines the final weigh data from the Weights Original spreadsheet with the FTP-transferred field data to determine final concentration values for the filter-based PM2.5 samples.
19.3 Data Transmittal and Transformation
Data transmittal is accomplished using wireless communication to access the site’s modems. The site has more than one modem because of the number of monitors and buildings at the site and the distance between the shelters and outdoor monitors. Downloading collected data does not delete data
QAPP for the DAQ PM Monitoring Program Revision 2 8/8/2019
Page 130 of 160
from the DAS. The Envidas software removes data from the site computer by overwriting data on a first-in, first-out basis. This configuration requires the Envista ARM software to extract data from the site computer on a regular basis to prevent any data loss. If communications problems arise, the Envista ARM software retrieves the data from the Envidas system when it can once again communicate with the site. The regional monitoring technician must make a site visit if the database manager or ECB electronics technician informs him or her that he cannot correct the communications problems in a timely fashion.
The DAS reads hourly PM values from the continuous PM monitors. The DAS stores each hour and this acts as the base unit for all measurements taken by the continuous PM monitors at the site. Envidas transmits all these values to the Envista ARM database for retention. The monitors and the Envista ARM system then average the stored hourly averages to form averaged 24-hour values. However, the database manager only submits hourly PM values to the EPA AQS database for the continuous PM monitors. The AQS database then averages the submitted hourly averages to form 24-hour values and weighted annual averages.
For the filter-based PM2.5 data, the RCO PM chemist extracts the final concentration data (24-hour values) from IBEAM, transferring them to the database manager for subsequent upload into AQS. Note: The IBEAM database electronically grabs information from the Weights Original spreadsheet (PM2.5 gravimetric laboratory) once every weekday.
19.4 Data Verification and Validation
Data verification and validation is an important routine process that involves several steps to ensure the regional monitoring technicians, coordinator and RCO chemists have carried out the field and data processing operations correctly. The verification and validation process will identify data with errors, biases and physically unrealistic values before DAQ or the EPA uses them for the identification of NAAQS exceedances, for further analysis, or for modeling. Once the regional offices or RCO have identified these problems, the RCO chemists, regional monitoring technicians and coordinators can correct, flag, or invalidate the data. If necessary, the regional monitoring and ECB electronics technicians can take corrective actions to address monitor-related issues identified during the data review process.
Each of the network’s instruments employed to measure the ambient concentrations of the particulate matter undergoes periodic audits, flow rate verifications and calibrations. SOPs 2.24.2 and 2.37.2 (see Table 17 for SOP titles) outline these procedures. Audits and verification checks ascertain the accuracy, precision and repeatability of each instrument in performing its required function.
The continuous data are stored on site in the DAS. When Envista ARM accesses the data through the wireless modems, it downloads the data into its database where the data undergo verification, reduction and analysis (Level 0). The regional monitoring technician, using Envista ARM, performs data verification by probing the data for status flags and comparing reported values to acceptable range criteria (Level 1). After the regional monitoring technician flags data as questionable, level 2 (preliminary) and 3 (final) reviewers evaluate the flagged data to identify underlying causes and decide whether the data are valid. If the data are invalid, DAQ and the EPA do not use them in calculations. If

QAPP for the DAQ PM Monitoring Program Revision 2 8/8/2019
Page 131 of 160
the data are valid, but flagged due to some extenuating circumstance, then DAQ and the EPA may use the data in calculations, accompanied by a comment documenting the situation. For the filter based sampling, the data review process contains a similar structure and procedure as the continuous data review. However, this process is done manually and includes the weigh lab. Section 23 of this QAPP discusses the data review process in more detail.
At the time of this QAPP revision, the chief and RCO chemists are in the process of updating and streamlining these data review procedures and developing new SOPs. They will revise this QAPP once they implement the new procedures.
19.5 Data Reduction and Analysis
As described in the subsections above, data reduction activities take place throughout the entire data management process. The Envista ARM system aggregates data into hourly and 24-hour averages, as appropriate; once validated, the database manager uploads the data into the AQS database. The EPA compares submitted results to the PM NAAQS.
The regulations at 40 CFR Part 50 define the quantity of valid data points required within a data set. For most pollutants, the EPA requires a minimum data capture of 75 percent of the interval – hour, day, quarter – for the EPA to consider the interval valid for use in NAAQS comparisons. Table 7 through Table 12 summarize these completeness requirements as well as provide specific references to the CFR.
The DAQ analyzes data periodically throughout the data collection and validation process. For example, the regional monitoring technicians and coordinators, RCO PM Chemist, audit chemist and statistician can download data from Envidas directly into Excel spreadsheets. The regional monitoring technicians, coordinator, RCO chemists and statistician use Excel spreadsheets, that are used as electronic logbooks, solely for data analysis and in-depth study of the data. For continuous PM, each business day the statistician prepares a tabulation of the raw hourly data from the previous day, evaluating it for missing data, data higher or lower than for that day and trends and to ensure it is within specifications. However, with filter based sampling, daily reviews are not possible due to the methodology.
The RCO chemist and statistician also review all validated data looking for trends, data outside of three times the interquartile range, etc. to establish the reasonableness of the data sets. The RCO audit chemist and statistician accomplish these tasks by retrieving several reports from the AQS database, such as the AMP256, AMP430, AMP450 and AMP600, analyzing the results.
19.6 Data Submission
After the RCO chemists, regional monitoring technicians and coordinators complete all three levels of validation for a month of data, as described in Section 23.0 Verification and Validation Methods, the database manager or statistician uploads the data to the AQS. This submittal must occur no later than 90 days following the close of each calendar quarter, as specified in 40 CFR Section 58.16. The RCO audit chemist assigned to this task shall certify to the chief that the data are complete to the best of his or her knowledge. The quarterly data submittal shall contain the following summary data:

QAPP for the DAQ PM Monitoring Program Revision 2 8/8/2019
Page 132 of 160
- The AQS site code, monitoring method code and parameter occurrence code;- The results of all valid precision, bias and accuracy tests performed during the quarter for PM10
(including both local and standard conditions), PM10-2.5, PM2.5,- The ambient air quality data obtained for PM10 (including both local and standard conditions),
PM10-2.5, PM2.5.
At the end of each quarter, the RCO audit chemist runs the AMP251, AMP256, AMP350, AMP430 and AMP600 reports in AQS and verifies that the database manager has successfully entered all hourly data, monthly flow rate verification and semi-annual flowrate audit data. The DAQ will also notify the EPA if a monitor does not meet the completeness requirements summarized in Table 7 through Table 12.
Every year before the data certification due date, the chief reviews the data from the EPA AQS summary reports, along with internal performance evaluation and audit reports, to confirm the data meets the required criteria. The RCO chemists address any concerns with the data.
DAQ shall submit to the EPA an annual AMP600 summary report of all the PM monitoring data from any PM monitoring station designated as a SLAMS and from all FRM, FEM and special purpose monitors that meet criteria in appendix A, in accordance with 40 CFR Section 58.15. DAQ will also submit a signed certification letter on DAQ agency letterhead signed by the chief. The chief will submit the report by May 1 of each year for the data collected from Jan. 1 through Dec. 31 of the previous year. The chief, or designee, must certify the report as accurate to the best of his or her knowledge. The chief will base this certification on the various assessments and reports performed by DAQ, including the annual QA report discussed in Section 21.0 Reports to Management that documents the quality of the ambient air quality data and the effectiveness of the quality system.
19.7 Data Storage and Retrieval
Once collected, data are stored in a variety of ways and for varying periods. Initially, data are stored in the monitor and/or the station-specific DAS. The monitors keep an unalterable record of instrument measurements for a period of days to weeks, depending on the amount of information stored. The on-site DAS also keeps an un-alterable record of instrument measurements for a period of months to years depending on the number of monitors operated at the site. The RCO Envista ARM database system automatically accesses data stored in the on-site Envidas system.
The DAQ archiving system makes possible the storage and retrieval of the air quality monitoring data. Backup and recovery procedures exist to ensure the monitoring and ECB electronics technicians and database manager can recover data in the event of a catastrophic failure. When storage space limits the amount of data that DAQ can keep in the database, procedures exist for moving the data into an archive database. Presently, the database manager backs up data weekly using a Zip File. He or she keeps the most recent copy available on SharePoint. Envidas polls data older than one-week old directly from the site computer. In the future, the DAQ will house the main database in DIT’s Western Data Center using a virtual server mirrored to the current database computer. The DAQ will keep all data in real time.

QAPP for the DAQ PM Monitoring Program Revision 2 8/8/2019
Page 133 of 160
Note, the regional monitoring technicians also download data directly from instruments to laptops in the field for continuous PM2.5 and PM2.5 FRM twice a month; these data downloads serve as a backup, as they are uploaded to the regional office group drive for archival purposes.
All supporting electronic and written information, such as logbooks, maintenance logs, certifications and diagnostic information worksheets are retained by DAQ for a minimum period of four years, unless any litigation, claim, negotiation, audit or other action involving the records has been started before the expiration of the four-year period. When this type of situation occurs, DAQ will retain the records until completion of the action and resolution of all issues that arise from it or until the end of the regular four-year period, whichever is later. The data shall be stored on electronic media or in hard copy, whichever format proves most advantageous. After the storage period has passed, the storage media may be disposed of or recycled.

QAPP for the DAQ PM Monitoring Program Revision 2 8/8/2019
Page 134 of 160
20.0 Assessments and Response Actions An assessment is the process used to measure the performance or effectiveness of the quality system, the PM monitoring network and its sites, and various measurement phases of the data operation. To ensure the adequate performance of the quality system, DAQ will perform:
- Network reviews and assessments- External performance evaluations- Semi-annual flow rate audits- Quarterly completeness assessments- Annual data certification- Data quality audits- Data quality assessments- Technical systems audits- Internal systems audits
20.1 Network Reviews and Assessments
Conformance with network requirements of the PM monitoring network as set forth in 40 CFR Part 58, Appendices A, C, D and E are determined through annual network reviews of the ambient air quality monitoring systems, as required by 40 CFR Section 58.10(a). The DAQ uses the network review to determine if the PM air-monitoring network collects adequate, representative and useful data in pursuit of its air monitoring objectives. Additionally, the network review may identify possible network modifications to enhance the system or correct deficiencies in attaining network objectives.
Before implementing a network review, the regional monitoring technicians compile and evaluate significant data and information pertaining to the network. Such information might include:
- Network files (including metadata, updated site information and site photographs);- AQS reports, especially AMP380 and AMP390 reports;- Network monitors’ five-year air quality summaries;- Major metropolitan area emissions trend reports;- Emissions information, such as a monitor’s emission density maps and maps delineating an
area’s major emissions sources; and- National Weather Service or State Climate Office meteorological data summaries for the
monitoring network area.
Upon receiving the information, the regional monitoring technicians will check it to ensure it is current. The regional monitoring technicians will note discrepancies and resolve them during the review. They will also identify files and photographs that need updating during the review. The regional monitoring technicians will emphasize the following categories of information during network reviews: the monitor location, distance from roadways and amount of traffic on nearby roads, population density and changes in the area, changes in nearby land use and other pertinent information.

QAPP for the DAQ PM Monitoring Program Revision 2 8/8/2019
Page 135 of 160
During the network review, the regional monitoring technicians will reconfirm the stated objective for the monitoring site and re-verify the location’s spatial scale. If the site location does not support the stated objectives or the designated spatial scale, the regional monitoring technician will propose changes to rectify the discrepancy. The regional monitoring coordinator, PPB supervisor and database manager will then act to correct the information in AQS, relocate the monitors or site, or move the site to a more suitable location, if needed.
In addition to the items included in the checklists, other subjects for discussion as part of the network review and overall adequacy of the monitoring program will include:
- Installation of new monitors, - Relocation of existing monitors, - Siting criteria problems and suggested solutions, - Problems with data submittals and data completeness, - Maintenance and replacement of existing monitors and related equipment, - QA problems, - Air quality studies and special monitoring programs, and - Other issues such as proposed regulations and funding.
State and Local Air Monitoring Stations. Adequacy of the network will be determined using the following information:
- Appendix D to 40 CFR Part 58; - The most current design values, - The most recent census or population estimates, - Maps of historical monitoring data, - Maps of emission densities, - Dispersion modeling, - Special studies/saturation sampling, - Best professional judgment, - State implementation plan requirements, and - Revised monitoring strategies (e.g. reengineering air-monitoring network).
Monitor Locations. For SLAMS, the geographical location of monitors is not specified in the regulations, but is determined on a case-by-case basis to meet the monitoring objectives specified in 40 CFR Part 58, Appendix D. Suitable monitor locations can only be determined based on the stated objectives. Maps, graphical overlays and GIS-based information will be helpful in visualizing or assessing the adequacy of monitor locations. The operator may also use plots of potential emissions, historical monitoring data and/or saturation study findings versus monitor locations.
During the network review, the monitoring technician will reconfirm the stated objective for each monitoring site and re-verify the location’s spatial scale. If the site location does not support the stated objectives, or the designated spatial scale, the site operator will propose changes to rectify the discrepancy.

QAPP for the DAQ PM Monitoring Program Revision 2 8/8/2019
Page 136 of 160
20.1.1 Five-Year Network Assessment
The five-year network assessment is a more extensive evaluation of the air-monitoring network. The assessment determines at a minimum:
- If the PM network meets the monitoring objectives defined in 40 CFR Part 58 Appendix D, - Whether DAQ must add additional PM sites, - Whether any existing PM sites are no longer needed and can be terminated, and - Whether new technologies are appropriate for incorporation into the PM ambient-air
monitoring network.
During the network assessment, the ability of existing and proposed sites to support air quality characterization for areas with relatively high populations of susceptible individuals, for example, children with asthma, as well as the potential impact any sites proposed for discontinuance may have on other data users is considered. The DAQ submits a copy of the five-year assessment, along with a revised annual network plan, to the EPA Region 4. These assessments began in 2010 for the PM network and are due to EPA every five years on July 1.
For more information about the PM monitoring locations, please see the annual network plan at this link: https://deq.nc.gov/about/divisions/air-quality/air-quality-data/annual-network-plan.
20.2 External Performance Evaluations
DAQ addresses performance evaluation activities by participating in the EPA’s PEP. Only qualified and authorized personnel execute performance audits. The PEP program EPA contractor must collect, and report eight valid performance evaluation audits each year for PM2.5 and must evaluate each PM2.5
method designation each year. EPA must evaluate all PM2.5 monitors at least once every six years. Since DAQ has 15 PM2.5 sites, and operates four method designations, the EPA may audit the PM2.5 site more frequently than once every six years. Because the EPA reports the PEP results directly to AQS after the national laboratory completes the analysis, the regional monitoring technicians and coordinators and RCO chemists will initiate corrective actions, when needed, after the results become available in AQS.
20.3 Semi-annual Flow Rate Audits
A regional monitoring technician other than the regional monitoring technician who routinely operates the PM2.5 monitors completes a flow rate audit on the monitors at least once every 182 days and preferably once every quarter or 91 days. This regional monitoring technician uses different equipment to conduct the audit than the equipment used to calibrate the monitors and do the monthly or semi-monthly flow checks. The regional monitoring technician follows the audit procedures in SOPs 2.24.2, 2.37.2 and 2.44.2. The regional monitoring technician documents the semi-annual flow rate audit in the e-log. If a monitor does not pass the evaluation, the monitoring staff will take appropriate action to identify why the monitor failed the evaluation and to correct the situation.

QAPP for the DAQ PM Monitoring Program Revision 2 8/8/2019
Page 137 of 160
20.4 Quarterly Completeness Assessment
After the database manager uploads to AQS all data for a quarter, the RCO audit chemist assesses the data to ensure all data made it into AQS. The RCO chemist accomplishes the quarterly completeness assessment by running the AMP430 Completeness Report, the AMP350 Raw Data Report and the AMP251 QA Data Report. The RCO chemist compares the data in AQS with the data that should be in AQS based on the monitoring schedule. When the RCO audit chemist identifies missing data or some other problem, he or she informs the Level 3 reviewer and database manager who act to resolve the issue. The RCO audit chemist archives the AMP251, AMP350 and AMP430 reports used for the quarterly completeness review in IBEAM. If the monitor does not meet completeness requirements, the chief contacts EPA Region 4 providing information on what occurred and what actions DAQ plans to take to keep the event from reoccurring.
20.5 Annual Data Certifications
In accordance with 40 CFR Section 58.15, an annual air monitoring data certification letter is required to certify that the data from Jan. 1 to Dec. 31 of the previous year, collected by the FRM and FEM monitors at the PM sites, meet criteria in 40 CFR Part 58 Appendix A. Along with the certification letter, the chief must submit to EPA an annual summary report of all the ambient air quality data collected by the monitors, as well as a summary of the precision and accuracy data, for the previous year.
Data certification is the final process of assessing the PM data for the previous calendar year. The DAQ verifies and validates continuous PM data monthly and intermittent PM data quarterly, as discussed in Section 23.0 Verification and Validation Methods. Additionally, chief or a designee assesses data on a quarterly basis when the RCO audit chemist generates specific AQS reports to assess the DQIs as discussed in Section 20.7 Data Quality Assessments. With these assessments ongoing throughout the year, annual data certification, then, serves as the last assessment of the data – looking at it from an all-inclusive, annual perspective – to see if any unidentified anomalies or trends exist in the data that the data reviewers did not previously identify. The annual data certification process starts with running and reviewing AMP reports contained in AQS. The reports typically queried include the following:
- AMP350 Raw Data - AMP251 QA Data - AMP430 Data Completeness - AMP600 Certification Evaluation - AMP256 Data Quality Indicator - AMP504 Extract QA Data - AMP450 Quicklook Criteria Parameters - AMP450NC Quicklook All Parameters
The RCO audit chemist and the PPB supervisor review these reports and confirm everything is complete and accurate. The RCO audit chemist and PPB supervisor also review the reports to ensure the statistical results indicate the monitoring data were in control over the course of the entire year and

QAPP for the DAQ PM Monitoring Program Revision 2 8/8/2019
Page 138 of 160
met the DQOs. If they identify problems, the RCO audit chemist investigates them in accordance with Section 23.0 Verification and Validation Methods
Ultimately, this process verifies that the PM monitoring data submitted to AQS is correct and complete. Once the RCO chemists, statistician and database manager complete any necessary corrections, additions or deletions in AQS and the RCO chemists and PPB supervisor finalize the dataset, the chief officially recommends the data for certification to EPA Region 4. The data certification package provided to EPA includes a signed copy of the AMP600 report, along with a letter signed by the chief, certifying that the ambient concentration and QA data in AQS are complete and accurate, taking into consideration the QA findings, to the best of his or her knowledge.
The annual data certification package is due to EPA Region 4 by May 1 of each year.
20.6 Audit of Data Quality
An audit of data quality, or ADQ, reveals how the level 1 to 3 reviewers handled data, what judgments they made and whether they made uncorrected mistakes and records exist to support the decision. An ADQ can often identify the means to correct systematic data reduction errors. Sufficient time and effort will be devoted to this activity so that the RCO audit chemist has a clear understanding and complete documentation of data flow. The RCO chemist shall perform this assessment quarterly in accordance with the quarterly data review SOP 2.61. The DAQ ensures the level 1 to 3 reviewers maintain data collection and handling integrity via the quarterly data review. If the RCO chemist finds a problem during the ADQ, the RCO chemist will work with the level 1 to 3 reviewers to correct the situation and modify the procedures to ensure the problem does not reoccur. See Section 23.0 Verification and Validation Methods for more information related to the data review process, which occurs monthly and/or quarterly.
20.7 Data Quality Assessments
The DAQ will estimate measurement uncertainty for both automated and manual data recording methods. The regulations within 40 CFR Part 58, Appendix A define and explain the terminology associated with measurement uncertainty.
The RCO audit chemist will calculate estimates of the data quality on a quarterly basis using the AQS AMP256 and AMP600 reports. The chief reports the individual results of these tests for each method or analyzer to the EPA annually as part of the AQS AMP600 report.
Level 1 data reviewers use the FRM and continuous flow rate control charts in the e-log semi-monthly to identify unusual variations in the flow rates. The Level 1 data reviewers must take corrective action when the control chart shows the flow rate reaching the action level.
20.8 Technical Systems Audits
A TSA is a thorough, independent and systematic on-site qualitative assessment, where an auditor examines facilities, equipment, personnel, training procedures, protocols and record keeping for conformance with the regulatory requirements and this QAPP. The EPA Region 4 QA staff conducts a

QAPP for the DAQ PM Monitoring Program Revision 2 8/8/2019
Page 139 of 160
TSA of DAQ every 3 years, in accordance with 40 CFR Part 58, Appendix A, Section 2.5. The EPA reports its findings to the DAQ director and chief. The chief regularly monitors progress on corrective actions required by the TSA findings and communicates progress to the director and EPA Region 4.
An EPA TSA team or an individual TSA auditor may segregate TSA activities into three or even more categories. The auditor may audit each category independently or may combine them. The possible TSA categories may include:
- Field activities – Monitor installation, calibration, and operation, sample handling and shipping.
- Laboratory activities - Pre-sampling filter weighing, filter shipping and receiving, post-sampling filter weighing, filter archiving and associated QA/QC activities.
- Data and document management activities – Collecting, flagging, editing, and uploading data, providing data security and storing documentation to support the decisions made.
During the audit, the auditors will interview key personnel with responsibilities for planning, field operations, laboratory operations, QA/QC, data management and reporting.
Upon completion of the audit, EPA verbally alerts the DAQ director and chief of any deficiencies or findings during an on-site TSA exit briefing. This briefing allows DAQ staff to begin formulating or implementing corrective actions. The EPA typically distributes a draft TSA report within 30 days of the completion of the audit. EPA Region 4 allows a brief comment period of the draft report for factual accuracy. After EPA receives comments from DAQ, EPA finalizes the TSA report and resubmits the report to the director and chief. The director and chief must complete and submit to EPA Region 4 within 30 days a formal response to address the TSA findings. The chief will communicate with EPA routinely after submitting the corrective action plan to provide progress updates on a periodic basis until DAQ has completed the corrective actions.
EPA shall conduct TSAs once during every three-year period that the PM monitoring program collects data verifying compliance with the NAAQS.
20.9 Internal Systems Audits
The RCO audit chemist should perform an internal TSA on the PM program at least once every three years, and ideally every year, which is similar to a TSA performed by the EPA. It is a thorough and systematic qualitative audit, where the auditor examines the facilities, equipment, personnel, training procedures, protocols, and record keeping for conformance with established regulations and statewide policies governing the collection, analysis, validation, and reporting of ambient air quality data.
A systems audit team or an individual systems auditor may separate systems audit activities into three or more categories for systems audits. The auditor may audit these categories independently or together. The categories may include:
- Field activities – performing routine maintenance of equipment, maintaining certification records, performing associated QA/QC activities, etc.

QAPP for the DAQ PM Monitoring Program Revision 2 8/8/2019
Page 140 of 160
- Laboratory activities - Pre-sampling filter weighing, filter shipping and receiving, post-sampling filter weighing, filter archiving and associated QA/QC activities.
- Data and document management activities – Collecting, flagging, editing, and uploadingdata, providing data security and storing documentation to support the decisions made.
The auditor will interview the key personnel responsible for planning, field operations, QA/QC, data management and reporting.
At the time of this QAPP revision, DAQ is in the process of implementing internal system audits and their needed frequency.
20.9.1 Post-Audit Activities
The post-audit activity is the preparation of the systems audit report. The report will include:
- Audit title, identification number, date of report and any other identifying information;
- Audit team leaders, audit team participants and audited participants;
- Background information about the project, purpose of the audit, dates of the audit,measurement phase or parameters that were audited and a brief description of the auditprocess;
- Summary and conclusions of the audit and corrective action required; and
- Attachments or appendices that include all audit evaluations and audit finding forms.
The auditor will prepare a written report summarizing the findings. The following areas may be included but all reports will include items 4, 5 and 6:
1. Planning,2. Field operations,3. Laboratory operations,4. QA/QC,5. Data management, and6. Reporting.
The auditor will document problems with specific areas and the affected personnel will implement appropriate corrective actions.
To prepare the report, the auditor will compare observations with collected documents and results of interviews with key personnel. The auditor will compare the expected QAPP implementation with observed accomplishments and deficiencies. The auditor reviews the findings in detail and, within 30 calendar days of the completion of the audit, will generate an audit report and distribute it to senior staff for comment.
If anyone has written comments or questions concerning the audit report, the auditor will review and incorporate them as appropriate. Subsequently, the auditor will prepare a modified report and resubmit it

QAPP for the DAQ PM Monitoring Program Revision 2 8/8/2019
Page 141 of 160
in final form within 30 days of receipt of the last written comments received. The report will include an agreed-upon schedule for corrective action implementation.
20.9.2 Follow-up and Corrective Action Requirements
As part of corrective action and follow-up, the regional office, ECB, LAB, or RCO will generate an audit finding response form for each finding in the internal TSA report. The supervisors of the affected units will sign the audit finding response form and send it to the auditor and chief, who review it and accepts or rejects the corrective action. The supervisors will complete the audit response form within 30 days of acceptance of the audit report.
The results of the internal TSA may result in additional or refresher training for air monitoring staff. The chief may provide training in the form of additional communications regarding DAQ-approved practices along with discussions of the elements necessary to satisfy these requirements. It may also be in the form of hands-on technical training.
20.9.3 Audit Schedule
At the time of this QAPP revision, DAQ is in the process of implementing internal system audits and their needed frequency.

QAPP for the DAQ PM Monitoring Program Revision 2 8/8/2019
Page 142 of 160
21.0 Reports to Management This section describes the quality-related reports and communications to management necessary to support PM network operations and the associated data acquisition, validation, assessment, and reporting. Besides the reports discussed in this section, staff meetings occur regularly on either a weekly, biweekly or a monthly schedule depending on the part of the organization involved. In addition, as needed, the DAQ supervisors hold meetings with the affected parties to address any additional issues that may arise. Unless otherwise indicated, all reports will contain monitoring data for the list of pollutants provided in Table 2.
Various sections of 40 CFR Parts 50, 53 and 58 discuss the reports to management required for the PM program. The EPA's Air Quality Assessment Division within the Office of Air Quality Planning and Standards provides guidance for management report format and content. The following subsections describe these reports.
21.1 Quarterly Data Report
The DAQ monitoring staff will edit, validate and upload air quality data submitted for each reporting period to AQS using the procedures described in the EPA’s AQS User Guide, EPA’s AQS Data Coding Manual and DAQ’s data handling and validation SOPs 2.41.3 and 2.41.4. After the database manager uploads all data for the quarter to AQS, an RCO chemist pulls and reviews the following quarterly reports from AQS: the AMP251, AMP256, AMP350, AMP350MX, AMP430 and AMP600. After reviewing the reports, the RCO chemist archives the reports in the IBEAM general documents module and sends an email to the Level 3 reviewer summarizing the review and any corrective action needed.
When data capture for a monitor falls below 75 percent for the quarter, an RCO chemist prepares for the chief a memo explaining why and the corrective action taken. Otherwise, the PPB supervisor documents that the quarterly data submittal is complete and the data meets 75 percent completeness by sending an email to the chief. Table 19 provides the dates by which the DAQ uploads the previous quarter’s data.
Table 19. Required AQS Data Reporting Periods
Quarter Reporting Period Last Day to Upload Data to AQS Q1 Jan. 1 to March 31 June 29 Q2 April 1 to June 30 Sept. 28 Q3 July 1 to Sept. 30 Dec. 29 Q4 Oct. 1 to Dec. 31 March 30 or 31 (of following year)
21.2 Annual Network Review
By Oct. 31 of the year, the regional monitoring technicians conduct an annual site review documenting the information requested on the annual site review forms, which is part of the agencies overall annual network review. SOP 2.43 describes this process. This review determines if the monitoring site and

QAPP for the DAQ PM Monitoring Program Revision 2 8/8/2019
Page 143 of 160
inlet locations meet the siting requirements and monitoring objectives defined in 40 CFR Part 58, Appendices A, D and E. The review identifies needed modifications to the site and network including termination or relocation of unnecessary stations or monitors or establishment of new stations or monitors. The regional monitoring technicians submit the forms to the regional monitoring coordinators, who review the forms and submit them to the RCO by Dec. 31 of the year. The PPB supervisor archives the network review forms in the IBEAM general documents module and provides them to the public and the EPA as appendices to the annual network-monitoring plan.
21.3 Annual Data Certification
The chief and PPB supervisor will prepare a data certification package for the chief’s signature by May 1 of each year. The report will consist of a letter, for signature, along with AQS generated summaries of PM concentration data collected during the previous year and all applicable QA data. The OAQPS and EPA Region 4 specify the exact AQS reports for the chief to submit. Generally, the chief submits an AMP600 and AMP450NC report.
The EPA requires state and local programs to report periodic assessments of SLAMS data quality for the PM network to EPA (40 CFR Part 58, Appendix A, Section 1.4). The DAQ issues the annual data certification report to meet this requirement. This document describes the quality objectives for measurement data as well as how DAQ met those objectives.
21.4 Annual Network Monitoring Plan
Following the requirements in 40 CFR Section 58.10(a), the State agency prepares and submits to the regional administrator an annual monitoring network plan by July 1 of each year. The plan provides for the establishment and maintenance of an air-quality surveillance system consisting of a network of SLAMS monitoring stations. The plan includes: (1) a statement of purpose for each monitor and (2) evidence that siting and operation of each monitor meets the requirements of appendices A, C, D and E of 40 CFR Part 58, where applicable. Before submission to the EPA, the DAQ makes the annual monitoring network plan available for public inspection for at least 30 days.
As required by 40 CFR Part 58, Appendix A, Section 5.1, DAQ provides a list of all monitoring sites and their AQS site identification codes to EPA Region 4 each year in the network plan. DAQ keeps AQS up-to-date by creating site data records with the date a site was established and other pertinent info. DAQ also sends any appropriate data to AIR Now Tech. Whenever there is a change in this list of monitoring sites or in a reporting organization between network plans, chief reports this change to EPA Region 4 via electronic mail and to AQS and AirNow-Tech by updating the appropriate site records.
21.5 Five-Year Network Assessment
DAQ conducts and submits to the EPA regional administrator an assessment of the air-quality surveillance system every 5 years, which is due on July 1. At a minimum, this assessment determines if the network meets the monitoring objectives defined in appendix D to Part 58, the DAQ needs to add new sites, if the DAQ no longer needs existing sites and can terminate them and if new technologies are

QAPP for the DAQ PM Monitoring Program Revision 2 8/8/2019
Page 144 of 160
appropriate for incorporation into the PM monitoring network. In the network assessment, DAQ considers the ability of existing and proposed sites to support air quality characterization for areas with relatively high populations of susceptible individuals (e.g., children with asthma). For any sites that DAQ proposes for discontinuance, DAQ also considers the effect on users of the data, other than the agency itself, such as nearby states and tribes or health effects studies. For PM2.5, the assessment also identifies needed changes to population-oriented sites. The chief submits a copy of this 5-year assessment, along with a revised annual network plan, to the regional administrator.
21.6 Internal System Audit Reports
The RCO audit chemist will perform an internal systems audit at least once every three years and ideally every year as well as when needed to verify that the PM program meets the data MQOs outlined in section 7.2. The RCO audit chemist will distribute copies of the systems audit report to the regional office air-quality supervisors, the ECB supervisor, the LAB supervisor, the PPB supervisor and the chief.
21.7 Response/Corrective Action Report
Currently, the regional monitoring technicians document any corrective action taken at the site in an e-log. The regional monitoring technicians do not send these e-logs to management but the regional monitoring coordinators and RCO PM and audit chemists review them. When the corrective action needed is beyond what the regional monitoring technician can handle at the site, the regional monitoring technician contacts the regional monitoring coordinator and the ECB electronics technicians. The ECB electronics technicians document all corrective actions taken on a 109 Form, which the ECB and PPB Supervisors review. When the RCO PM chemist corrects data already reported to AQS outside of the normal quarterly review process, he or she will document the changes on a data correction form. If the corrective action affects several days or months’ worth of data, involves systemic issues, or endangers meeting completeness, an RCO chemist also documents the corrective action in a memo to the chief and carbon copied to the regional monitoring coordinator. At the time of this QAPP, the chief and RCO PM and audit chemists are reviewing these procedures and they may revise them to streamline and improve the process.

QAPP for the DAQ PM Monitoring Program Revision 2 8/8/2019
Page 145 of 160
22.0 Data Validation and Usability Data review is the in-house examination to ensure that all of the equipment and people involved have recorded, transmitted, and processed the data correctly. It includes completeness checks to determine if there are any deficiencies such as missing data or lost integrity. The data reviewers should compare the data under evaluation to actual events, as per guidance (Guidance on Environmental Verification and Validation (EPA QA/G-8)). In addition, DAQ expects that some of the QC checks will indicate that the data fail to meet the acceptance criteria. The data reviewers shall invalidate or flag data identified as suspect, or does not meet the acceptance criteria, with AQS codes prior to upload to AQS.
Data verification is the process for evaluating the completeness, correctness, and conformance or compliance of the data set against method, procedural and contractual specifications. The EPA and DAQ further define verification as confirmation, through provision of objective evidence, that the data collection process fulfilled specified requirements. The verification process also involves the inspection and acceptance of the field samples.
Data validation is a routine process designed to ensure that reported values meet the quality goals of the environmental data operations. The EPA and DAQ further defined data validation as examination and provision of objective evidence that the data collection process fulfilled the particular requirements for a specific intended use. The primary intended use for the DAQ PM data set is NAAQS compliance. Thus, the DAQ must use a progressive, systematic approach to data validation to ensure and assess the quality of the data. Data validation includes the review of the DAQ PM data sets against the individual pollutant MQOs. Reviewing data long-term (over a monthly or quarterly period) provides information about the structure of the data and may identify patterns, relationships, or potential anomalies. If the RCO PM chemist finds a problem or discrepancy, he or she will conduct further investigations to find the source of the error and then correct it. Deviations from operational procedures or QA requirements that do not result in data invalidation may require that data be qualified with QA qualifier flags prior to upload to AQS.
22.1 Sampling Design
Sampling network design and monitoring site selection must comply with the following:
- 40 CFR Part 58, Appendix A - Quality Assurance Requirements for Monitors Used in Evaluations of National Ambient Air Quality Standards
- 40 CFR Part 58, Appendix D - Network Design Criteria for Ambient Air Quality Monitoring - 40 CFR Part 58, Appendix E - Probe and Monitoring Path Siting Criteria for Ambient Air
Quality Monitoring.
Guidance for Choosing a Sampling Design for Environmental Data Collection (EPA QA/G-5S) provides additional guidance.
The regional monitoring technicians shall thoroughly document any deviations from the minimum siting criteria (e.g., shelter location, inlet placement and/or monitor sight path requirements) in the site’s QC documentation. Examples of deviations include, but are not limited to, insufficient distance from
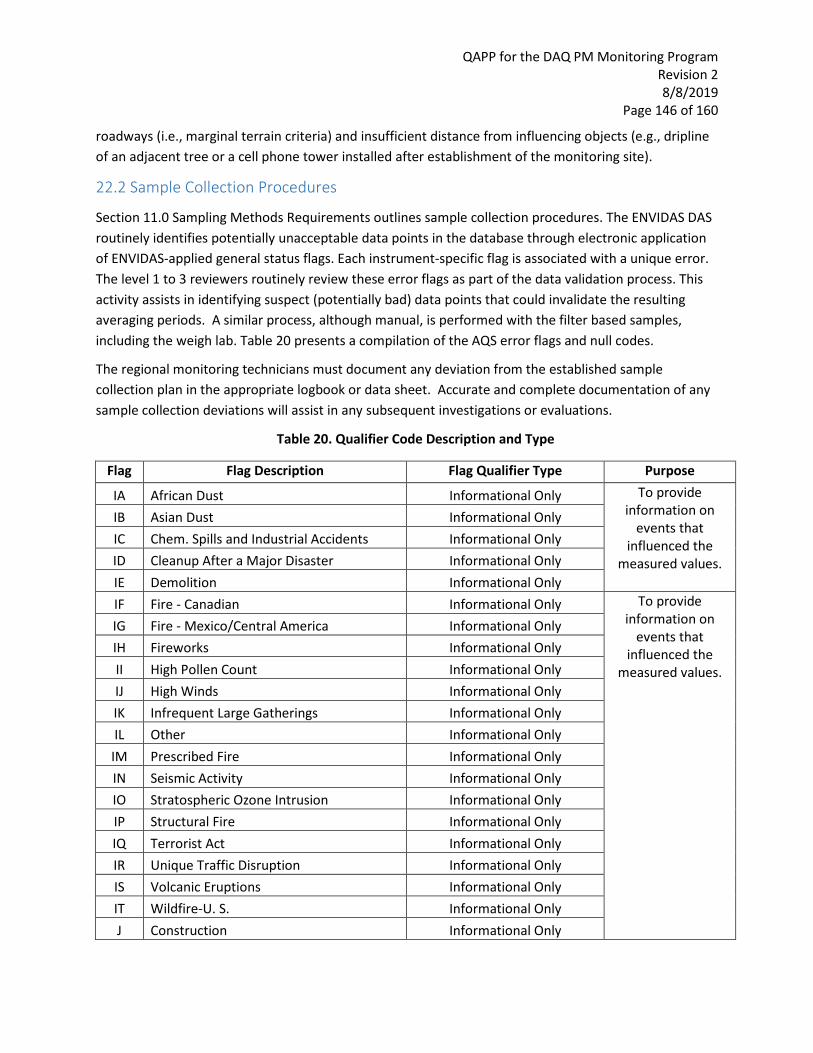
QAPP for the DAQ PM Monitoring Program Revision 2 8/8/2019
Page 146 of 160
roadways (i.e., marginal terrain criteria) and insufficient distance from influencing objects (e.g., dripline of an adjacent tree or a cell phone tower installed after establishment of the monitoring site).
22.2 Sample Collection Procedures
Section 11.0 Sampling Methods Requirements outlines sample collection procedures. The ENVIDAS DAS routinely identifies potentially unacceptable data points in the database through electronic application of ENVIDAS-applied general status flags. Each instrument-specific flag is associated with a unique error. The level 1 to 3 reviewers routinely review these error flags as part of the data validation process. This activity assists in identifying suspect (potentially bad) data points that could invalidate the resulting averaging periods. A similar process, although manual, is performed with the filter based samples, including the weigh lab. Table 20 presents a compilation of the AQS error flags and null codes.
The regional monitoring technicians must document any deviation from the established sample collection plan in the appropriate logbook or data sheet. Accurate and complete documentation of any sample collection deviations will assist in any subsequent investigations or evaluations.
Table 20. Qualifier Code Description and Type
Flag Flag Description Flag Qualifier Type Purpose
IA African Dust Informational Only To provide information on
events that influenced the
measured values.
IB Asian Dust Informational Only IC Chem. Spills and Industrial Accidents Informational Only ID Cleanup After a Major Disaster Informational Only IE Demolition Informational Only IF Fire - Canadian Informational Only To provide
information on events that
influenced the measured values.
IG Fire - Mexico/Central America Informational Only IH Fireworks Informational Only II High Pollen Count Informational Only IJ High Winds Informational Only IK Infrequent Large Gatherings Informational Only IL Other Informational Only IM Prescribed Fire Informational Only IN Seismic Activity Informational Only IO Stratospheric Ozone Intrusion Informational Only IP Structural Fire Informational Only IQ Terrorist Act Informational Only IR Unique Traffic Disruption Informational Only IS Volcanic Eruptions Informational Only IT Wildfire-U. S. Informational Only J Construction Informational Only
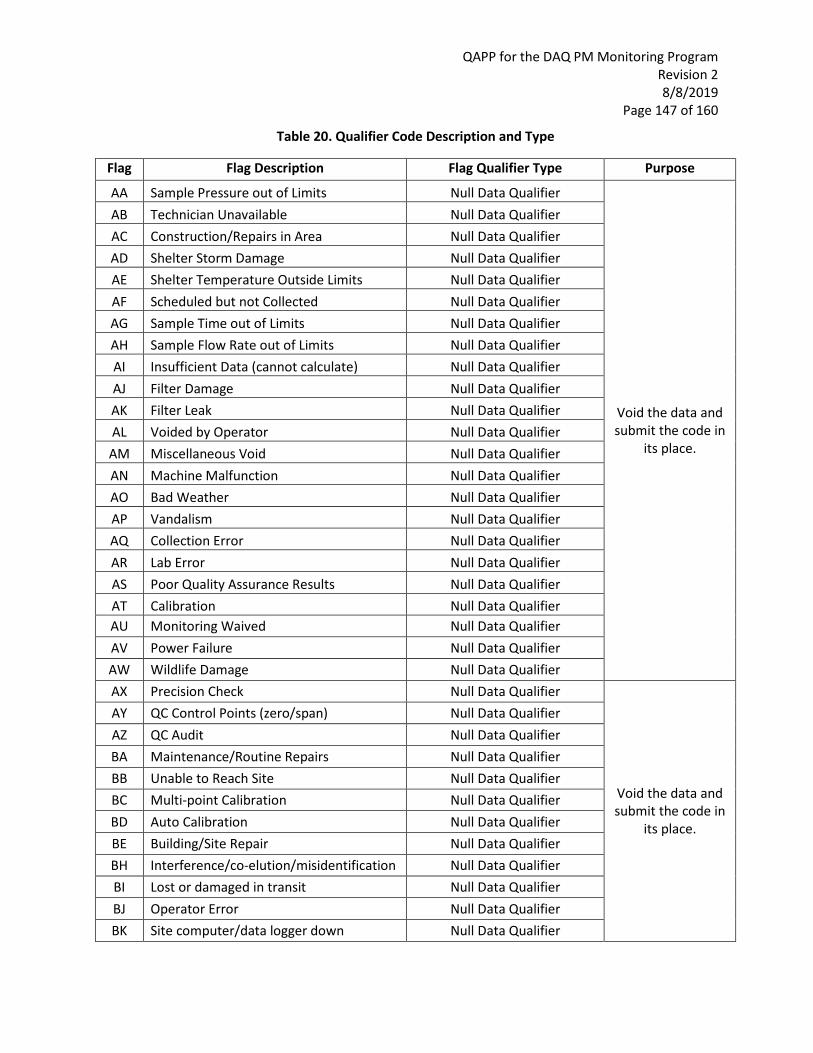
QAPP for the DAQ PM Monitoring Program Revision 2 8/8/2019
Page 147 of 160
Table 20. Qualifier Code Description and Type
Flag Flag Description Flag Qualifier Type Purpose
AA Sample Pressure out of Limits Null Data Qualifier
Void the data and submit the code in
its place.
AB Technician Unavailable Null Data Qualifier AC Construction/Repairs in Area Null Data Qualifier AD Shelter Storm Damage Null Data Qualifier AE Shelter Temperature Outside Limits Null Data Qualifier AF Scheduled but not Collected Null Data Qualifier AG Sample Time out of Limits Null Data Qualifier AH Sample Flow Rate out of Limits Null Data Qualifier AI Insufficient Data (cannot calculate) Null Data Qualifier AJ Filter Damage Null Data Qualifier AK Filter Leak Null Data Qualifier AL Voided by Operator Null Data Qualifier AM Miscellaneous Void Null Data Qualifier AN Machine Malfunction Null Data Qualifier AO Bad Weather Null Data Qualifier AP Vandalism Null Data Qualifier AQ Collection Error Null Data Qualifier AR Lab Error Null Data Qualifier AS Poor Quality Assurance Results Null Data Qualifier AT Calibration Null Data Qualifier AU Monitoring Waived Null Data Qualifier AV Power Failure Null Data Qualifier AW Wildlife Damage Null Data Qualifier AX Precision Check Null Data Qualifier
Void the data and submit the code in
its place.
AY QC Control Points (zero/span) Null Data Qualifier AZ QC Audit Null Data Qualifier BA Maintenance/Routine Repairs Null Data Qualifier BB Unable to Reach Site Null Data Qualifier BC Multi-point Calibration Null Data Qualifier BD Auto Calibration Null Data Qualifier BE Building/Site Repair Null Data Qualifier BH Interference/co-elution/misidentification Null Data Qualifier BI Lost or damaged in transit Null Data Qualifier BJ Operator Error Null Data Qualifier BK Site computer/data logger down Null Data Qualifier

QAPP for the DAQ PM Monitoring Program Revision 2 8/8/2019
Page 148 of 160
Table 20. Qualifier Code Description and Type
Flag Flag Description Flag Qualifier Type Purpose
BL QA Audit Null Data Qualifier BM Accuracy check Null Data Qualifier BN Sample Value Exceeds Media Limit Null Data Qualifier BR Sample Value Below Acceptable Range Null Data Qualifier CS Laboratory Calibration Standard Null Data Qualifier
DA Aberrant Data (Corrupt Files, Aberrant Chromatography, Spikes, Shifts) Null Data Qualifier
DL Detection Limit Analyses Null Data Qualifier FI Filter Inspection Flag Null Data Qualifier
MB Method Blank (Analytical) Null Data Qualifier SA Storm Approaching Null Data Qualifier SC Sampler Contamination Null Data Qualifier ST Calibration Verification Standard Null Data Qualifier
TC Component Check and Retention Time Standard Null Data Qualifier
TS Holding Time or Transport Temperature Is Out of Specs. Null Data Qualifier
XX Experimental Data Null Data Qualifier
1 Deviation from a CFR/Critical Criteria Requirement Quality Assurance Qualifier
Flag indicating the quality of the data
2 Operational Deviation Quality Assurance Qualifier 3 Field Issue Quality Assurance Qualifier 4 Lab Issue Quality Assurance Qualifier 5 Outlier Quality Assurance Qualifier 6 QAPP Issue Quality Assurance Qualifier 7 Below Lowest Calibration Level Quality Assurance Qualifier
Flag indicating the quality of the data. In some cases, the data may not meet all the criteria but
is still valid.
9 Negative value detected - zero reported Quality Assurance Qualifier CB Values have been Blank Corrected Quality Assurance Qualifier
CL Surrogate Recoveries Outside Control Limits Quality Assurance Qualifier
DI Sample was diluted for analysis Quality Assurance Qualifier EH Estimated; Exceeds Upper Range Quality Assurance Qualifier FB Field Blank Value Above Acceptable Limit Quality Assurance Qualifier FX Filter Integrity Issue Quality Assurance Qualifier HT Sample pick-up hold time exceeded Quality Assurance Qualifier LB Lab blank value above acceptable limit Quality Assurance Qualifier

QAPP for the DAQ PM Monitoring Program Revision 2 8/8/2019
Page 149 of 160
Table 20. Qualifier Code Description and Type
Flag Flag Description Flag Qualifier Type Purpose
LJ Identification of Analyte is Acceptable; Reported Value Is an Estimate Quality Assurance Qualifier
LK Analyte Identified; Reported Value May Be Biased High Quality Assurance Qualifier
LL Analyte Identified; Reported Value May Be Biased Low Quality Assurance Qualifier
MD Value less than MDL Quality Assurance Qualifier MS Value reported is 1/2 MDL substituted. Quality Assurance Qualifier MX Matrix Effect Quality Assurance Qualifier ND No Value Detected Quality Assurance Qualifier NS Influenced by nearby source Quality Assurance Qualifier QX Does not meet QC criteria Quality Assurance Qualifier SQ Values Between SQL and MDL Quality Assurance Qualifier
SS Value substituted from secondary monitor Quality Assurance Qualifier
SX Does Not Meet Siting Criteria Quality Assurance Qualifier TB Trip Blank Value Above Acceptable Limit Quality Assurance Qualifier TT Transport Temperature is Out of Specs. Quality Assurance Qualifier V Validated Value Quality Assurance Qualifier
VB Value below normal; no reason to invalidate Quality Assurance Qualifier
W Flow Rate Average out of Spec. Quality Assurance Qualifier
X Filter Temperature Difference out of Spec. Quality Assurance Qualifier
Y Elapsed Sample Time out of Spec. Quality Assurance Qualifier RA African Dust Request Exclusion
Flags data influenced by an
exceptional event for which the
agency will request an exclusion.
RB Asian Dust Request Exclusion RC Chemical Spills and Industry Accidents Request Exclusion RD Cleanup After a Major Disaster Request Exclusion RE Demolition Request Exclusion RF Fire - Canadian Request Exclusion RG Fire - Mexico/Central America Request Exclusion RH Fireworks Request Exclusion RI High Pollen Count Request Exclusion RJ High Winds Request Exclusion RK Infrequent Large Gatherings Request Exclusion RL Other Request Exclusion

QAPP for the DAQ PM Monitoring Program Revision 2 8/8/2019
Page 150 of 160
Table 20. Qualifier Code Description and Type
Flag Flag Description Flag Qualifier Type Purpose
RM Prescribed Fire Request Exclusion RN Seismic Activity Request Exclusion RO Stratospheric Ozone Intrusion Request Exclusion RP Structural Fire Request Exclusion RQ Terrorist Act Request Exclusion RR Unique Traffic Disruption Request Exclusion RS Volcanic Eruptions Request Exclusion RT Wildfire-U. S. Request Exclusion
22.3 Sample Handling
The Regional Monitoring Staff records pertinent deviations from established sample-handling protocols for each sample physically retrieved from the monitoring site and equipment. He or she shall record these deviations on the sample custody sheet assigned to each filter for PM and recorded in the applicable electronic database for all other criteria pollutants. The lab analyst, likewise, records deviations in samples and sample handling.
22.4 Analytical Procedures
Data reviewers shall insure that the gravimetric analysis of filter based samples has been performed in accordance with regulatory requirements found in Appendix L, Section 8. To do this, data reviewers will review lab data manually and through electronic means to insure all method specification were met as found in table 7 of this QAPP. Lab data that does not meet these requirements will be voided or flagged as suspect.
22.5 Quality Control
Section 14.0 Quality Control Requirements and Procedures specifies the QC checks Regional Monitoring Staff must perform during monitoring, sample collection and analysis. These include the analysis of monthly or semi-monthly flow rate verifications, which provide indications of the quality of data produced by specified components of the measurement process. SOPS 2.24.2, 2.37.2, and 2.46.2 (See Table 17 for SOP titles) specify the procedure, acceptance criteria and corrective action (and changes) for each QC check. Data validation should document the corrective actions taken, affected PM sampling days or hours and the potential effect of the actions on the validity of the data. SOPS 2.24.2, 2.24.3, 2.37.2, and 2.46.2 provide further information about monthly flow rate verifications and PM laboratory QC.
22.4 Calibration
Section 14.0 Quality Control Requirements and Procedures addresses the calibration of the PM monitors along with the information the Regional Monitoring Staff should present to demonstrate they

QAPP for the DAQ PM Monitoring Program Revision 2 8/8/2019
Page 151 of 160
performed the calibrations correctly and the results are acceptable. When a level 1 to 3 reviewer identifies calibration problems, a level 1 to 3 data reviewer should flag any data produced between the suspect calibration event and any subsequent recalibration to alert data users. SOPS 2.24.2, 2.24.3, 2.37.2, and 2.46.2 (see Table 17 for SOP titles) provide further information about calibrations.
22.5 Data Reduction and Processing
As mentioned in the above sections, the EPA will perform external TSAs and the DAQ will perform internal TSAs to ensure the level 1 to 3 data reviewers follow the data reduction and processing activities mentioned in the QAPP. The level 1 to 3 data reviewers will review continuous PM data monthly and manual PM data quarterly to ensure that associated flags or any other data qualifiers have been appropriately associated with the data. An RCO audit chemist will review the data quarterly to ensure that regional monitoring and ECB electronics technicians, coordinators and other RCO chemists took appropriate corrective actions.
22.6 Exceptional Events
The regulations at 40 CFR Section 50.14 allows the EPA Administrator to exclude certain data from use for determinations of exceedances and violations of a NAAQS, so long as a state or local agency demonstrates to the Administrator's satisfaction that an “exception event” caused the exceedance or violation. The regulations at 40 CFR Section 50.1 define an "Exceptional Event" as an event or events, in which:
- The resulting emissions affect air quality in such a way that there exists a clear causalrelationship between the specific event(s) and the monitored exceedance(s) or violation(s);
- The event(s) is not reasonably controllable or preventable; and- The event(s) is caused by a human activity that is unlikely to recur at that location or is a natural
event(s).
An exceptional event does not include:
- Air pollution relating to source noncompliance;- Stagnation of air masses or meteorological inversions; and- Meteorological events involving high temperatures or lack of precipitation.
Conditions involving high temperatures or a lack of precipitation may promote occurrences of some types of exceptional events, such as wildfires or high wind events, which do directly cause emissions.
The EPA does not consider data impacted by an exceptional event "representative" of air quality for NAAQS comparison purposes, or calculation of certain summary statistics. The RCO PM chemist should flag all concentration data affected by an exceptional event with an AQS information code and linked within AQS to an event description. Exceptional event codes and descriptions should be added to AQS during the monthly data review or as soon as possible, thereafter, but no later than the schedule established by Federal rulemaking.
QAPP for the DAQ PM Monitoring Program Revision 2 8/8/2019
Page 152 of 160
It is the responsibility of the RCO PM Chemist to analyze the data for potential exceptional events and to add the necessary flags and descriptions into AQS by the applicable regulatory due dates.
To obtain concurrence with an exceptional event the RCO must notify and cooperate with the EPA Regional Office to prepare a demonstration package for the Administrator. When the chief submits a demonstration package, the RCO PM Chemist and database manager will change the informational flags in AQS to request exclusion flags.
Exceptional event data in AQS must receive concurrence from the EPA administrator. Data that does not receive a concurrence is still eligible for NAAQS comparisons, regardless of the application of request exclusion flags.

QAPP for the DAQ PM Monitoring Program Revision 2 8/8/2019
Page 153 of 160
23.0 Verification and Validation Methods Data verification is the process of evaluating the completeness, correctness and conformance of a specific data set against the method, procedural or contractual requirements, as specified in both the SOPs and 40 CFR Part 58. Data validation is a routine process that extends the evaluation of data beyond method, procedural or contractual compliance (i.e. data verification) to ensure that reported values meet the quality goals of the environmental data operations and that the data can be used for its intended purpose.
The DAQ uses the validation templates provided in Table 7 to Table 12 for the weight of evidence approach afforded to PQAOs within 40 CFR Part 58, Appendix A. The DAQ follows the guidance in the QA handbook regarding the use of these templates and handles the criteria as follows:
- Critical Criteria- Deemed critical to maintaining the integrity of a sample (or ambient air concentration value) or group of samples. The level 1 to 3 reviewers should invalidate observations that do not meet each criterion on the critical table unless there are compelling reasons and justification for not doing so. The sample or group of samples that do not meet one or more of these criteria is invalid until proven otherwise. In most cases, the CFR dictates the requirement, the implementation frequency of the criteria, and the acceptance criteria so these criteria are therefore regulatory in nature.
- Operational Criteria - Violation of a criterion or a number of criteria may be cause for invalidation. The data validator should consider other QC information that may or may not indicate the data are acceptable for the parameter they want to control. Therefore, the sample or group of samples, which do not meet one or more of these criteria, is suspect unless other QC information demonstrates otherwise and the reviewers have adequate documentation of that information. The level 1, 2 and 3 reviewers should investigate, mitigate or justify the reason for not meeting the criteria.
- Systematic Criteria - include those criteria which are important for the correct interpretation of the data, but do not usually affect the validity of a sample or group of samples. An example criterion is that at least 75 percent of the scheduled samples for each quarter should be successfully collected and validated. The DQOs are also included in this table. If the data do not meet the DQOs, this does not invalidate any of the samples but it may affect the confidence in the attainment/non-attainment decision.
- The designation of QC checks or QC samples as Operational or Systematic does not imply that the regional monitoring and ECB electronics technicians do not need to perform these QC checks. Not performing an operational or systematic QC check required by regulation can be a basis for invalidation of all associated data. The DAQ applies the validation templates only to small datasets (single values or a few weeks of information) and does not allow a criterion to be in non-conformance simply because it is operational or systematic.
The following levels of data review describe the overall DAQ data verification and validation process,

QAPP for the DAQ PM Monitoring Program Revision 2 8/8/2019
Page 154 of 160
including the individuals responsible for the stated activities.
23.1 Validating and Verifying Data
23.1.1 Continuous PM Data
The validation and verification procedures that DAQ will employ for the continuously monitored data collected shall conform to the validation SOPs 2.41.3 and 2.41.4 listed in Table 17. Guidance on Environmental Verification and Validation, (EPA QA/G-8) also discusses verification and validation issues at length. The regional monitoring technicians and coordinators shall perform all verification activities. The RCO PM chemist shall provide additional support through a final review of all data reconciling any anomalies through discussions with the regional office. Following the final review, the RCO PM chemist will provide a final validation of all data. The RCO PM chemist will also provide QA/QC support.
The DAQ compares data under evaluation to actual events as specified in SOPs 2.41.3 and 2.41.4. However, significant and unusual field events may occur and field activities may negatively affect the integrity of samples. In addition, the DAQ expects that some of the QC checks will indicate the data fail to meet the acceptance criteria. The DAQ shall void or flag data identified as suspect or does not meet the acceptance criteria, using the codes in Table 20.
The DAQ verifies and validates the continuously collected data and its associated QC data monthly. Presently, for the continuously collected data, monthly is the most efficient period for these verification and validation activities. The DAQ finds that if DAQ can control the measurement uncertainty each month, then DAQ will maintain the overall measurement uncertainty for the one-year and three-year periods within the precision and bias DQOs.
23.1.2 Intermittent PM Data
The validation and verification procedures that DAQ employs for the intermittently collected data conform to the validation template for FRM data provided in Table 7 of this QAPP. Guidance on Environmental Verification and Validation, (EPA QA/G-8) also discusses verification and validation issues at length. The RCO PM chemist shall perform all verification activities with assistance from the LAB technician and chemist, the RCO LAB QA chemist, and the regional monitoring coordinators and technicians. The RCO PM chemist shall provide additional support through a final review of all data reconciling any anomalies through discussions with the regional monitoring technicians and coordinators. Following the final review, the RCO PM chemist will provide a final validation of all data. The RCO PM chemist will also provide QA/QC support.
The DAQ compares the data undergoing evaluation to actual events as specified in Figure 2 and Section 9 of SOPs 2.41.3 and 2.41.4. However, significant or unusual field events may occur and field activities may negatively affect the integrity of samples. In addition, the DAQ expects that some of the QC checks will indicate the data fail to meet the acceptance criteria. The DAQ shall void or flag data identified as suspect or does not meet the acceptance criteria, as indicated in Table 20.
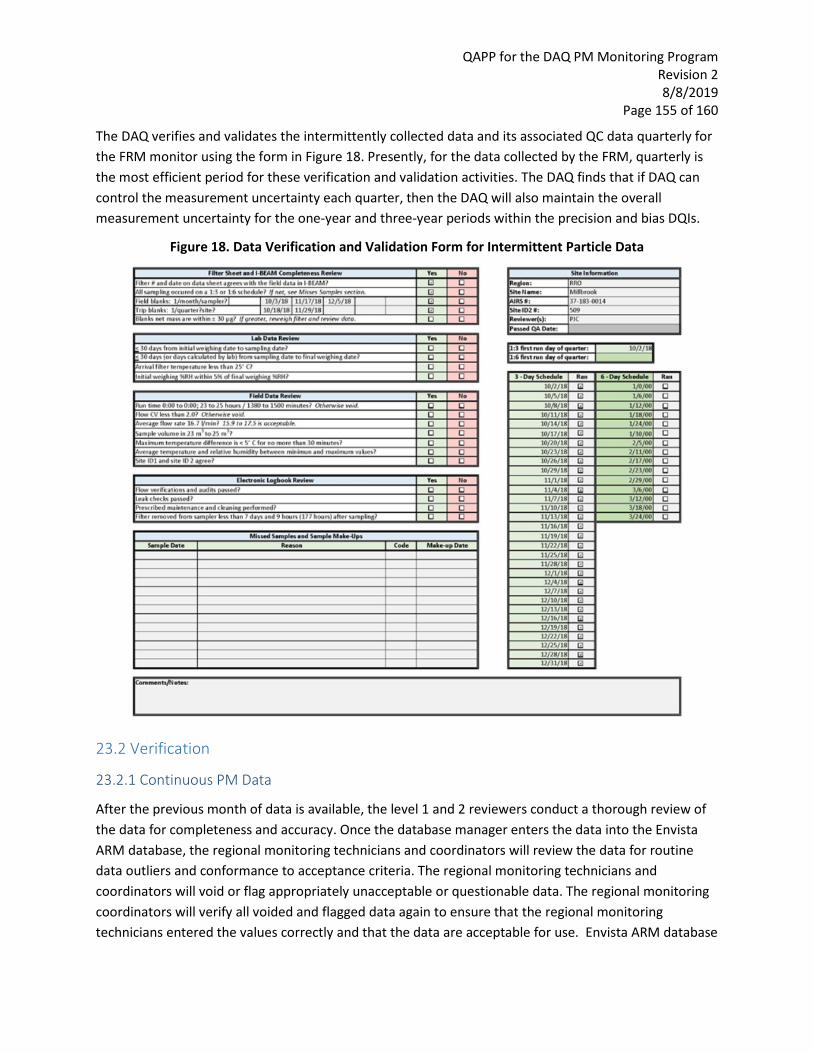
QAPP for the DAQ PM Monitoring Program Revision 2 8/8/2019
Page 155 of 160
The DAQ verifies and validates the intermittently collected data and its associated QC data quarterly for the FRM monitor using the form in Figure 18. Presently, for the data collected by the FRM, quarterly is the most efficient period for these verification and validation activities. The DAQ finds that if DAQ can control the measurement uncertainty each quarter, then the DAQ will also maintain the overall measurement uncertainty for the one-year and three-year periods within the precision and bias DQIs.
Figure 18. Data Verification and Validation Form for Intermittent Particle Data
23.2 Verification
23.2.1 Continuous PM Data
After the previous month of data is available, the level 1 and 2 reviewers conduct a thorough review of the data for completeness and accuracy. Once the database manager enters the data into the Envista ARM database, the regional monitoring technicians and coordinators will review the data for routine data outliers and conformance to acceptance criteria. The regional monitoring technicians and coordinators will void or flag appropriately unacceptable or questionable data. The regional monitoring coordinators will verify all voided and flagged data again to ensure that the regional monitoring technicians entered the values correctly and that the data are acceptable for use. Envista ARM database

QAPP for the DAQ PM Monitoring Program Revision 2 8/8/2019
Page 156 of 160
provides documentation for reviews of completeness and accuracy, and can also provide automated reports of such actions.
23.2.2 Intermittent PM Data
After the previous quarter of data is available for the FRM, the RCO PM chemist conducts a thorough review of the data for completeness and accuracy. Once the regional monitoring coordinators enter the site data into IBEAM, and the LAB technician enters the laboratory data into IBEAM, the RCO PM chemist will review the data for routine data outliers and conformance to acceptance criteria. The RCO PM chemist will void unacceptable data and flag questionable data.
23.3 Validation
Validation of continuously obtained measurement data is performed by DAQ using a three tiered approach. The Envista ARM database retains records of all invalid data. Information shall include a summary of why the level 1 to 3 reviewers invalidated the measurement along with the associated void codes. Logbook notes and field data sheets shall have more detailed information regarding the reason a reviewer voided or flagged a measurement.
The DAQ brackets all PM data by flow verifications or a calibration before and after any invalidated period. This requirement ensures that the PM monitors were in proper operating condition before and after the incident.
Data validation occurs monthly for continuous collected data and quarterly for intermittently collected data. The discussion below outlines the review, verification and validation processes. The organizational chart in Figure 1 labels the specific roles for review level 1 through 3 within the organization.
Level 0 Review – The Envidas DAS does the level 0 review.
• Acquire hourly data. • Flag missing and irregular data with pre-programmed, user-defined status flags.
Level 1 Review – The regional monitoring technicians do the level 1 review.
• Review daily for anomalies and completeness and acquire missing data if available. • Flag data collected during an hour where the temperature was not within the
acceptable range. • Verify maximum daily values for validity and take appropriate action if necessary. • Assess data for values or outliers outside of the acceptable ranges. • Review the hourly values for any exceedances and take appropriate action if necessary. • Flag data as necessary for further investigation. • Apply necessary AQS codes from Table 20 for hours in which maintenance or
calibrations were occurring.
QAPP for the DAQ PM Monitoring Program Revision 2 8/8/2019
Page 157 of 160
Level 2 Review (Verification) – The regional monitoring coordinators do the level 2 review.
• Review site records (operator logbook, site data sheets). • Review operator checks (leak checks, filter changes, monthly flow verifications, very
sharp cut cyclone or VSCC cleaning, maintenance). • Assess data for values or outliers outside of the acceptable ranges. • Compare pollutant data with wind direction data. • Determine if mobile or area source specific emissions caused any irregularities. • Flag data as necessary for further investigation. • Ensure level 1 reviewers used consistent reasons for data invalidation throughout the
monitoring period to indicate calibrations, audits, etc. • Resolve any inconsistencies, anomalies or systemic issues.
Level 3 Review (Validation) – The RCO PM Chemist does the level 3 review.
• Ensure the proper null codes are used. • Ensure the level 1 and 2 reviewers bracketed all invalidated data with the appropriate
void codes and the correct checks of analyzer accuracy. • Ensure all data falls within the acceptable ranges as stated in the MQOs. • Ensure all data is acceptable and can be used for its intended purpose. • Review minute data as needed when completing the level 3 review procedures. • Add informational AQS flags (from Table 20) to describe data that is out of the ordinary
but may be considered “valid.” • Provide final validation signature.
For filter based sampling, a similar tiered review process is performed. The FRM sampler will provide status codes when pre-programed specifications have been exceeded (level zero). Levels 1-3 data reviews look at these codes when reviewing data in addition to the other specifications needed for the method found in table 7 of this QAPP. Currently, the RCO LAB QA chemist currently is developing a level 1 through 3 data review approach, along the same form as above, for the laboratory data and will revise this QAPP when the LAB implements it.
The DAQ uses a weight of evidence approach in validating data. After level 1 and 2 verifications, the independent level 3 reviewer determines the validity of the data by reviewing:
- The hourly and 24-hour values; - Verifications and calibrations; - e-logs and the information documented therein; - Nearby concentrations; - Collocated results of sample pairs; - Correspondence with the regional monitoring technicians and coordinators and ECB electronics
technicians; and - The results of DAQ and EPA performance evaluations.

QAPP for the DAQ PM Monitoring Program Revision 2 8/8/2019
Page 158 of 160
The weight the reviewer should give to the available evidence depends on factors such as the quality of the data, consistency of results, nature and severity of effects and relevance of the information. The weight of evidence approach requires use of scientific judgment and, therefore, it is essential for the regional monitoring technicians and coordinators to provide adequate and reliable documentation.
As a general principle, the more information the regional monitoring technician provides, the stronger the weight of evidence is. The regional monitoring technicians and coordinators should present the information in a structured and organized way and the data validator should consider the robustness and reliability of the different data sources to support any justification for validating or invalidating data. At the time of this QAPP revision the chief and RCO PM and audit chemists are reviewing the data validation SOPs and will augment them with more detailed procedures. The chief and RCO PM and audit chemists will update this QAPP when they complete those revisions.
The regional monitoring technicians and coordinators will complete the level 1 and 2 reviews within 20 calendar days from the end of the monitoring month. The RCO PM Chemist will complete the level 3 review 20 calendar days after the level 2 review is completed. The independent RCO audit Chemist will complete a review of the validated data after the database manager uploads it to AQS within 40 calendar days after the level 3 review is completed. A similar process for PM intermittent sampling is in place, but does not have the same time limitations as with continuous monitors.
As discussed earlier, the EPA and DAQ have developed certain criteria based upon federal requirements and field operator judgment that the level 1 to 3 reviewers will use to invalidate a sample or measurement. The level 1 to 3 reviewers shall use the null data codes listed in Table 20 to indicate they have invalidated individual measurements or groups of measurements from an instrument.

QAPP for the DAQ PM Monitoring Program Revision 2 8/8/2019
Page 159 of 160
24.0 Reconciliation with Data Quality Objectives Section 5.0 Problem Definition and Background describes the objectives of the PM monitoring program. Section 7.0 Quality Objectives and Criteria for Measurement Data describes the DQO’s for the PM monitoring program. The AQS AMP256 and AMP600 reports are automated reports based on data uploaded to AQS. These reports provide summary statistics for the PM monitoring program data collected.
The RCO audit chemist on behalf of the chief will analyze the results of both the AQS AMP256 and AMP600 reports on a quarterly and annual basis to ensure that all monitoring stations meet the required DQO’s. If the data from at least one of the monitors violates the DQI bias and/or precision limits, then the RCO audit and PM chemists will investigate to uncover the cause of the violation. If all the monitors in the network of a similar type or pollutant violate the DQI, the cause may be at the agency level (operator training) or higher (problems with method designation). If only one monitor or site violates the DQI, the cause is more likely specific to the site (site operator, problem with the site). Tools for determining the cause include reviewing:
- Data from a collocated network (local or tribal program, nearby reporting organizations, national) - Data from performance audits (PEP)
Once RCO chemists have identified a cause, DAQ will implement an appropriate corrective action. Some courses of action include:
- Determining the level of aggregation at which DAQ violated the DQOs: The results of the DQAs tell which monitors are having problems, since the EPA developed the DQOs at the monitor level. To determine the level at which to take corrective action, DAQ must determine whether the violations of the DQOs are unique to one site, multiple sites, or a network of similar monitors, or caused by a broader problem. The AQS generates QA reports summarizing bias and precision statistics at the national and reporting organization levels by method designation. Examination of these reports may assist in determining the level at which the DQOs are being violated.
- Communicating with EPA Region 4: If the DAQ finds a violation of the bias and precision DQIs, the chief will remain in close contact with EPA for both assistance and for communication.
- Extensively reviewing quarterly data until the DAQ achieves the DQOs: The chief will continue to review extensively the quarterly QA reports and the QC summaries until the DAQ attains the bias and precision limits.
Ultimately specifying tolerable error limits reduces the probability of making an error in a decision due to uncertainty in the data. Decision makers, such as EPA, need to determine if the data collected within the DAQ monitoring network will be less than, equal to, or greater than the level of the NAAQS for each specific criteria pollutant. The annual data certification process, and reports generated as part of the certification, provide a quantitative assessment of the measurement uncertainty within the DAQ criteria pollutant data set. By controlling uncertainty in the data to the extent prescribed by the DQOs, decision makers can use DAQ's ambient air monitoring data with confidence.

QAPP for the DAQ PM Monitoring Program Revision 2 8/8/2019
Page 160 of 160
Revision History Page Description Revision 1 – From November 1998 to February 2018 5 Changed George C. Murray, Thomas Manuszak and Louis Pat Bello to Patrick Butler, Joette Steger and Paul Chappin.
17-18 Updated Section 1.0 Project Description to Section 5.0 Problem Definition and Background.
11-16 Updated Section 2.0 Project Organization and Responsibilities to Section 4.0 Project/Task Organization.
23-66 Updated Section 3.0 Quality Assurance Objectives for Measurement Data to Section 7.0 Quality Objectives and Criteria for Measurement Data.
76-80 Updated Section 4.0 Sampling Methods Requirements to Section 11.0 Sampling Methods Requirements.
81-84 Updated Section 5.0 Sampling Custody to Section 12.0 Sample Handling and Custody.
87-91 Updated Section 6.0 Instrument Calibration and Frequency to Section 14.0 Quality Control Requirement and Procedures.
85-86 Updated Section 7.0 Analytical Procedures to Section 13.0 Analytical Methods.
112-118 Updated Section 8.0 Calculations, Validation, and Reporting of PM2.5 Monitoring Data to Section 22.0 Data Validation and Usability.
87-91 Updated Section 9.0 Analytical Procedures to Section 14.0 Quality Control Requirements and Procedures.
103-108 Updated Section 10.0 Performance Evaluation Procedures to Section 20.0 Assessment and Response Actions.
92-93 Updated Section 11.0 Maintenance Procedures to Section 15.0 Equipment Testing, Inspection and Maintenance Requirements.
119-120 Updated Section 12.0 Assessment of Measurement Uncertainty for Monitoring Data to Section 23.0 Verification and Validation Methods.
85-86 Updated Section 13.0 Corrective Actions to Section 13.0 Analytical Methods.
109-111 Updated Section 14.0 Quality Assurance Reports to Section 21.0 Reports to Management.


