86
Quality Brands Drive Sustained Value Creation Year ended March 31, 2009 Annual Report 2009

Qua l i t y Br ands Drive Susta ined Va l u e C r e a t i o n
Year ended March 31, 2009
Annual Report 2009
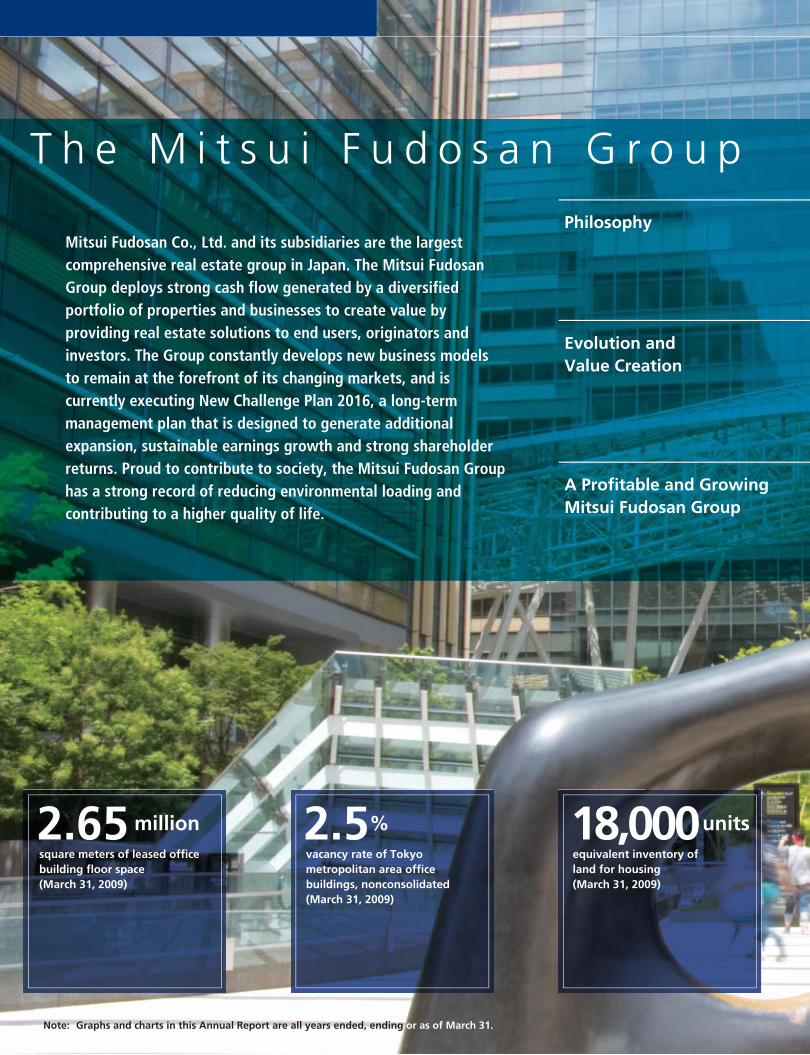
Mitsui Fudosan Co., Ltd. and its subsidiaries are the largest comprehensive real estate group in Japan. The Mitsui Fudosan Group deploys strong cash flow generated by a diversified portfolio of properties and businesses to create value by providing real estate solutions to end users, originators and investors. The Group constantly develops new business models to remain at the forefront of its changing markets, and is currently executing New Challenge Plan 2016, a long-term management plan that is designed to generate additional expansion, sustainable earnings growth and strong shareholder returns. Proud to contribute to society, the Mitsui Fudosan Group has a strong record of reducing environmental loading and contributing to a higher quality of life.
2.65 millionsquare meters of leased office building floor space (March 31, 2009)
2.5%vacancy rate of Tokyo metropolitan area office buildings, nonconsolidated (March 31, 2009)
Note: Graphs and charts in this Annual Report are all years ended, ending or as of March 31.
18,000unitsequivalent inventory of land for housing (March 31, 2009)
T h e M i t s u i F u d o s a n G r o u p
Philosophy
Evolution and Value Creation
A Profitable and Growing Mitsui Fudosan Group

¥2.8 trillionin assets under management (March 31, 2009)
40%compound annual growth innet income per share over the past five years
Consolidated Financial Highlights 2
An Interview with President and CEO Hiromichi Iwasa 3
Quality Brands Drive Sustained Value Creation 9
Corporate 10
Office Buildings 11
Retail Facilities 12
Residential 13
Urban Renaissance 14
Asset Management 15
Review of Operations 16
Mitsui Fudosan at a Glance 16
Holding Business 18
Trading Business 22
Management Business 26
Corporate Governance 28
Management Team 31
Corporate Social Responsibility 32
Financial Section 35
Corporate Information 75
C o n t e n t s
Seeking to link diverse values and coexist in
harmony with society, as symbolized by the
Mitsui Fudosan logo , we will work to
foster social and economic development and
benefit the environment.
By bringing knowledge and experience
together in diverse ways, we seek to advance the real estate business and create new value, both at home and abroad, appropriate
to global changes in social environments and
market structures.
We seek to create a profitable and growing
Mitsui Fudosan Group, acting honestly and
fairly to realize the capabilities of the entire
organization.
1

Thousands ofMillions of yen U.S. dollars
except per share amounts Percent change (Note 1)
2009 2008 2007 2009/2008 2009For the Year
Revenue from operations ¥1,418,946 ¥1,360,023 ¥1,229,194 4.3% $14,445,139Operating income 171,547 179,282 161,843 (4.3) 1,746,381Net income 83,572 87,378 75,214 (4.4) 850,779Cash dividends 19,324 15,812 8,794 22.2 196,772
At Year-EndTotal assets ¥3,758,387 ¥3,634,489 ¥3,294,190 3.4% $38,261,091Total net assets 999,860 992,003 963,214 0.8 10,178,764Interest-bearing debt 1,733,559 1,550,421 1,258,427 11.8 17,647,959
Yen Percent change U.S. dollars (Note 1)
Per Share DataNet income (Basic) ¥ 95.1 ¥ 99.4 ¥ 85.5 (4.3)% $ 0.968Cash dividends 22.0 20.0 14.0 10.0 0.224
Key IndicatorsNet income/revenue from operations (%) 5.9 6.4 6.1Total net assets/total assets (%) 26.6 27.3 29.2Debt/equity ratio (times) (Note 2) 1.77 1.60 1.33ROA (%) (Note 3) 5.06 5.53 5.50ROE (%) (Note 4) 8.57 9.12 8.35
Consolidated Financial HighlightsMitsui Fudosan Co., Ltd. and its SubsidiariesYears ended March 31, 2009, 2008 and 2007
0
40
80
120
200
160
2005 2006 2007(Years ended March 31)
2008
115.8
137.5
161.8
179.3
0
4
8
12
20
16
10.4
11.913.2 13.2
2009
171.5
12.1
0
50
25
75
100
0
100
50
2005 2006 2007(Years ended March 31)
2008
28.7
56.5
75.2
87.4
2009
83.6
34.7
85.599.4 95.1
67.5
0
300
600
900
1,200
1,500
2005 2006 2007(Years ended March 31)
2008
1,111.41,159.3
1,229.2
1,360.0
2009
1,418.9
Revenue from Operations (Billions of yen)
Operating Income and Operating Margin(Billions of yen; %)
Net Income and Net Income per Share(Billions of yen; %)
Forward-Looking StatementsThis report contains forward-looking statements that are based on management’s estimates, assumptions and projections at the time of publication. Some factors, which include, but are notlimited to, the risks and uncertainty associated with the worldwide economy, competitive activity and fluctuations in currency exchange and interest rates, could cause actual results to differmaterially from expectations.
2
Notes: 1. U.S. dollar amounts are translated from yen at the rate of ¥98.23 = U.S.$1.00, the approximate exchange rate at March 31, 2009.2. Debt/equity ratio = Interest-bearing debt / (Net assets – Subscription rights to shares – Minority interests)3. ROA = (Operating income + Non-operating income) / Average total assets over the period4. ROE = Net income / (Net assets – Subscription rights to shares – Minority interests, Average over the period)

Combine the flexibility of our three core businesses to respond to market changes
Embrace the external environment positively,target medium-term growth
Create opportunities to advance the Challenge Plan over the next few years
An Interview with President and CEO Hiromichi Iwasa
3
Hiromichi IwasaPresident and Chief Executive Officer
Economic cond itions arelikely to remain challengingover the next few years .However, since 2003 MitsuiFudosan has been employinga highly effective strategy offlexibly combining its threecore businesses of holding,trading and management torespond to changes in themarket. We are respondingquickly to the changes in ouroperating environment as weaim for growth over themedium-to-long term duringthe second half of NewChallenge Plan 2016.
Moving to the Second Half of New Challenge Plan 2016

During fiscal 2008, the year ended March 31, 2009,financial and capital markets became dysfunctionalfollowing the bankruptcy of Lehman Brothers inSeptember 2008. This affected the real economy andtouched off a global recession. The effect on the realestate market in Japan was significant. In thisenvironment, revenue from operations increased 4.3percent, or ¥58.9 billion, year on year to ¥1,418.9billion. Operating income decreased 4.3 percent, or ¥7.7billion, year on year to ¥171.5 billion. Net incomedecreased 4.4 percent, or ¥3.8 billion, year on year to¥83.6 billion. While our overall performance was belowthe level of the previous fiscal year, our results wereadequate for a leading company given the challengingenvironment.
In the holding business, office building GranTokyoNorth Tower (Chiyoda-ku, Tokyo) made a significantcontribution to performance in its first full year ofoperation following its completion in fiscal 2007. Inaddition, we increased rents at existing office buildings.As a result, operating income in the holding businessincreased 11.5 percent, or ¥9.4 billion, year on year. Inthe trading business, we comprehensively andconservatively estimated losses on properties due to theapplication of the lower-of-cost-or-market method,which resulted in a loss on devaluation of real propertyfor sale totaling ¥15.8 billion, mainly on housing
inventory in the sales of housing segment. As a result,operating income in the trading business decreased 15.9percent, or ¥9.2 billion, year on year. In themanagement business, the temporary dysfunction of thereal estate investment market resulted in a substantialdecrease in revenues from corporate brokerage. This andother factors caused operating income in themanagement business to decrease 15.3 percent, or ¥8.0billion, year on year.
The primary causes of the year-on-year decrease inearnings were the trading business, which was affectedby the changing market environment, and corporatebrokerage operations in the management business,which was impacted by the turmoil caused by thefinancial crisis. However, the stable earnings of theholding business, along with fee income from assetsunder management in the management business andsolid earnings among Group companies in the propertymanagement business, form a stable earnings base thatsupports the Mitsui Fudosan Group as a whole.
Our strategy of responding to our changing marketsby integrating the core holding, trading andmanagement businesses is a Mitsui Fudosan Groupstrength because it creates an earnings structure that isstable and highly profitable despite the impact of theconstantly changing external operating environment.
4
Holding Business
Trading Business
Management Business
20062005 2007 2009
60.0
34.3
33.1
63.3
75.5
48.8
47.5
44.3
40.9
115.8137.5
161.8
(Years to March 31, Billions of yen)
* ROA = (Operating income + Non-operating income) / Average total assets over the period** ROE = Net income / (Net assets – Subscription rights to shares – Minority interests, Average over the period)
ROA* (%)
Operating Income
4.30 4.92 5.50Debt/equity ratio (times) 1.86 1.40 1.33ROE** (%) 4.26 7.31 8.35
5.061.778.57
2008
81.8
57.7
52.3
179.3
5.531.609.12
91.2
48.5
44.3
171.5
New Challenge Plan 2016
New Challenge Plan 2016: A Clear Focus on Sustained Value Creation
Revenue increased but earnings decreased during the year ended March 2009. What factorsinfluenced performance?
Revenues and earnings increased in the holding business, which generates comparatively stable revenues.However, we comprehensively recognized loss on devaluation of real property for sale in the tradingbusiness to provide for future losses. This was a primary factor that caused earnings to decrease somewhatyear on year.
An Interview with President and CEO Hiromichi Iwasa
I believe that Japan’s economy will bottom out andbegin a moderate recovery during the second half offiscal 2009 and fiscal 2010. Moreover, the impact of thereal economy on the real estate market will differ bybusiness segment.
The office building leasing market has become morechallenging as corporate performance has deteriorated.This market is comparatively stable and exhibits lessvolatility than the real economy. Going forward, we willneed to keep a close watch on this market.
The financial crisis affected the real estate investmentmarket the most. Dysfunction in financial and capitalmarkets has caused a sharp drop in the J-REIT, privatefund and other sectors of the real estate investmentmarket. For J-REITs, the credit crunch since the start ofthe financial crisis has caused the debt financing marketto deteriorate, and the equity financing environment hasbecome challenging as investment unit prices havedecreased. Therefore, the rejuvenation of J-REITs is aprerequisite and a priority because they excel inproviding liquidity and deepening the pool of investors,which are among the keys to overcoming dysfunctionalfinancial markets and revitalizing the real estate marketas a whole.
Actions taken for J-REIT financing have includedsupport for fund procurement from the DevelopmentBank of Japan and discussions between the governmentand private sector on establishing a fund to support theREIT market. In addition, legal and tax measures havebeen introduced to smooth mergers and consolidation.
These policies have served to reduce refinancing risk.Going forward, they are expected to energize the realestate market by helping with the restructuring of theREIT market. In the current cycle, this restructuring will,in turn, re-establish interest in J-REITs by driving marketdevelopment. Rejuvenated J-REITs will then re-energizeprivate funds, thus stimulating direct investment by
corporations and institutional investors. This is directlyrelated to the overall recovery of the real estateinvestment market.
The future recovery of the real estate investmentmarket will be one key to expansion in internal demand.The current environment is conducive to urbanrenaissance and regional redevelopment projects, andthe Mitsui Fudosan Group will promote the projects it isexecuting and link them to stimulating sales toinstitutional investors.
On the other hand, prices have rapidly adjusted inthe housing sales market. Immediate customer needdrives housing requirements, whether it is the desire fora home among younger people or couples raisingchildren, or the desire among Japan’s Baby Boomergeneration for an urban residence. In addition, newneeds are emerging in the senior demographic. Thedesire to purchase among customers has been impactedby issues such as higher costs and the problemsunethical companies caused by falsifying earthquake-resistance data. However, demand has stabilized andpronounced needs exist. Moreover, the Japanesegovernment has enacted economic policies that includesupport for homebuyers, such as broad tax reductionson mortgages, measures that smooth the mortgageprocess, and reduced gift taxes for the acquisition of ahome. Since January 2009, visitors to model homes andthe number of homebuyers concluding purchasecontracts has increased, and inventories appear to bedecreasing. Thus the market is expected to move towarda recovery in the second half of fiscal 2009.
5
Mitsui Fudosan is taking a conservative approach in the currently challenging real estatemarket. How long will challenging conditions continue, and where do you think the marketis heading? In particular, what is your outlook for the real estate investment market, whichwas hit hard by the financial crisis?
Japan’s real economy will bottom out and begin a moderate recovery during the second half of fiscal 2009and fiscal 2010. This will lead the real estate market to recovery, although over a different time frame. Inparticular, the rejuvenation of the Japanese real estate investment trust (J-REIT) market will be the catalystfor the recovery of the real estate investment market.

Holding Business: Strengthen the earnings foundation.
The holding business generates steady revenues andis the core business of the Mitsui Fudosan Group, butthis market is becoming increasingly challenging. Wecontinue working to maintain strong relationships withtenants and strengthen proposals, and we are also re-engineering operations management to enhance costcontrols and ensure clear marketing policies.
In addition, our pipeline will not be affected by short-term market gyrations. We seek stable, long-termrevenues as we carefully select projects, and intend tocontinue making sustained, focused investments.
In the office building business, we have beenpromoting improvement in asset quality and strongrelationships with tenants. This has minimizedfluctuation in revenue and contributed to solid portfolioreturns. As a result, our vacancy rate is consistentlylower than the market average, which we expect tocontinue in the future.
Our pipeline is replete with projects underdevelopment, centered on our program of redevelopingexisting assets in outstanding urban locations. We willcarefully determine market trends to focus on projects in
which we can fully benefit from our competitiveadvantages as we continue to execute our program ofsustained investment.
The retail facilities business has been affected byreduced consumer spending due to the recession. Theexternal environment is challenging and conditions areunpredictable, but projects are increasingly separatingstronger from weaker players.
A core strength of the Mitsui Fudosan Group is itscustomer-centered approach to creating andmanaging retail facilities. LaLaport regionalmalls and Mitsui Outlet Parks, which are keycomponents of our retail facility portfolio,demonstrate this strength as they performstrongly in a challenging operatingenvironment. Incorporating retail facilities inour rental property portfolio is particularlybeneficial in a difficult environment becausethey provide portfolio diversity. We willcontinue to invest selectively in new projectsand steadily begin operating new facilities, andwill also remain aggressive in taking advantageof good opportunities that emerge.
Rent Revenues Capital Gains Fee Income
Own Disposal Assets underManagement
Holding Trading ManagementDevelopment
Investment
Earn
ings
6
What are Mitsui Fudosan’s management strategies for each of its business segments fromfiscal 2009 as the company moves into the second half of New Challenge Plan 2016?
We will continue integrating our three core businesses to respond flexibly to changing markets. Thechallenging operating environment is presenting opportunities for Mitsui Fudosan to strengthencompetitiveness, and I want them to be catalysts for major progress in the latter stages of New ChallengePlan 2016.
0.0
2.0
4.0
6.0
8.0
10.0
(%)
3/02 9/02 3/08 9/083/07 9/073/06 9/063/05 9/053/04 9/043/03 9/03 3/09
Data: Miki Shoji Co., Ltd.
Market (Large-scale buildings in five wards of central Tokyo)
Mitsui Fudosan (Tokyo metropolitan area/parent company)
8.57%(6/03)
5.8%(9/03)
0.9%(6/06)
2.5%(3/09)
1.3%(3/08)
2.89%(3/08)
6.05%(3/09)
2.65%(12/07)
Office Vacancy Rate Trends

An Interview with President and CEO Hiromichi Iwasa
Trading Business: In sales of housing to individuals,
develop competitive products in metropolitan Tokyo. In
sales of properties to investors, we predict a rapid
recovery of the real estate investment market through
the rejuvenation of J-REITs.
The impact of the financial crisis was most evident insales of properties to investors. The dysfunction offinancial and capital markets significantly reducedliquidity in the real estate investment market. We aregenerating appropriate returns on the projects we havedeveloped, and by no means are engaging in panicselling in an unsettled market. This has caused ourbalance sheet to expand temporarily. However, theseassets are products that will provide appropriate returnsto the investors that purchase them, and holding themfor the time being presents no problems at all.
Our performance forecast for fiscal 2009 isconservative and only includes projects that we believedto be highly probable at the start of the fiscal year.Going forward, we will carefully monitor the recoveryand rejuvenation of the real estate investment marketwith the aim of improving the profitability of currentprojects and generating sales. At the same time, we willevaluate the location, profitability and competitivenessof new projects in selectively making investments.
In sales of housing to individuals, Group companyMitsui Fudosan Residential Co., Ltd. is integrated fromconstruction to sales. It offers a portfolio of brands thatare tailored to a diverse array of customer needs andlifestyles.
In fiscal 2009, we will continue to emphasize high-value-added products, and forecast that earnings willincrease year on year absent the comprehensiverecognition of loss on devaluation of real property forsale in fiscal 2008.
Going forward, the Mitsui Fudosan Group will focusstable, sustained investment on high-value-addedproducts that make the best use of its strengths.
Management Business: Continue to generate growth
in the fee businesses of asset and property management
while re-engineering the brokerage business.
The management business is contributing toconsolidated performance as component businessessuch as asset and property management generate solidfee income from their growing portfolios of assets undermanagement. Highlights of fiscal 2008 included thelaunch of several private funds by Mitsui FudosanInvestment Advisors, Inc. that attracted strongparticipation by institutional investors despite takingplace in the period of greatest turbulence following theLehman Brothers bankruptcy. The ability to succeed atlaunching funds in the current environmentdemonstrates the Mitsui Fudosan Group’s extensivemarket trust and performance.
On the other hand, the recession has created seriousproblems for the brokerage business. In the brokeragebusiness of Mitsui Real Estate Sales Co., Ltd., we areusing the challenging environment as an opportunity toimplement structural reforms by carrying out re-
engineering that goes beyond simplyreducing costs. Similar to needs fornew housing, needs for existinghomes are rooted in actual demand,and price adjustments and the broadlybased measures that support homesales are also relevant to purchases ofexisting homes. We will make thesetrends work for us with the aim ofgetting the brokerage business backonto a growth vector.
7
Win back investor trust and stimulate recovery of the real estate investment market through rejuvenation of the J-REIT market.
Real estate market
Operating properties
Low-operating properties
Non-operating properties
p g p p
p g p p
p g p p
Brokering
Value up
Develop
Financial markets
Loan
Investment corporation bonds
Debt
Capi
tal
Fund investment
Real estate direct investment
Equity
Real estate investment market
Rejuvenation of J-REIT market
Positive growth cycle
Positive growth cycle
Private fund activation
Real estate investment market recovery
REIT investment unit
Trading Business (Sales to Investors)
As of March 31, 2009, interest-bearing debt totaled¥1,733.5 billion, and the debt/equity ratio (DER) was1.77 times. While we have not achieved the NewChallenge Plan 2016 target DER of 1.4 times, thecurrent DER is at a sound, comparatively conservativelevel.
Over the past year, turmoil in financial markets madefunding difficult even for some large companies. Giventhis environment, the Mitsui Fudosan Group’s ability toaccess funding without problems demonstrates theeffectiveness of our financial strategy. Our strategy
under New Challenge Plan 2016 is to maintain oursound finances. The financial crisis has shaken the realestate investment market, mainly causing our turnoverto decrease in sales of properties to investors. Ourleverage has increased slightly as a result, but goingforward we will maintain stable leverage.
In addition, we will remain selective in makinginvestments. At the same time, we will fully considerreturns in staunchly maintaining the soundness of ourfinances.
An Interview with President and CEO Hiromichi Iwasa
8
How will Mitsui Fudosan maintain and enhance its financial position and access toexternal funding?
We will continue to maintain our sound finances.
Mitsui Fudosan increased cash dividends for three consecutive years through fiscal 2008.Can shareholders look forward to stable returns in the future?
We aim to further increase corporate value, and are working to enhance internal capital resources sothat we can fund investment in highly profitable businesses. Concurrently, we will consider the businessenvironment, our performance and our financial condition in moving to maintain or increase dividends.
Shareholder returns are a management priority, andwe will continue working to meet the expectations ofour shareholders. We aim to further increase corporatevalue, and are working to enhance internal capitalresources so that we can fund investment in highlyprofitable businesses. Concurrently, we will consider thebusiness environment, our performance and ourfinancial condition in moving to maintain or increasedividends.
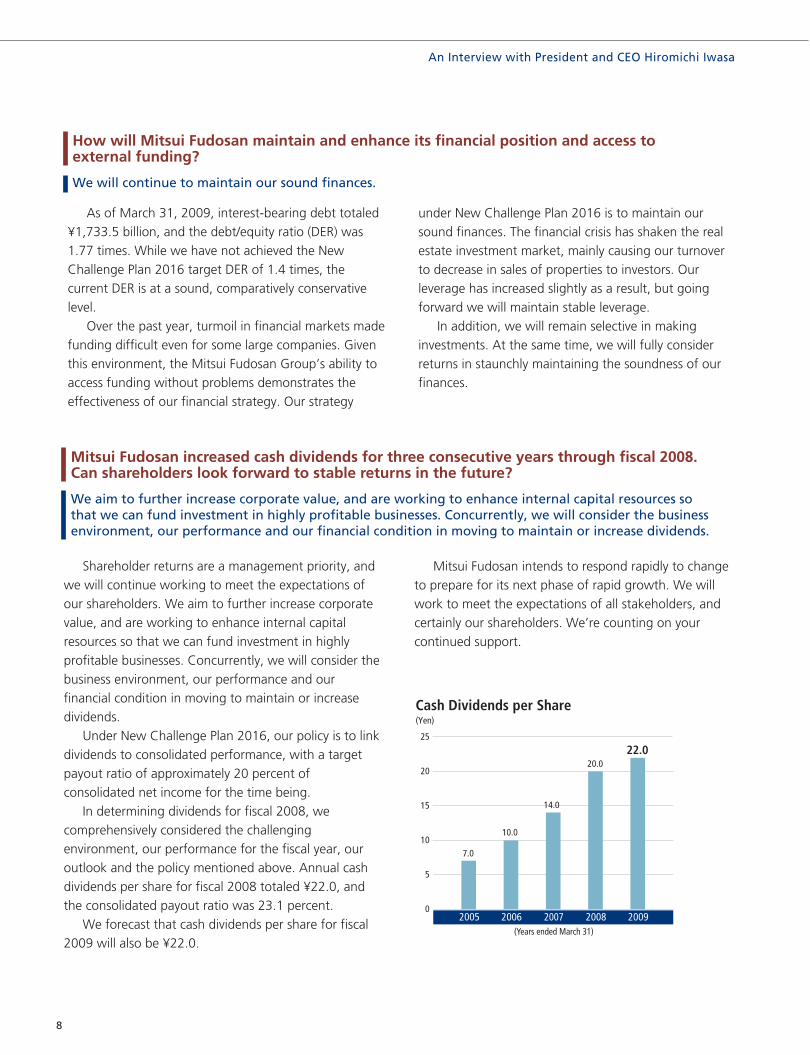
Under New Challenge Plan 2016, our policy is to linkdividends to consolidated performance, with a targetpayout ratio of approximately 20 percent ofconsolidated net income for the time being.
In determining dividends for fiscal 2008, wecomprehensively considered the challengingenvironment, our performance for the fiscal year, ouroutlook and the policy mentioned above. Annual cashdividends per share for fiscal 2008 totaled ¥22.0, andthe consolidated payout ratio was 23.1 percent.
We forecast that cash dividends per share for fiscal2009 will also be ¥22.0.
Mitsui Fudosan intends to respond rapidly to changeto prepare for its next phase of rapid growth. We willwork to meet the expectations of all stakeholders, andcertainly our shareholders. We’re counting on yourcontinued support.
0
5
20
25
15
10
2007(Years ended March 31)
2005 2006 2008
7.0
10.0
14.0
20.0
2009
22.0
Cash Dividends per Share(Yen)
MITSUI FudosanGroup
Residential
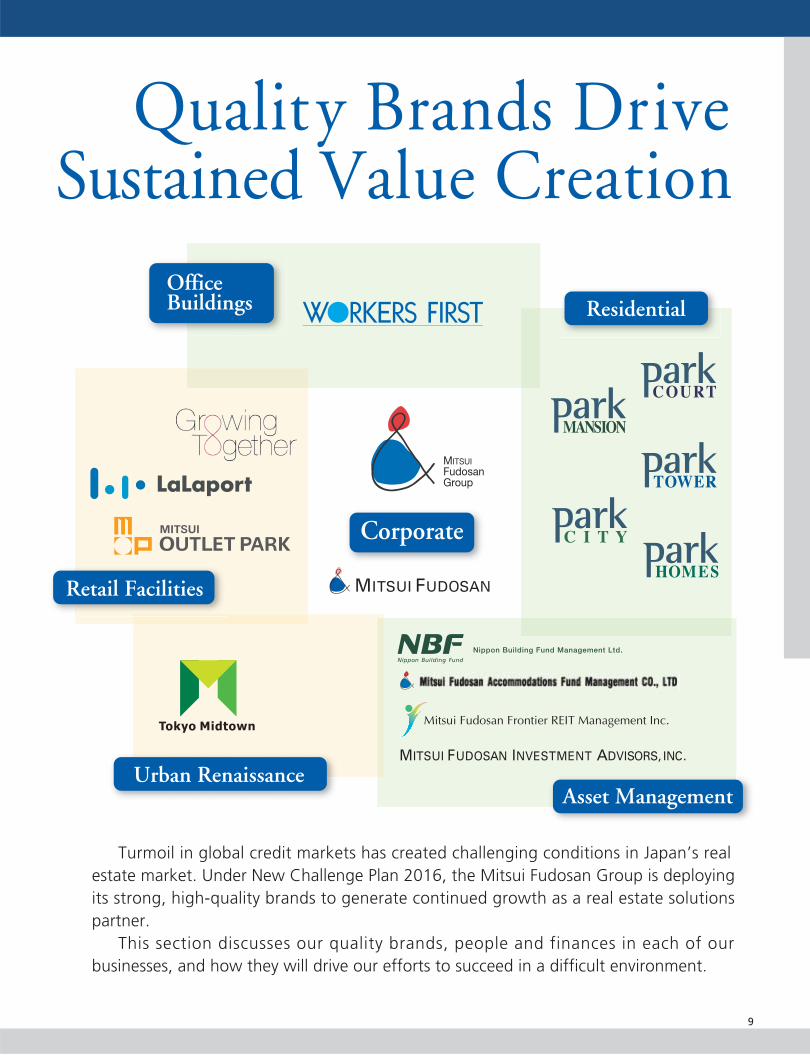
Turmoil in global credit markets has created challenging conditions in Japan’s real estate market. Under New Challenge Plan 2016, the Mitsui Fudosan Group is deploying its strong, high-quality brands to generate continued growth as a real estate solutions partner. This section discusses our quality brands, people and finances in each of our businesses, and how they will drive our efforts to succeed in a difficult environment.
Quality Brands Drive Sustained Value Creation
Corporate
OfficeBuildings
Urban RenaissanceAsset Management
Nippon Building Fund Management Ltd.
MITSUI FUDOSAN INVESTMENT ADVISORS, INC.
Retail Facilities
9

MITSUI FudosanGroup
Established in 1941, Mitsui
Fudosan has grown by
consistently creating new
segments in Japan’s real estate
market. In 1957, we began diversifying into the businesses of
reclaiming oceanfront land in
Chiba Prefecture and developing residential areas. In 1968,
we were the first in Japan to develop a skyscraper, and also
entered the business of developing single-family homes and
mid-rise residential condominiums. In 1981, we entered the
retail facility business by initiating development of top-class
shopping centers in Japan. More recently, in 2001 Mitsui
Fudosan was the first in Japan to list a real estate investment
trust (REIT) on the Tokyo Stock Exchange, while in 2007 we
opened Tokyo Midtown, a large-scale, mixed-use property
developed using an innovative urban redevelopment model.
The Mitsui Fudosan brand therefore stands for growth
through innovation and commitment to excellence.
Mitsui Fudosan has become a leading Japanese real
estate brand using a
business model of
balanced growth in
three core
businesses: holding, trading and management. With
employees who are among the best in the business and a
powerful financial structure, Mitsui Fudosan is well able to
fully exercise the strengths of its brands to respond to
customer needs as a real estate solutions provider.
Moreover, Mitsui Fudosan has also built strong
relationships with the three core real estate customer
groups. These are the end users who are tenants of our
office buildings and retail facilities and the buyers of the
homes we develop; the investors who commit capital to real
estate markets; and the originators who own property and
rely on us for consulting and management services.
Global capital markets also trust the Mitsui
Fudosan brand. The global financial crisis of 2008
created serious problems for many participants in
Japan’s real estate markets, but Mitsui Fudosan
maintained its excellent access to funding
because of its powerful financial structure,
high-value-added business model and solid
creditworthiness. We are therefore in an
excellent position to take advantage of
opportunities for future growth.
A Leading Real Estate Brand
A Reliable Financial Brand
Mitsui Fudosan has creative employees with
diverse values and a pioneering spirit. They work
as individuals to enhance their professional
knowledge and capabilities, and as members of
teams to create added value. As a result, they
have acquired a solid reputation for being able to
understand what customers truly want and then
delivering it. Our employees also contribute to
the Mitsui Fudosan corporate brand because
their behavior demonstrates a commitment to
the highest levels of corporate ethics and legal
compliance.
Great People Create Value
Corporate The Mitsui Fudosan corporate brand is built on strengths in our businesses, a history of achievement spanning seven decades, and intangibles such as outstanding people.
Above: On-site inspection of LaLaport IwataRight: Retail facility develop- ment presentation
10

Quality Brands Drive Sustained Value Creation
As symbolized by the Kasumigaseki Building, which was
Japan’s first skyscraper, Mitsui Fudosan has built a strong
presence by providing innovative office space generation
after generation. Strong relationships with landowners,
originators and local governments help us to acquire land in
prime urban locations, which we have used to build a
high-quality portfolio in Tokyo’s central business districts.
We further enhance portfolio profitability by redeveloping
buildings and replacing assets.
While the recession has made conditions in the office
building leasing market more challenging, the quality of our
portfolio and brand equity have kept occupancy at individual
properties high, in turn keeping our overall vacancy rate
comparatively low.
Moreover, the Mitsui Fudosan Group strengthens its
brand by providing services such as asset, project and
property management that are recognized for excellence.
The Mitsui Fudosan Group’s comprehensive capabilities
range from managing revenue and improving asset value for
owners to operating buildings and providing tenant and
leasing services.
We are committed to putting tenants first. The tenant
satisfaction surveys we regularly conduct – and vacancy rates
that are lower than the market average – consistently indicate
that our office building brand offers exceptional value.
The Superior Mitsui Fudosan Brand Supports Steady Office Building Occupancy
Constructed in 1968, the Kasumigaseki
Building was Japan’s first skyscraper and became
a symbol of rapid economic growth. Mitsui
Fudosan demonstrated its leadership by
incorporating open surroundings into an
innovative earthquake-resistant design to create
an urban oasis. We were first to achieve a
building over 100 meters tall in Japan, more than
triple the height that was formerly possible. Thus
the age of the skyscraper began in Japan. As
many as ten thousand people visited the
observation deck of the completed building each
day, often spending time at the building’s
restaurants and shops as well. Today, we
continue to build on our strategy of creating
innovative, mixed-use properties that are both
enjoyable and profitable.
The Kasumigaseki Building: Consistently a Leader
The Workers First concept is a powerful
branding tool that Mitsui Fudosan employs at its
office buildings. It guides us in raising the quality
of our products and services under the themes of
creating a diverse network of comfortable,
sophisticated office buildings, placing workers
first, and reliable building management. It also
drives Mitsui Fudosan to create properties that
feature outstanding information technology and
security and reduced environmental loading,
complemented by amenities such as comfortable
public spaces and harmonious landscape design.
The Workers First brand offers new value to
tenant companies and creates strong
relationships with the surrounding
neighborhood.
The Workers First Brand Keeps Tenant Satisfaction High
Innovation, quality and a commitment to tenant satisfaction give Mitsui Fudosan brand leadership in the office building market. This leadership creates value.
OfficeBuildings
Constant renewal keeps the Kasumigaseki Building, shown in 1968 (left) and today (right), on the cutting edge.
11

Retail Facilities
Our retail facility brands are powerful because they create spaces where customers can make new discoveries and have new experiences, which helps tenants succeed.
In 1981, the Mitsui Fudosan Group opened LaLaport
Funabashi (now LaLaport Tokyo-Bay), which is still one of
Japan’s largest retail facilities. Since then, we have remained
in step with changing regional and customer needs in
proposing retail facilities that do not simply sell things, but
instead are places that grow in tandem with customer
lifestyles and their local communities and provide the
opportunity for visitors to spend quality time.
Mitsui Fudosan delivers retail facility brands that are in
step with various
customer segments.
LaLaport is a regional
mall brand offering
expansive shopping areas. Mitsui Outlet Park is a factory
outlet brand that offers shopping as well as fun and exciting
surroundings. COREDO Nihonbashi is representative of our
urban retail facility brands that create luxurious city
shopping experiences, while LaLagarden exemplifies our
neighborhood retail facility brands. This broadly based brand
portfolio offers widely ranging appeal, which we continue to
enhance in working to maintain and raise the strength and
competitiveness of our retail facility brands.
Moreover, the Mitsui Fudosan Group operates its retail
facilities based on a philosophy of protecting the
environment to ensure a bright future. In addition to
activities that contribute to society, our retail facilities also
conduct the Eco Hello program and other activities in
cooperation with customers that help protect the
environment.
Growing Together is the concept that defines
the Mitsui Fudosan Group’s retail facility
business. It involves growing along with
customers, tenants and host neighborhoods to
become an integral part of the community.
Growing Together expresses our desire to
contribute to the wealth and affluence of the
communities we serve. It guides our ongoing
cooperative initiatives with customers and
tenants to make the people who visit our retail
facilities feel at home.
Diverse and Profitable Retail Facility Brands
Branded Tenant Support Services Support Satisfaction - and Growth
The Eco Hello program in action at Arcakit Kinshicho, which received a prestigious Local Community Contribution SC Award.
In January 2009, Mitsui Fudosan grouped 13
LaLaport, LaLagarden and other facilities, including
retail facilities scheduled to open in fiscal 2009,
within the new Mitsui Shopping Park brand. The
objective of this brand is to popularize and clarify
the brand identity of Mitsui Fudosan Group retail
facilities. We will work energetically to improve the
tangible and intangible aspects of these retail
facilities, which will include a branded Mitsui
Shopping Park credit card.
Mitsui Shopping Park: A Powerful New Brand
12

Quality Brands Drive Sustained Value Creation
Mitsui Fudosan Residential Co., Ltd. is at the center of
our housing brands. This Group company is a one-stop
source of housing that is integrated from development and
sales to after-sales service. Today’s rigorously selective
consumers appreciate the excellent location and quality of
the properties the Mitsui Fudosan Group provides. The
strength of our brands has supported annual sales of over
5,000 units of housing, and we steadily exercise our
advantages in the housing market.
Quality matters. We collect feedback on the performance
of every new condominium unit we sell, and have
implemented quality management procedures for our mid-
and high-rise residential buildings to ensure high quality. We
also have our own security design standards for the
condominium security systems we install because we believe
that safety and peace of mind raise customer satisfaction.
Mitsui Fudosan Residential uses its extensive development
expertise and experience and reflects the opinions of
customers in developing properties. A key goal is to create
neighborhoods replete with greenery that get better with
age as it builds on its strength in areas such as urban
properties and large-scale, mixed-use buildings that create
entire neighborhoods.
Quality and Class Differentiate Our Residential Brands
The Mitsui Fudosan Group has deployed its
comprehensive strengths to offer a full lineup of
housing-related products and services. We deploy
Group expertise to provide the optimum
solutions, whether clients are moving, ordering a
new home or remodeling. Our brands have
received enthusiastic support because they
encompass high-quality housing and services that
respond to a diverse array of customer needs.
Comprehensive Capabilities Meet Diverse Needs
A Park Series Brand for Every Customer Segment
We will continue to earn customer appreciation for the high-value-added properties we provide. Residential
Leading-edge proposals for outstanding condominiums that are like no other because of their superior location and uncompromising quality.
High-grade urban condominiums with beautiful exteriors and attention to detail supporting brand quality.
Large-scale condominiums that create their own environment.
Family-oriented condominiums with intelligent space perfectly suited to urban living.
Vacation home condominiums at resorts in Japan.
Single-family urban homes designed to be the best in the neighborhood.
Ultra-high-rise condominiums that offer open lifestyles and are landmarks of their neighborhoods.
High-quality condominiums with superior housing functions and design.
Optimal partner in serving customer
housing and lifestyle needs
Housing SalesAccommodations
Resorts
Remodeling
Home Construction
Changing Homes
Mitsui Fudosan Residential Co., Ltd.Mitsui Fudosan Housing Service Co., Ltd.
Mitsui Fudosan Real Estate Sales Co., Ltd.
Mitsui Home Co., Ltd.
Mitsui Home Remodeling Co., Ltd.
Mitsui Fudosan Co., Ltd. (Resort Business Promotion Department)
Mitsui Fudosan Resort Co., Ltd.
(Rental Housing & Hotels)Mitsui Fudosan Co., Ltd.
(Accommodations Department)Mitsui Fudosan Housing Lease Co., Ltd.
Mitsui Fudosan Hotel Management Co., Ltd.
13

Mitsui Fudosan is an industry-leading brand in the urban
renaissance business, as exemplified by Tokyo Midtown. We
took care to both create value and preserve the history of the
property and the large number of trees on it in redeveloping
this parcel of government-owned land. Moreover, Tokyo
Midtown was developed under a hybrid business model that
combined Mitsui Fudosan’s core holding, trading and
management businesses. It incorporates sophisticated urban
functions in creating a unique neighborhood under the
themes of symbiosis with the surrounding area, superior
design and art. In addition, we added outstanding value in a
unique large-scale, mixed-use property that only Mitsui
Fudosan could achieve, with features including outstanding
environmental compatibility because of our commitment to
preserving the trees on the property. Going forward, Mitsui
Fudosan will continue working to capture redevelopment
business opportunities in
Nihonbashi, Marunouchi,
Hibiya, Gotanda, Iidabashi and
other prime Tokyo
neighborhoods to develop
office buildings, retail facilities
and housing in large-scale
urban renaissance projects.
Mitsui Fudosan’s record of achievement in
urban redevelopment began with the
Kasumigaseki Building in 1968. In 1980, we
completed construction of the Sun City
redevelopment project under the concept of
creating a neighborhood that got better with
time, while in 1993, we pioneered waterfront
redevelopment in Tokyo with the massive
Okawabata River City 21 project. Recently, we
have focused on preservation, rehabilitation and
creation in redeveloping existing properties,
exemplified by Nihonbashi Mitsui Tower and
Tokyo Midtown completed in the 2000s. Each
project we complete becomes the springboard to
our next opportunity in a cycle of transforming
our record of achievement into future growth.
An Unparalleled Record of Achievement
Urban Renaissance
Mitsui Fudosan is an expert at transforming sleepy urban neighborhoods into centers of business, commerce and culture. Our urban renaissance brand is a source of long-term value.
Muromachi East District Development Project(Completion scheduled in stages, FY2010-FY2013)
A Leading Brand in the Renaissance of Tokyo
The Nihonbashi Area Development Project
exemplifies highly capital-efficient redevelopment
and reconstruction of existing assets. We
completed the Nihonbashi Mitsui Tower in 2005
and are now moving forward with the
Muromachi East District Development Project and
other plans in which we are transforming existing
assets into highly competitive, state-of-the-art
buildings.
The Muromachi East District Development
Project involves integrating five separate
neighborhoods into a single large-scale
development encompassing office space, retail
facilities, rental housing and a multipurpose
auditorium. We are focusing on preservation,
rehabilitation and creation in revitalizing
Nihonbashi as a center for business, commerce,
culture and exchange.
Mitsui Fudosan = Nihonbashi Redevelopment
14

Quality Brands Drive Sustained Value Creation
The real estate paradigm has changed as the separation
of ownership and management has accelerated. Mitsui
Fudosan has positioned itself as a provider of services that
create value from real estate. We are now generating
opportunities for growth by offering asset and property
management services for operating properties, development
management services to move properties into the operating
stage, and other services such as consulting. The asset
management business employs the Mitsui Fudosan Group’s
deep and specialized knowledge, expertise and network to
provide investors with excellent opportunities and deliver
superior asset management services. We have built a system
for providing seamless, end-to-end solutions to diverse
investor needs, including three J-REITs, private funds, and
joint investment schemes. In addition, expansion in fee
income through growth in assets under management is
enhancing earnings as we fortify our number-one position in
Japan’s real estate investment market.
Proven Effectiveness as an Asset Management Brand
In 1997, Mitsui Fudosan led the industry in
foreseeing that the real estate business
environment was changing and that the real
estate investment market would grow in
importance, and therefore moved proactively to
establish Mitsui Fudosan Investment Advisors,
Inc. With more than ¥1,060 billion in assets
under management, Mitsui Fudosan Investment
Advisors is a potent asset management brand
that generates stable management fees that
contribute to overall Group earnings.
A Respected, Broadly Capable Advisory and Support Brand
Generating stable earnings from assets under
management is central to achieving the targets
for the management business under New
Challenge Plan 2016. In September 2001, Mitsui
Fudosan became the first company in Japan to
list a J-REIT on the Tokyo Stock Exchange, Nippon
Building Fund Inc. Today, Mitsui Fudosan is
involved in three J-REITs – Nippon Building Fund,
Nippon Accommodations Fund Inc., and Frontier
Real Estate Investment Corporation – through
their asset management companies, with assets
under management of ¥1,070 billion.
Our J-REIT Brands Offer Consistently Strong Returns
Mitsui Fudosan is the number-one brand in Japan’s real estate investment market because of our skill in creating value from real estate. Investors trust our broadly based ability to meet diverse requirements.
Asset Management
Planning session at Mitsui Fudosan Accommodations Fund Management Co.,Ltd.
15

2003 2009
● Newly constructed** ● To be rebuilt/reconstructed
* **
Total floor area of buildings owned and masterleased “Newly constructed” includes buildings constructedwithin the past 5 years
(Years ended March 31)
0
1,000
4,000
2,000
3,000
2004 2005 2006 2007 2009
1,800
2,1502,350
2,700
2008
2,800
0
5
25
10
15
10.2
15.6
18.319.0
20.0
24.3
20
■ Assets under management (left scale) ● Fee income (right scale)
(Years ended March 31)
Mitsui Fudosan Creates ValueHolding Business
Trading Business
Management Business
The holding business consists of leasing office buildings and retail facilities. Mitsui Fudosan continues to enhance the quality of assets in its portfolio to improve competi-tiveness and profitability. Our strategy centers on rapidly bringing highly competitive and profitable properties on stream.
The trading business consists of sales of housing to individual end users and the development and sale of rental condominiums, office buildings and commercial properties to investors. Our goals include strengthening profitability. A highly competitive product mix is a strength in sales of housing to individual end users. Relationships with a broad range of investors and high-quality assets are strengths in sales of properties to investors.
The management business encompasses property and asset management for J-REITs and private funds. Our strategy centers on expanding assets under manage-ment and increasing fee income. This business contrib-utes to increased ROE. Subsidiaries play a key role in generating fee income from providing solutions.
Share of New Office Buildings inPortfolio (by floor area)*
Expansion in Assets under Management& Fee Income (Billions of yen)
2,650(Thousand m2)
2,260
17%24%
2%
■ Operating income from sales of housing to end users■ Operating income from sales of properties to investors
(Years ended March 31)2004 2005 2006 2007 20092008
0
20
60
40
20.430.8
22.318.818.619.3
28.2
27.0
26.925.8
16.513.6
Trading Business Operating Income (Billions of yen; %)
1,440
16
Mitsui Fudosan at a Glance

(Years to March 31)
2007 2008
¥91.2 billion¥81.8 billion
¥75.5 billion
2009
2007 2008
¥48.5 billion
¥57.7 billion
¥48.8 billion
2009
2007 2008 2009
¥44.3 billion
¥52.3 billion¥47.5 billion
Under New Challenge Plan 2016, Mitsui Fudosan is adapting to changing markets and emerging customer needs. Over the coming decade, we will strengthen our core businesses while embracing new opportunities to create value for stakeholders as we evolve in tandem with accelerating exter-nal changes. Building outward from a strong base in Japan, Mitsui Fudosan intends to participate fully in the globalization of real estate markets.
Operating Income(Billions of yen)
Operating Income(Billions of yen)
Operating Income(Billions of yen)
17
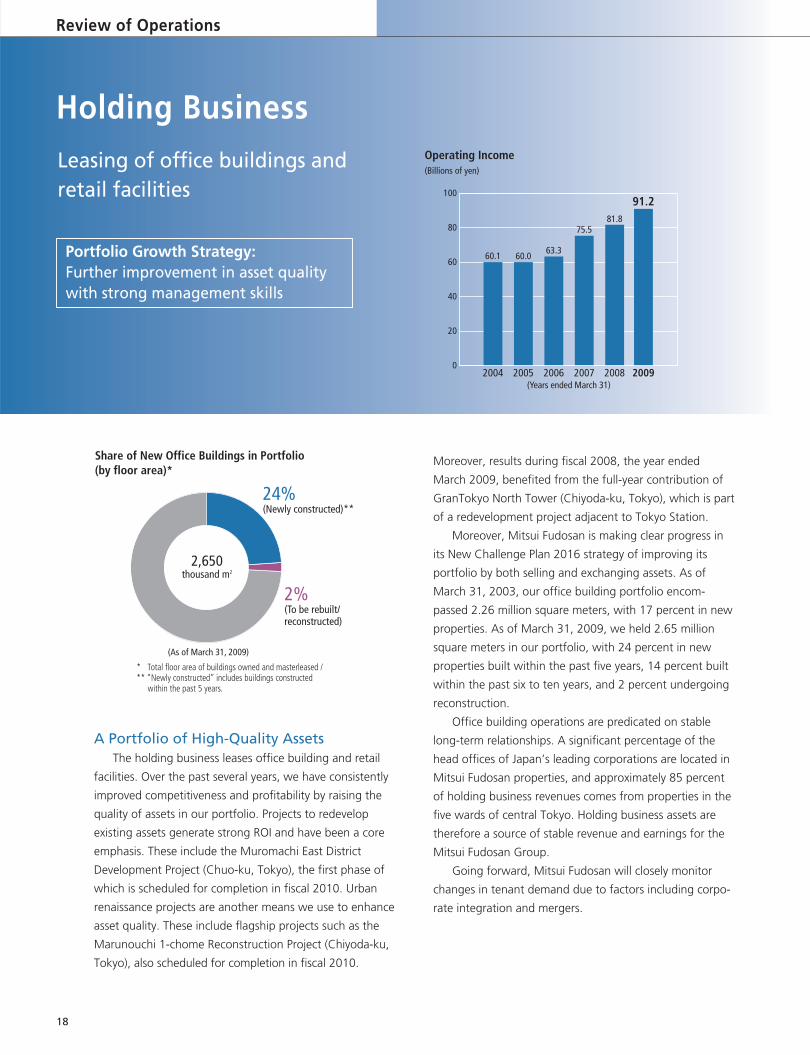
Moreover, results during fiscal 2008, the year ended
March 2009, benefited from the full-year contribution of
GranTokyo North Tower (Chiyoda-ku, Tokyo), which is part
of a redevelopment project adjacent to Tokyo Station.
Moreover, Mitsui Fudosan is making clear progress in
its New Challenge Plan 2016 strategy of improving its
portfolio by both selling and exchanging assets. As of
March 31, 2003, our office building portfolio encom-
passed 2.26 million square meters, with 17 percent in new
properties. As of March 31, 2009, we held 2.65 million
square meters in our portfolio, with 24 percent in new
properties built within the past five years, 14 percent built
within the past six to ten years, and 2 percent undergoing
reconstruction.
Office building operations are predicated on stable
long-term relationships. A significant percentage of the
head offices of Japan’s leading corporations are located in
Mitsui Fudosan properties, and approximately 85 percent
of holding business revenues comes from properties in the
five wards of central Tokyo. Holding business assets are
therefore a source of stable revenue and earnings for the
Mitsui Fudosan Group.
Going forward, Mitsui Fudosan will closely monitor
changes in tenant demand due to factors including corpo-
rate integration and mergers.
A Portfolio of High-Quality AssetsThe holding business leases office building and retail
facilities. Over the past several years, we have consistently
improved competitiveness and profitability by raising the
quality of assets in our portfolio. Projects to redevelop
existing assets generate strong ROI and have been a core
emphasis. These include the Muromachi East District
Development Project (Chuo-ku, Tokyo), the first phase of
which is scheduled for completion in fiscal 2010. Urban
renaissance projects are another means we use to enhance
asset quality. These include flagship projects such as the
Marunouchi 1-chome Reconstruction Project (Chiyoda-ku,
Tokyo), also scheduled for completion in fiscal 2010.
2%(To be rebuilt/reconstructed)
24%(Newly constructed)**
2,650thousand m2
(As of March 31, 2009)
* Total floor area of buildings owned and masterleased /** “Newly constructed” includes buildings constructed
within the past 5 years.
18
Holding BusinessLeasing of office buildings andretail facilities
Share of New Office Buildings in Portfolio(by floor area)*
Operating Income (Billions of yen)
Portfolio Growth Strategy: Further improvement in asset quality with strong management skills
100
80
60
40
20
0
81.875.5
63.360.060.1
20082007200620052004
91.2
2009(Years ended March 31)
Review of Operations

19
Yurakucho Line
Mita Line
Tozai Line
Ch
iyod
a Line
Hanzomon
Line
Marunouchi Line
Ginza
Line
Toei Asakusa Line
Hib
iya
Line
JR T
okai
do S
hink
anse
n
JR T
okai
do S
hink
anse
n
JR T
okai
do S
hink
anse
n
JR T
ohok
u Jo
etsu
Shi
nkan
sen
JR T
ohok
u Jo
etsu
Shi
nkan
sen
Toky
o Ex
pres
sway
Hibiya
Uchisaiwai
Toranomon
Kasumigaseki
SakuradamonHibiya
Ginza
Ginza
Higashi Ginza
Kyobashi TakarachoYurakucho
Shintomicho
Tsukiji
Nijyubashimae
Ginza1-chome
Otemachi
Otemachi
Kanda
Nihonbashi
Mitsukoshimae
Kayabacho
Hacchobori
Ningyocho
Takebashi
Otemachi
Tokyo
Tokyo
Shinnihonbashi
Hacchobori
JR
Yokosuka
Line
JR Keiyo Line
Mitsui Seimei Otemachi Bldg
Nihonbashi 1-chome Bldg
Nihonbashi 2-chome Project(provisional name)
GranTokyo North Tower
Marunouchi 1-chomeReconstruction Project
(scheduled for FY2010) (A)
Muromachi East DistrictDevelopment Project
Phase I: FY 2010Phase II: scheduled for FY2013
NihonbashiMitsui Tower &
Mitsui Main Building
Sanshin Bldg &Hibiya Mitsui Bldg
Reconstruction Project
Tokyo Station
Kanda Station
Yurakucho Station
Imperial Palace
( ) (B)
JR T
ohok
u Jo
etsu
Shi
nkan
sen
JR Y
aman
ote
Line
JR Y
aman
ote
Line
Kei
hin-
Toho
ku L
ine
Kei
hin-
Toho
ku L
ine
JR Y
aman
ote
Line
Kei
hin-
Toho
ku L
ine
■ Newly constructed■ To be rebuilt/ reconstructed■ Existing■ Planned
Main Office Buildings in Mitsui Fudosan’s Portfolio(Area around Tokyo Station)
Muromachi East District Development Project (Map B) (Completion scheduled in stages, FY2010-FY2013)
Marunouchi 1-chome Reconstruction Project(Map A) (Office building / Completion scheduled for FY2010)

Stable Rent at Quality PropertiesThe holding business centers on top-grade properties
in superior locations. These properties are generally near
full occupancy, and generate stable rents. Mitsui Fudosan
maintains stable, long-term relationships with its tenants,
which in conjunction with programs to raise asset quality
has limited volatility in rent revenues. Future initiatives to
enhance the profitability of our asset portfolio will include
strengthening sales capabilities and tenant satisfaction
while re-engineering to reduce costs.
Profitable Growth from Retail FacilitiesMitsui Fudosan has been developing retail facilities for
more than 25 years since opening LaLaport Funabashi (now
LaLaport Tokyo-Bay) in 1981. We use the management
experience we have acquired and relationships with more
than 1,700 tenant companies to offer a wide range of
shopping options, from regional shopping malls and neigh-
borhood retail facilities known as lifestyle parks to outlet
parks and urban retail facilities. Moreover, we continue to
expand shopping malls that we own and manage in areas
with good potential to generate profitable growth.
Shopping malls scheduled to begin operating during fiscal
2009 include the 50,000m2 LaLaport Iwata and the
60,000m2 LaLaport Shin-Misato, which together will repre-
sent a major addition to the retail facilities business. In this
business, fixed-term leaseholds and mixed-use development
enhance investment efficiency and build synergy with resi-
dential and office building operations.
Mitsui Fudosan’s strengths in leasing retail facilities are
its broad menu of facility formats, its development capabili-
ties, and the ability to operate retail facilities directly using
the management resources of the Mitsui Fudosan Group.
The key to operating at full occupancy is building strong
relationships with the stores that are tenants. In future proj-
ects, Mitsui Fudosan will prudently select investments that
present the best opportunities for profitable growth while
continuing to add appeal to its lineup so that its retail facili-
ties are attractive to both tenants and the people who shop
at their stores.
20
GranTokyo North Tower(Office building / Completed in October 2007)
Review of Operations

A Prudent Approach to GrowthOur office building pipeline remains strong, and we will
soon begin operating several large-scale properties. These
includes Higashi Gotanda Square (Shinagawa-ku, Tokyo),
which we completed during fiscal 2008, and the
Marunouchi 1-chome Reconstruction Project and
Muromachi East District Development Project Areas 2-2
project slated for completion in fiscal 2010.
The current leasing environment is challenging, but the
Marunouchi 1-chome Reconstruction Project is already
leased to Sumitomo Mitsui Banking Corporation. We expect
that our sales capabilities will support strong occupancy
rates just as they have during soft leasing markets in the
past.
We will also complete a number of properties in prime
locations in fiscal 2011 and beyond. While we are approach-
ing future projects prudently, we intend to continue invest-
ing in the outstanding projects that support future growth.
Our retail facility portfolio contains high-quality assets
concentrated in the heavily populated Tokyo metropolitan
area. Many of our retail facilities are linked with trains and
other forms of public transportation, which helps make
them environmentally sound. Projects in our pipeline as of
March 31, 2009 included the large-scale LaLaport Iwata,
which began operating in June 2009, and LaLaport Shin-
Misato, which we will open in September 2009. We will
employ our Growing Together concept in working to ensure
strong relationships with tenants that support full occupan-
cy. As in the case of our office building portfolio, we are
prudently setting high hurdle rates for new projects. We
intend to steadily begin operating the excellent projects we
are now building while looking for outstanding opportuni-
ties to enhance our portfolio.
21
LaLaport Tokyo-Bay(Retail facilities / Opened in April 1981)
Mitsui Outlet Park Marine Pia Kobe(Retail facilities / Opened in October 1999)
Holding Business

Sales of Housing to End Users: Stable Results from Value-Added Brands
Our competitive product lineup has supported solid
sales and operating margin in the housing business in a
difficult environment. In fiscal 2008, high-end, value-
added properties and large-scale, high-rise properties
accounted for approximately 70 percent of sales. This
highly competitive product mix is a core Mitsui Fudosan
strength, and a key factor supporting strong results rela-
tive to the market. Moreover, Group company Mitsui
Fudosan Residential Co., Ltd. integrates the entire residen-
tial value chain from land acquisition through sales, which
has helped us to understand customer needs and wants
and efficiently supply the properties that increasingly selec-
tive consumers desire.
Mitsui Fudosan Residential assimilates customer needs
by offering numerous brands that are in tune with cus-
tomer lifestyles. However, Mitsui Fudosan Residential’s
greatest strength is that it is integrated from planning and
construction through sales, which enables it to provide
highly competitive properties that meet customer needs.
Moreover, the high-quality management and operation
services it provides once customers move into their new
condominiums complement Mitsui Fudosan Group renova-
tion and residential brokerage operations in the future.
Mitsui Fudosan’s strategy of concentrating on superior
properties in metropolitan Tokyo will lend strength to this
business despite the projected decrease in Japan’s popula-
Trading BusinessSales of housing to end usersand sales of income-producingproperties to investors
Operating Income (Billions of yen)
Portfolio Growth Strategy: Ample land bank and competitive lineup
80
60
40
20
0
48.844.3
34.332.2
20082007200620052004(Years ended March 31)
57.7
2009
48.5
22
THE TOYOSU TOWER(Housing for sale / Completed in March 2009)
Review of Operations

tion, because people continue to relocate to Tokyo.
Moreover, several changes in the tax code favoring the
residential real estate business are expected to support
sales of housing to end users.
Operating income from sales of housing to end users is
trending downward. Going forward, however, Mitsui
Fudosan will focus resources on properties such as Park
Court Akasaka The Tower (Minato-ku, Tokyo) that con-
tribute strongly to overall performance in order to main-
tain its position of leadership in this segment.
While competition to acquire land abated to some
extent during fiscal 2008, land costs remain an important
factor determining profitability. The Mitsui Fudosan Group
has excellent relationships with many business partners,
and is also aggressively participating in redevelopment
projects that allow us to use our reliability and experience
to acquire business opportunities with comparatively less
competition. We have therefore been able to use our own
channels to build up a land bank for approximately 18,000
units as of March 2009.
23
Park Court Azabujuban The Tower(Housing for sale / Completion scheduled for FY2010)
Park City Hamadayama(Housing for sale / Completion scheduled for FY2009)

24
Sales of Properties to Investors:Rejuvenation and Recovery of the J-REIT Market
The financial crisis has had a profound impact on sales
of properties to investors as dysfunction in financial and
capital markets has caused a sharp drop in the liquidity of
the real estate investment market. The credit crunch that
resulted from the financial crisis has greatly affected
J-REITs, causing difficulties in procuring debt financing and
declines in J-REIT investment unit prices that inhibit equity
financing. Restoring the J-REIT market is crucial to over-
coming the current adverse conditions and rejuvenating
the real estate investment market.
One of our core strengths is our relationships with a
broad range of investors through channels including the
three J-REITs for which we provide asset management and
the numerous private funds, investment corporations and
other vehicles managed by Mitsui Fudosan Investment
Advisors, Inc. During fiscal 2008, overall revenues in this
business rose as increased sales to investors of income-
producing properties such as office buildings through
special purpose companies (SPCs) more than compensated
for lower direct sales of properties to investors. Further-
more, while operating income in this business was down
in fiscal 2008, the contribution to earnings from sales to
investors has increased over the past several years, and we
expect it to continue to remain a fundamental component
of consolidated earnings over the course of New
Challenge Plan 2016.
An integrated value chain has been a key to our strategy
as investors that purchase properties typically turn to the
Mitsui Fudosan Group for property and asset management
services within the core maintenance business. After
selling properties to funds, we typically receive the
management contract as well. Our integrated value
chain therefore provides opportunities to benefit once
the development process is complete.
A Solid Pipeline and an Intelligent Level of Inventories
We have an inventory of land for approximately
18,000 units of residential housing, and are working on
several large-scale developments. These efforts will include
an integrated approach to create entire communities in a
series of large-scale projects that will incorporate commercial
Aoyama OM-SQUARE(Office building / Completed in July 2008)
Review of Operations

Management
ManagementManagement
Sale
SaleSale
Mitsui FudosanGroup
Private Funds Structured byMitsui Fudosan Investment Advisors
Private Funds Structured byMitsui Fudosan Investment Advisors CorporationsCorporations
NipponBuilding Fund
NipponBuilding Fund
Frontier Real EstateInvestment Corporation
Frontier Real EstateInvestment Corporation
NipponAccommodations Fund
NipponAccommodations Fund
and other facilities to raise competitiveness. Our land bank
is a source of competitive strength because we not only
acquire land on the open market, but also by continuously
participating in high-value-added redevelopment and
urban renaissance projects. Our large-scale redevelopment
projects typically take time to complete, but they create
lasting, long-term value that provides strong support to
our revenues and earnings. We intend to strengthen our
efforts to acquire high-quality redevelopment and urban
renaissance projects while strengthening the profitability
of Mitsui Fudosan Residential.
Mitsui Fudosan maintains ample inventories of proper-
ties for sale to investors, with ¥267 billion on the balance
sheet and approximately ¥300 billion in SPCs. These are
prime assets that are recognized as superior relative to
the market. Our ability to supply properties to a broad
range of investors other than J-REITs remains a core
strength. As of March 31, 2009, 40 percent of total real
estate inventories on the balance sheet and owned
through SPCs was designated for sales of housing to end
users, and 60 percent was designated for sales of proper-
ties to investors. Approximately 30 percent of these assets
were not generating cash flow. However, Mitsui Fudosan
expects these properties to be sold or in operation within
the next three years, and the current inventory situation in
no way approximates the difficult circumstances prevalent
during the unwinding of Japan’s bubble economy.
25
Mitsui Outlet Park Iruma (Retail facilities / Opened in April 2008)
Model for Coexistence and Growth with REITs/Funds
Sales to investors(non-operating)
Ratio of non-operating assets for sale to investors
End of Fiscal 2008: approx. 30%
End of Fiscal 2010: approx. 10% (estimate)
Sales to investors(operating/rental condominiums)
Sales to investors(operating/retail facilities)Sales to investors
(operating/office buildings)
Housing salesto individuals
30%
8%7%15%
40%At the end of FY2008 (approx.)
* Consolidated basis, real properties for sale (including advances paid for purchases) and assets held by SPCs for trading business
Breakdown of Housing Sales / Sales to Investors of Inventory Assets*(Year ended March 31, 2009)
Trading Business

Core Strategy: Grow Assets underManagement and Fee Income
The management business entails property and asset
management for J-REITs and private funds, and brokerage
services. It has expanded assets under management and
increased fee income by emphasizing its role as a trustee and
contract service provider on behalf of investors and origina-
tors. Mitsui Fudosan has listed two J-REITs, and in fiscal 2007
acquired the asset management arm of Frontier Real Estate
Investment Corporation, a retail facility-specific J-REIT. These
J-REITs typically take delivery of properties developed by
Mitsui Fudosan, and are a significant source of asset and
property management fees. We have also expanded the num-
ber of private funds we manage with the objective of stable
returns.
In addition to J-REITs, private funds also acquire properties
that the Mitsui Fudosan Group developed, and contract with
the Mitsui Fudosan Group for management services.
Revenues from subleasing and development management are
another source of fee income.
Fee Income Enhances ROEThe management business is based on Mitsui Fudosan’s
skills as a solutions provider, and the fee income it generates
contributes to higher ROE because it does not require an
increase in assets. A key to Mitsui Fudosan’s success in the
management businesses is the ability of subsidiaries to handle
a broad range of responsibilities covering the entire real
estate value chain. As a result, fee income has been steady
despite the impact of the financial crisis.
26
(Transactions)
(Years ended March 31)
35,000
30,000
25,000
20,000
15,000
10,000
5,000
087 88 89 90 91 92 93 94 95 96 97 98 99 00 01 02 03 04 05 06 07 08 09
Source: Ministry of Justice
Management BusinessProperty management andasset management for REITsand private funds and brokerage
Operating Income (Billions of yen)
Portfolio Growth Strategy: Raise ROE with fee-based businesses
80
60
40
20
0
52.347.5
40.9
33.128.7
20082007200620052004
44.3
2009(Years ended March 31)
Review of Operations
The Leader of Japan’s Residential Brokerage Market for 23 YearsNationwide Brokerage Transactions by the Mitsui Real Estate Sales Network
With a total of 31,084 brokerage transactionsthroughout Japan in the year ended March2009, the Mitsui Real Estate Sales network hasbeen number one for 23 consecutive years.Transactions have remained above 30,000per year for each of the six years since the yearended March 2004.

Akasaka Biz Tower (Office and retail facilities / Completed in March 2008)
27
Core Competencies Drive Fee BusinessesThe brokerage services that Group company Mitsui Real
Estate Sales Co., Ltd. provides in the secondary market for
residential properties are central to the management busi-
ness. Transaction volume in the Japanese secondary market
relative to the primary market is low compared to the corre-
sponding balance in the U.S. and Europe, which indicates
solid future growth potential. The Mitsui Fudosan Group’s
Mitsui Rehouse brand has been number one in Japan’s bro-
kerage market in terms of transaction volume for 23 consecu-
tive years since 1986, although the turmoil in financial and
real estate markets has negatively affected this business. We
see the current difficult environment as an opportunity for re-
engineering to cut costs, raise responsiveness and reorient
sales and the earnings structure toward urban markets, and
have initiated a restructuring program.
Moreover, we are energetically enhancing our masterleas-
ing and development management operations. A representa-
tive example is Mitsui Fudosan’s emergence as one of the
largest operators of retail facilities in Tokyo’s Ginza area. In
addition, we will strengthen asset redevelopment operations
in city centers and regional areas, and build on the synergy
that exists with the holding and trading businesses in such
projects.
The financial crisis has had a pronounced effect on the
corporate brokerage business, which is part of the manage-
ment business. The recovery of this business is closely linked
to the rejuvenation of the real estate investment market,
which has contracted due to the financial crisis. Mitsui
Fudosan is therefore moving to prepare corporate brokerage
to meet needs as its markets recover.
Consistent Growth through Groupwide Cooperation
Assets under management totaled ¥2.8 trillion as of
March 31, 2009. Fee income for the Mitsui Fudosan Group
for fiscal 2008 totaled ¥24.3 billion. Group companies are an
important part of the value chain in the management busi-
ness. While making overall Group management more effi-
cient, we work to generate growth among Group companies
by expanding assets under management and providing servic-
es such as property management.

Sound and Efficient ManagementMitsui Fudosan has adopted a corporate officer sys-
tem to build a business execution framework appropriate
to its operating environment and business activities,
enhancing the soundness and efficiency of management
by separating and strengthening management and execu-
tive functions. In addition, the Group Corporate Officer
System, in which corporate officers of both Mitsui
Fudosan and its Group companies share an equal status
and mission, was established to further strengthen Group
management.
Improving Transparency and Expanding thePerspective of Management
Mitsui Fudosan invites and appoints outside directors
in order to strengthen the oversight functions of the
directors and enhance management transparency. The
outside directors provide input as necessary on the rea-
sonableness and adequacy of Mitsui Fudosan’s decision
making.
Furthermore, Mitsui Fudosan has established the
Advisory Committee, consisting of experts from business
and academia, to diversify the perspective of manage-
ment by providing comprehensive and forward-looking
advice from an objective viewpoint. The committee met
twice in fiscal 2008, and each member offered valuable
advice.
Decision-MakingThe Executive Management Committee, consisting
of executive managing directors and executive corporate
officers, meets weekly to deliberate and report on
important matters related to business execution. Full-
time corporate auditors also attend meetings to stay
informed of important decision-making processes and
the status of business execution, and provide opinions as
necessary. The Executive Management Committee also
supervises internal control and risk management.
In addition, the Strategy Planning Special
Committee, the Risk Management Special Committee
and the Environmental Special Committee function as
advisory and strategy coordination bodies to the
Executive Management Committee. The Strategy
Planning Special Committee formulates and deliberates
Group strategy and management plans and engages in
risk management for Mitsui Fudosan and the Mitsui
Fudosan Group in collaboration with the Risk
Management Special Committee. The Environmental
Special Committee, which is responsible for reviewing
overall corporate social responsibility (CSR) efforts
including environmental and social contributions, com-
piled the Mitsui Fudosan Group’s position on CSR and
its CSR themes.
Business ExecutionThe Board of Directors, comprising eleven members
including three outside directors, makes decisions on
material issues of Mitsui Fudosan and supervises the
status of the directors’ execution of business. The
corporate auditors attend meetings of the Board of
Directors and provide opinion as necessary.
In addition, Mitsui Fudosan has designated a special
director who may pass judgment on the urgent acquisi-
tion or sale of assets when so empowered by the Board of
Directors.
Mitsui Fudosan has adopted a corporate auditor sys-
tem. The Board of Corporate Auditors, comprising five
corporate auditors, including three outside auditors,
formulates auditing policies and determines duty
assignments. It also receives reports and discusses material
items on audits conducted according to these policies and
assignments. The corporate auditors receive periodic
reports from the Audit Department and the certified public
accountant and exchange information in working toward
mutual cooperation.
The Mitsui Fudosan Group aims for sound, transparent and efficient management in buildingoptimum corporate governance to earn the trust of all stakeholders. Measures to strengthenits internal system are one part of achieving that goal.
28
Corporate Governance

As an internal auditing structure, the Audit
Department carries out regular audits of all business
departments and reports the results of its audits. It also
works to enhance the effectiveness of internal control by
identifying and providing guidance to audited divisions on
areas requiring improvement.
Mitsui Fudosan has concluded an auditing contract
with KPMG AZSA & Co. as its certified public accountant,
which conducts appropriate audits as necessary in addi-
tion to the audit at the end of the fiscal year.
Mitsui Fudosan has no conflicts of interest with either
the certified public accountant or the employees of the
certified public accountant who audits the Company.
Internal Control SystemWhile promoting the enhancement and operation of
a system of internal control, Mitsui Fudosan is strengthen-
ing the system according to its basic policy on building an
internal control system formulated in October 2006 to
ensure the appropriateness of business including the con-
formance of business execution with laws and the articles
of incorporation.
Response to Internal Control Report SystemBased on the Financial Instruments andExchange Law (J-SOX)
The Internal Control Report System requires listed
companies to establish and evaluate internal control relat-
ed to financial reports, to prepare written reports, and to
have auditors audit those reports. The Mitsui Fudosan
Group set up a project team in April 2006 and has contin-
ued preparing for the system while integrating the opin-
ions of outside specialists. The establishment of the
Operating Administration Department in April 2007 as a
J-SOX supervisory department completed a structure to
enhance and operate internal control for the entire Group
as well as to evaluate enhancements and operations.
During fiscal 2008, Mitsui Fudosan implemented
J-SOX, evaluated upgrades and execution, and made
improvements. As a result, the Company believes its inter-
nal controls relevant to consolidated financial reporting as
of March 31, 2009 are effective, and has issued its
Internal Control System Report pursuant to this evalua-
tion. In addition, the auditors have audited the content of
the report. Mitsui Fudosan will continue to evaluate
upgrades and execution in working to strengthen its sys-
tem of internal controls.
Risk ManagementThe Mitsui Fudosan Group believes that appropriately
handling various business risks and minimizing their
impact on management are the foundation for achieving
sound business activities and CSR objectives.
Under the Executive Management Committee, which
supervises overall risk management for Mitsui Fudosan
and the Mitsui Fudosan Group, the Strategy Planning
Special Committee and Risk Management Special
Committee manage business risk and administrative risk,
respectively, delineate and apprehend risk issues and pro-
pose response measures.
In addition, the Crisis Management Subcommittee, as
a subordinate body of the Risk Management Special
Committee, apprehends the circumstances of accidents or
other incidents that occur and determines response poli-
cies and other matters as necessary.
ComplianceThe Mitsui Fudosan Group promotes compliance that
extends beyond legal compliance and adherence to cor-
porate ethics, with a strong awareness of social norms
and principles, and the social responsibilities of a compa-
ny. With the establishment of the Mitsui Fudosan Group
Compliance Policies as behavioral guidelines for all Group
executives and employees, the Group works to prevent
violations of laws and its articles of incorporation by
upgrading the Compliance Rules and other internal rules
and establishing the Risk Management Special
Committee. Each Mitsui Fudosan Group company has
also set up an Internal Consultation System on
compliance for employees.
29

30
Business Execution and Internal Control
Shareholders’ Meeting
Board of Directors(Directors)
Board of Corporate Auditors(Auditors)
Corporate AuditorsDepartment
Certified Public Accountant(Audit Corporation)
(As of June 26, 2009)
Advisory Committee
Departments/Divisions
Executive Management Committee(Executive Managing Directors,
Executive Corporate Officers)
President and Chief Executive Officer
Committees
Strategy Planning Special Committee Risk Management Special Committee
Environmental Special Committee
Corporate Officers
Audit Department
Corporate Governance Organization
Compensation for Directors and Corporate Auditors
Compensation for directors and corporate auditors in the
year ended March 31, 2009 was as follows:
Title Number Compensation
Directors 8 ¥675 million
Corporate Auditors 7 ¥13 million
The components of compensation for independent auditors
are as follows in the year ended March 31, 2009:
Contractual compensation for audit certification
and related responsibilities ¥402 million
Additional compensation ¥9 million
1. The above amounts include ¥212 million in directors’
bonuses and ¥32 million in stock options that directors
received as part of their compensation.
2. Compensation received by the two external directors and
three external corporate auditors included in the above
totaled ¥48 million.
Other Significant Compensation
Mitsui Fudosan America, Inc., a consolidated sub-
sidiary, paid ¥33 million in compensation to KPMG LLP, a
member of the same network as Mitsui Fudosan’s certi-
fied public accountant.
Content of Non-Audit Services of Submitting Companies
Including the Certified Public Accountant
Non-audit services including those of the certified
public account to which Mitsui Fudosan paid compensa-
tion consisted of advisory services related to the evalua-
tion of internal control of financial reports.
Policy for Determining Audit Compensation
Mitsui Fudosan’s policy to determine audit compensa-
tion for the certified public accountant is decided through
rational consideration of factors including the number of
days of auditing, the size of Mitsui Fudosan and special
characteristics of its business.
Corporate Governance

Senior Corporate Auditor
Kazuichi NagataCorporate Auditor
Masayuki IsobeCorporate Auditors (Outside Auditors)
Akishige OkadaKeiu Nishida
Toshiaki Hasegawa
President and Chief Executive Officer
Hiromichi Iwasa
Executive Vice Presidents
Koichi OmuroIn charge of Space & Environment Institute
Tatsuo SodaIn charge of Audit Department
Senior Executive Managing Officers
Mitsuhiro MatsumotoIn charge of Housing Sales Business;President, Mitsui Fudosan Residential Co., Ltd.
Yoshiki KageyamaIn charge of Architectural andConstruction Services Department;In charge of Nihonbashi Urban Planningand Development Department;General Manager, Office Building Division
Executive Managing Officers
Yoshiaki IinumaIn charge of Sales Offices;General Manager, Retail Properties Division
Seizo KuramotoIn charge of Accounting and FinanceDepartment, Operating AdministrationDepartment, Information SystemsDepartment
Masanobu KomodaIn charge of Executive Secretarial Department,Corporate Communications Department, Planning and Research Department,Affiliated Business Department,Toyosu-Project Development PlanningDepartment, Kashiwanoha Campus CityProject Development PlanningDepartment, Land DevelopmentDepartment, Development PlanningDepartment, Gotanda Project Department; General Manager, Principal InvestmentsDepartment
Executive Managing Officers
Takayoshi SaitoIn charge of Kansai Head Office;General Manager, Kansai Head Office
Hitoshi SaitoIn charge of International Department
Toshihide IchikawaIn charge of Tokyo Midtown DevelopmentDepartment, Resort DevelopmentDepartment; General Manager,Accommodations Business Division
Yoshikazu KitaharaDeputy General Manager, Office BuildingDivision
Shougo NakaiIn charge of Appraisal Department; General Manager, General AdministrationDepartment
Kenji IinoGeneral Manager, Personnel Department
Managing Officers
Yasuhiko YamashiroGeneral Manager, Office BuildingDevelopment Department (I), Office Building Division;General Manager, Mitsui MemorialHospital Redevelopment Project
Masatoshi OzakiGeneral Manager, Real Estate SolutionServices Division
Yasuo OnozawaGeneral Manager, Chiyoda AreaDevelopment Department, Office BuildingDivision
Group Senior Managing Officers
Minoru SatouMitsui Real Estate Sales Co., Ltd.
Hidehisa TakeiMitsui Real Estate Sales Co., Ltd.
Hiroshi Asai Mitsui Fudosan Investment Advisors, inc.
Group Managing Officers
Takashi IkedaMitsui Fudosan Housing Service Co., Ltd.
Takeshi SuzukiMitsui Fudosan Residential Co., Ltd.
Youichi AritaMitsui Fudosan Building Management Co., Ltd.
Tadashi AndoLaLaport Management Co., Ltd.
Kiyotaka FujibayashiMitsui Fudosan Residential Co., Ltd.
31
Front row, from left: Mitsuhiro Matsumoto, Koichi Omuro, Hiromichi Iwasa, Tatsuo Soda, Yoshiki KageyamaBack row, from left: Yoshiharu Hayakawa, Masanobu Komoda, Yoshiaki Iinuma, Seizo Kuramoto, Toshiharu Aoki, Mitsudo Urano
Members of the Board
Auditors
Corporate Officers
Group Managing Officers
Management Team(As of June 26, 2009)
President and Chief Executive Officer
Hiromichi IwasaExecutive Vice Presidents
Koichi OmuroTatsuo Soda
Senior Executive Managing Directors
Mitsuhiro MatsumotoYoshiki Kageyama
Executive Managing Directors
Yoshiaki IinumaSeizo KuramotoMasanobu Komoda
Managing Directors(Outside Directors)
Toshiharu AokiYoshiharu HayakawaMitsudo Urano

32
The Environment: Clear Policies andGoals for the Entire Group
The Mitsui Fudosan Group takes a compre-hensive approach to protecting the environment.In October 2008, the Mitsui Fudosan Grouprevised its Group Environmental Policy toenhance its emphasis on the environment fromthe design stage, and to support efforts to mini-mize the burden placed on the environment bycorporate administration and the operation ofproperties. Moreover, the EnvironmentalManagement Committee within theEnvironmental Special Committee workstogether with 14 Group companies to developand implement environmental initiatives underthe Group Environmental Policy.
A Comprehensive Approach to Reducing Environmental Impact
Our initiatives to reduce environmental impactinclude preventing pollution, rigorously complying withenvironmental laws, and implementing our own inde-pendent standards to ensure the highest level of environ-mental compatibility. For example, the Mitsui FudosanGroup has established eco-specifications for all of itsbuildings and services to minimize environmental impact.These voluntary standards for environmental measurescomprise design guidelines in areas including energy effi-ciency, green procurement, greenery, and universaldesign, and case studies for equipment and methods.Moreover, we regularly revise the eco-specifications toensure that they continuously meet the requirements ofcustomers and society.
Certification of the Group’s Environmental Management System
The Mitsui Fudosan Group has a consistent programfor obtaining ISO 14001 certification of the componentsof its environmental management system. In addition, anumber of divisions and facilities have established envi-ronmental management systems at their respective oper-ational sites and acquired ISO 14001 certification. As ofthe end of March 2009, a total of six divisions and sevenfacilities in Mitsui Fudosan Co., Ltd. and eight Group
companies had obtained ISO 14001 certification.Another core initiative is designing office buildings
for long life to increase energy efficiency and reduce CO2
emissions throughout each building’s lifecycle. In addi-tion, in fiscal 2006, Mitsui Fudosan began using theComprehensive Assessment System for BuildingEnvironmental Efficiency (CASBEE), the assessmentsystem recommended by the Ministry of Land,Infrastructure, Transport and Tourism, in order to evalu-ate the environmental efficiency of new buildings at thedesign stage. In addition, in principle we acquire CASBEEcertification from the Institute for Building Environmentand Energy Conservation for new buildings of a certainscale or larger. As of September 2008, Mita M-Square(Minato-ku, Tokyo), and Akasaka Biz Tower (Minato-ku,Tokyo) were in the process of acquiring the certification.Moreover, Yodoyabashi Mitsui Building (Chuo-ku, OsakaCity), completed in March 2008, obtained the CASBEEOsaka rank of S, joining three office buildings and a retailproperty that are totally or partially owned by the MitsuiFudosan Group that have received an S from theInstitute.
Education and Communication to Protect the Environment
Mitsui Fudosan conducts environmental trainingevery year for all new employees to provide them withbasic knowledge on environmental issues and teachthem the Group’s Environmental Policy and environmen-tal initiatives. In addition, the employees of each operat-ing division receive environmental training every year.Mitsui Fudosan also uses intra-Group magazines toencourage environmental awareness through meanssuch as intranet communication, energy conservationworkshops, environmental study groups and annualseminars.
The Mitsui Fudosan Group is committed to contributing to environmentally responsible socialand economic development under a corporate philosophy of coexisting in harmony withsociety and linking diverse values. Our mission is clear: bring enrichment and greater comfortto the urban environments we create while protecting the local and global environment. Ourcorporate social responsibility initiatives therefore center on the environment, the quality ofour products and services, and the creation of value in supporting community development.
Corporate Social Responsibility
The Mitsui Fudosan Groupand Its Commitment to the Environment 2008
Environmental trainingin progress
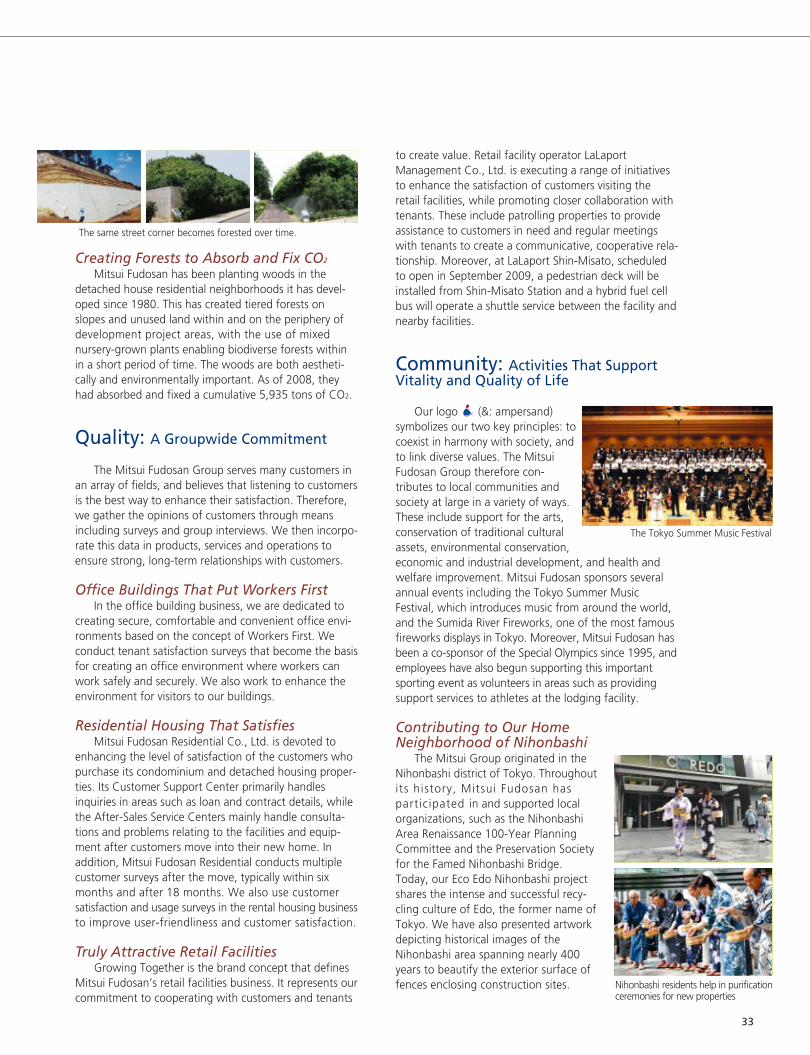
to create value. Retail facility operator LaLaportManagement Co., Ltd. is executing a range of initiativesto enhance the satisfaction of customers visiting theretail facilities, while promoting closer collaboration withtenants. These include patrolling properties to provideassistance to customers in need and regular meetingswith tenants to create a communicative, cooperative rela-tionship. Moreover, at LaLaport Shin-Misato, scheduledto open in September 2009, a pedestrian deck will beinstalled from Shin-Misato Station and a hybrid fuel cellbus will operate a shuttle service between the facility andnearby facilities.
Community: Activities That SupportVitality and Quality of Life
Our logo (&: ampersand)symbolizes our two key principles: tocoexist in harmony with society, andto link diverse values. The MitsuiFudosan Group therefore con-tributes to local communities andsociety at large in a variety of ways.These include support for the arts,conservation of traditional culturalassets, environmental conservation,economic and industrial development, and health andwelfare improvement. Mitsui Fudosan sponsors severalannual events including the Tokyo Summer MusicFestival, which introduces music from around the world,and the Sumida River Fireworks, one of the most famousfireworks displays in Tokyo. Moreover, Mitsui Fudosan hasbeen a co-sponsor of the Special Olympics since 1995, andemployees have also begun supporting this importantsporting event as volunteers in areas such as providingsupport services to athletes at the lodging facility.
Contributing to Our Home Neighborhood of Nihonbashi
The Mitsui Group originated in theNihonbashi district of Tokyo. Throughoutits history, Mitsui Fudosan haspart ic ipated in and supported localorganizations, such as the NihonbashiArea Renaissance 100-Year PlanningCommittee and the Preservation Societyfor the Famed Nihonbashi Bridge.Today, our Eco Edo Nihonbashi projectshares the intense and successful recy-cling culture of Edo, the former name ofTokyo. We have also presented artworkdepicting historical images of theNihonbashi area spanning nearly 400years to beautify the exterior surface offences enclosing construction sites.
The Tokyo Summer Music Festival
Nihonbashi residents help in purificationceremonies for new properties
Creating Forests to Absorb and Fix CO2
Mitsui Fudosan has been planting woods in thedetached house residential neighborhoods it has devel-oped since 1980. This has created tiered forests onslopes and unused land within and on the periphery ofdevelopment project areas, with the use of mixednursery-grown plants enabling biodiverse forests withinin a short period of time. The woods are both aestheti-cally and environmentally important. As of 2008, theyhad absorbed and fixed a cumulative 5,935 tons of CO2.
Quality: A Groupwide Commitment
The Mitsui Fudosan Group serves many customers inan array of fields, and believes that listening to customersis the best way to enhance their satisfaction. Therefore,we gather the opinions of customers through meansincluding surveys and group interviews. We then incorpo-rate this data in products, services and operations toensure strong, long-term relationships with customers.
Office Buildings That Put Workers FirstIn the office building business, we are dedicated to
creating secure, comfortable and convenient office envi-ronments based on the concept of Workers First. Weconduct tenant satisfaction surveys that become the basisfor creating an office environment where workers canwork safely and securely. We also work to enhance theenvironment for visitors to our buildings.
Residential Housing That SatisfiesMitsui Fudosan Residential Co., Ltd. is devoted to
enhancing the level of satisfaction of the customers whopurchase its condominium and detached housing proper-ties. Its Customer Support Center primarily handlesinquiries in areas such as loan and contract details, whilethe After-Sales Service Centers mainly handle consulta-tions and problems relating to the facilities and equip-ment after customers move into their new home. Inaddition, Mitsui Fudosan Residential conducts multiplecustomer surveys after the move, typically within sixmonths and after 18 months. We also use customersatisfaction and usage surveys in the rental housing businessto improve user-friendliness and customer satisfaction.
Truly Attractive Retail FacilitiesGrowing Together is the brand concept that defines
Mitsui Fudosan’s retail facilities business. It represents ourcommitment to cooperating with customers and tenants
The same street corner becomes forested over time.
33

34
The Japan Council of Shopping Centers (JCSC) announcedits Third Japan SC Awards (2008) in March 2008. Four MitsuiFudosan retail facilities won major awards. The Japan SCAwards were established in 2004 to honor those shoppingcenters that contribute to the overall image of the industryand contribute to society and environmental protection.
Mitsui Fudosan’s goal is to develop retail facilities that arerooted in the community and grow with the neighborhoodsin which they are located. We want our shopping centers toenergize and contribute to their communities, and the SCAwards are positive affirmation of our success in doing so.
Arcakit Kinshicho received a Local CommunityContribution SC Award because of its success at contributingto local revitalization of an urban area by regenerating thevacant stores of a department store. It also supports local dis-aster and crime prevention, local festivals, and other benefi-cial neighborhood activities.
Alpark received a Local Community Contribution SCAward because it has concluded disaster prevention agree-ments with local citizen organizations and local governmentbodies under which it holds three emergency drills annually.The award also recognized its efforts to reduce wastethrough the introduction of a metered charging system forrefuse.
LaLaport Tokyo-Bay won a Gold Award. Among Japan’slargest shopping complexes, it attracts over 20 million visitorsa year. Mitsui Fudosan has executed ten renewals over thetwenty years since its opening to ensure an exceptional shop-ping center that integrates multiple functions to contributeto a higher quality of life.
Lazona Kawasaki Plaza received a New Face SC Award as anoutstanding newly opened facility designed to enhance cus-tomer satisfaction and convenience. This shopping center pro-vides a broad range of services, and its sales performance hasexceeded expectations.
Mitsui Fudosan received four 2008 Good Design awards.This was the ninth consecutive year that Mitsui Fudosan hasreceived Good Design awards since the competition for
2000, when it became the first in the industry to receive anaward for a condominium property.
Our multifaceted commitment to quality and customersatisfaction was a key factor in winning the awards. MitsuiGarden Hotel Prana Tokyo Bay won an award in the indus-try/office category, while Urban Dock Park City Toyosu wonan award in the single-family houses and multiple dwellingunits category. Mitsui Fudosan’s Park Homes series alsoreceived an award in the single-family houses and multipledwelling units category for its overall effort to create environ-mentally friendly housing, while Mitsui Fudosan Residential’sPinocchio Program for children received a Media award.
Third Japan SC Awards (2008)
LaLaport Tokyo-Bay
Alpark
Good Design Awards
Corporate Social Responsibility

Financial Section
Contents
Six-Year Summary....................................................... 36
Management’s Discussion and Analysis....................... 37
Consolidated Balance Sheets....................................... 48
Consolidated Statements of Income............................ 50
Consolidated Statements of Changes in Net Assets..... 51
Consolidated Statements of Cash Flows...................... 52
Notes to Consolidated Financial Statements ................ 53
Independent Auditors’ Report ..................................... 74
35

Six-Year SummaryMitsui Fudosan Co., Ltd. and its Subsidiaries
Thousands of U.S. dollarsstnuoma erahs rep tpecxeney fo snoilliM
except per share amounts and number of employees (Note 1)
Years ended March 31 2009 2008 2007 2006 2005 2004 2009
FOR THE YEAR:
Revenue from operations................... ¥1,418,946 ¥1,360,023 ¥1,229,194 ¥1,159,280 ¥1,111,359 ¥1,102,844 $14,445,139Interest, dividends and miscellaneous ...................................... 9,389 27,509 23,946 16,949 11,320 11,652 95,582
Costs and expenses (including tax)...................................... 1,349,178 1,305,778 1,180,528 1,121,676 1,096,075 1,103,241 13,734,888
Equity in net income of affiliated companies.......................... 5,980 7,064 4,410 3,155 3,596 3,535 60,878
Minority interests.................................. (1,565) (1,440) (1,808) (1,167) (1,507) (335) (15,932)Net income .............................................. 83,572 87,378 75,214 56,541 28,693 14,455 850,779
AT YEAR-END:
Total assets.............................................. ¥3,758,387 ¥3,634,489 ¥3,294,190 ¥2,986,502 ¥2,928,199 ¥2,916,583 $38,261,091Shareholders’ equity and valuation and
translation adjustments....................... 978,667 971,310 944,196 858,364 687,718 659,165 9,963,015Common stock ....................................... 174,296 174,296 174,296 174,296 134,433 134,433 1,774,366Number of employees ......................... 15,476 14,788 13,299 13,053 12,707 12,808
PER SHARE DATA:
Net income (basic)................................ ¥ 95.1 ¥ 99.4 ¥ 85.5 ¥ 67.5 ¥ 34.7 ¥ 17.5 $ 0.968Cash dividends applicableto the year ............................................. 22.0 20.0 14.0 10.0 7.0 7.0 0.224
RATIOS:
Equity ratio (%) (Note 2) ......................... 26.0 26.7 28.7 28.7 23.5 22.6Return on assets (%) (Note 3)............... 5.06 5.53 5.50 4.92 4.30 4.06
Notes: 1. U.S. dollar amounts are translated from yen at the rate of ¥98.23 = U.S.$1.00, the approximate exchange rate at March 31, 2009.2. Equity ratio = (Net assets – Subscription rights to shares – Minority interests) / Total assets3. Return on assets (ROA) = (Operating income + Non-operating income) / Average total assets over the period
36
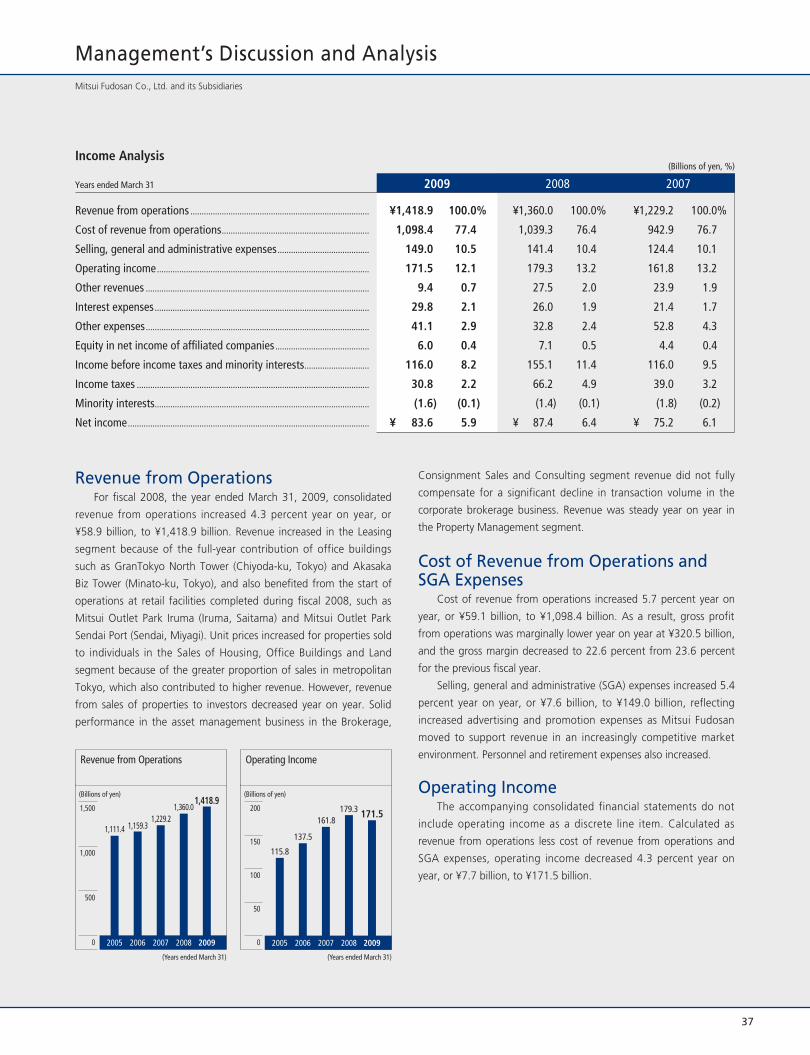
Management’s Discussion and Analysis
Revenue from OperationsFor fiscal 2008, the year ended March 31, 2009, consolidated
revenue from operations increased 4.3 percent year on year, or
¥58.9 billion, to ¥1,418.9 billion. Revenue increased in the Leasing
segment because of the full-year contribution of office buildings
such as GranTokyo North Tower (Chiyoda-ku, Tokyo) and Akasaka
Biz Tower (Minato-ku, Tokyo), and also benefited from the start of
operations at retail facilities completed during fiscal 2008, such as
Mitsui Outlet Park Iruma (Iruma, Saitama) and Mitsui Outlet Park
Sendai Port (Sendai, Miyagi). Unit prices increased for properties sold
to individuals in the Sales of Housing, Office Buildings and Land
segment because of the greater proportion of sales in metropolitan
Tokyo, which also contributed to higher revenue. However, revenue
from sales of properties to investors decreased year on year. Solid
performance in the asset management business in the Brokerage,
Income Analysis(Billions of yen, %)
Years ended March 31 2009 2008 2007
Revenue from operations ................................................................................ ¥1,418.9 100.0% ¥1,360.0 100.0% ¥1,229.2 100.0%
Cost of revenue from operations.................................................................. 1,098.4 77.4 1,039.3 76.4 942.9 76.7
Selling, general and administrative expenses......................................... 149.0 10.5 141.4 10.4 124.4 10.1
Operating income............................................................................................... 171.5 12.1 179.3 13.2 161.8 13.2
Other revenues .................................................................................................... 9.4 0.7 27.5 2.0 23.9 1.9
Interest expenses................................................................................................ 29.8 2.1 26.0 1.9 21.4 1.7
Other expenses.................................................................................................... 41.1 2.9 32.8 2.4 52.8 4.3
Equity in net income of affiliated companies .......................................... 6.0 0.4 7.1 0.5 4.4 0.4
Income before income taxes and minority interests............................. 116.0 8.2 155.1 11.4 116.0 9.5
Income taxes ........................................................................................................ 30.8 2.2 66.2 4.9 39.0 3.2
Minority interests................................................................................................ (1.6) (0.1) (1.4) (0.1) (1.8) (0.2)
Net income............................................................................................................ ¥ 83.6 5.9 ¥ 87.4 6.4 ¥ 75.2 6.1
(Years ended March 31)
0
500
1,500
1,000
20082005 2006 2007
1,111.4 1,159.31,229.2
1,360.0
(Billions of yen)
Revenue from Operations
(Years ended March 31)
0
100
50
200
150
20082005 2006 2007
115.8
137.5
161.8179.3
2009
1,418.9
2009
171.5
(Billions of yen)
Operating Income
Mitsui Fudosan Co., Ltd. and its Subsidiaries
Consignment Sales and Consulting segment revenue did not fully
compensate for a significant decline in transaction volume in the
corporate brokerage business. Revenue was steady year on year in
the Property Management segment.
Cost of Revenue from Operations andSGA Expenses
Cost of revenue from operations increased 5.7 percent year on
year, or ¥59.1 billion, to ¥1,098.4 billion. As a result, gross profit
from operations was marginally lower year on year at ¥320.5 billion,
and the gross margin decreased to 22.6 percent from 23.6 percent
for the previous fiscal year.
Selling, general and administrative (SGA) expenses increased 5.4
percent year on year, or ¥7.6 billion, to ¥149.0 billion, reflecting
increased advertising and promotion expenses as Mitsui Fudosan
moved to support revenue in an increasingly competitive market
environment. Personnel and retirement expenses also increased.
Operating IncomeThe accompanying consolidated financial statements do not
include operating income as a discrete line item. Calculated as
revenue from operations less cost of revenue from operations and
SGA expenses, operating income decreased 4.3 percent year on
year, or ¥7.7 billion, to ¥171.5 billion.
37

38
(Years ended March 31)
0
30
90
60
20082005 2006 2007
28.7
56.5
75.2
87.4(Billions of yen)
Net Income
(Years ended March 31)
0
50
25
100
75
20082005 2006 2007
34.7
67.5
85.5
99.4(Yen)
Net Income per Share
2009
83.6
2009
95.1
Other Revenue and Expenses and Interest Expenses
Interest, dividends and miscellaneous revenue decreased 65.9
percent, or ¥18.1 billion, to ¥9.4 billion. In fiscal 2007, a major
component of this item was gain on sale of property and equipment
and gain on sale of investment securities. In fiscal 2008, however,
Mitsui Fudosan did not generate either of these gains.
Interest income decreased 21.2 percent, or ¥0.1 billion, while
dividend income increased 16.7 percent, or ¥0.4 billion. Interest
expenses increased 14.4 percent, or ¥3.7 billion, to ¥29.8 billion
because Mitsui Fudosan accessed external resources to acquire
property and equipment as well as inventories and to continue
funding growth opportunities. The interest coverage ratio, calculated
as the sum of operating income and interest, dividends and
miscellaneous revenue divided by interest expenses, was 6.1 times
compared to 7.9 times for the previous fiscal year.
Other expenses increased 25.7 percent, or ¥8.4 billion, to ¥41.1
billion. This year-on-year change resulted primarily from impairment
loss on investment securities, reflecting in part the impact of lower
securities prices. Impairment loss on investment securities totaled
¥17.6 billion, compared with ¥5.4 billion in the previous fiscal year.
Loss on disposal of property and equipment resulting from
redevelopment of office buildings totaled ¥6.1 billion.
Income before Income Taxes andMinority Interests and Net Income
Equity in net income of affiliated companies decreased 15.3
percent, or ¥1.1 billion, year on year to ¥6.0 billion. As a result of
lower operating income and increased other expenses, income
before income taxes and minority interests decreased 25.2 percent
year on year, or ¥39.1 billion, to ¥116.0 billion. Income taxes net of
deferrals decreased 53.4 percent, or ¥35.4 billion, to ¥30.8 billion.
Consequently, net income decreased 4.4 percent year on year, or
¥3.8 billion, to ¥83.6 billion. Net income per share decreased to
¥95.1 from ¥99.4 for the previous fiscal year. Although net income
decreased, Mitsui Fudosan increased annual cash dividends per share
to ¥22.0 from ¥20.0 for the previous fiscal year.
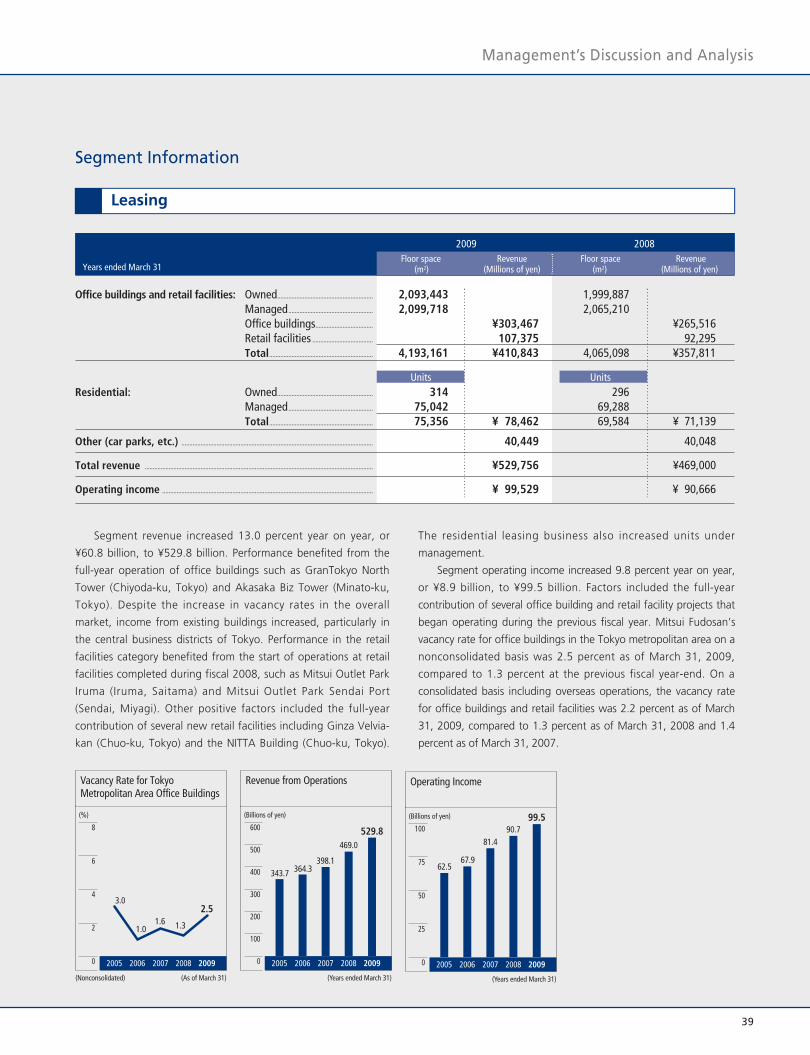
39
80029002Floor space Revenue Floor space Revenue
(m2) (Millions of yen) (m2) (Millions of yen)
Office buildings and retail facilities: Owned............................................................ 2,093,443 1,999,887Managed..................................................... 2,099,718 2,065,210Office buildings.................................... ¥303,467 ¥265,516Retail facilities ...................................... 107,375 92,295Total................................................................. 4,193,161 ¥410,843 4,065,098 ¥357,811
stinUstinUResidential: Owned............................................................ 314 296
Managed..................................................... 75,042 69,288Total................................................................. 75,356 ¥ 78,462 69,584 ¥ 71,139
Other (car parks, etc.) ........................................................................................................................ 40,449 40,048
Total revenue ............................................................................................................................................... ¥529,756 ¥469,000
Operating income .................................................................................................................................... ¥ 99,529 ¥ 90,666
Leasing
Segment revenue increased 13.0 percent year on year, or
¥60.8 billion, to ¥529.8 billion. Performance benefited from the
full-year operation of office buildings such as GranTokyo North
Tower (Chiyoda-ku, Tokyo) and Akasaka Biz Tower (Minato-ku,
Tokyo). Despite the increase in vacancy rates in the overall
market, income from existing buildings increased, particularly in
the central business districts of Tokyo. Performance in the retail
facilities category benefited from the start of operations at retail
facilities completed during fiscal 2008, such as Mitsui Outlet Park
Iruma (Iruma, Saitama) and Mitsui Outlet Park Sendai Port
(Sendai, Miyagi). Other positive factors included the full-year
contribution of several new retail facilities including Ginza Velvia-
kan (Chuo-ku, Tokyo) and the NITTA Building (Chuo-ku, Tokyo).
The residential leasing business also increased units under
management.
Segment operating income increased 9.8 percent year on year,
or ¥8.9 billion, to ¥99.5 billion. Factors included the full-year
contribution of several office building and retail facility projects that
began operating during the previous fiscal year. Mitsui Fudosan’s
vacancy rate for office buildings in the Tokyo metropolitan area on a
nonconsolidated basis was 2.5 percent as of March 31, 2009,
compared to 1.3 percent at the previous fiscal year-end. On a
consolidated basis including overseas operations, the vacancy rate
for office buildings and retail facilities was 2.2 percent as of March
31, 2009, compared to 1.3 percent as of March 31, 2008 and 1.4
percent as of March 31, 2007.
Years ended March 31
Management’s Discussion and Analysis
Segment Information
(As of Mar(Nonconsolidated) ch 31)
0
4
2
8
6
20082005 2006 2007
3.0
1.01.6 1.3
(%)
Vacancy Rate for Tokyo Metropolitan Area Office Buildings
(Years ended March 31)
0
300
200
600
500
400
20082005 2006 2007
343.7 364.3398.1
469.0
(Billions of yen)
Revenue from Operations
100
2009
2.5
2009
529.8
(Years ended March 31)
0
50
25
100
75
20082005 2006 2007
62.567.9
81.490.7
(Billions of yen)
Operating Income
2009
99.5

40
Segment revenue increased 3.7 percent year on year, or ¥14.0
billion, to ¥396.2 billion. Total units of detached houses and
condominiums sold to individuals decreased by 184 to 5,778 units.
Revenue from sales of condominiums to individual customers
increased 17.0 percent, or ¥39.9 billion, to ¥274.9 billion despite
slightly lower sales volume due to an increase in sales of high-
value-added condominiums, which raised average unit prices. The
number of units sold decreased to 5,206 from 5,249 in the
previous fiscal year. Sales of detached houses to individual
customers decreased to 572 units from 713 units in the previous
fiscal year. Other sales revenue, comprising revenue from sales to
investors of income-producing properties developed by the
Company, decreased 18.5 percent, or ¥20.8 billion, to ¥91.1
billion. As of March 31, 2009, Mitsui Fudosan Residential Co., Ltd.
had 919 units in completed inventories, consisting of 826
condominium units and 93 detached houses, up from 568 units a
year earlier, which consisted of 453 condominium units and 115
detached houses.
Segment operating income decreased 15.9 percent year on
year, or ¥9.2 billion, to ¥48.6 billion. Sales of properties to
investors decreased but remained profitable, and distributions
from SPCs following the sales of office buildings and other
properties were another factor that contributed to operating
income. However, segment operating income decreased because
of loss on devaluation of real property for sale totaling ¥15.8
billion, with ¥13.1 billion allocated to inventories for individuals
and ¥2.7 billion allocated to inventories for investors.
(Years ended March 31)
0
200
100
400
300
20082005 2006 2007
334.5 336.9 341.6
382.3(Billions of yen)
Revenue from Operations
(Years ended March 31)
0
40
20
60
20082005 2006 2007
35.2
44.7
57.8
2009
396.2
2009
48.649.2
(Billions of yen)
Operating Income
80029002Units Revenue Average unit price Units Revenue Average unit price
(Millions of yen) (Millions of yen) (Millions of yen) (Millions of yen)
Detached housing: Tokyo metropolitan area................ 534 ¥ 28,418 ¥53 630 ¥ 32,379 ¥51Other...................................................... 38 1,772 46 83 3,009 36Total....................................................... 572 ¥ 30,191 ¥53 713 ¥ 35,389 ¥50
Condominiums: Tokyo metropolitan area................ 4,372 ¥248,917 ¥57 4,133 ¥199,318 ¥48Other...................................................... 834 25,987 31 1,116 35,658 32Total....................................................... 5,206 ¥274,904 ¥53 5,249 ¥234,977 ¥45
Total housing sales: Tokyo metropolitan area................ 4,906 ¥277,335 ¥57 4,763 ¥231,697 ¥49Other...................................................... 872 27,759 32 1,199 38,667 32Total....................................................... 5,778 ¥305,095 ¥53 5,962 ¥270,364 ¥45
Other sales revenue ..................................................................... ¥ 91,143 ¥111,899
Total revenue .................................................................................. ¥396,239 ¥382,267
Operating income ......................................................................... ¥ 48,611 ¥ 57,810
Years ended March 31
Sales of Housing, Office Buildings and Land
Segment revenue increased 3.7 percent year on year, or ¥14.0
billion, to ¥396.2 billion. Total units of condominiums and detached
houses sold to individuals decreased by 184 to 5,778 units. Revenue
from sales of condominiums to individual customers increased 17.0
percent, or ¥39.9 billion, to ¥274.9 billion despite slightly lower
sales volume due to an increase in sales of high-value-added
condominiums, which raised average unit prices. The number of
units sold decreased to 5,206 from 5,249 in the previous fiscal year.
Sales of detached houses to individual customers decreased to 572
units from 713 units in the previous fiscal year. Other sales revenue,
comprising revenue from sales to investors of income-producing
properties developed by the Company, decreased 18.5 percent, or
¥20.8 billion, to ¥91.1 billion. As of March 31, 2009, Mitsui Fudosan
Residential Co., Ltd. had 919 units in completed inventories,
consisting of 826 condominium units and 93 detached houses, up
from 568 units a year earlier, which consisted of 453 condominium
units and 115 detached houses.
Segment operating income decreased 15.9 percent year on
year, or ¥9.2 billion, to ¥48.6 billion. Sales of properties to investors
decreased but remained profitable, and distributions from SPCs
following the sales of office buildings and other properties were
another factor that contributed to operating income. However,
segment operating income decreased because of loss on
devaluation of real property for sale totaling ¥15.9 billion, with
¥13.1 billion allocated to inventories for individuals and ¥2.7 billion
allocated to inventories for investors.

41
Management’s Discussion and Analysis
Segment revenue decreased 10.8 percent year on year, or
¥9.1 bi l l ion, to ¥75.2 bil l ion. Steady asset management
performance by Mitsui Fudosan Investment Advisors, Inc. and
Nippon Building Fund Management Ltd., which provides asset
management for private funds and J-REITs such as Nippon
Building Fund, underpinned revenue. Mitsui Fudosan also received
a substantial incentive fee during the fiscal year. In the brokerage
business, Group company Mitsui Real Estate Sales Co., Ltd.
provides brokerage services for individual and corporate clients.
With its nationwide network of Mitsui Rehouse brokerage offices,
Mitsui Real Estate Sales has the leading brokerage share in
Japan’s residential housing secondary market. Difficult market
conditions, particularly in the second half of the fiscal year,
caused both unit prices and transaction volume to decrease.
Moreover, transaction volume fell sharply in its corporate
brokerage business due to the impact of the financial crisis on the
real estate investment market.
Segment operating income decreased 31.8 percent year on
year, or ¥8.4 billion, to ¥18.2 billion. Earnings in this segment
benefited from stable fee income from asset, project and
investment fund management. However, the decrease in earnings
from the brokerage business impacted segment operating income
strongly. Mitsui Fudosan is currently restructuring the brokerage
business to position it for recovery.
(Years ended March 31)
0
30
90
60
20082005 2006 2007
60.268.7
77.384.3
(Billions of yen)
Revenue from Operations
(Years ended March 31)
0
15
10
5
30
25
20
20082005 2006 2007
18.6
22.6
26.0 26.6
2009
75.2
2009
18.2
(Billions of yen)
Operating Income
Years ended March 31
Segment revenue decreased 3.5 percent year on year, or ¥6.6
billion, to ¥182.1 billion. Mitsui Home Co., Ltd., a consolidated
subsidiary, handles operations in this segment. It is one of Japan’s
leading builders of two-by-four wood-frame homes, and
specializes in high-quality, upscale housing and the high-end of
the renovation market. The order backlog at the end of the fiscal
year and orders received during the fiscal year both decreased year
on year. However, segment operating income increased 43.7
percent year on year, or ¥0.8 billion, to ¥2.7 billion as a result of
enhanced productivity.
(Years ended March 31)
0
200
100
400
300
20082005 2006 2007
183.6 187.5 194.0 188.7
(Billions of yen)
Revenue from Operations
(Years ended March 31)
0
2
1
4
3
20082005 2006 2007
2.4 2.42.7
1.9
2009
182.1
2009
2.7
(Billions of yen)
Operating Income(Millions of yen)
Years ended March 31
Construction
Brokerage, Consignment Sales and Consulting
2009 2008
Orders: ...........................................Work-on-hand at beginning
of period.................................. ¥103,205 ¥110,841Orders during period .................. 172,156 187,441Total .......................................... ¥275,362 ¥298,282
Net sales ....................................... ¥186,269 ¥194,219
Work-on-hand at end of period .. ¥ 89,093 ¥104,062
Total revenue ............................... ¥182,074 ¥188,659
Operating income ........................ ¥ 2,731 ¥ 1,900
Note: Consolidated results of Mitsui Home Co., Ltd.
2009 2008Units Revenue Units Revenue
(Millions of yen) (Millions of yen)
Revenue:Brokerage .................. 30,338 ¥52,799 31,757 ¥62,097Consignment sales..... 3,143 7,000 5,358 10,067Consulting ................. — 15,394 — 12,104
Total revenue ............. ¥75,195 ¥84,269
Operating income ...... ¥18,151 ¥26,595

42
Segment revenue decreased 5.3 percent year on year, or ¥3.9
billion, to ¥69.1 billion. Factors included lower revenues at Mitsui
Designtec Co., Ltd. and the impact on revenues from the decision
by LaLaport Management Co., Ltd. to discontinue sales of certain
unprofitable products. Segment operating income increased 21.6
percent year on year, or ¥0.3 billion, to ¥1.4 billion. (Years ended March 31)
0
40
20
80
60
20082005 2006 2007
65.2 65.169.4
73.0
(Billions of yen)
Revenue from Operations
(Years ended March 31)
0
0.5
1.5
1.0
20082005 2006 2007
0.2
0.80.9
1.2
2009
69.1
2009
1.4(Billions of yen)
Operating Income
2009 2008
Revenue: Property management...... ¥ 77,151 ¥ 73,141Tenant improvement ...... 25,339 29,322
Total revenue............................... ¥102,491 ¥102,464
Operating income ........................ ¥ 15,574 ¥ 15,497
(Millions of yen)
Segment revenue increased marginally year on year to ¥102.5
billion. The contribution of new Group-managed properties such
as Mitsui Outlet Park Iruma (Iruma, Saitama) supported stable
performance in this segment despite a turbulent externa l
environment. However, the absence of substantial fees from a
program to add tenants at Tokyo Midtown that supported results
in the previous fiscal year blunted revenue growth. The Property
Management segment is strategic because it allows Mitsui
Fudosan to generate fee-based revenue and earnings to
complement revenue derived from asset growth in other
businesses. The Mitsui Fudosan Group provides office
management services primarily through Group companies Mitsui
Fudosan Building Management Co., Ltd. and First Facilities Co.,
Ltd. Other Group companies involved in property management
include Mitsui Fudosan Housing Services Co., Ltd., which manages
condominiums developed by Mitsui Fudosan Residential, and
LaLaport Management Co., Ltd., which manages retail facilities.
Segment operating income increased marginally year on year
to ¥15.6 billion. Earnings drew stable support from management
of office buildings, retail facilities and other properties completed
in the previous fiscal year.
(Years ended March 31)
0
40
120
80
20082005 2006 2007
78.2
90.4
102.599.6
(Billions of yen)
Revenue from Operations
(Years ended March 31)
0
10
5
20
15
20082005 2006 2007
10.812.7
14.315.5
2009
102.5
2009
15.6
(Billions of yen)
Operating IncomeYears ended March 31
2009 2008
Revenue: Housing materials............ ¥24,791 ¥25,496Merchandise.................. 44,322 47,478
Total revenue............................... ¥69,115 ¥72,975
Operating income ........................ ¥ 1,423 ¥ 1,170
(Millions of yen)
Years ended March 31
Property Management
Sales of Housing Materials and Merchandise

43
Management’s Discussion and Analysis
Segment revenue increased 5.2 percent year on year, or ¥2.6
billion, to ¥52.3 billion. Factors increasing revenue included the
full-year contribution of two hotels completed during the previous
fiscal year — Mitsui Garden Hotel Shiodome Italia-gai (Minato-ku,
Tokyo) and Mitsui Garden Hotel Prana Tokyo Bay (Urayasu, Chiba)
— and the full-year contribution of four resort facilities acquired
during the previous fiscal year, including Nemunosato (Shima,
Mie). Segment operating loss totaled ¥0.8 billion compared to
segment operating income of ¥0.3 billion for the previous fiscal
year, as unfavorable economic conditions reduced occupancy rates
at the segment’s hotels and resort facilities.
(Years ended March 31)
0
30
15
60
45
20082005 2006 2007
38.5 39.0 40.2
49.7
(Billions of yen)
Revenue from Operations
(Years ended March 31)
0
3.0
2.0
20082005 2006 2007
1.4
1.9 1.8
0.3
2009
52.3
2009
(0.8)
(Billions of yen)
Operating Income (Loss)
1.0
-1.0
Segment revenue increased 10.5 percent year on year, or ¥1.1
billion, to ¥11.8 billion. Segment operating income increased 18.1
percent year on year, or ¥0.7 billion, to ¥4.6 billion.
(Years ended March 31)
0
10
5
20
15
20082005 2006 2007
7.4 7.3
10.68.9
(Billions of yen)
Revenue from Operations
(Years ended March 31)
0
2.0
1.0
5.0
3.0
20082005 2006 2007
1.8
2.52.8
3.9
2009
11.8
2009
4.6(Billions of yen)
Operating Income
4.0
2009 2008
Revenue: Hotels ............................ ¥40,029 ¥37,499Other............................. 12,288 12,245
Total revenue............................... ¥52,318 ¥49,745
Operating income ........................ ¥ (792) ¥ 269
(Millions of yen)
Years ended March 31
2009 2008
Revenue: Finance and lease ............ ¥ 1,595 ¥ 1,362Other............................. 10,161 9,281
Total revenue............................... ¥11,758 ¥10,644
Operating income ........................ ¥ 4,611 ¥ 3,904
(Millions of yen)
Years ended March 31
Facility Operations
Other

44
Liquidity, Capital Resources and Financial Position
Liabilities and Net Assets(Billions of yen, %)
As of March 31 2009 2008 2007
Interest-bearing debt—Short term.............................................................. ¥ 226.2 6.0% ¥ 263.2 7.2% ¥ 242.8 7.4%
Interest-bearing debt—Long term .............................................................. 1,507.3 40.1 1,287.2 35.4 1,015.7 30.8
Total interest-bearing debt ....................................................................... 1,733.5 46.1 1,550.4 42.7 1,258.5 38.2
Other current liabilities1 ................................................................................... 398.3 10.6 453.9 12.5 443.1 13.5
Other long-term liabilities2 ............................................................................. 626.7 16.7 638.2 17.6 629.4 19.1
Minority interests................................................................................................ 21.0 0.6 20.6 0.6 19.0 0.5
Net assets (other than minority interests) ................................................ 978.9 26.0 971.4 26.7 944.2 28.7
Total......................................................................................................................... ¥3,758.4 100.0% ¥3,634.5 100.0% ¥3,294.2 100.0%
Notes: 1. Consists of current liabilities other than bank loans, commercial paper and long-term debt due within one year presented on the balance sheets.2. Consists of long-term liabilities other than long-term debt due after one year presented on the balance sheets.
Assets(Billions of yen, %)
As of March 31 2009 2008 2007
Cash and cash equivalents ............................................................................. ¥ 62.9 1.7% ¥ 63.5 1.8% ¥ 81.8 2.5%
Inventories............................................................................................................. 773.9 20.6 662.3 18.2 541.2 16.4
Other current assets .......................................................................................... 290.7 7.7 290.4 8.0 333.9 10.1
Investments and other assets ........................................................................ 596.6 15.9 669.3 18.4 628.7 19.1
Net property and equipment.......................................................................... 2,034.3 54.1 1,949.0 53.6 1,708.6 51.9
Total......................................................................................................................... ¥3,758.4 100.0% ¥3,634.5 100.0% ¥3,294.2 100.0%
Fudosan decreased investment in SPCs and other vehicles for
distributing properties to external investors. Working capital
increased 68.1 percent from a year earlier to ¥503.0 billion, and the
current ratio was 1.81 times, compared with 1.42 times at the end
of the previous fiscal year.
Investments and Other AssetsInvestments and other assets decreased 10.9 percent from a year
earlier, or ¥72.7 billion, to ¥596.6 billion. Investment securities
decreased 20.9 percent, or ¥44.6 billion, to ¥168.5 billion, reflecting
a decrease in net purchases of investment securities, recognition of
impairment and a decrease in the market value of securities holdings
during the fiscal year.
Current AssetsCurrent assets increased 11.0 percent from the previous fiscal
year-end, or ¥111.3 billion, to ¥1,127.5 billion. Cash and cash
equivalents decreased 1.0 percent, or ¥0.6 billion, from a year earlier
to ¥62.9 billion, with the addition of cash from operations and
financing to the balance sheet compensating for the use of cash to
fund inventories and other operating activities. Inventories increased
16.9 percent from a year earlier, or ¥111.6 billion, to ¥773.9 billion.
Factors included acquisition of land for housing by Mitsui Fudosan
Residential. New acquisitions of real property for sale exceeded cost
recovery through property sales. Equity investments in properties for
sale, which primarily represent securitized interests in properties for
sale, decreased 7.6 percent, or ¥7.4 billion, to ¥89.8 billion as Mitsui

45
Property and EquipmentNet property and equipment increased 4.4 percent from a year
earlier, or ¥85.2 billion, to ¥2,034.3 billion. Capital expenditures
totaled ¥165.0 billion, which was offset by depreciation totaling
¥48.9 billion and disposal and sale of properties by the parent
company and subsidiaries totaling ¥30.2 billion. Capital expenditures
decreased 51.5 percent, or ¥175.4 billion, year on year.
Current LiabilitiesCurrent liabilities decreased 12.9 percent from a year earlier, or
¥92.5 billion, to ¥624.5 billion. Mitsui Fudosan has established
committed lines of credit totaling ¥150.0 billion with several
financial institutions to ensure access to funds and adequate
liquidity. The Company had not accessed these lines of credit as of
the balance sheet date.
Long-term LiabilitiesLong-term liabilities increased 10.8 percent from a year earlier,
or ¥208.5 billion, to ¥2,134.0 billion. Long-term debt due after one
year increased 17.1 percent from a year earlier, or ¥220.1 billion, to
¥1,507.3 billion, as Mitsui Fudosan accessed external funding to
ensure liquidity while investing in opportunities for growth. Interest-
bearing debt increased 11.8 percent, or ¥183.1 billion, to ¥1,733.5
billion. Mitsui Fudosan also raised ¥10.0 billion through the issue of
1.92 percent yen notes due 2018.
Net Assets and Total CapitalFor fiscal 2008, net assets increased 0.8 percent from a year
earlier, or ¥7.9 billion, to ¥999.9 billion. Retained earnings increased
19.2 percent, or ¥53.6 billion, to ¥332.3 billion as a result of net
income. Moreover, reserve on land revaluation, which is recorded as
a component of net assets under Japanese GAAP, increased by ¥5.3
billion, reflecting additions to land held in inventory. Lower financial
asset prices during the fiscal year decreased net assets through a
reduction in net unrealized holding gains on securities to ¥1.8
billion, which is recorded as a component of net assets under
Japanese GAAP. Negative foreign currency translation adjustment
resulting from the yen’s value relative to the U.S. dollar and the
British pound at the fiscal year-end decreased net assets by ¥35.7
billion. Total capital, the sum of bank loans, commercial paper, long-
term debt due within one year, long-term debt due after one year,
and net assets, increased ¥191.0 billion to ¥2,733.4 billion from
¥2,542.4 billion a year earlier. The use of interest-bearing debt to
support growth outpaced additions to net assets. Consequently, net
assets represented 36.6 percent of total capital, compared to 39.0
percent at the previous fiscal year-end. The debt / equity ratio1
increased to 1.77 times from 1.60 times as a result. Return on assets
(ROA)2 was 5.06 percent, compared with 5.53 percent a year earlier.
Return on equity (ROE)3 was 8.57 percent, compared to 9.12 percent
a year earlier.
(Years ended March 31)
0
4.0
3.0
2.0
1.0
6.0
5.0
20082005 2006 2007
4.30
4.925.50 5.53
(%)
ROA
(As of March 31)
0
1,200
800
400
2,000
1,600
20082005 2006 2007
1,279.11,199.3 1,258.5
1,550.4
2009
5.06
2009
1,733.5
(Billions of yen)
Interest-Bearing Debt
Net Assets (Other than Minority Interests)
Equity Ratio
(As of March 31)
0
800
600
400
200
1,200
1,000
20082005 2006 2007
687.7
858.4944.223.5
28.7 28.7
971.426.7
(Billions of yen)
Net Assets (Other than Minority Interests)and Equity Ratio
0
20
10
30
(%)
2009
978.926.0
Management’s Discussion and Analysis
(As of March 31)
0
2,000
1,000
4,000
3,000
20082005 2006 2007
2,928.2 2,986.53,294.2
3,634.5
2009
3,758.4(Billions of yen)
Total Assets
Notes: 1. Notes:Debt /equity ratio = Interest-bearing debt / (Net assets - Subscription rights to shares - Minority interests)2. Return on assets (ROA) = (Operating income + Non-operating income) / Average total assets over the period3. Return on equity (ROE) = Net income / (Net assets - Subscription rights to shares - Minority interests, Average over the period)

46
Cash Flows Net cash used in investing activities totaled ¥141.6 billion,
compared to ¥392.2 billion for the previous fiscal year. Mitsui
Fudosan is carefully controlling asset growth given the currently
turbulent environment. Purchases of property and equipment
totaled ¥153.0 billion, compared to ¥346.8 billion for the previous
fiscal year. This included outlays associated with the Chiyoda Fujimi
2-chome Project and other new investments in redevelopment
projects that are highly likely to generate profitable growth in the
future. Net changes in deposits from tenants and in lease deposits
provided cash totaling ¥28.5 billion, compared to ¥23.7 billion for
the previous fisca l year. Net purchases of marketable and
investment securities totaled ¥31.7 billion, down sharply from
¥124.9 billion for the previous fiscal year absent the impact of the
acquisition of equity in Imperial Hotel, Ltd. Net cash provided by
(As of March 31)
0
2.0
1.0
4.0
3.0
20082005 2006 2007
1.86
1.40 1.331.60
(Times)
Debt/Equity Ratio
(Years ended March 31)
0
50
-50
150
100
20082005 2006 2007
100.1
22.5
58.0
97.8
(Billions of yen)
Cash Flows from Operating Activities
(Years ended March 31)
-400
0
-100
-200
-300
200
100
2008 20092005 2006 2007
23.3 (38.3) (19.0) (294.4)
(Billions of yen)
Free Cash Flow
2009
1.77
2009
(41.0)
(182.6)
Cash Flows(Billions of yen)
Years ended March 31 2009 2008 2007
Cash flows from operating activities ............................................................ ¥ (41.0) ¥ 97.8 ¥ 58.0
Cash flows from investing activities ............................................................. (141.6) (392.2) (77.0)
Cash flows from financing activities ............................................................. 182.2 276.1 38.1
Effect of exchange rate changes on cash and cash equivalents ........ (0.2) 0.1 0.2( )
Net (decrease) increase in cash and cash equivalents ........................... (0.6) (18.3) 19.2
Cash and cash equivalents at beginning of year ..................................... 63.5 81.8 62.6
Cash and cash equivalents at end of year .................................................. ¥ 62.9 ¥ 63.5 ¥ 81.8
Net cash used in operating activities totaled ¥41.0 billion. In the
previous fiscal year, operating activities provided net cash totaling
¥97.8 billion. A key factor in the year-on-year change was the return
of deposits for properties sold on consignment to Mitsui Fudosan
Residential, included in the line item “Other, net.” The line item
“Increase in real property for sale and advances paid for purchases”
represents the net effect of cost recovery and purchase of inventories,
which consist primarily of property held for sale. Net increase in
inventories used cash totaling ¥125.8 billion, up from ¥100.4 billion
in the previous fiscal year. Income taxes paid also increased substan-
tially. Depreciation and amortization increased to ¥48.9 billion.

47
Management’s Discussion and Analysis
financing activities totaled ¥182.2 billion, compared with ¥276.1
billion in the previous fiscal year. Decrease in bank loans and
commercial paper totaled ¥45.2 billion, compared with an increase
of ¥28.9 billion for the previous fiscal year, reflecting a shift toward
longer-term maturities in funding operations. Proceeds from long-
term debt totaled ¥389.5 billion, up from ¥369.4 billion for the
previous fiscal year, in part because Mitsui Fudosan moved to
enhance liquidity to insulate against the financial turmoil in the
second half of the fiscal year. Repayments of long-term debt,
consisting primarily of long-term bank loans, totaled ¥119.4 billion,
compared to ¥154.7 billion for the previous fiscal year. Proceeds
from issuance of bond totaling ¥10.0 billion represented the
domestic issue of 1.92 percent yen notes due 2018, while payments
for redemption of bond totaled ¥30.0 billion. Net proceeds from
long-term debt and bonds therefore totaled ¥250.1 billion on a
cash basis. Mitsui Fudosan maintains a conservative level of
operating leverage and has become increasingly selective in
investing for future growth. Cash dividends paid totaled ¥19.3
billion, compared to ¥15.8 billion for the previous fiscal year as a
result of increased cash dividends per share for fiscal 2008.
Risk InformationThe operations of the Mitsui Fudosan Group are subject to a
number of risks, some of which are outlined below along with issues
that may not necessarily constitute risk factors but that may
influence investor decisions.
Changes in DemandEconomic conditions influence demand among tenant
companies for space in the office buildings that the Mitsui Fudosan
Group owns and manages, and influence demand among individuals
for housing. A downturn in the Japanese economy may exert a
material impact on the Mitsui Fudosan Group's performance and the
value of its assets.
Interest RatesHigher interest rates in the future could increase the Mitsui
Fudosan Group's funding costs, raise the returns investors expect
from real estate investments and reduce demand among individuals
for housing, and may therefore exert a material impact on the Mitsui
Fudosan Group's performance and the value of its assets.
Regulations and TaxationChanges in the regulations and systems of taxation relevant to
the real estate business may exert a material impact on the Mitsui
Fudosan Group's performance and the value of its assets.
Natural DisastersNatural disasters may damage or destroy the Mitsui Fudosan
Group's assets, and may therefore exert a material impact on the
Mitsui Fudosan Group's performance and the value of its assets.

Consolidated Balance SheetsMitsui Fudosan Co., Ltd. and its SubsidiariesAs of March 31, 2009 and 2008
Thousands of )1 etoN( srallod .S.Uney fo snoilliM
2009 2008 2009
ASSETS
CURRENT ASSETSCash and cash equivalents ................................................................................................... ¥ 62,892 ¥ 63,496 $ 640,252Marketable securities (Note 4) ........................................................................................... 126 95 1,283Notes and accounts receivable — trade.......................................................................... 31,451 34,593 320,177Short-term loans receivable ................................................................................................. 8,949 8,170 91,103Allowance for doubtful accounts ....................................................................................... (2,331) (569) (23,730)Inventories (Note 6) ................................................................................................................ 773,861 662,259 7,878,052Advances paid for purchases (Note 7) ............................................................................. 2,859 16,927 29,105Equity investments in properties for sale (Note 4) ..................................................... 89,776 97,152 913,937Deferred income taxes (Note 9) ......................................................................................... 53,160 60,059 541,179Other current assets ................................................................................................................ 106,730 73,946 1,086,531
Total current assets ............................................................................................................ 1,127,473 1,016,128 11,477,889
INVESTMENTS and OTHER ASSETSInvestments in unconsolidated subsidiaries and affiliated companies ............... 174,995 177,249 1,781,482Investment securities (Note 4) ............................................................................................ 168,529 213,169 1,715,657Non-current loans and accounts receivable .................................................................. 49,490 53,745 503,818Allowance for doubtful accounts ........................................................................................ (8,522) (7,733) (86,756)Lease deposits (Note 8) .......................................................................................................... 180,870 196,789 1,841,291Deferred income taxes (Note 9) ......................................................................................... 15,557 15,023 158,373Deferred tax assets on land revaluation .......................................................................... 2,280 8,308 23,211Other ............................................................................................................................................. 13,426 12,763 136,679
Total investments and other assets.............................................................................. 596,625 669,313 6,073,755
PROPERTY and EQUIPMENT, at cost:Land (Note 11)............................................................................................................................ 1,456,961 1,380,935 14,832,139Buildings and structures (Note 11)..................................................................................... 954,988 931,509 9,721,959Machinery and equipment ................................................................................................... 99,334 92,553 1,011,239Construction in progress ....................................................................................................... 18,366 13,839 186,969
2,529,649 2,418,836 25,752,306Accumulated depreciation .................................................................................................... (495,360) (469,788) (5,042,859)
Net property and equipment ......................................................................................... 2,034,289 1,949,048 20,709,447
¥3,758,387 ¥3,634,489 $38,261,091
See accompanying notes.
48

Thousands of )1 etoN( srallod .S.Uney fo snoilliM
2009 2008 2009
LIABILITIES AND NET ASSETS
CURRENT LIABILITIESBanks loans (Note 11) ............................................................................................................ ¥ 55,367 ¥ 63,820 $ 563,647Commercial paper (Note 11) ............................................................................................... 13,000 53,000 132,342Long-term debt due within one year (Note 11) ........................................................... 157,847 146,354 1,606,912Notes and accounts payable — trade ............................................................................. 125,037 110,943 1,272,900Accrued expenses .................................................................................................................... 21,613 25,661 220,024Income taxes payable ............................................................................................................. 17,756 35,633 180,759Advances and deposits received ........................................................................................ 179,987 232,078 1,832,302Deferred income taxes (Note 9) ......................................................................................... 697 921 7,096Other current liabilities .......................................................................................................... 53,214 48,595 541,729
Total current liabilities ..................................................................................................... 624,518 717,005 6,357,711
LONG-TERM LIABILITIESAllowance for employees’ retirement benefits (Note 10) ......................................... 29,484 28,034 300,153Allowance for directors’ and corporate auditors’ retirement benefits ................ 1,494 1,468 15,209Long-term debt due after one year (Note 11) .............................................................. 1,507,345 1,287,247 15,345,058Deposits from tenants (Note 12) ....................................................................................... 370,694 356,612 3,773,735Deferred income taxes (Note 9) ......................................................................................... 3,129 30,310 31,854Deferred tax liabilities on land revaluation..................................................................... 185,317 186,189 1,886,562Other long-term liabilities...................................................................................................... 36,546 35,621 372,045
Total long-term liabilities ................................................................................................. 2,134,009 1,925,481 21,724,616
CONTINGENT LIABILITIES (Note 21)
NET ASSETS (Notes 13 and 14)Shareholders’ equity
Common stock............................................................................................................................ 174,296 174,296 1,774,366
Authorized— 3,290,000,000 shares
Issued— 881,424,727 shares in 2009 and 2008
Capital surplus .......................................................................................................................... 248,332 248,329 2,528,067
Retained earnings .................................................................................................................... 332,334 278,749 3,383,223
Treasury stock ............................................................................................................................ (5,003) (4,334) (50,931)
Total shareholders’ equity................................................................................................ 749,959 697,040 7,634,725
Valuation and translation adjustments ..................................................................................
Net unrealized holding gains on securities .................................................................... 1,793 32,576 18,253
Net unrealized losses on hedging derivatives .............................................................. (459) (106) (4,673)
Reserve on land revaluation ................................................................................................. 263,063 257,728 2,678,031
Foreign currency translation adjustments ....................................................................... (35,689) (15,928) (363,321)
Total valuation and translation adjustments ........................................................... 228,708 274,270 2,328,290
Subscription rights to shares (Note 15) ................................................................................. 220 86 2,240Minority interests ............................................................................................................................ 20,973 20,607 213,509
Total net assets ..................................................................................................................... 999,860 992,003 10,178,764
¥3,758,387 ¥3,634,489 $38,261,091
See accompanying notes.
49

50
Consolidated Statements of IncomeMitsui Fudosan Co., Ltd. and its SubsidiariesFor the years ended March 31, 2009, 2008 and 2007
Thousands of )1 etoN( srallod .S.Uney fo snoilliM
2009 2008 2007 2009
REVENUESRevenue from operations (Note 20) .............................................................. ¥1,418,946 ¥1,360,023 ¥1,229,194 $14,445,139Interest, dividends and miscellaneous (Note 16) ..................................... 9,389 27,509 23,946 95,582
1,428,335 1,387,532 1,253,140 14,540,721
COSTS AND EXPENSESCost of revenue from operations .................................................................... 1,098,425 1,039,342 942,928 11,182,175Selling, general and administrative expenses ........................................... 148,973 141,398 124,423 1,516,573Interest ...................................................................................................................... 29,768 26,031 21,421 303,044Other (Note 17)...................................................................................................... 41,168 32,758 52,758 419,098
1,318,334 1,239,529 1,141,530 13,420,890
EQUITY IN NET INCOME OF AFFILIATED COMPANIES ............................... 5,980 7,064 4,410 60,878
INCOME BEFORE INCOME TAXES AND MINORITY INTERESTS ............... 115,981 155,067 116,020 1,180,709
INCOME TAXES (Note 9)Current ...................................................................................................................... 24,785 48,638 26,044 252,316Deferred .................................................................................................................... 6,059 17,611 12,954 61,682
Total...................................................................................................................... 30,844 66,249 38,998 313,998
NET INCOME BEFORE MINORITY INTERESTS.................................................. 85,137 88,818 77,022 866,711
MINORITY INTERESTS .............................................................................................. (1,565) (1,440) (1,808) (15,932)
NET INCOME ............................................................................................................... ¥ 83,572 ¥ 87,378 ¥ 75,214 $ 850,779
)1 etoN( srallod .S.UneY
PER SHARE INFORMATION 2009 2008 2007 2009
Net assets per share*.......................................................................................... ¥ 1,113.9 ¥ 1,105.1 ¥ 1,073.8 $ 11.340Net income per share— Basic .................................................................................................................... 95.1 99.4 85.5 0.968— Diluted ................................................................................................................ 95.1 99.4 — 0.968Cash dividends ....................................................................................................... 22.0 20.0 14.0 0.224
* Net assets per share information does not include minority interests.
See accompanying notes.

51
Consolidated Statements of Changes in Net AssetsMitsui Fudosan Co., Ltd. and its SubsidiariesFor the years ended March 31, 2009, 2008 and 2007
Millions of yen
stnemtsujda noitalsnart dna noitaulaVytiuqe ’sredloherahS
Net Netunrealized unrealized Foreign
noitpircsbuSycnerrucevreseR)sessol( sniagsniag gnidlohfo serahScommon stock Common Capital Retained Treasury (losses) on on hedging on land translation rights to Minority Total net
(thousands) stock surplus earnings stock securities derivatives revaluation adjustment shares interests assets
BALANCE AT MARCH 31, 2006............................ 881,425 ¥174,296 ¥248,295 ¥199,706 ¥(2,147) ¥ 63,425 ¥ — ¥191,097 ¥(16,308) ¥ — ¥18,447 ¥876,811Cash dividends paid (*1) .............................................. — — — (8,796) — — — — — — — (8,796)Bonuses to directors (*2).............................................. — — — (176) — — — — — — — (176)Net income ............................................................... — — — 75,214 — — — — — — — 75,214Reversal of reserve on land revaluation, net of tax....... — — — (49,719) — — — 56,167 — — — 6,448Revaluation of property and equipment (Note 2 (H)).... — — — 2,454 — — — — — — — 2,454Purchase of treasury stock ......................................... — — — — (996) — — — — — — (996)Sales of treasury stock ............................................... — — 13 — 17 — — — — — — 30Net unrealized holding gains on securities..................... — — — — — 8,735 — — — — — 8,735Net unrealized gains (losses) on hedging derivatives.... — — — — — — 54 — — — — 54Foreign currency translation adjustment ..................... — — — — — — — — 2,865 — — 2,865Minority interests....................................................... — — — — — — — — — — 571 571
BALANCE AT MARCH 31, 2007............................ 881,425 174,296 248,308 218,683 (3,126) 72,160 54 247,264 (13,443) — 19,018 963,214Cash dividends paid................................................... — — — (15,825) — — — — — — — (15,825)Net income ............................................................... — — — 87,378 — — — — — — — 87,378Reversal of reserve on land revaluation, net of tax....... — — — (9,780) — — — 10,464 — — — 684Revaluation of property and equipment (Note 2 (H)) .... — — — (1,778) — — — — — — — (1,778)Decrease in number of affiliated companies ............... — — — 71 — — — — — — — 71Purchase of treasury stock ......................................... — — — — (1,239) — — — — — — (1,239)Sales of treasury stock ............................................... — — 21 — 31 — — — — — — 52Net unrealized holding gains on securities..................... — — — — — (39,584) — — — — — (39,584)Net unrealized gains (losses) on hedging derivatives.... — — — — — — (160) — — — — (160)Foreign currency translation adjustment ..................... — — — — — — — — (2,485) — — (2,485)Subscription rights to shares ...................................... — — — — — — — — — 86 — 86Minority interests....................................................... — — — — — — — — — — 1,589 1,589
BALANCE AT MARCH 31, 2008................................. 881,425 174,296 248,329 278,749 (4,334) 32,576 (106) 257,728 (15,928) 86 20,607 992,003Prior-period adjustments due to adoption of
new accounting standard (Note 2 (H))....................... — — — (5,338) — — — — — — — (5,338)Cash dividends paid................................................... — — — (19,335) — — — — — — — (19,335)Net income ............................................................... — — — 83,572 — — — — — — — 83,572Reversal of reserve on land revaluation, net of tax....... — — — (5,313) — — — 5,335 — — — 22Purchase of treasury stock ......................................... — — — — (851) — — — — — — (851)Sales of treasury stock ............................................... — — 3 — 182 — — — — — — 185Net unrealized holding gains on securities..................... — — — — — (30,783) — — — — — (30,783)Net unrealized gains (losses) on hedging derivatives.... — — — — — — (353) — — — — (353)Foreign currency translation adjustment ..................... — — — — — — — — (19,761) — — (19,761)Subscription rights to shares ...................................... — — — — — — — — — 134 — 134Minority interests....................................................... — — — — — — — — — — 366 366Other ........................................................................ — — — (1) — — — — — — — (1)
BALANCE AT MARCH 31, 2009................................. 881,425 ¥174,296 ¥248,332 ¥332,334 ¥(5,003) ¥ 1,793 ¥(459) ¥263,063 ¥(35,689) ¥220 ¥20,973 ¥999,860
Thousands of U.S. dollars (Note 1)
BALANCE AT MARCH 31, 2008................................................ $1,774,366 $2,528,036 $2,837,718 $(44,121) $ 331,630 $(1,079) $2,623,720 $(162,150) $ 875 $209,783 $10,098,778Prior-period adjustments due to adoption of
new accounting standard (Note 2 (H)).............................................. — — (54,342) — — — — — — — (54,342)Cash dividends paid....................................................................... — — (196,834) — — — — — — — (196,834)Net income ................................................................................... — — 850,779 — — — — — — — 850,779Reversal of reserve on land revaluation, net of tax........................... — — (54,088) — — — 54,311 — — — 223Purchase of treasury stock ............................................................. — — — (8,663) — — — — — — (8,663)Sales of treasury stock ................................................................... — 31 — 1,853 — — — — — — 1,884Net unrealized holding gains on securities....................................... — — — — (313,377) — — — — — (313,377)Net unrealized gains (losses) on hedging derivatives........................ — — — — — (3,594) — — — — (3,594)Foreign currency translation adjustment ......................................... — — — — — — — (201,171) — — (201,171)Subscription rights to shares .......................................................... — — — — — — — — 1,365 — 1,365Minority interests .......................................................................... — — — — — — — — — 3,726 3,726Other............................................................................................ — — (10) — — — — — — — (10)
BALANCE AT MARCH 31, 2009................................................ $1,774,366 $2,528,067 $3,383,223 $(50,931) $ 18,253 $(4,673) $2,678,031 $(363,321) $2,240 $213,509 $10,178,764
(*1) Includes appropriation of retained earnings of ¥4,398 million approved at the Ordinary General Shareholders’ Meeting held on June 29, 2006.(*2) Appropriation of retained earnings approved at the Ordinary General Shareholders’ Meeting held on June 29, 2006.
See accompanying notes.
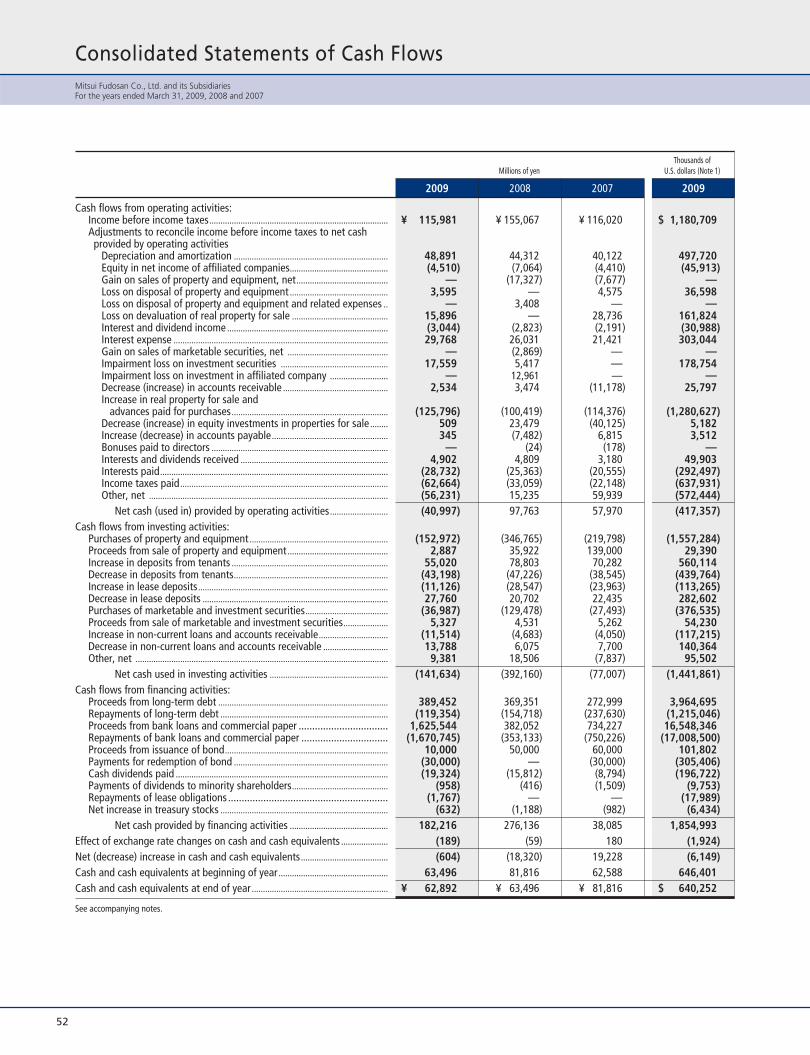
52
Consolidated Statements of Cash FlowsMitsui Fudosan Co., Ltd. and its SubsidiariesFor the years ended March 31, 2009, 2008 and 2007
Thousands of)1 etoN( srallod .S.Uney fo snoilliM
2009 2008 2007 2009
Cash flows from operating activities:Income before income taxes................................................................................ ¥ 115,981 ¥ 155,067 ¥ 116,020 $ 1,180,709 Adjustments to reconcile income before income taxes to net cash
provided by operating activitiesDepreciation and amortization ..................................................................... 48,891 44,312 40,122 497,720 Equity in net income of affiliated companies............................................ (4,510) (7,064) (4,410) (45,913)Gain on sales of property and equipment, net......................................... — (17,327) (7,677) —Loss on disposal of property and equipment ............................................ 3,595 — 4,575 36,598 Loss on disposal of property and equipment and related expenses .. — 3,408 — — Loss on devaluation of real property for sale ........................................... 15,896 — 28,736 161,824 Interest and dividend income ........................................................................ (3,044) (2,823) (2,191) (30,988)Interest expense ................................................................................................ 29,768 26,031 21,421 303,044 Gain on sales of marketable securities, net ............................................. — (2,869) — — Impairment loss on investment securities ................................................ 17,559 5,417 — 178,754 Impairment loss on investment in affiliated company .......................... — 12,961 — — Decrease (increase) in accounts receivable ............................................... 2,534 3,474 (11,178) 25,797 Increase in real property for sale and
advances paid for purchases...................................................................... (125,796) (100,419) (114,376) (1,280,627)Decrease (increase) in equity investments in properties for sale ........ 509 23,479 (40,125) 5,182 Increase (decrease) in accounts payable.................................................... 345 (7,482) 6,815 3,512 Bonuses paid to directors ............................................................................... — (24) (178) — Interests and dividends received .................................................................. 4,902 4,809 3,180 49,903 Interests paid...................................................................................................... (28,732) (25,363) (20,555) (292,497)Income taxes paid............................................................................................. (62,664) (33,059) (22,148) (637,931)Other, net ........................................................................................................... (56,231) 15,235 59,939 (572,444)
Net cash (used in) provided by operating activities.......................... (40,997) 97,763 57,970 (417,357)Cash flows from investing activities:
Purchases of property and equipment .............................................................. (152,972) (346,765) (219,798) (1,557,284)Proceeds from sale of property and equipment ............................................. 2,887 35,922 139,000 29,390 Increase in deposits from tenants ...................................................................... 55,020 78,803 70,282 560,114 Decrease in deposits from tenants..................................................................... (43,198) (47,226) (38,545) (439,764)Increase in lease deposits..................................................................................... (11,126) (28,547) (23,963) (113,265)Decrease in lease deposits ................................................................................... 27,760 20,702 22,435 282,602 Purchases of marketable and investment securities..................................... (36,987) (129,478) (27,493) (376,535)Proceeds from sale of marketable and investment securities.................... 5,327 4,531 5,262 54,230 Increase in non-current loans and accounts receivable............................... (11,514) (4,683) (4,050) (117,215)Decrease in non-current loans and accounts receivable ............................. 13,788 6,075 7,700 140,364 Other, net ................................................................................................................. 9,381 18,506 (7,837) 95,502
Net cash used in investing activities ..................................................... (141,634) (392,160) (77,007) (1,441,861)Cash flows from financing activities:
Proceeds from long-term debt ............................................................................ 389,452 369,351 272,999 3,964,695 Repayments of long-term debt ........................................................................... (119,354) (154,718) (237,630) (1,215,046)Proceeds from bank loans and commercial paper ................................. 1,625,544 382,052 734,227 16,548,346 Repayments of bank loans and commercial paper ................................ (1,670,745) (353,133) (750,226) (17,008,500)Proceeds from issuance of bond......................................................................... 10,000 50,000 60,000 101,802 Payments for redemption of bond ..................................................................... (30,000) — (30,000) (305,406)Cash dividends paid ............................................................................................... (19,324) (15,812) (8,794) (196,722)Payments of dividends to minority shareholders........................................... (958) (416) (1,509) (9,753)Repayments of lease obligations ........................................................... (1,767) — — (17,989)Net increase in treasury stocks ........................................................................... (632) (1,188) (982) (6,434)
Net cash provided by financing activities ............................................ 182,216 276,136 38,085 1,854,993 Effect of exchange rate changes on cash and cash equivalents ..................... (189) (59) 180 (1,924)Net (decrease) increase in cash and cash equivalents....................................... (604) (18,320) 19,228 (6,149)Cash and cash equivalents at beginning of year ................................................. 63,496 81,816 62,588 646,401 Cash and cash equivalents at end of year ............................................................. ¥ 62,892 ¥ 63,496 ¥ 81,816 $ 640,252
See accompanying notes.

53
Notes to Consolidated Financial StatementsMitsui Fudosan Co., Ltd. and its Subsidiaries
BASIS OF PRESENTING CONSOLIDATED FINANCIAL STATEMENTS
SIGNIFICANT ACCOUNTING POLICIES
1
2
The accompanying consolidated financial statements of Mitsui Fudosan Co.,Ltd. (the “Company”) have been prepared in accordance with the provisionsset forth in the Japanese Financial Instruments and Exchange Law and itsrelated accounting regulations, and in conformity with accounting principlesgenerally accepted in Japan (“Japanese GAAP”), which are different in certainrespects as to application and disclosure requirements of InternationalFinancial Reporting Standards.
The accounts of overseas subsidiaries are based on their accountingrecords maintained in conformity with generally accepted accountingprinciples prevailing in the respective countries of domicile. Theaccompanying consolidated financial statements have been restructured andtranslated into English (with some expanded descriptions) from theconsolidated financial statements of the Company prepared in accordance
with Japanese GAAP and filed with the appropriate Local Finance Bureau ofthe Ministry of Finance as required by the Financial Instruments andExchange Law. Some supplementary information included in the statutoryJapanese language consolidated financial statements, but not required forfair presentation, is not presented in the accompanying consolidatedfinancial statements.
The translations of the Japanese yen amounts into U.S. dollars areincluded solely for the convenience of readers, using the prevailing exchangerate at March 31, 2009, which was ¥98.23 to U.S. $1.00. The conveniencetranslations should not be construed as representations that the Japanese yenamounts have been, could have been, or could in the future be, convertedinto U.S. dollars at this or any other rate of exchange.
(A) CONSOLIDATIONThe consolidated financial statements include the accounts of the Companyand its subsidiaries. The difference between the cost and the underlying netequity at fair value of investments in consolidated subsidiaries and in equitymethod investees is amortized over a period of 5 years. If the amount isimmaterial, it is fully recognized currently in earnings.
The difference between the cost and the underlying net equity at fairvalue of investments in consolidated subsidiaries is recorded as goodwill.
All significant inter-company accounts and transactions have beeneliminated. In the elimination of investments in subsidiaries, the assets andliabilities of the subsidiaries, including the portion attributable to minorityshareholders, are recorded based on the fair value at the time the Companyacquired control of the respective subsidiaries.
(B) USE OF ESTIMATESThe preparation of the consolidated financial statements in conformity withthe generally accepted accounting principles requires management to makecertain estimates and assumptions that affect the reported amounts in thefinancial statements and the accompanying notes. Actual results could differfrom those estimates.
(C) EQUITY METHODInvestments in all significant affiliated companies are accounted for by theequity method and, accordingly, stated at cost adjusted for equity inundistributed earnings and losses from the date of acquisition.
(D) TRANSLATION OF FOREIGN CURRENCY ACCOUNTSForeign currency receivables and payables are translated at appropriate year-end rates and the resulting translation gains or losses are taken into incomecurrently.
Financial statements of consolidated overseas subsidiaries are translatedinto Japanese yen at the year-end rate, except that shareholders’ equityaccounts are translated at historical rates and income statement itemsresulting from transactions with the Company at the rates used by theCompany.
Differences arising from translation are presented as “Foreign currencytranslation adjustment” in valuation and translation adjustments under netassets section.
(E) CASH AND CASH EQUIVALENTSDeposits in banks and short-term investments which are highly liquid, readilyconvertible to cash and with insignificant risk of market value fluctuation,with a maturity of three months or less at the time of purchase are treated ascash equivalents.
(F) SECURITIESHeld-to-maturity securities are stated at amortized cost.
Other securities with market values are stated at market value. Unrealizedgains and unrealized losses on these securities are reported, net of applicableincome taxes, as a separate component of valuation and translationadjustments under net assets section. Realized gains and losses on sale ofsuch securities are computed using moving-average cost.
Other securities without market values are stated at moving-average cost.The Company and its consolidated subsidiaries recognize losses for the
difference between the market value and the carrying amount when themarket value significantly declines. The Company and its consolidatedsubsidiaries consider the decline to be significant when the market value ofthe other securities declines more than 50% of the carrying amount. Whenthe market value of the other securities declines from 30% to less than 50%of the carrying amount, the decline is also determined to be significant if themarket value of the securities is considered not to be recoverable to thecarrying amount.
If the net realizable value of the securities without market value declinessignificantly below the carrying amount, it is written down to net realizablevalue with a corresponding charge in the statements of income.
(G) INVENTORIES, REVENUE AND RELATED COSTSInventories are stated at cost determined mainly by the specific identificationmethod. Costs do not include interest and administrative expenses incurredduring or after development of real estate, which are charged to incomewhen incurred.
Effective April 1, 2006, the Company and its domestic subsidiariesadopted early the new accounting standard, “Accounting Standard forMeasurement of Inventories” (Statement No. 9 issued by the AccountingStandards Board of Japan). Under the new standard, inventory is initiallyrecorded at acquisition cost, and when net realizable value is less than thecost (i.e., profitability of inventory has declined), the cost basis is reduced to

54
net realizable value. Under the previous standard, inventory initially recordedat cost was reduced to market value when market value declined significantlyand unless the market value was expected to recover to the cost.
As a result of adopting the new accounting standard, the Company andits consolidated subsidiaries recognized loss on devaluation of real property of¥28,736 million for the year ended March 31, 2007 which was charged tocosts and expenses - other.
For the year ended March 31, 2009, the Company and its consolidatedsubsidiaries recognized loss on devaluation of real property for sale of¥15,896 million ($161,824 thousand) which was charged to cost of revenuefrom operations.
Revenue from the leasing is recognized on an accrual basis over the leaseterm. Revenue from sale of properties is recognized in full when delivered andaccepted by the customers. Revenue from construction work is recognized bythe completed contract method, except long-term contracts exceeding certainamounts, which are accounted for by the percentage-of-completion method,and related costs are recognized as incurred.
(H) PROPERTY AND EQUIPMENT, RELATED DEPRECIATIONAND REVALUATION — excluding leased assets
Property and equipment are carried mainly at cost. When disposed of, the cost and related accumulated depreciation or
revaluation of property and equipment are removed from the respectiveaccounts and the net difference, less any amounts realized on disposal, isreflected in the statements of income.
Depreciation of property and equipment is mainly computed by thedeclining-balance method over the estimated useful lives of the assets, exceptfor those listed below which are calculated using the straight-line method.
1. Office buildings of the Company2. Buildings acquired by the domestic consolidated subsidiaries
after April 1, 19983. Property and equipment of the overseas consolidated subsidiaries
Estimated useful lives used in the computation of depreciation aregenerally as follows: Buildings 29-50 years
Structures 15-17 yearsMachinery 7-15 yearsEquipment 3-15 years
For buildings on fixed term leasehold, the Company computesdepreciation using the straight-line method, over its lease term assuming noresidual value.
Effective from the year ended March 31, 2009, the Company adopted theaccounting standard, “Practical Solution on Unification of Accounting PoliciesApplied to Foreign Subsidiaries for Consolidated Financial Statements” (PITFNo. 18 issued by the Accounting Standards Board of Japan on May 17, 2006),and as a result, land and buildings owned by consolidated subsidiary in theUnited Kingdom, formerly stated at fair value with unrealized gains and lossesdirectly charged or credited to retained earnings, are stated at acquisition costless accumulated depreciation. Prior-year depreciations and otheradjustments of ¥5,338 million ($54,342 thousand) are charged to thebeginning balance of retained earnings of the year ended March 31, 2009.
There is no significant impact on income as a result of adopting thestandard.
In connection with the 2007 revisions to the Japanese corporate incometax law, the Company and its domestic subsidiaries changed their method ofcalculating the depreciation as follows:
1. Depreciation expenses for certain property and equipment acquired on orafter April 1, 2007 are calculated based on the revised depreciation tablesunder the Japanese corporate income tax law with residual value of ¥1.
2. Under the Japanese corporate income tax law prior to the 2007 revision,property and equipment had been depreciable to 5% of the acquisitioncosts. Revised Japanese corporate income tax law permits to furtherdepreciate the residual amount (5% of the acquisition costs less ¥1) ofthose property and equipment acquired before April 1, 2007 understraight-line method over 5 years, commencing the fiscal year followingthe year in which the property and equipment have been depreciated to5% of the acquisition costs.There is no significant impact on income for the year ended March 31,
2008 as a result of these changes.
(I) IMPAIRMENT LOSSES ON FIXED ASSETS The Company and its domestic subsidiaries have followed accountingstandards for impairment of fixed assets (“Opinion on Establishment ofAccounting Standards for Impairment of Fixed Assets” issued by the BusinessAccounting Deliberation Council) and the guidance on accounting standardsfor impairment of fixed assets (the “Financial Accounting Standard GuidanceNo. 6” issued by the Accounting Standards Board of Japan). The accountingstandards require that fixed assets be tested for recoverability wheneverevents or changes in circumstances indicate that the assets may be impaired.When the undiscounted cash flows estimated to be generated by those assetsare less than the carrying amount of those assets, the net carrying value ofassets not recoverable is reduced to recoverable amounts. Recoverableamounts are measured by net realizable values or values in current use. Netrealizable values are determined mainly based upon appraisal valuecalculated by real-estate appraisers. Values in current use are calculatedbased on the present values of future cash flows.
Accumulated impairment losses are deducted from book values of relatedfixed assets.
(J) LAND REVALUATIONPursuant to the Law Concerning Land Revaluation and the revisions thereof,the Company and certain consolidated subsidiaries revalued land used forbusiness activities on March 31, 2002.
The land prices for revaluation were determined based on the appraisalprices by real estate appraisers in accordance with Article 2, Paragraph 5of the Enforcement Ordinance Concerning Land Revaluation. Thedifference between quoted appraisal value and the carrying amount isrecorded, net of applicable income taxes, as “Reserve on land revaluation”as a separate component of valuation and translation adjustments undernet assets section.
(K) GOODWILL AND OTHER INTANGIBLE ASSETSGoodwill and other intangible assets are included in “other” under caption of“investments and other assets.”
Goodwill (including negative goodwill) is amortized over a period of 5years under straight-line method. If the amount is immaterial, it is fullyrecognized currently in earnings.
Other intangible assets are amortized under straight-line method. Software(for internal use) is amortized over its estimated useful lives of 5 years.
(L) ALLOWANCE FOR DOUBTFUL ACCOUNTSThe Company and its consolidated domestic subsidiaries provide for doubtfulaccounts principally at an amount computed based on the historical bad debt

55
Notes to Consolidated Financial Statements
ratio during a certain reference period plus an estimated uncollectible amountbased on the analysis of certain individual accounts, including claims inbankruptcy.
(M) ALLOWANCE FOR EMPLOYEES’ RETIREMENT BENEFITSThe Company has a retirement plan which provides for lump-sum paymentand annuity. Upon retirement age or at 60, a regular employee is entitled toreceive a lump-sum payment and an annuity, or in certain cases at the optionof the retiring employee, the full amount of the retirement benefits may bepaid in a lump-sum. The retirement benefits are based primarily upon theyears of employee’s service and monthly pay at the time of retirement.
The allowance and expenses for retirement benefits are determined basedon the amounts actuarially calculated using certain assumptions.
The Company and its consolidated subsidiaries provide allowance foremployees’ retirement benefits at fiscal year end based on the estimatedamounts of projected benefit obligation and the fair value of the plan assetsat that date.
(N) ALLOWANCE FOR DIRECTORS’ AND CORPORATE AUDITORS’ RETIREMENT BENEFITS
Allowance for retirement benefits for directors and corporate auditors of theCompany and its 37 consolidated subsidiaries are also provided at theamounts to be paid if all eligible directors and corporate auditors would havebeen retired at year end under the internal guidelines.
(O) ACCOUNTING FOR LEASE TRANSACTIONSEffective from the year ended March 31, 2009, the Company and its domesticsubsidiaries adopted the new accounting standards, “Accounting Standardfor Lease Transactions” (Statement No. 13 originally issued by the FirstCommittee of the Business Accounting Council on June 17, 1993 and revisedby the Accounting Standards Board of Japan on March 30, 2007) and theimplementation guidance on accounting standard for lease transactions (theFinancial Accounting Standard Implementation Guidance No. 16 issuedoriginally by the Accounting System Committee of the Japanese Institute ofCertified Public Accountants on January 18, 1994 and revised by theAccounting Standards Board of Japan on March 30, 2007), (collectively, “thenew accounting standards”).
Those standards require finance leases to be accounted for in a mannersimilar to the accounting treatment for ordinary sales transactions. Lesseesare required to record assets and liabilities regarding finance leases withrecognition of depreciation and interest expenses. Capitalized leasedassets are depreciated under straight-line method, over its lease termassuming no residual value. Lessors are required to recognize leasereceivables or investments in leased assets along with related lease(interest) income.
Under the previous accounting standards, finance leases which do nottransfer ownership of the leased assets to lessees were accounted for asoperating leases. It should be noted that such finance leases whosecommencement day falls on or prior to March 31, 2008 are still accounted foras operating leases under the new standards.
There is no significant impact on income as a result of adopting thosestandards.
(P) INCOME TAXESThe Company and its consolidated domestic subsidiaries are subject to acorporate tax of 30%, an inhabitant tax of approximately 6% and adeductible enterprise tax of approximately 8%, which in the aggregate
resulted in a statutory income tax rate of approximately 41% for the yearsended March 31, 2009, 2008 and 2007.
Income taxes are provided for on the basis of income for financialstatement purposes. The tax effect of temporary differences between thecarrying amounts of assets and liabilities for financial statements and incometax purposes is recognized as deferred income taxes.
(Q) DERIVATIVES AND HEDGE ACCOUNTINGThe Company and its consolidated subsidiaries defer recognition of gains orlosses resulting from changes in fair value of derivative financial instrumentsuntil the related losses or gains on the hedged items are recognized, ifderivative financial instruments are used as hedges and meet certainhedging criteria.
However, in cases where forward foreign exchange contracts are used ashedges and meet certain hedging criteria, forward foreign exchange contractsand hedged items are accounted for in the following manner:
1. If a forward foreign exchange contract is executed to hedge an existingforeign currency receivable or payable,
(a) the difference, if any, between the Japanese yen amount of thehedged foreign currency receivable or payable translated using the spot rateat the inception date of the contract and the book value of the receivable orpayable is recognized in the income statements in the period which includesthe inception date, and
(b) the discount or premium on the contract (that is, the differencebetween the Japanese yen amount of the contract translated using thecontracted forward rate and that translated using the spot rate at theinception date of the contract) is recognized over the term of the contract.
2. If a forward foreign exchange contract is executed to hedge a futuretransaction denominated in a foreign currency, the future transaction will berecorded using the contracted forward rate, and no gains or losses on theforward foreign exchange contract are recognized.
Also, if interest rate swap contracts are used as hedge and meet certainhedging criteria, the net amount to be paid or received under the interest rateswap contract is added to or deducted from the interest on the assets orliabilities for which the swap contract was executed.
(R) EQUITY INVESTMENTS REGARDING REAL ESTATE SECURITIZATION-RELATED BUSINESS
Equity investments in tokumei-kumiai, or silent partnerships (“TK”),preferred securities issued by tokutei-mokuteki-kaisha, or specific purposecompanies (“TMK”) and others regarding real estate securitization-relatedbusiness (collectively, “equity investments”) are presented in the balancesheets as follows.
Equity investments held for sale are presented as “Equity investments inproperties for sale” under “CURRENT ASSETS” and those held other than forsale are presented as “Investment securities” under “INVESTMENTS andOTHER ASSETS.”
(S) REVENUE FROM JAPANESE REAL ESTATE INVESTMENT TRUST (J-REIT)Revenue from J-REIT is included in “Revenue from operations.”
(T) DIRECTORS’ BONUSES The Company and its domestic subsidiaries have followed the accountingstandard, “Accounting Standard for Directors’ Bonus” (Statement No. 4issued by the Accounting Standards Board of Japan). Directors’ bonuses arecharged to income as selling, general and administrative expenses.

56
(U) PRESENTATION OF NET ASSETS IN THE BALANCE SHEETS Effective from the year ended March 31, 2007, the Company and its domesticsubsidiaries adopted the new accounting standards, “Accounting Standardfor Presentation of Net Assets in the Balance Sheet” (Statement No. 5 issuedby the Accounting Standards Board of Japan) and the implementationguidance for the accounting standard for presentation of net assets in thebalance sheet (the Financial Accounting Standard Implementation GuidanceNo. 8 issued by the Accounting Standards Board of Japan), (collectively, “thenew accounting standards”).
Under the new accounting standards, consolidated balance sheetscomprise assets, liabilities and net assets, whereas previously presentedbalance sheets comprised assets, liabilities, minority interests andshareholders’ equity. Net assets section comprises shareholders’ equity,valuation and translation adjustments, subscription rights to shares andminority interests, as applicable. It should be noted that “net unrealized gainson hedging derivatives” under “valuation and translation adjustments” wereincluded in assets or liabilities, gross of applicable taxes, under the previouspresentation, and therefore, “net unrealized gains on hedging derivatives” asof the beginning of the year ended March 31, 2007 is presented as “—“ inthe consolidated statements of changes in net assets.
(V) SHARE-BASED PAYMENTSEffective from the year ended March 31, 2008, the Company and itsdomestic subsidiaries adopted the accounting standards, “AccountingStandard for Share-Based Payment” (Statement No. 8 issued by theAccounting Standards Board of Japan) and the implementation guidance forthe accounting standard for share-based payment (the Financial AccountingStandard Implementation Guidance No. 11 issued by the AccountingStandards Board of Japan).
Those standards require that the cost of stock options be measured basedon the grant-date fair value. Outstanding options are presented as subscriptionrights to shares as a component of net assets in the balance sheet.
There is no significant impact on income for the year ended March 31,2008 as a result of adopting those standards.
(W) EARNINGS PER SHAREBasic income per share is computed by dividing the net income available fordistribution to shareholders of common stock by the weighted averagenumber of shares of common stock outstanding during each year. Dilutednet income per share is computed by dividing the net income available fordistribution to shareholders by the weighted average number of shares ofcommon stock outstanding during each year assuming full conversion ofconvertible bonds and full execution of warrants. Diluted net income pershare for the year ended March 31, 2007 is not presented since no dilutivepotential common shares were outstanding as of March 31, 2007.
(X) RECLASSIFICATIONSCertain prior years’ amounts have been reclassified to conform to the currentpresentation. On the consolidated statements of cash flows, “increase(decrease) in bank loans and commercial paper” as formerly presented undercaption of cash flows from financing activities is separately disclosed on agross basis of “proceeds from bank loans and commercial paper” and“repayments of bank loans and commercial paper” for the year ended March31, 2009 because it became significant. Accordingly, “increase (decrease) inbank loans and commercial paper” for the years ended March 31, 2008 and2007 are reclassified to conform to 2009 presentation. These changes had noimpact on previously reported results of operations.
BUSINESS REORGANIZATIONS3
The Company and its domestic subsidiaries have followed accountingstandards, “Accounting Standards for Business Combinations” (issued byBusiness Accounting Council), “Accounting Standard for BusinessDivestitures” (Statement No. 7 issued by the Accounting Standards Board ofJapan) and “Guidance on Accounting Standard for Business Combinationsand Accounting Standard for Business Divestitures” (Guidance No. 10 issuedby the Accounting Standards Board of Japan) (collectively, “accountingstandards for business combinations and divestitures”).
1. Business reorganizations for the year ended March 31, 2007(1) Reorganization of residential sales businessOn October 1, 2006, the Company and Mitsui Real Estate Sales Co., Ltd.(“MRES”) transferred their residential sales business and residential salesconsignment services business, with any associated rights andobligations, to Mitsui Fudosan Residential Co., Ltd. (“MFR”), for thepurpose of integrating residential sales business into MFR, in exchangefor 996,000 shares and 2,000 shares of common stock issued by MFR,respectively. Those 2,000 shares of common stock issued by MFR to MREShave been distributed to the Company as dividends.
The reorganization has been accounted for as transactions amongentities under common control in accordance with the accountingstandards for business combinations and divestitures.
Book values of assets and liabilities transferred are as follows:
Millions of yen
Assets and liabilities transferred from the Company:Current assets ............................................................................... ¥365,789Non-current assets....................................................................... 7,648
Total ........................................................................................... ¥373,437Current liabilities .......................................................................... ¥210,561Long-term liabilities..................................................................... 105,038
Total ........................................................................................... ¥315,599Assets and liabilities transferred from MRES:Current assets ............................................................................... ¥27,597Non-current assets....................................................................... 1,347
Total ........................................................................................... ¥28,944Current liabilities .......................................................................... ¥28,844Long-term liabilities..................................................................... —
Total ........................................................................................... ¥28,844
(2) Reorganization of building leasing business of MRESOn October 1, 2006, MRES transferred its building leasing business with anyassociated rights and obligations to the Company. The reorganization willenable specialization by MRES in promising areas of real estate brokerageand car park leasing operations, and concentration of building leasingbusiness in the Company.
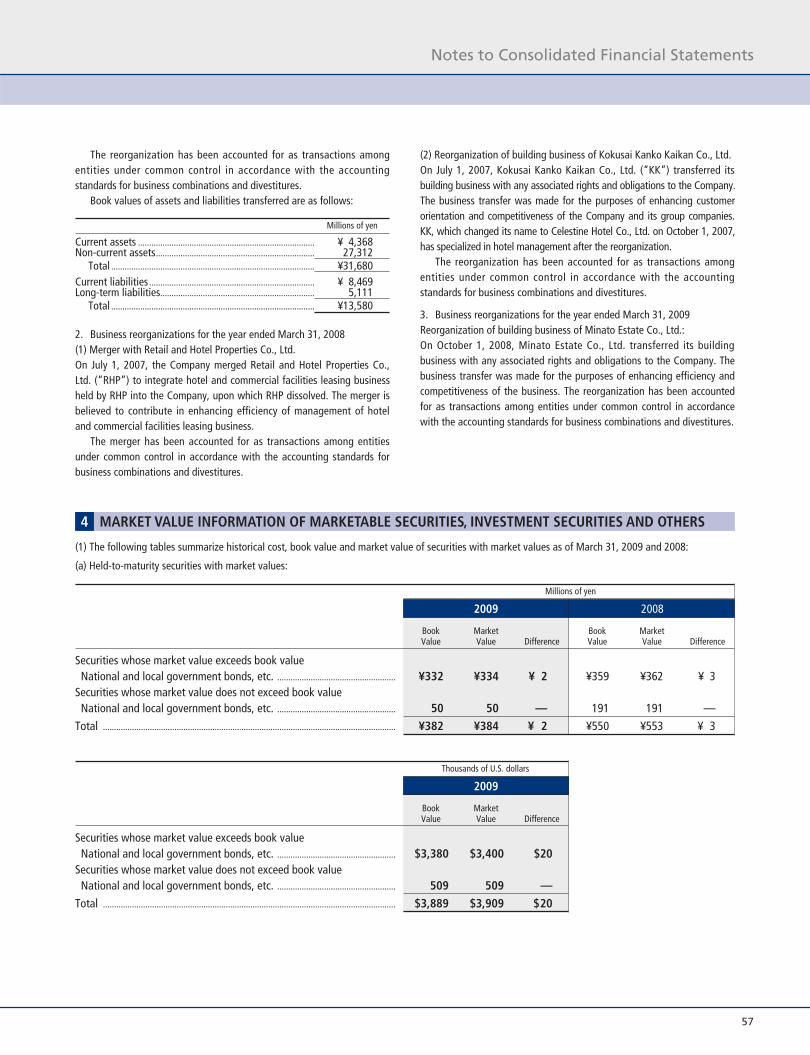
57
The reorganization has been accounted for as transactions amongentities under common control in accordance with the accountingstandards for business combinations and divestitures.
Book values of assets and liabilities transferred are as follows:
Millions of yen
Current assets ............................................................................... ¥ 4,368Non-current assets....................................................................... 27,312
Total ........................................................................................... ¥31,680Current liabilities .......................................................................... ¥ 8,469Long-term liabilities..................................................................... 5,111
Total ........................................................................................... ¥13,580
2. Business reorganizations for the year ended March 31, 2008(1) Merger with Retail and Hotel Properties Co., Ltd.On July 1, 2007, the Company merged Retail and Hotel Properties Co.,Ltd. (“RHP”) to integrate hotel and commercial facilities leasing businessheld by RHP into the Company, upon which RHP dissolved. The merger isbelieved to contribute in enhancing efficiency of management of hoteland commercial facilities leasing business.
The merger has been accounted for as transactions among entitiesunder common control in accordance with the accounting standards forbusiness combinations and divestitures.
(2) Reorganization of building business of Kokusai Kanko Kaikan Co., Ltd.On July 1, 2007, Kokusai Kanko Kaikan Co., Ltd. (“KK”) transferred itsbuilding business with any associated rights and obligations to the Company.The business transfer was made for the purposes of enhancing customerorientation and competitiveness of the Company and its group companies.KK, which changed its name to Celestine Hotel Co., Ltd. on October 1, 2007,has specialized in hotel management after the reorganization.
The reorganization has been accounted for as transactions amongentities under common control in accordance with the accountingstandards for business combinations and divestitures.
3. Business reorganizations for the year ended March 31, 2009Reorganization of building business of Minato Estate Co., Ltd.:On October 1, 2008, Minato Estate Co., Ltd. transferred its buildingbusiness with any associated rights and obligations to the Company. Thebusiness transfer was made for the purposes of enhancing efficiency andcompetitiveness of the business. The reorganization has been accountedfor as transactions among entities under common control in accordancewith the accounting standards for business combinations and divestitures.
(1) The following tables summarize historical cost, book value and market value of securities with market values as of March 31, 2009 and 2008:
MARKET VALUE INFORMATION OF MARKETABLE SECURITIES, INVESTMENT SECURITIES AND OTHERS4
(a) Held-to-maturity securities with market values:
Millions of yen
2009 2008
Book Market Book MarketValue Value Difference Value Value Difference
Securities whose market value exceeds book valueNational and local government bonds, etc. ..................................................... ¥332 ¥334 ¥ 2 ¥359 ¥362 ¥ 3
Securities whose market value does not exceed book valueNational and local government bonds, etc. ..................................................... 50 50 — 191 191 —
Total ................................................................................................................................... ¥382 ¥384 ¥ 2 ¥550 ¥553 ¥ 3
Thousands of U.S. dollars
2009
Book MarketValue Value Difference
Securities whose market value exceeds book valueNational and local government bonds, etc. ..................................................... $3,380 $3,400 $20
Securities whose market value does not exceed book valueNational and local government bonds, etc. ..................................................... 509 509 —
Total ................................................................................................................................... $3,889 $3,909 $20
Notes to Consolidated Financial Statements

58
(b) Other securities with market values:
Millions of yen
2009 2008
Historical Book Value Historical Book ValueCost (Market Value) Difference Cost (Market Value) Difference
Securities whose book value (market value) exceeds historical costStocks ............................................................................................................................ ¥26,587 ¥35,600 ¥ 9,013 ¥ 39,502 ¥ 86,429 ¥46,927Bonds
National and local government bonds, etc. ............................................ — — — 40 40 —Other.............................................................................................................................. 11,264 16,205 4,941 21,033 34,710 13,677
Subtotal ........................................................................................................................ 37,851 51,805 13,954 60,575 121,179 60,604Securities whose book value (market value) does not exceedhistorical cost
Stocks ........................................................................................................................... 43,198 36,487 (6,711) 39,363 33,424 (5,939)Other ............................................................................................................................ 13,769 9,987 (3,782) 4,301 4,018 (283)
Subtotal ....................................................................................................................... 56,967 46,474 (10,493) 43,664 37,442 (6,222)
Total ................................................................................................................................... ¥94,818 ¥98,279 ¥ 3,461 ¥104,239 ¥158,621 ¥54,382
Thousands of U.S. dollars
2009
Historical Book ValueCost (Market Value) Difference
Securities whose book value (market value) exceeds historical costStocks ............................................................................................................................ $270,661 $ 362,415 $ 91,754Bonds
National and local government bonds, etc. ............................................ — — —Other.............................................................................................................................. 114,669 164,969 50,300
Subtotal ........................................................................................................................ 385,330 527,384 142,054Securities whose book value (market value) does not exceedhistorical cost
Stocks ............................................................................................................................ 439,764 371,445 (68,319)Other.............................................................................................................................. 140,171 101,670 (38,501)Subtotal ........................................................................................................................ 579,935 473,115 (106,820)
Total ................................................................................................................................... $965,265 $1,000,499 $ 35,234
(2) The following tables summarize other securities sold in the years ended March 31, 2009, 2008 and 2007:
Millions of yen
2009 70028002Sales amount Gains Losses Sales amount Gains Losses Sales amount Gains Losses
¥5,311 ¥1,328 ¥(684) ¥4,566 ¥2,869 ¥(6) ¥5,191 ¥577 ¥—
Thousands of U.S. dollars
2009Sales amount Gains Losses
$54,067 $13,519 $(6,963)

59
Notes to Consolidated Financial Statements
(3) The following tables summarize the book value of securities without market value as of March 31, 2009 and 2008:
Millions of yen Thousands of U.S. dollars
2009 2008 2009
Equity investments in properties for sale* ................................................................ ¥89,776 ¥97,152 $913,937
Held-to-maturity securities .............................................................................................. — 17,970 —
Other securities
Unlisted stocks (excluding OTC securities)........................................................... 18,265 12,817 185,941
Other (TK investments, preferred securities and others)* ............................. 51,532 36,102 524,606
* See Note 2(R)
(4) The redemption schedule on held-to-maturity securities as of March 31, 2009 and 2008 is shown as follows:
Millions of yen
2009
Due after 1 Due after 5Due within Year and within Years and Due after
1 Year 5 Years within 10 Years 10 Years
National and local government bonds, etc. ............................................................ ¥126 ¥241 ¥15 ¥—
Total ........................................................................................................................................ ¥126 ¥241 ¥15 ¥—
Millions of yen
2008
Due after 1 Due after 5Due within Year and within Years and Due after
1 Year 5 Years within 10 Years 10 Years
National and local government bonds, etc. ............................................................ ¥ 284 ¥282 ¥25 ¥—
Corporate bonds .................................................................................................................. 4,970 — — —
Total ........................................................................................................................................ ¥13,000 ¥282 ¥25 ¥—
Thousands of U.S. dollars
2009
Due after 1 Due after 5Due within Year and within Years and Due after
1 Year 5 Years within 10 Years 10 Years
National and local government bonds, etc. ............................................................ $1,283 $2,453 $153 $—
Total ........................................................................................................................................ $1,283 $2,453 $153 $—

60
INVENTORIES6
Inventories at March 31, 2009 and 2008 comprise the following:
Millions of yen Thousands of U.S. dollars
2009 2008 2009
Real property for saleCompleted ........................................................................................................................ ¥356,580 ¥241,066 $3,630,052In progress........................................................................................................................ 217,081 228,049 2,209,926Land held for development........................................................................................ 182,970 174,445 1,862,669
Expenditure on contracts in progress.......................................................................... 7,196 8,492 73,257Other ........................................................................................................................................ 10,034 10,207 102,148
¥773,861 ¥662,259 $7,878,052
ADVANCES PAID FOR PURCHASES
Advances paid for purchases comprise primarily advance payments for purchasing real estate for sale.
LEASE DEPOSITS
7
8
The Company and its consolidated subsidiaries lease certain officebuildings and commercial facilities from the owners thereof and subleasethem to subtenants. In these transactions, the Company and its
consolidated subsidiaries pay lease deposits to the owners and receivedeposits from subtenants (See Note 12).
DERIVATIVE FINANCIAL INSTRUMENTS AND HEDGING TRANSACTIONS5
The Company and its consolidated subsidiaries use forward foreignexchange contracts, foreign currency swap contracts and interest rateswap contracts as derivative financial instruments only for the purpose ofmitigating future risks of fluctuation of foreign currency exchange ratesand interest rates.
Forward foreign currency and foreign currency swap contracts aresubject to risks of foreign exchange rate changes and interest rate swapcontracts are subject to risks of interest rate changes.
The derivative transactions are executed and managed by theCompany’s Accounting and Finance Department in accordance with theestablished policies and within the specified limits on the amounts ofderivative transactions allowed.
The Company and its consolidated subsidiaries do not use derivativefinancial instruments for speculative trading purposes. The derivativefinancial instruments are executed with creditworthy financial institutions,and the Company’s management believes there is little risk of default bycounterparties.
The following summarizes hedging derivative financial instrumentsused by the Company and its consolidated subsidiaries and items hedged:
Hedging instruments:Forward foreign exchange contractsForeign currency swap contractsInterest rate swap contracts
Hedged items:Expected foreign currency transactionsForeign currency debtBorrowings and debentures
Forward foreign exchange contracts are executed within the scope ofordinary payments and receipts in foreign currency to hedge againstmarket fluctuation risks. Foreign currency swap contracts and interest rateswap contracts are executed on a provisional basis to hedge againstmarket fluctuation risks.
The assessment of hedge effectiveness is omitted because significantterms of hedging instruments and those of the items hedged are the sameand the risk of changes in foreign exchange rates and interest rates wouldbe entirely eliminated.
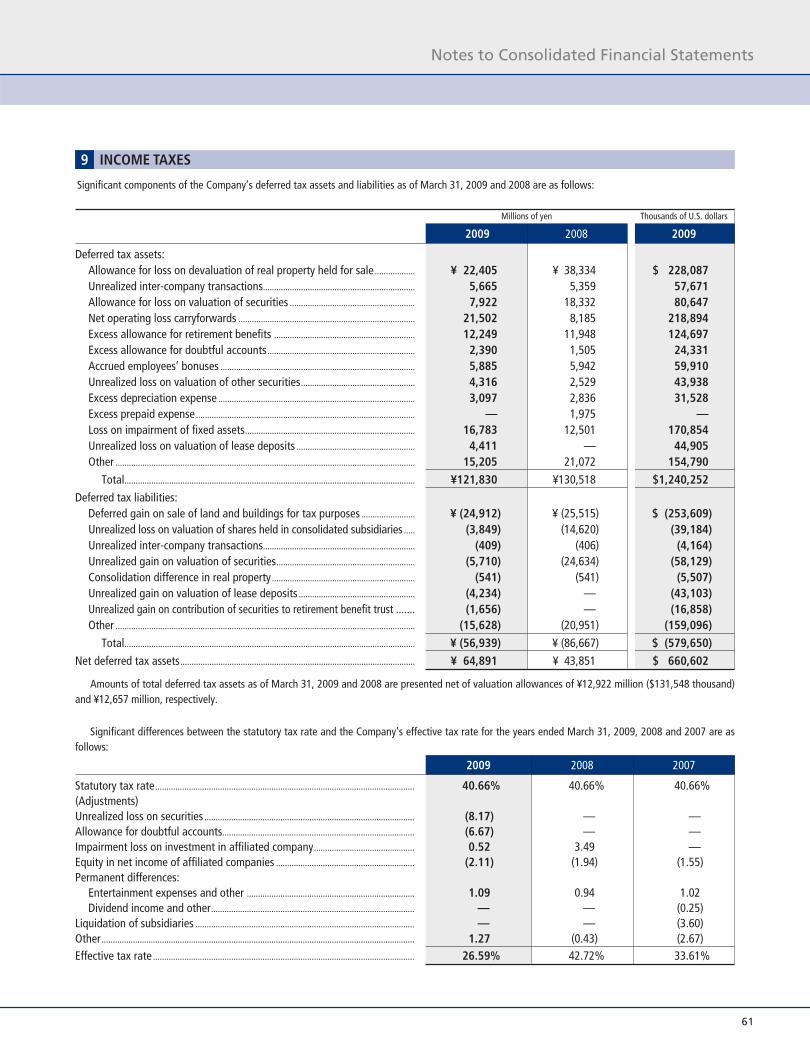
Notes to Consolidated Financial Statements
61
INCOME TAXES
Significant components of the Company’s deferred tax assets and liabilities as of March 31, 2009 and 2008 are as follows:
Millions of yen Thousands of U.S. dollars
2009 2008 2009
Deferred tax assets:Allowance for loss on devaluation of real property held for sale .................. ¥ 22,405 ¥ 38,334 $ 228,087 Unrealized inter-company transactions.................................................................... 5,665 5,359 57,671Allowance for loss on valuation of securities ........................................................ 7,922 18,332 80,647Net operating loss carryforwards ............................................................................... 21,502 8,185 218,894Excess allowance for retirement benefits ............................................................... 12,249 11,948 124,697Excess allowance for doubtful accounts.................................................................. 2,390 1,505 24,331Accrued employees’ bonuses ....................................................................................... 5,885 5,942 59,910Unrealized loss on valuation of other securities................................................... 4,316 2,529 43,938Excess depreciation expense ........................................................................................ 3,097 2,836 31,528Excess prepaid expense .................................................................................................. — 1,975 —Loss on impairment of fixed assets............................................................................ 16,783 12,501 170,854Unrealized loss on valuation of lease deposits ..................................................... 4,411 — 44,905Other ...................................................................................................................................... 15,205 21,072 154,790
Total.................................................................................................................................. ¥121,830 ¥130,518 $1,240,252
Deferred tax liabilities:Deferred gain on sale of land and buildings for tax purposes ........................ ¥ (24,912) ¥ (25,515) $ (253,609)Unrealized loss on valuation of shares held in consolidated subsidiaries ..... (3,849) (14,620) (39,184)Unrealized inter-company transactions.................................................................... (409) (406) (4,164)Unrealized gain on valuation of securities.............................................................. (5,710) (24,634) (58,129)Consolidation difference in real property ................................................................ (541) (541) (5,507)Unrealized gain on valuation of lease deposits .................................................... (4,234) — (43,103)Unrealized gain on contribution of securities to retirement benefit trust ....... (1,656) — (16,858)Other ...................................................................................................................................... (15,628) (20,951) (159,096)
Total.................................................................................................................................. ¥ (56,939) ¥ (86,667) $ (579,650)
Net deferred tax assets......................................................................................................... ¥ 64,891 ¥ 43,851 $ 660,602
Amounts of total deferred tax assets as of March 31, 2009 and 2008 are presented net of valuation allowances of ¥12,922 million ($131,548 thousand)and ¥12,657 million, respectively.
9
Significant differences between the statutory tax rate and the Company’s effective tax rate for the years ended March 31, 2009, 2008 and 2007 are asfollows:
2009 2008 2007
Statutory tax rate.................................................................................................................... 40.66% 40.66% 40.66%(Adjustments)Unrealized loss on securities .............................................................................................. (8.17) .— .—Allowance for doubtful accounts...................................................................................... (6.67) .— .—Impairment loss on investment in affiliated company............................................. 0.52 3.49 .—Equity in net income of affiliated companies .............................................................. (2.11) (1.94) (1.55)Permanent differences:
Entertainment expenses and other ........................................................................... 1.09 0.94 1.02Dividend income and other........................................................................................... .— .— (0.25)
Liquidation of subsidiaries .................................................................................................. .— .— (3.60)Other ............................................................................................................................................ 1.27 (0.43) (2.67)Effective tax rate ..................................................................................................................... 26.59% 42.72% 33.61%

(2) Details of projected benefit obligation:
Millions of yen Thousands of U.S. dollars
2009 2008 2009
1. Projected benefit obligation ...................................................................................... ¥(99,630) ¥(93,900) $(1,014,252)2. Fair value of plan assets ............................................................................................. 48,362 52,993 492,334
3. Unaccrued projected benefit obligation (1+2).................................................... ¥(51,268) ¥(40,907) $ (521,918)4. Unrecognized actuarial differences ......................................................................... 22,143 13,382 225,420 5. Unrecognized prior service costs .............................................................................. 114 21 1,160 6. Prepaid pension expenses ........................................................................................... (473) (530) (4,815)
7. Allowance for employees’ retirement benefits (3+4+5+6) ........................... ¥(29,484) ¥(28,034) $ (300,153)
Note: Some consolidated subsidiaries adopt the simple method to calculate projected benefit obligation.
(3) Details of retirement benefit expenses:
Millions of yen Thousands of U.S. dollars
2009 2008 2007 2009
1. Service costs—benefits earned during the year ............................................... ¥ 5,066 ¥ 4,738 ¥ 4,268 $ 51,573 2. Interest costs on projected benefit obligation .................................................... 2,265 2,165 2,051 23,058 3. Expected return on plan assets................................................................................. (1,228) (1,292) (1,088) (12,501)4. Amortization of actuarial differences..................................................................... 2,878 2,110 2,226 29,299 5. Amortization of prior service costs.......................................................................... 212 2 (10) 2,158
6. Supplemental benefits.................................................................................................. 180 10 103 1,832
7. Retirement benefit expenses (1+2+3+4+5+6) ................................................. ¥ 9,373 ¥ 7,733 ¥ 7,550 $ 95,419
Notes: 1. Retirement benefit expenses of consolidated subsidiaries adopting the simple method are included in service costs.2. Supplemental benefits for the years ended March 31, 2009 and 2007 includes ¥180 million ($1,832 thousand) of premium retirement benefits paid
specifically for early retirement of employees and ¥93 million of premium retirement benefits paid specifically for employment transfer within consolidatedsubsidiaries, respectively, which are included in “Other“ as a component of “COSTS AND EXPENSES.”
EMPLOYEES’ RETIREMENT BENEFITS10
(1) Outline of retirement plan:The Company has adopted a tax qualified pension plan and lump-sumpension plans as a defined benefit pension plan. The Company has alsoadopted a retirement benefit trust.
17 consolidated subsidiaries have adopted tax qualified pension plans.63 consolidated subsidiaries have adopted lump-sum pension plans. Oneconsolidated subsidiary has adopted employees’ pension funds.
62
20091. Allocation method for the projected
retirement benefits Straight-line method2. Discount rates 2.5%3. Expected rates of return on plan assets 1.0-2.5%4. Years over which the prior service
costs are allocated 1-10 years Straight-line method over acertain number of yearswithin the average remainingservice years
5. Years over which the actuarialdifferences obligations are allocated 5-10 years Straight-line method over a
certain number of yearswithin the average remainingservice years
2008
Straight-line method2.5%1.0-2.5%
1-10 years Straight-line method over acertain number of years within the average remainingservice years
5-10 years Straight-line method over acertain number of yearswithin the average remainingservice years
2007
Straight-line method2.5%1.0-2.5%
1-10 years Straight-line method over acertain number of yearswithin the average remainingservice years
5-10 years Straight-line method over acertain number of yearswithin the average remainingservice years
(4) Basis for measurement of projected benefit obligation and other items:

63
Notes to Consolidated Financial Statements
BANK LOANS, COMMERCIAL PAPER AND LONG-TERM DEBT
(2) Long-term debtLong-term debt at March 31, 2009 and 2008 comprise the following:
(1) Bank loans and commercial paperBank loans consist mainly of short-term notes and short-term borrowingsunder the loan agreements. The Company and its consolidated subsidiaries
have had no difficulty in renewing such notes and borrowings, when theyconsidered it appropriate to do so.
Millions of yen Thousands of U.S. dollars
2009 2008 2009
Long-term loans, principally from banks and insurance companies:Loans secured by collateral or bank guarantees............................................... ¥ 57,049 ¥ 70,947 $ 580,770 Unsecured loans............................................................................................................. 1,363,143 1,097,654 13,877,053
1,420,192 1,168,601 14,457,823 Bonds and debentures Domestic:
2.45% yen notes due 2008 ...................................................................................... — 25,000 — 3.00% yen notes due 2013 ...................................................................................... 10,000 10,000 101,802 2.08% yen notes due 2009 ...................................................................................... 10,000 10,000 101,802 2.20% yen notes due 2009 ...................................................................................... 10,000 10,000 101,802 2.33% yen notes due 2009 ...................................................................................... 10,000 10,000 101,802 2.17% yen notes due 2008 ...................................................................................... — 5,000 — 2.29% yen notes due 2009 ...................................................................................... 10,000 10,000 101,802 2.25% yen notes due 2012 ...................................................................................... 5,000 5,000 50,899 2.04% yen notes due 2010 ...................................................................................... 10,000 10,000 101,802 1.04% yen notes due 2013........................................................................................ 10,000 10,000 101,802 1.81% yen notes due 2014........................................................................................ 10,000 10,000 101,802 1.64% yen notes due 2014........................................................................................ 10,000 10,000 101,802 1.65% yen notes due 2015........................................................................................ 10,000 10,000 101,802 1.81% yen notes due 2016........................................................................................ 20,000 20,000 203,604 1.99% yen notes due 2016........................................................................................ 10,000 10,000 101,802 1.91% yen notes due 2016........................................................................................ 20,000 20,000 203,604 1.54% yen notes due 2014........................................................................................ 20,000 20,000 203,604 1.84% yen notes due 2017........................................................................................ 10,000 10,000 101,802 2.06% yen notes due 2017 ...................................................................................... 20,000 20,000 203,604 1.65% yen notes due 2014 ...................................................................................... 10,000 10,000 101,802 1.97% yen notes due 2017 ...................................................................................... 20,000 20,000 203,604 1.92% yen notes due 2018 ...................................................................................... 10,000 — 101,802
245,000 265,000 2,494,147 Less amount due within one year................................................................................. 157,847 146,354 1,606,912
¥1,507,345 ¥1,287,247 $15,345,058
11
Millions of yen Thousands of U.S. dollars
2009 2008 2009
Bank loans, with the weighted average interest rates of1.27% in 2009 and 1.87% in 2008........................................................................ ¥55,367 ¥63,820 $563,647
Commercial paper, with the weighted average interest rates of0.23% in 2009 and 0.87% in 2008........................................................................ 13,000 53,000 132,342
The amounts and the weighted average interest rates of bank loans and commercial paper at March 31, 2009 and 2008 are as follow:

64
The following assets are pledged as collateral for secured loans:
Millions of yen Thousands of U.S. dollars
2009 2008 2009
Collateralized assetsLand .................................................................................................................................... ¥ 35,755 ¥ 51,692 $ 363,993 Real property for sale................................................................................................... 28,523 — 290,370Buildings and structures and others ...................................................................... 66,905 103,683 681,105
Total ........................................................................................................................................ ¥131,183 ¥155,375 $1,335,468
As is customary in Japan, collateral must be given if requested, undercertain circumstances, by a lending bank and such bank has the right tooffset cash deposited with it against any debt or obligation that becomesdue and, in case of default and certain other specified events, against all
debt payable to the bank. The Company and its consolidated subsidiarieshave never received any such requests nor do they expect that any suchrequest will be made.
The annual maturities of long-term debt at March 31, 2009 are as follows:
Year ending March 31 Millions of yen Thousands of U.S. dollars
2010..................................................................................................................................... ¥ 157,847 $ 1,606,912 2011..................................................................................................................................... 246,953 2,514,0282012..................................................................................................................................... 236,307 2,405,6502013..................................................................................................................................... 227,401 2,314,9852014..................................................................................................................................... 201,999 2,056,388Thereafter........................................................................................................................... 594,685 6,054,007Total ..................................................................................................................................... ¥1,665,192 $16,951,970
DEPOSITS FROM TENANTS
Deposits from tenants at March 31, 2009 and 2008 comprise the following:
Millions of yen Thousands of U.S. dollars
2009 2008 2009
Non-interest-bearing ........................................................................................................ ¥359,697 ¥342,173 $3,661,783 Interest-bearing .................................................................................................................. 10,997 14,439 111,952
Total ........................................................................................................................................ ¥370,694 ¥356,612 $3,773,735
Average interest rate ......................................................................................................... 1.59% 1.65%
The Company and its consolidated subsidiaries generally make leaseagreements with tenants under which they receive both interest-bearingdeposits and non-interest-bearing deposits from tenants. The non-interest-bearing deposits and some of the interest-bearing deposits are
not refundable during the life of the lease. The rest of the interest-bearingdeposits are generally refundable to the tenant in equal annual ormonthly payments with interests over certain periods of time commencingafter the grace periods, depending on the terms of the contracts.
12
Millions of yen Thousands of U.S. dollars
2009 2008 2009
Due within one year, with the weighted average interest rates of3.11% in 2009 and 1.40% in 2008........................................................................ ¥ 117,847 ¥ 116,354 $ 1,199,705
Due after one year, with the weighted average interest rates of1.61% in 2009 and 1.87% in 2008........................................................................ 1,302,345 1,052,247 13,258,118
¥1,420,192 ¥1,168,601 $14,457,823
Long-term loans, principally from banks and insurance companies consist of the following:

65
NET ASSETS13
As described in Note 2 (U), net assets comprises four subsections, whichare the shareholders’ equity, valuation and translation adjustments,subscription rights to shares and minority interests, as applicable.
The Japanese Corporate Law (the “Law”) became effective on May 1,2006, replacing the Japanese Commercial Code (the “Code”). The Law isgenerally applicable to events and transactions occurring after April 30,2006 and for fiscal years ending after that date.
Under Japanese laws and regulations, the entire amount paid for newshares is required to be designated as common stock. However, acompany may, by resolution of the Board of Directors, designate anamount not exceeding one-half of the price of the new shares asadditional paid-in capital, which is included in capital surplus.
Under the Law, in cases where a dividend distribution of surplus ismade, the smaller of an amount equal to 10% of the dividend or theexcess, if any, of 25% of common stock over the total of additional paid-in-capital and legal earnings reserve must be set aside as additional paid-in-capital or legal earnings reserve. Legal earnings reserve is included inretained earnings in the accompanying consolidated balance sheets.
Under the Code, companies were required to set aside an amountequal to at least 10% of the aggregate amount of cash dividends and
other cash appropriations as legal earnings reserve until the total of legalearnings reserve and additional paid-in capital equaled 25% of commonstock.
Under the Code, legal earnings reserve and additional paid-in capitalcould be used to eliminate or reduce a deficit by resolution of theshareholders’ meeting or could be capitalized by resolution of the Boardof Directors. Under the Law, both of these appropriations generally requirea resolution of the shareholders’ meeting. Additional paid-in capital andlegal earnings reserve may not be distributed as dividends. Under theCode, however, on condition that the total amount of legal earningsreserve and additional paid-in capital remained equal to or exceeded 25%of common stock, they were available for distribution by resolution of theshareholders’ meeting. Under the Law, all additional paid-in-capital andall legal earnings reserve may be transferred to other capital surplus andretained earnings, respectively, which are potentially available fordividends.
The maximum amount that the Company can distribute as dividends iscalculated based on the non-consolidated financial statements of theCompany in accordance with Japanese laws and regulations.
Notes to Consolidated Financial Statements
(Thousands)Issued Treasury stock
Common stock Common stock
Numbers of shares as of March 31, 2006 ............. 881,425 1,796 Numbers of shares increased (*1) ............................ — 352 Numbers of shares decreased (*2) ........................... — (11)Numbers of shares as of March 31, 2007 ............. 881,425 2,137 Numbers of shares increased (*3) ............................ — 374 Numbers of shares decreased (*4) ........................... — (18)Numbers of shares as of March 31, 2008 ............. 881,425 2,493 Numbers of shares increased (*5) ............................ — 429Numbers of shares decreased (*4) ........................... — (102)Numbers of shares as of March 31, 2009 ............. 881,425 2,820
SUPPLEMENTAL INFORMATION ON THE CONSOLIDATED STATEMENTS OF CHANGES IN NET ASSETS14
(1) Changes in number of shares issued and outstanding during the years ended March 31, 2009, 2008 and 2007 are as follows:(*1) Treasury stock increased due to purchase of odd shares.(*2) Treasury stock decreased due to sale of odd shares and sale of the
Company’s stock held by affiliated company.(*3) Treasury stock increased due to purchase of 242 thousand odd
shares and purchase of 132 thousand shares upon appraisalremedy in connection with absorption of Retail and HotelProperties Co., Ltd. by merger.
(*4) Treasury stock decreased due to sale of odd shares.(*5) Treasury stock increased due to purchase of 313 thousand odd
shares, purchase of 84 thousand shares upon appraisal remedy inconnection with transfer of business from Minato Estate Co., Ltd.and purchase of 31 thousand shares of the Company’s stock byaffiliated company.
srallod .S.U fo sdnasuohTney fo snoilliMdetadilosnoCdetadilosnoC
Company subsidiaries Total Company subsidiaries Total
Type of subscription rights to shares.......................... Stock option — — Stock option — — Balance as of March 31, 2008 ...................................... ¥ 86 — ¥ 86Balance as of March 31, 2009 ...................................... ¥220 — ¥220 $2,240 — $2,240
(2) Information of subscription rights to shares is summarized as follows:
Numbers of shares regarding stock options as of March 31, 2009, 2008 and 2007 and numbers of such shares increased and decreased during the yearsended March 31, 2009 and 2008 are not presented as they are insignificant.

66
(3) Information of dividends is summarized as follows:(a) Dividends paid
The following resolution was approved by the ordinary general shareholders’ meeting held on June 27, 2008, June 28, 2007 and June 29, 2006:6002 ,92 enuJ7002 ,82 enuJ8002 ,72 enuJgniteem ’sredloherahs fo etaDkcots nommoCkcots nommoCkcots nommoCkcots fo epyTnoillim 893,4¥noillim 419,7¥)dnasuoht 224,89$( noillim 866,9¥tnuoma latoT
5¥9¥)211.0$( 11¥tnuoma erahs reP6002 ,13 hcraM7002 ,13 hcraM8002 ,13 hcraMetad droceR
6002 ,03 enuJ7002 ,92 enuJ8002 ,03 enuJetad evitceffE
The following resolution was approved by the board of directors meeting held on October 30, 2008, October 31, 2007 and October 31, 2006:6002 ,13 rebotcO7002 ,13 rebotcO8002 ,03 rebotcOgniteem srotcerid fo draob fo etaD
kcots nommoCkcots nommoCkcots nommoCkcots fo epyTnoillim 893,4¥noillim 119,7¥)dnasuoht 214,89$( noillim 766,9¥tnuoma latoT
5¥9¥)211.0 $( 11¥tnuoma erahs reP6002 ,03 rebmetpeS7002 ,03 rebmetpeS8002 ,03 rebmetpeSetad droceR
6002 ,5 rebmeceD7002 ,4 rebmeceD8002 ,2 rebmeceDetad evitceffE
(b) Dividend whose record date falls within the current fiscal year but to be effective in the following fiscal yearThe following resolution was approved by the ordinary general shareholders’ meeting held on June 26, 2009, June 27, 2008 and June 28, 2007:
7002 ,82 enuJ8002 ,72 enuJ9002 ,62 enuJgniteem ’sredloherahs fo etaDkcots nommoCkcots nommoCkcots nommoCkcots fo epyTnoillim 419,7¥noillim 866,9¥)dnasuoht 293,89$( noillim 566,9¥tnuoma latoT
sgninrae deniateRsgninrae deniateRsgninrae deniateRecruoS9¥11¥)211.0$( 11¥tnuoma erahs reP
7002 ,13 hcraM8002 ,13 hcraM9002 ,13 hcraMetad droceR7002 ,92 enuJ8002 ,03 enuJ9002 ,92 enuJetad evitceffE
STOCK OPTION PLANS15
The following summarize the stock option plans introduced by the Company.Stock option expenses charged to income for the year ended March 31, 2009 and 2008 are as follows:
Millions of yen Thousands of U.S. dollars
2009 2008 2009
Cost of revenue from operations................................................................................... ¥ 43 ¥27 $ 438 Selling, general and administrative expenses.......................................................... 91 59 926
Total ........................................................................................................................................ ¥134 ¥86 $1,364

67
The following table summarizes the contents and activity of stock options as of March 31, 2009 and for the year then ended:
2008 plan 2007 plan
Grantees ............................................................................................................. Directors, corporate officers and group Directors, corporate officers and group........................................................................................................ managing officers; 26 in total (*1) managing officers; 27 in total (*1)
Type of stock and number of shares granted ........................................ 71,250 shares of common stock 48,880 shares of common stockrebmetpeS8002 ,51 tsuguA.............................................................................................etad tnarG 18, 2007
)2*()2*(................................................................................snoitidnoc gnitseVdeificeps toNdeificeps toN........................................................................doirep ecivres etisiuqeR
Exercise period (*2) ............................................................................................. August 16, 2008 – August 15, 2038 September 19, 2007 – September 18, 2037
Non-vested options (number of shares)088,84—.........................................................raey fo gninnigeb ta gnidnatstuO
—052,17.................................................................................................detnarG——...............................................................................................detiefroF——...................................................................................................detseV
088,84052,17...................................................................raey fo dne ta gnidnatstuO
Vested options (number of shares)——.........................................................raey fo gninnigeb ta gnidnatstuO——...................................................................................................detseV——...............................................................................................desicrexE——..................................................................................................deripxE——...................................................................raey fo dne ta gnidnatstuO
neYsrallod .S.UneY
1 ¥10.0 $1 ¥........................................................................................ecirp esicrexE———....................................................etad esicrexe no ecirp kcots egarevA
753,2¥20.02$769,1¥.............................................................................eulav riaf etad-tnarG
(*1) Grantees consist of 6 directors (excluding outside directors), 12 corporate officers (non-directors) and 8 group managing officers for 2008 plan, and 6 directors (excluding outside directors), 13 corporate officers (non-directors) and 8 group managing officers for 2007 plan.
(*2) Vesting conditions and exercise period:Stock options granted are exercisable on the following day of grantees leaving the positions of director, corporate officer or group managing officer, and for 5 years commencing on that date.
(*1) Expected volatility is calculated based on historical stock price for the 15-year period ending on the grant date.(*2) Options are assumed to be exercised at the midpoint of exercise period because of the difficulty to reasonably estimate expected life due to insufficient historical data.(*3) Expected dividend yield is the expected dividend amount for the fiscal year in which the options are granted, estimated as of the grant date.(*4) Risk-free rate represents the interest rate of Japanese government bond whose life corresponds to the expected life of stock options.
The fair value of option was estimated using the Black-Scholes option pricing-model under the following assumptions:
Number of vesting options is estimated based on actual forfeitures due to difficulty in reasonably estimating future forfeitures.
2008 plan 2007 plan
Expected volatility (*1) %53%63............................................................................Expected life (*2) sraey 51sraey 51.....................................................................................Expected dividend (*3) erahs rep 81¥erahs rep )22.0$( 22¥.............................................................................Risk-free rate (*4) %88.1%38.1....................................................................................
Notes to Consolidated Financial Statements
MAJOR COMPONENTS OF INTEREST, DIVIDENDS AND MISCELLANEOUS
Thousands of srallod .S.Uney fo snoilliM
Years ended March 31,, 2009 2008 2007 2009
Interest income..................................................................................................................... ¥ 520 ¥ 660 ¥ 783 $ 5,293Dividend income .................................................................................................................. 2,524 2,163 1,408 25,695Gain on sale of property and equipment .................................................................. — 18,871 17,320 —Gain on sale of investment securities ......................................................................... — 2,869 — —Other ........................................................................................................................................ 6,345 2,946 4,435 64,594
Total ........................................................................................................................................ ¥9,389 ¥27,509 ¥23,946 $95,582
16

68
MAJOR COMPONENTS OF COSTS AND EXPENSES — OTHER
Thousands of srallod .S.Uney fo snoilliM
Years ended March 31, 2009 2008 2007 2009
Loss on disposal of property and equipment .......................................................... ¥ 6,095 ¥ 7,479 ¥ 4,575 $ 62,048Loss on sale of property and equipment ................................................................... — 1,544 9,643 —Impairment loss on investment in affiliated company ........................................ — 12,961 — —Impairment loss on investment securities ................................................................ 17,559 5,417 — 178,754Loss on devaluation of real property for sale ......................................................... — — 28,736 —Other ........................................................................................................................................ 17,514 5,357 9,804 178,296
Total ........................................................................................................................................ ¥41,168 ¥32,758 ¥52,758 $419,098
LEASES
As described in Note 2 (O), effective from the year ended March 31, 2009, the Company and its domestic subsidiaries adopted the new accountingstandards for leases.As lessee:(A) Finance leases
Assets leased under finance leases that do not transfer ownership to the lessee as of March 31, 2009 consist mainly of Parking Facilities (MitsuiRepark). Commencing the year ended March 31, 2009, such assets are capitalized as assets and depreciated under straight-line method, over its lease termassuming no residual value.
Finance leases that do not transfer ownership to the lessee whose commencement day falls on or before March 31, 2008 are accounted for as operatingleases under both the previous and the new accounting standards. Information on such leases is summarized as follows:(1) Pro forma amounts of acquisition cost, accumulated depreciation and net book value at March 31, 2009 and 2008:
Millions of yen
2009 2008
Buildings Machinery Buildings Machinerydnadnadnadna
structures equipment Total structures equipment Total
Acquisition cost............................................................................................................... ¥5,089 ¥2,391 ¥7,480 ¥4,987 ¥13,690 ¥18,677 Accumulated depreciation.......................................................................................... 1,752 1,246 2,998 1,267 6,150 7,417
Net book value ................................................................................................................ ¥3,337 ¥1,145 ¥4,482 ¥3,720 ¥ 7,540 ¥11,260
Thousands of U.S. dollars
2009
Buildings Machineryand and
structures equipment Total
Acquisition cost............................................................................................................... $51,807 $24,341 $76,148 Accumulated depreciation.......................................................................................... 17,835 12,685 30,520
Net book value ................................................................................................................ $33,972 $11,656 $45,628
17
18

69
As lessor:(A) Finance leases
Commencing the year ended March 31, 2009, assets leased under finance leases that do not transfer ownership to the lessee are accounted for as investments in leased assets, which is included in other current assets. Investments in leased assets as of March 31, 2009 consists of the following:
Millions of yen Thousands of U.S. dollars
2009
Minimum lease payments receivable....................................................................... 244,02$800,2¥Unearned lease income ................................................................................................ )410,3()692(
824,71$217,1¥
(2) Future lease payment inclusive of interest at March 31, 2009 and 2008:
Millions of yen Thousands of U.S. dollars
2009 2008 2009
Amount due within one year .......................................................................................... ¥ 900 ¥ 2,677 $ 9,162 Amount due after one year ............................................................................................. 3,582 8,583 36,466
Total ........................................................................................................................................ ¥4,482 ¥11,260 $45,628
(3) Lease expense and the pro forma amount of depreciation expense for the years ended March 31, 2009, 2008 and 2007:
Thousands of srallod .S.Uney fo snoilliM
2009 2008 2007 2009
Lease expense....................................................................................................................... ¥973 ¥2,657 ¥2,172 $9,905 Depreciation expense ........................................................................................................ 973 2,657 2,172 9,905
(4) Calculation of pro forma amount of depreciation expense:Pro forma depreciation amounts are computed using the straight-line method over the lease terms assuming no residual value.
(B) Operating leasesFuture lease payments under non-cancellable operating leases at March 31, 2009 and 2008;
Millions of yen Thousands of U.S. dollars
2009 2008 2009
Amount due within one year .......................................................................................... ¥ 61,974 ¥ 52,082 $ 630,907 Amount due after one year ............................................................................................. 227,708 244,623 2,318,111
Total ........................................................................................................................................ ¥289,682 ¥296,705 $2,949,018
Notes to Consolidated Financial Statements
Amounts of minimum lease payments receivable due in each of the next five years and thereafter as of March 31, 2009 are as follows:
Millions of yen Thousands of U.S. dollars
Year ending March 31 2009
2010..................................................................................................................................... 635,6 $246 ¥2011..................................................................................................................................... 920,54942012..................................................................................................................................... 260,49932013..................................................................................................................................... 249,29822014..................................................................................................................................... 303,1821Thereafter........................................................................................................................... 07565Total ..................................................................................................................................... 244,02$800,2¥

70
For the year ended on and prior to March 31, 2008, finance leases that do not transfer ownership to the lessee were accounted for as operating leases.Information on such leases is summarized as follows:(1) Amounts of acquisition cost, accumulated depreciation and net book value at March 31, 2008:
Millions of yen
2008
Buildings Machineryand and
structures equipment Total
Acquisition cost ................................................................................................... ¥2,276 ¥1,984 ¥4,260 Accumulated depreciation .............................................................................. 1,278 1,247 2,525
Net book value .................................................................................................... ¥ 998 ¥ 737 ¥1,735
(2) Future lease revenue inclusive of interest at March 31, 2008:
Millions of yen
2008
Amount due within one year ......................................................................................................................................... ¥ 541Amount due after one year............................................................................................................................................. 1,207
Total ....................................................................................................................................................................................... ¥1,748
(3) Lease revenue and depreciation expense for the years ended March 31, 2008 and 2007:
Millions of yen
2008 2007
Lease revenue ...................................................................................................................................................................... ¥694 ¥604Depreciation expense........................................................................................................................................................ 583 509
(B) Operating leasesFuture lease revenue under non-cancellable operating leases at March 31, 2009 and 2008:
Millions of yen Thousands of U.S. dollars
2009 2008 2009
Amount due within one year .......................................................................................... ¥ 40,283 ¥ 41,943 $ 410,089 Amount due after one year ............................................................................................. 177,177 223,117 1,803,695
Total ........................................................................................................................................ ¥217,460 ¥265,060 $2,213,784
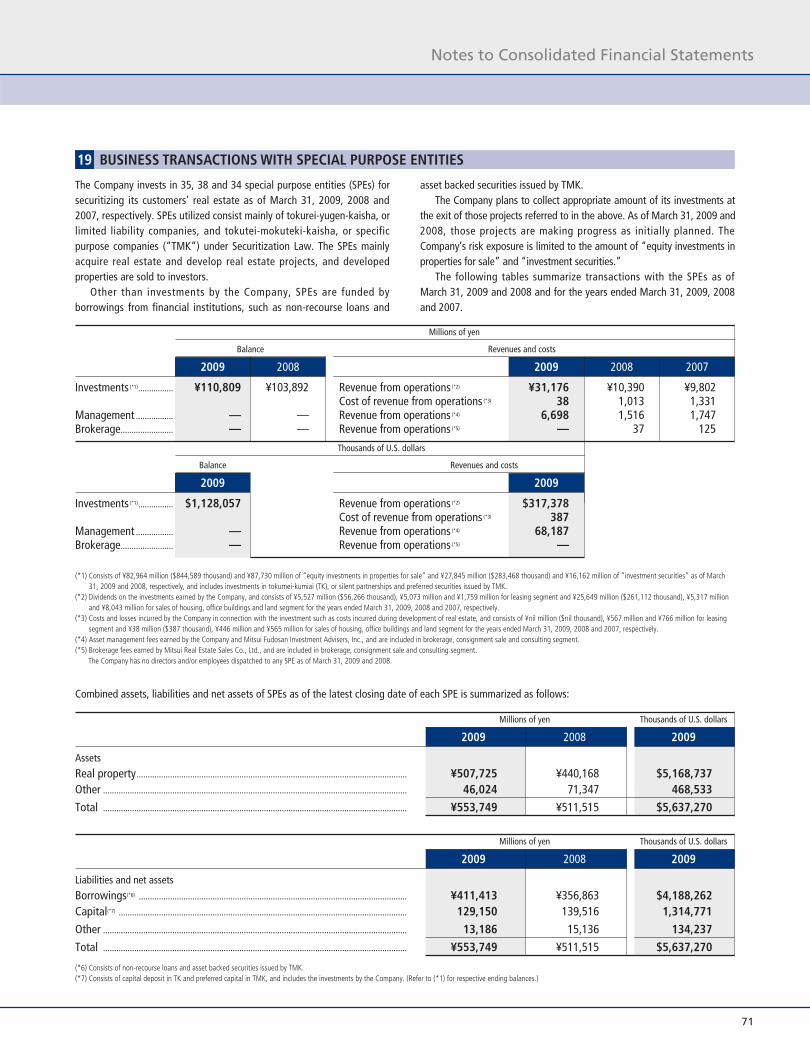
71
BUSINESS TRANSACTIONS WITH SPECIAL PURPOSE ENTITIES19
The Company invests in 35, 38 and 34 special purpose entities (SPEs) forsecuritizing its customers’ real estate as of March 31, 2009, 2008 and2007, respectively. SPEs utilized consist mainly of tokurei-yugen-kaisha, orlimited liability companies, and tokutei-mokuteki-kaisha, or specificpurpose companies (“TMK”) under Securitization Law. The SPEs mainlyacquire real estate and develop real estate projects, and developedproperties are sold to investors.
Other than investments by the Company, SPEs are funded byborrowings from financial institutions, such as non-recourse loans and
asset backed securities issued by TMK.The Company plans to collect appropriate amount of its investments at
the exit of those projects referred to in the above. As of March 31, 2009 and2008, those projects are making progress as initially planned. TheCompany’s risk exposure is limited to the amount of “equity investments inproperties for sale” and “investment securities.”
The following tables summarize transactions with the SPEs as ofMarch 31, 2009 and 2008 and for the years ended March 31, 2009, 2008and 2007.
Millions of yen
stsoc dna seuneveRecnalaB
2009 2008 2009 2008 2007
Investments (*1)................ ¥110,809 ¥103,892 Revenue from operations (*2) ¥31,176 ¥10,390 ¥9,802.................................. Cost of revenue from operations (*3) 38 1,013 1,331Management ................. — — Revenue from operations (*4) 6,698 1,516 1,747Brokerage........................ — — Revenue from operations (*5) — 37 125
Thousands of U.S. dollars
stsoc dna seuneveRecnalaB
90029002
Investments (*1)................ $1,128,057 Revenue from operations (*2) $317,378.................................. Cost of revenue from operations (*3) 387Management ................. — Revenue from operations (*4) 68,187Brokerage........................ — Revenue from operations (*5) —
Combined assets, liabilities and net assets of SPEs as of the latest closing date of each SPE is summarized as follows:
Millions of yen Thousands of U.S. dollars
2009 2008 2009
Assets
Real property......................................................................................................................... ¥507,725 ¥440,168 $5,168,737 Other ........................................................................................................................................ 46,024 71,347 468,533
Total ........................................................................................................................................ ¥553,749 ¥511,515 $5,637,270
(*6) Consists of non-recourse loans and asset backed securities issued by TMK.(*7) Consists of capital deposit in TK and preferred capital in TMK, and includes the investments by the Company. (Refer to (*1) for respective ending balances.)
Millions of yen Thousands of U.S. dollars
2009 2008 2009
Liabilities and net assets
Borrowings(*6) ........................................................................................................................ ¥411,413 ¥356,863 $4,188,262 Capital(*7) ................................................................................................................................. 129,150 139,516 1,314,771
Other ........................................................................................................................................ 13,186 15,136 134,237
Total ........................................................................................................................................ ¥553,749 ¥511,515 $5,637,270
Notes to Consolidated Financial Statements
(*1) Consists of ¥82,964 million ($844,589 thousand) and ¥87,730 million of “equity investments in properties for sale” and ¥27,845 million ($283,468 thousand) and ¥16,162 million of “investment securities” as of March31, 2009 and 2008, respectively, and includes investments in tokumei-kumiai (TK), or silent partnerships and preferred securities issued by TMK.
(*2) Dividends on the investments earned by the Company, and consists of ¥5,527 million ($56,266 thousand), ¥5,073 million and ¥1,759 million for leasing segment and ¥25,649 million ($261,112 thousand), ¥5,317 millionand ¥8,043 million for sales of housing, office buildings and land segment for the years ended March 31, 2009, 2008 and 2007, respectively.
(*3) Costs and losses incurred by the Company in connection with the investment such as costs incurred during development of real estate, and consists of ¥nil million ($nil thousand), ¥567 million and ¥766 million for leasingsegment and ¥38 million ($387 thousand), ¥446 million and ¥565 million for sales of housing, office buildings and land segment for the years ended March 31, 2009, 2008 and 2007, respectively.
(*4) Asset management fees earned by the Company and Mitsui Fudosan Investment Advisers, Inc., and are included in brokerage, consignment sale and consulting segment.(*5) Brokerage fees earned by Mitsui Real Estate Sales Co., Ltd., and are included in brokerage, consignment sale and consulting segment.
The Company has no directors and/or employees dispatched to any SPE as of March 31, 2009 and 2008.

72
Millions of yen
EliminationYear ended March 31, 2009 (1) (2) (3) (4) (5) (6) (7) (8) or Corporate Consolidated
Revenue from operations:
Outside customers ............ ¥ 529,756 ¥396,239 ¥182,074 ¥75,195 ¥102,491 ¥ 69,115 ¥52,318 ¥11,758 ¥ — ¥1,418,946
Inter-segment .................... 8,701 11 4,956 3,372 35,703 36,427 462 10,172 (99,804) —
............................... 538,457 396,250 187,030 78,567 138,194 105,542 52,780 21,930 (99,804) 1,418,946
Costs and expenses (*1) ...... 438,928 347,639 184,299 60,416 122,620 104,119 53,572 17,319 (81,514) 1,247,398
Operating income (loss) .... ¥ 99,529 ¥ 48,611 ¥ 2,731 ¥18,151 ¥ 15,574 ¥ 1,423 ¥ (792) ¥ 4,611 ¥ (18,290) ¥ 171,548
Assets .................................. ¥2,318,875 ¥923,258 ¥ 50,818 ¥57,908 ¥ 79,916 ¥ 44,053 ¥95,550 ¥23,865 ¥164,144 ¥3,758,387
Depreciation ....................... 36,447 1,205 3,072 976 1,308 962 3,155 677 1,089 48,891
Capital expenditures ......... 148,811 2,335 1,832 1,138 1,783 653 4,698 440 3,334 165,024
Millions of yen
EliminationYear ended March 31, 2008 (1) (2) (3) (4) (5) (6) (7) (8) or Corporate Consolidated
Revenue from operations:
Outside customers ............ ¥ 469,000 ¥382,267 ¥188,659 ¥84,269 ¥102,464 ¥ 72,975 ¥49,745 ¥10,644 ¥ — ¥1,360,023
Inter-segment .................... 8,228 — 5,678 4,196 28,573 35,995 315 10,263 (93,248) —
............................... 477,228 382,267 194,337 88,465 131,037 108,970 50,060 20,907 (93,248) 1,360,023
Costs and expenses (*1) ...... 386,562 324,457 192,437 61,870 115,540 107,800 49,791 17,003 (74,720) 1,180,740
Operating income ............. ¥ 90,666 ¥ 57,810 ¥ 1,900 ¥26,595 ¥ 15,497 ¥ 1,170 ¥ 269 ¥ 3,904 ¥ (18,528) ¥ 179,283
Assets .................................. ¥2,288,640 ¥824,969 ¥ 53,846 ¥68,060 ¥ 73,293 ¥ 46,072 ¥88,312 ¥24,000 ¥167,297 ¥3,634,489
Depreciation ....................... 31,426 878 2,366 986 1,225 1,024 3,298 2,246 855 44,304
Capital expenditures ......... 319,487 2,848 2,917 1,710 1,863 877 6,207 2,501 2,053 340,463
SEGMENT INFORMATION20
(1) LeasingLeasing of office buildings, commercial facilities, residential properties, etc.
(2) Sales of Housing, Office Buildings and LandSales of detached housing, condominiums, buildings, and land, etc.
(3) ConstructionConstruction of detached housing, apartments, etc. (including planningand design).
(4) Brokerage, Consignment Sales and ConsultingReal estate agency, sales agency, and sales consignment services, as wellas project management services for development of office buildings,commercial facilities, etc., and asset management services for investors.
(5) Property ManagementProperty management services (including tenant improvement).
(6) Sales of Housing Materials and MerchandiseManufacture and sales of housing materials, as well as wholesale andretail sale of general goods.
(7) Facility OperationsOperation of hotels and golf courses, etc.
(8) OtherFinancing operations for housing loans and leasing business, etc.

73
Millions of yen
EliminationYear ended March 31, 2007 (1) (2) (3) (4) (5) (6) (7) (8) or Corporate Consolidated
Revenue from operations:
Outside customers ............ ¥ 398,070 ¥341,630 ¥193,970 ¥77,350 ¥ 99,632 ¥ 69,395 ¥40,201 ¥ 8,946 ¥ — ¥1,229,194
Inter-segment .................... 6,399 8 5,897 4,646 23,161 37,128 332 10,328 (87,899) —
............................... 404,469 341,638 199,867 81,996 122,793 106,523 40,533 19,274 (87,899) 1,229,194
Costs and expenses (*1) ...... 323,119 292,398 197,149 55,946 108,485 105,666 38,779 16,464 (70,655) 1,067,351
Operating income ............. ¥ 81,350 ¥ 49,240 ¥ 2,718 ¥26,050 ¥ 14,308 ¥ 857 ¥ 1,754 ¥ 2,810 ¥ (17,244) ¥ 161,843
Assets .................................. ¥1,970,251 ¥732,668 ¥ 59,032 ¥51,794 ¥ 69,050 ¥ 50,694 ¥84,858 ¥22,567 ¥253,276 ¥3,294,190
Depreciation ....................... 29,137 559 2,168 772 891 907 2,628 2,249 811 40,122
Capital expenditures ......... 203,955 2,918 2,528 1,282 1,743 1,222 2,038 2,095 2,575 220,356
Thousands of U.S. dollars
EliminationYear ended March 31, 2009 (1) (2) (3) (4) (5) (6) (7) (8) or Corporate Consolidated
Revenue from operations:Outside customers .............. $ 5,393,016 $4,033,788 $1,853,548 $765,499 $1,043,378 $ 703,640 $532,607 $119,699 $ — $14,445,139 Inter-segment ...................... 88,578 112 50,453 34,328 363,463 370,834 4,703 103,553 (1,016,024) —
5,481,594 4,033,900 1,904,001 799,827 1,406,841 1,074,438 537,310 223,252 (1,016,024) 14,445,139 Costs and expenses (*1) ........ 4,468,370 3,539,031 1,876,199 615,046 1,248,295 1,059,952 545,373 176,311 (829,829) 12,698,748
Operating income ............... $ 1,013,224 $ 494,869 $ 27,802 $184,781 $ 158,546 $ 14,486 $ (8,063)
Assets .................................... $23,606,587 $9,398,941 $ 517,337 $589,514 $ 813,560 $ 448,468 $972,717 $242,950 $ 1,671,017 $38,261,091 Depreciation ........................ 371,037 12,267 31,274 9,936 13,316 9,793 32,119 6,892 11,086 497,720 Capital expenditures .......... 1,514,924 23,771 18,650 11,585 18,151 6,648 47,827 4,479 33,941 1,679,976
(*1) Includes cost of revenue from operations and selling, general and administrative expenses.
Japan area accounted for more than 90% of the consolidated revenue of all segments and the total amount of segment assets. Consequently, disclosureof segment information by geographic area has been omitted.
Overseas sales accounted for less than 10% of the consolidated revenue. Consequently, disclosure of overseas sales information has been omitted.
CONTINGENT LIABILITIES
Contingent liabilities at March 31, 2009 and 2008 are as follows:
Millions of yen Thousands of U.S. dollars
2009 2008 2009
Loans guaranteed................................................................................................................ ¥68,706 ¥81,606 $699,440
SUBSEQUENT EVENTS
21
22
There were no applicable items under this category.
Notes to Consolidated Financial Statements
$ 46,941 $ (186,195) $ 1,746,391

74
Independent Auditors’ Report
To the Board of Directors of
Mitsui Fudosan Co., Ltd.:
We have audited the accompanying consolidated balance sheets of Mitsui Fudosan Co., Ltd. and consolidated
subsidiaries as of March 31, 2009 and 2008, and the related consolidated statements of income, changes in net
assets and cash flows for each of the three years in the period ended March 31, 2009, expressed in Japanese yen.
These consolidated financial statements are the responsibility of the Company’s management. Our responsibility is
to independently express an opinion on these consolidated financial statements based on our audits.
We conducted our audits in accordance with auditing standards generally accepted in Japan. Those standards
require that we plan and perform the audit to obtain reasonable assurance about whether the financial statements
are free of material misstatement. An audit includes examining, on a test basis, evidence supporting the amounts
and disclosures in the financial statements. An audit also includes assessing the accounting principles used and
significant estimates made by management, as well as evaluating the overall financial statement presentation. We
believe that our audits provide a reasonable basis for our opinion.
In our opinion, the consolidated financial statements referred to above present fairly, in all material respects, the
consolidated financial position of Mitsui Fudosan Co., Ltd. and subsidiaries as of March 31, 2009 and 2008, and the
consolidated results of their operations and their cash flows for each of the three years in the period ended March
31, 2009, in conformity with accounting principles generally accepted in Japan.
Without qualifying our opinion, we draw attention to the following:
As discussed in Note 2 (G) to the consolidated financial statements, effective April 1, 2006, Mitsui Fudosan Co., Ltd.
and its consolidated domestic subsidiaries adopted a new accounting standard for measurement of inventories.
The U.S. dollar amounts in the accompanying consolidated financial statements with respect to the year ended
March 31, 2009 are presented solely for convenience. Our audit also included the translation of yen amounts into
U.S. dollar amounts and, in our opinion, such translation has been made on the basis described in Note 1 to the
consolidated financial statements.
Tokyo, Japan
June 26, 2009

75
ContentsOverview of Development Projects............................................ 76
Domestic and Overseas Networks .............................................. 80
The History of Mitsui Fudosan.................................................... 82
Investor Information................................................................... 83
Corporate Information
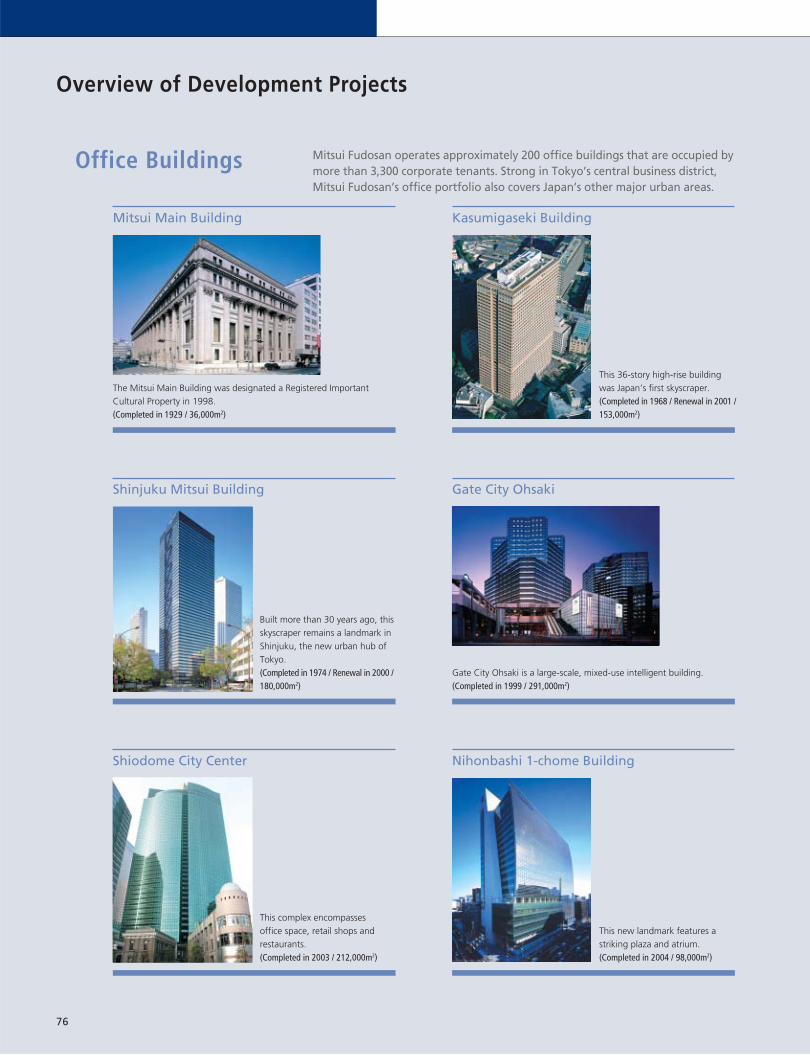
Office Buildings
The Mitsui Main Building was designated a Registered ImportantCultural Property in 1998.(Completed in 1929 / 36,000m2)
Mitsui Main Building
Mitsui Fudosan operates approximately 200 office buildings that are occupied bymore than 3,300 corporate tenants. Strong in Tokyo’s central business district,Mitsui Fudosan’s office portfolio also covers Japan’s other major urban areas.
This 36-story high-rise buildingwas Japan’s first skyscraper.(Completed in 1968 / Renewal in 2001 /153,000m2)
Kasumigaseki Building
Gate City Ohsaki is a large-scale, mixed-use intelligent building.(Completed in 1999 / 291,000m2)
Gate City Ohsaki
Built more than 30 years ago, thisskyscraper remains a landmark inShinjuku, the new urban hub ofTokyo.(Completed in 1974 / Renewal in 2000 /180,000m2)
Shinjuku Mitsui Building
This new landmark features astriking plaza and atrium.(Completed in 2004 / 98,000m2)
Nihonbashi 1-chome Building
This complex encompasses office space, retail shops andrestaurants.(Completed in 2003 / 212,000m2)
Shiodome City Center
76
Overview of Development Projects

Retail Facilities Mitsui Fudosan operates approximately 60 retail facilities throughout Japan,including regional malls, factory outlet malls and urban facilities.
Combines office, retail and residential facilities.(Completed in 2007 / 569,000m2)
Tokyo Midtown
A 39-story high-rise combiningoffice space with the MandarinOriental Hotel.(Completed in 2005 / 130,000m2)
Nihonbashi Mitsui Tower
A mixed-use skyscraper located inone of Tokyo’s most prestigiousbusiness districts.(Completed in 2008 / 218,000m2)
Akasaka Biz Tower
Japan’s tallest office building isconveniently integrated withTokyo Station.(Completed in 2007 / 195,000m2)
GranTokyo North Tower
The first large-scale suburban shopping center in Japan.(Opened in 1981 / 282,000m2 / 540 stores)
LaLaport Tokyo-Bay
A large-scale shopping center adjacent to a 667-unit residential building.(Opened in 2006 / 172,000m2 / 300 stores)
Lazona Kawasaki Plaza
77

Housing Quality and value are the hallmarks of the condominiums and detachedhouses that Mitsui Fudosan develops for sale and lease.
Two high-rise condominium towers – Mid Sky Tower and StationForest Tower – in a pleasant suburban location.(Completed in 2009 / 1,437 units)
Park City Musashi Kosugi
A high-rise condominium tower with advanced security facilities in the heart of Tokyo. (Completed in 2008 / 231 units)
Park Court Toranomon Atago Tower
A fashion outlet mall in Kobe where shoppers can gaze out on thebeautiful Akashi-Kaikyo bridge.(Opened in 1999 / 36,000m2 / 130 stores)
Mitsui Outlet Park Marine Pia Kobe
Select shops abound in this high-quality retail facility for urbanites inTokyo’s Ginza district.(Opened in 2007 / 14,000m2 / 30 stores)
Ginza Velvia-kan
78
One of the largest shopping centers in Kanagawa Prefecture.(Opened in 2007 / 227,000m2 / 280 stores)
LaLaport Yokohama
The largest outlet mall in Japan’s Tokai region.(Opened in 2002 / 45,000m2 / 190 stores)
Mitsui Outlet Park Jazz Dream Nagashima

Overview of Development Projects
Other Hotels and serviced apartments are other areas of the real estate market inwhich Mitsui Fudosan has a presence.
A luxury hotel on Waikiki Beach in Honolulu, Hawaii, the Halekulani Hotel is known for comfort and fine service.(Opened in 1984 / 453 rooms)
Halekulani Hotel
The Japan debut of the top-of-the-line Premier series of the Oakwood line of serviced apartments.(Completed in 2007 / 107 units)
Oakwood Premier Tokyo Midtown
A high-rise condominium tower onthe Tokyo waterfront that offersoutstanding convenience and comfort.(Completed in 2009 / 825 units)
THE TOYOSU TOWER
A housing development featuring energy-conserving construction and security equipment.(Completion scheduled for FY2009 / 268 units)
Fine Court LaLaCity
The Garden Hotel chain operatesapproximately 3,100 hotel roomsat 12 locations throughout Japan.(Completed in 2005 / 361 rooms)
Mitsui Garden Hotel Ginza Premier
79

Hokkaido Branch
Tohoku Branch
HEAD OFFICE
Chiba Branch
Yokohama Branch
Kyushu Branch
Chubu Branch
Mitsui Fudosan(U.K.) Ltd.
Kyoto Branch
Kansai Head Office
Chugoku Branch
Kyoto BranchKyoto Mitsui Building8 Naginataboko-cho, Shijodori-Karasuma,Higashiiru, Shimogyo-ku,Kyoto-shi, Kyoto 600-8008
Chugoku BranchNakamachi Mitsui Building9-12, Nakamachi, Naka-ku,Hiroshima-shi, Hiroshima730-0037
Kyushu BranchHakata Mitsui Building10-1, Kami Gofuku-machi, Hakata-ku,Fukuoka-shi, Fukuoka812-0036
Chiba BranchChiba Chuo Twin Building No.111-1, Chuo 1-chome, Chuo-ku,Chiba-shi, Chiba260-0013
Yokohama BranchYokohama Creation Square5-1, Sakae-cho, Kanagawa-ku, Yokohama-shi, Kanagawa221-0052
Chubu BranchRyoshin Building8-12, Meieki 4-chome, Nakamura-ku, Nagoya-shi, Aichi450-0002
Kansai Head OfficeMidosuji Mitsui Building1-3, Bingo-machi 4-chome, Chuo-ku, Osaka-shi, Osaka541-0051
Hokkaido BranchSapporo HS Building10-2, Kitasanjyo Nishi 2-chome, Chuo-ku,Sapporo-shi, Hokkaido060-0003
Tohoku BranchSendai Honcho Mitsui Building4-6, Honcho 2-chome, Aoba-kuSendai-shi, Miyagi 980-0014
1-1, Nihonbashi-Muromachi 2-chome,Chuo-ku, Tokyo 103-0022
BRANCH OFFICES
HEAD OFFICE
Domestic Network
80
Domestic and Overseas Networks
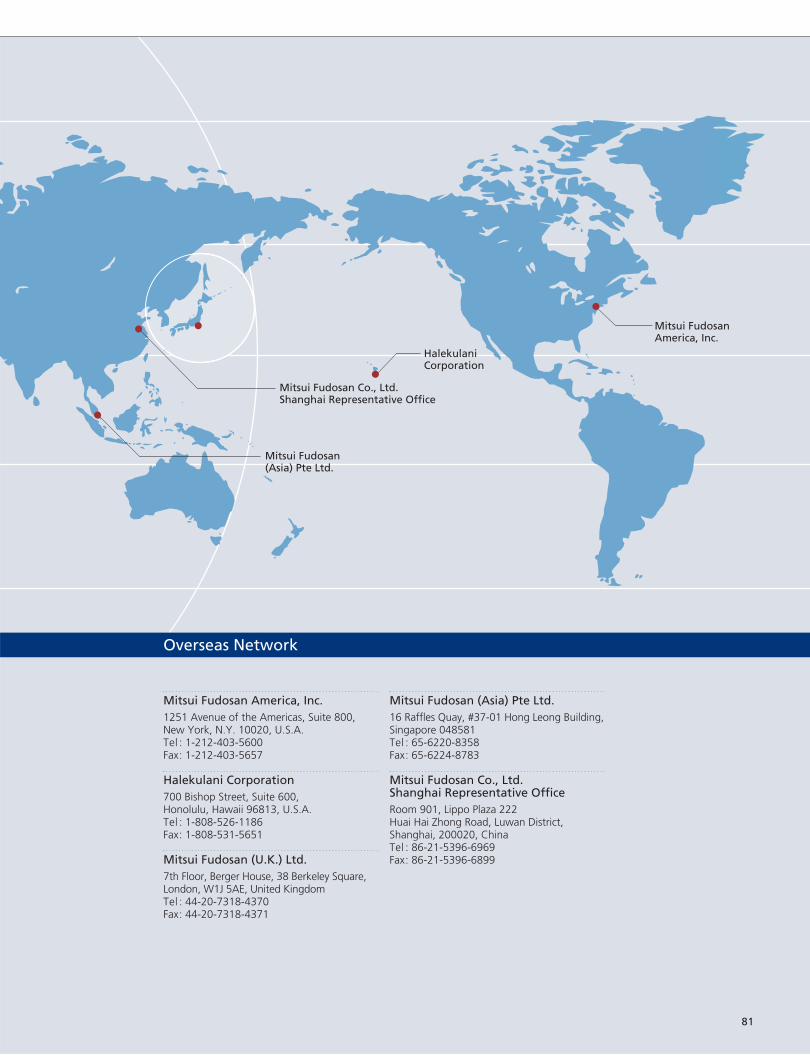
HalekulaniCorporation
Mitsui Fudosan(Asia) Pte Ltd.
Mitsui FudosanAmerica, Inc.
Mitsui Fudosan Co., Ltd.Shanghai Representative Office
Mitsui Fudosan (Asia) Pte Ltd.16 Raffles Quay, #37-01 Hong Leong Building,Singapore 048581Tel : 65-6220-8358Fax: 65-6224-8783
Mitsui Fudosan Co., Ltd.Shanghai Representative OfficeRoom 901, Lippo Plaza 222 Huai Hai Zhong Road, Luwan District,Shanghai, 200020, ChinaTel : 86-21-5396-6969Fax: 86-21-5396-6899
Mitsui Fudosan America, Inc.1251 Avenue of the Americas, Suite 800,New York, N.Y. 10020, U.S.A.Tel : 1-212-403-5600Fax: 1-212-403-5657
Halekulani Corporation700 Bishop Street, Suite 600,Honolulu, Hawaii 96813, U.S.A.Tel : 1-808-526-1186Fax: 1-808-531-5651
Mitsui Fudosan (U.K.) Ltd.7th Floor, Berger House, 38 Berkeley Square,London, W1J 5AE, United KingdomTel : 44-20-7318-4370Fax: 44-20-7318-4371
Overseas Network
81

Shinjuku Mitsui Building
Nihonbashi in the Edo Period
Yokohama Bayside MarinaShops and Restaurants(now Mitsui Outlet Park
Yokohama Bayside)
LaLaport Funabashi(now LaLaport Tokyo-Bay)
LaLaport Koshien
Mitsui Outlet Park Iruma
Tokyo Park Tower
Park City Honmoku
Yurigaoka
Park Axis Nihonbashi
Shiodome City Center
Nihonbashi Mitsui Tower
82
Retail FacilitiesOffice Buildings Housing
• Opening of the Echigo-ya clothing store in Nihonbashi byTakatoshi Mitsui, founder of the House of Mitsui
• Completion of Mitsui Main Building (Chuo-ku, Tokyo)
• Establishment of Mitsui Fudosan Co., Ltd.
• Completion of Hibiya Mitsui Building(Chiyoda-ku, Tokyo)
• Completion of Kasumigaseki Building (Minato-ku, Tokyo), the first skyscraper in Japan
• Start of development and sale of condominiums
• Completion of Shinjuku Mitsui Building (Shinjuku-ku, Tokyo)
• Opening of Japan’s first large-scale regional shopping center, LaLaport Funabashi, now called LaLaport Tokyo-Bay(Funabashi-shi, Chiba Prefecture)
• Acquired Exxon Building, now called 1251 Avenue of theAmericas (New York City, U.S.A.)
• Formation of consortium with overseas financial institutionand successful bid for the site of Shiodome City Center(Minato-ku, Tokyo)
• Opening of a factory outlet mall, Yokohama Bayside MarinaShops and Restaurants, now called Mitsui Outlet ParkYokohama Bayside (Yokohama-shi, Kanagawa Prefecture),using a fixed-term leasehold
• Acquisition of Shin Nikko Building (Minato-ku, Tokyo), initiating joint investment business with investors using asecuritization scheme
• Acquisition of Japan Landic portfolio, initiating value-enhanced fund business
• Listing of Japan’s first real estate investment trust (J-REIT), Nippon Building Fund, Inc.
• Formation of consortium with domestic investors and successful bid for the former Defense Agency site inRoppongi, Tokyo (now called Tokyo Midtown)
• Completion of Shiodome City Center (Minato-ku, Tokyo)
• Completion of Nihonbashi Mitsui Tower (Chuo-ku, Tokyo)• Establishment of Mitsui Fudosan Residential Co., Ltd.
• Opening of Lazona Kawasaki Plaza (Kawasaki-shi, KanagawaPrefecture), Urban Dock LaLaport Toyosu (Koto-ku, Tokyo)and LaLaport Kashiwanoha (Kashiwa-shi, Chiba Prefecture)
• Opening of LaLaport Yokohama (Yokohama-shi, KanagawaPrefecture) and Tokyo Midtown (Minato-ku, Tokyo)
• Establishment of New Challenge Plan 2016, Mitsui FudosanGroup’s long-term business strategy
• Completion of GranTokyo North Tower (Chiyoda-ku, Tokyo)
• Opening of Akasaka Biz Tower (Minato-ku, Tokyo), Mitsui Outlet Park Iruma (Iruma-shi, Saitama Prefecture) andMitsui Outlet Park Sendai Port (Sendai-shi, Miyagi Prefecture)
1673
1929
1941
1960
1968
1974
1981
1986
1997
1998
1999
2001
2003
2005
2006
2007
2008
The History of Mitsui Fudosan

0
1,000
2,000
3,000
4,000
0
500
1,000
1,500
2,000
0
300,000
200,000
100,000
Monthly Stock Data (TSE):
Common stock price range (¥)Tokyo Price Index Close
FY2005 Mar. 06 Apr. 06Apr. 05 Mar. 07 Apr. 07FY2006 FY2007 FY2008
Topix
Mar. 08 Mar. 09Apr. 08
Monthly stock price range (¥)
Monthly trading volume (thousand shares)
Head Office:1-1, Nihonbashi-Muromachi 2-chome, Chuo-ku, Tokyo,103-0022, Japan
Date of Establishment:July 15, 1941
Common Stock:¥174,296 million
Listings:Tokyo, Osaka (Ticker: 8801)
Number of Shares:Authorized: 3,290,000,000Issued and outstanding: 881,424,727
Number of Shareholders:37,798
Transfer Agent:The Chuo Mitsui Trust and BankingCompany, Limited
Number of Employees:1,154 (Consolidated 15,476)
URL:http://www.mitsuifudosan.co.jp/english
E-mail:[email protected]
Mitsui Fudosan Co., Ltd.
Securities Companies 1.10%
Other Japanese Companies 7.98%
Individuals 6.23%
Foreign Investors47.52%
Financial Institutions37.17%
Composition of Shareholders:Major Shareholders: Number of Percentage ofshares held total shares(Thousands) in issue
The Master Trust Bank of Japan, Ltd. (Trust account) 64,875 7.36Japan Trustee Services Bank, Ltd. (Trust account) 59,220 6.72Japan Trustee Services Bank, Ltd. (Trust account 4G) 46,022 5.22The Chuo Mitsui Trust & Banking Co., Ltd. 21,965 2.49State Street Bank and Trust Company 505041 20,948 2.38Sumitomo Mitsui Banking Corporation 18,546 2.10State Street Bank and Trust Company 15,616 1.77State Street Bank and Trust Company 505225 14,957 1.70The Chase Manhattan Bank NA London SL Omnibus Account 14,407 1.63Kajima Corporation 13,362 1.52
Total 289,922 32.89
83
Investor Information (Parent company; as of March 31, 2009)

This annual report is printed on a combination of 70% recycled paper and 30% fresh pulp made with consideration for the environment.
This report was produced in August 2009.Printed in Japan


