Page 1
University of Central Florida University of Central Florida
STARS STARS
Electronic Theses and Dissertations
2017
Quality by Design Procedure for Continuous Pharmaceutical Quality by Design Procedure for Continuous Pharmaceutical
Manufacturing: An Integrated Flowsheet Model Approach Manufacturing: An Integrated Flowsheet Model Approach
Ashley Vezina University of Central Florida
Part of the Industrial Engineering Commons
Find similar works at: https://stars.library.ucf.edu/etd
University of Central Florida Libraries http://library.ucf.edu
This Masters Thesis (Open Access) is brought to you for free and open access by STARS. It has been accepted for
inclusion in Electronic Theses and Dissertations by an authorized administrator of STARS. For more information,
please contact [email protected] .
STARS Citation STARS Citation Vezina, Ashley, "Quality by Design Procedure for Continuous Pharmaceutical Manufacturing: An Integrated Flowsheet Model Approach" (2017). Electronic Theses and Dissertations. 5690. https://stars.library.ucf.edu/etd/5690
Page 2
QUALITY BY DESIGN PROCEDURE FOR CONTINUOUS PHARMACEUTICAL MANUFACTURING: AN INTEGRATED FLOWSHEET MODEL APPROACH
by
ASHLEY VEZINA B.S. Florida Institute of Technology, 2016
A thesis submitted in partial fulfillment of the requirements for the Master of Science in Industrial Engineering
in the Department of Industrial Engineering and Management Systems in the College of Engineering and Computer Science
at the University of Central Florida Orlando, Florida
Fall Term 2017
Page 3
ii
©2017 Ashley Vezina
Page 4
iii
ABSTRACT
Pharmaceutical manufacturing is crucial to global healthcare and requires a higher, more
consistent level of quality than any other industry. Yet, the traditional pharmaceutical batch
manufacturing has remained largely unchanged in the last fifty years due to high R&D costs,
shorter patent durations, and regulatory uncertainty. This has led regulatory bodies to promote
modernization of manufacturing process to continuous pharmaceutical manufacturing (CPM) by
introducing new methodologies including quality by design, design space, and process analytical
technology (PAT). This represents a shift away from the traditional pharmaceutical
manufacturing way of thinking towards a risk based approach that promotes increased product
and process knowledge through a data-rich environment. While both literature and regulatory
bodies acknowledge the need for modernization, manufacturers have been slow to modernize
due to uncertainty and lack of confidence in the applications of these methodologies. This paper
aims to describe the current applications of QbD principles in literature and the current
regulatory environment to identify gaps in literature through leveraging regulatory guidelines
and CPM literature. To aid in closing the gap between QbD theory and QbD application, a QbD
algorithm for CPM using an integrated flowsheet models is also developed and analyzed. This
will help to increase manufacturing confidence in CPM by providing answers to questions about
the CPM business case, applications of QbD tools, process validation and sensitivity, and process
and equipment characteristics. An integrated flowsheet model will aid in the decision-making
process and process optimization, breaking away from ex silico methods extensively covered in
literature.
Page 5
iv
I would like to dedicate this thesis to my family and fiancé who have always been my support
system and motivation.
Page 6
v
ACKNOWLEDGMENTS
I would like to thank my research advisor, Dr. Ahmed Elshennawy, for sharing
his passion of quality and providing support and guidance throughout my graduate career and
this research. I am also very grateful for my parents, family, and friends who have shown their
continued love and encouragement. Lastly, I would also like to extend my gratitude to the faculty
and staff in the Department of Industrial Engineering and Management Systems at the University
of Central Florida (UCF) who have passionately shared their knowledge and contributed to my
education and personal growth.
Page 7
vi
TABLE OF CONTENTS
LIST OF FIGURES ........................................................................................................... ix
LIST OF TABLES .............................................................................................................. x
LIST OF ACRONYMS AND ABREVIATIONS ............................................................. xi
CHAPTER ONE: INTRODUCTION ................................................................................. 1
The Definition of Quality Applied to the Pharmaceutical Industry ................................ 1
Background on Motivation for CPM .............................................................................. 5
CPM Quality Tools ......................................................................................................... 9
Problem Statement ........................................................................................................ 10
Research Objectives ...................................................................................................... 10
Research Questions ....................................................................................................... 11
Contributions ................................................................................................................. 12
Thesis Outline ............................................................................................................... 13
CHAPTER TWO: LITERATURE REVIEW ................................................................... 14
Introduction ................................................................................................................... 14
CPM Manufacturing Opportunities Compared to Batch Processes .............................. 14
CMP Process Characteristics ..................................................................................... 15
CPM Supply Chain .................................................................................................... 17
Decreased Footprint .................................................................................................. 18
Current Regulatory Environment .................................................................................. 21
Regulation Considerations ........................................................................................ 22
Page 8
vii
International Council for Harmonization of Technical Requirements for
Pharmaceuticals for Human Use Guidelines ............................................................. 24
United States Food and Drug Administration Guidelines ......................................... 25
Quality Assurance ......................................................................................................... 29
Quality by Testing ......................................................................................................... 30
Quality by Design.......................................................................................................... 31
Product Design: Target Product Profile and Critical Quality Attributes .................. 33
Process Design: Critical Process Parameters and Critical Material Attributes ........ 34
Process and Process Understanding: Quality by Design Tools .................................... 38
Risk Assessment and Management ........................................................................... 38
Design Space ............................................................................................................. 40
Design of Experiments .............................................................................................. 41
Level 0: Mapping ................................................................................................... 42
Level 1: Factorial DoEs and Response Surfaces ................................................... 42
Level 2 : First Principle Approach ......................................................................... 44
Level 3: Multivariate Statistical Process Control .................................................. 44
Process Control: Process Analytical Technology ......................................................... 45
Process Analytical Technology Tools ....................................................................... 48
Level 0: Tight Specifications and CMA and CPP Constraints .............................. 48
Level 1: End Product Testing ................................................................................ 49
Level 2: Active Process Control Systems .............................................................. 49
Page 9
viii
Relationship between Control Strategy, PAT, RTRT, and QbD .................................. 50
Batch and Quality by Design vs. CPM and Quality by Testing Overview ................... 51
CHAPTER 3: RESEARCH METHODS .......................................................................... 54
Research Methodology .................................................................................................. 55
Research Gap Analysis.................................................................................................. 56
Research Ideas ............................................................................................................... 58
CHAPTER 4: FINDINGS ................................................................................................ 59
Integrated Flowsheet Models ........................................................................................ 59
Aspen Plus Software ................................................................................................. 61
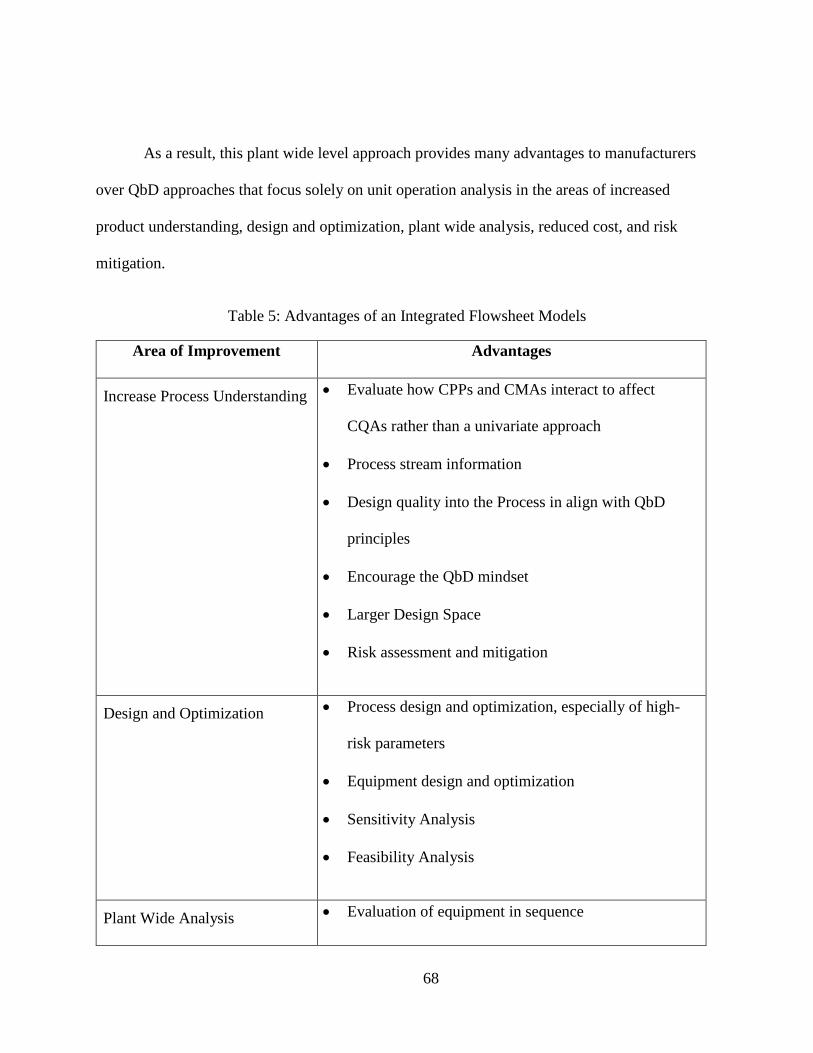
Applications of an Integrated Flowsheet Models for CPM Quality Systems ............... 62
Benefits and Advantages ............................................................................................... 67
QbD Integrated Flowsheet Algorithm ........................................................................... 70
Potential Regulatory Implications ................................................................................. 78
CHAPTER 5: CONCLUSION ......................................................................................... 80
Recommendations ......................................................................................................... 80
Future Research ............................................................................................................. 81
Conclusion ..................................................................................................................... 82
LIST OF REFERENCES .................................................................................................. 84
Page 10
ix
LIST OF FIGURES
Figure 1: Block Flow Diagram a fluidized bed unit of operation and identification of
possible CMAs, CPPs, and CQA ................................................................................ 38
Figure 2: Research Methods and Approach ...................................................................... 54
Figure 3: Applications of an integrated flowsheet models to different stages of product
and process development ............................................................................................ 66
Figure 4: Process flow diagram for the application of QbD for CPM using integrated
flowsheet models as the central method ..................................................................... 70
Figure 5: QbD Algorithm for CPM using integrated flowsheet models as the central
method......................................................................................................................... 74
Figure 6: Blue and Yellow Section of QbD Algorithm for CPM using integrated
flowsheet models as the central method ..................................................................... 75
Figure 7: Red Section of QbD Algorithm for CPM using integrated flowsheet models as
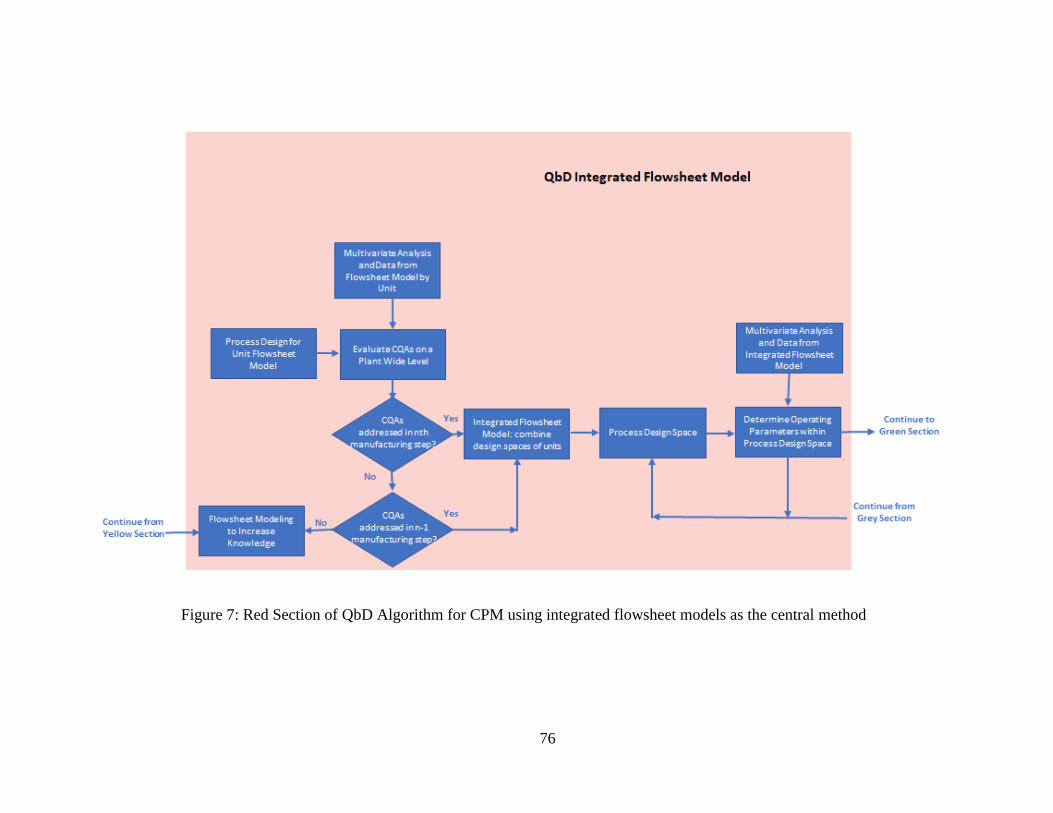
the central method ....................................................................................................... 76
Figure 8: Green, Orange, and Grey Section of QbD Algorithm for CPM using integrated
flowsheet models as the central method ..................................................................... 77
Page 11
x
LIST OF TABLES
Table 1: CPM Manufacturing Features and Benefits Over Batch Processing .................. 20
Table 2: Guidance, Regulation, and Statute Applications to CPM Lifecycle .................. 28
Table 3: An example of linking CPPs to CQAs to increase product and process
understanding .............................................................................................................. 36
Table 4: Batch processing and QbT Approach compared to CPM and QbD approach for
different stages of a product’s lifecycle ...................................................................... 52
Table 5: Advantages of an Integrated Flowsheet Models ................................................. 68
Page 12
xi
LIST OF ACRONYMS AND ABREVIATIONS
API Active Pharmaceutical Ingredient
cGMP Current Good Manufacturing Practices
CMA Critical Material Attributes
CPM Continuous Pharmaceutical Manufacturing
CPP Critical Process Parameters
CQA Critical Quality Attributes
CSTR Continuous Stir Tank Reactor
DoE Design of Experiments
DP Drug Product
FDA United Stated Food and Drug Administration
FMEA Failure Mode Effect Analysis
FMECA Failure, Mode, Effects, and Criticality Analysis
FTA Fault Tree Analysis
ICH International Council for Harmonization
ISO International Organization of Standardization
MA Material Attributes
MSPC Multivariate Statistical Process Control
NCPP Non-Critical Process Parameters
NVA Nonvalue Added
PAT Process Analytical Tools
PCA Principle Component Analysis
Page 13
xii
PFR Plug Flow Reactor
PHA Preliminary Hazard Analysis
PLS Partial Least Squares
PP Process Parameters
QA Quality Attributes
QbD Quality by Design
QTPP Quality Target Product Profile
R&D Research and Development
RPN Risk Priority Number
UPP Unidentified Process Parameters
Page 14
1
CHAPTER ONE: INTRODUCTION
The Definition of Quality Applied to the Pharmaceutical Industry
Initial motivation for the development of quality came from poor quality products
being administered to the public. Initial quality experts were primarily chemists who focused on
impurities and toxic substance through end product testing (Sklamberg, 2013). However, while
the pharmaceutical industry recognized the importance of providing the world with high quality
drug products (DP), a definition of quality as it applies to the pharmaceutical industry was still
missing. Consequently, what quality looked like and how it was to be achieved still largely
remained an abstract concept. Thus, varying ideas on how to define and test for quality in the
pharmaceutical industry has developed (Woodcock, 2004).
Woodcock (2004) primarily defined pharmaceutical quality as a DP that was free of
contamination and able to provide the therapeutic benefits as described on the label and through
clinical trials. Thus, this concept of pharmaceutical quality requires a drug to be able to be used
for the intended therapeutic use, be safe to use, and must meet all customer expectations.
Pharmaceutical quality can then be stated as a function of the DP, excipients, and the
manufacturing processes involved.
This idea is further echoed in the Management Science for Health (2012) who defines
pharmaceutical quality as a product’s ability to comply with five major categories: identity,
purity, strength of potency, uniformity of dosage form, and bioavailability. As a result,
pharmaceutical quality is defined by the quality risks by linking drug attributes to critical clinical
attributes or expected therapeutic benefits. Identity is simply that the DP contains the correct
Page 15
2
active pharmaceutical ingredients (APIs) as stated on the label. Purity requires that the DP to be
free from any potentially harmful contaminants, including cross contamination with other DPs.
Strength and potency entails not only making sure the correct API is present in the DP, but the
correct amount of API is added and is not susceptible to degradation and formation of any
harmful by-products. Typically, a range of 90-110% is an acceptable range of an API, where
most manufactures produce DPs closer to the maximum API levels to ensure a longer shelf life.
Uniformity of dosage form may be broken down into further categories including consistency in
shape, size, form, and color. Different dosage forms include tablets, capsules, creams, vapors,
and liquids. Bioavailability may be considered as an extension of Woodcock’s concept of
providing the stated therapeutic benefits by ensuring the benefit is achieved in the correct time
frame. Bioavailability is the speed at which the DP enters the blood stream. The therapeutic
benefit may be limited if the API is released too fast, too slow, or incompletely (MSH, 2012).
Lastly, stability requires the pharmaceutical to retain its properties to avoid physical
deterioration, thermal degradation, or chemical decomposition given specific constraints like
elevated temperature or humidity. Stability may be affected most by the API, formulation,
packaging, and storage. While, both Woodcock and the Management of Science Health define
the end product of quality in terms of DP characteristics, each definition of quality has a narrow
focus that fails to address the full complexity of the processes involved. These definitions of
quality as it applies to the pharmaceutical industry fail to include quality parameters pertaining to
manufacturing and economics including the capital and operating costs, process and equipment
characteristics, raw materials, intermediates, and final products during the manufacturing
process.
Page 16
3
As a result, Kessler (2006) has define a definition for pharmaceutical quality that
extended traditional pharmaceutical quality definitions by incorporating five categories to define
DP quality: product functionality, technical functionality, technological functionality, sensory
functionality, and value-oriented functionality. Thus, Kessler’s definition of pharmaceutical
quality includes manufacturing, economic, and drug characteristic aspects. The first category
defines the functionality of the DP as it relates to the chemical and physical properties of the
drug that affect its behavior, uniformity, and effectiveness. The second category addresses the
effects of manufacturing process on the API, intermediates, and DP as it goes through the
system. Thus, emphasizing the durability of the drug and requiring an evaluation of
manufacturing technology and unit operations. Meanwhile, the third category, technological
functionality, is simply the fitness of use. The fourth category, sensory functionality, focuses on
human senses and includes the drug product’s appearance and design closely linking it the
uniformity of dosage form mentioned above by the Management of Science Health. Lastly, the
fifth category takes into consideration the cost-benefit ratio. It is important for manufactures to
produce DP using economically feasible processes. This can be aided in evaluating nonvalue
added (NVA) processes within the system. This is an extremely important category when taking
into consideration of pharmaceutical manufacturing modernization and change. Manufactures
will only modernize process and equipment if there is a business case for it. Kessler provides a
very broad definition of pharmaceutical quality that is applicable to the pharmaceutical industry.
However, some shortcomings of this definition involve a lack of details and expansion of each
category that leaves it open to different interpretations risking patient safety. Furthermore, there
is a lack of consideration to the overall life cycle and threats of degradation to the quality of DP.
Page 17
4
Furthermore, the definition of pharmaceutical quality must also be looked at in
terms of how regulatory bodies define it as the pharmaceutical industry is highly regulated.
Regulatory bodies including the International Organization for Standardization (ISO) and the
U.S. Food and Drug Administration (FDA) have also come up with definitions of product
quality. The ISO 9000 standard defines quality as “the totality of features and characteristics of a
product or services that bears on its ability to satisfy stated or implied needs.” While the FDA
(2004) defines pharmaceutical quality as “a function of DP, excipients, manufacturing and
packaging whose main goal is to achieve higher understanding about influences of formulation
and manufacturing process variables on product quality.” Both of these definitions once again
echo Woodcock’s (2004) definition of pharmaceutical quality and fail to include economic
aspects. Furthermore, the question still remains on how to judge and test quality. Quality can be
evaluated either in vivo through clinical trials or in vitro through assay, uniformity, purity, and
dissolution. Quality can also be tested in numerous ways through end-product testing, at process
testing, or in process testing. However, based on the manufacturing method, how quality is
judged and tested may be limited.
In addition, the definition of pharmaceutical quality comes increasingly complex
when considering international views. While, pharmacopoeias provide detailed descriptions to
manufacturers about critical API characteristics and analytical testing techniques,
pharmacopoeias are often published separately by major pharmaceutical companies and by
region. Consequently, one major challenge towards a universal definition of quality is that
quality standards published in pharmacopoeias and government publications vary from one
pharmacopoeia to another (MSH, 2012). For example, the European Pharmacopoeia establishes
Page 18
5
standards adopted by countries within the European Union. While, Great Britain and the United
States remain among the top pharmaceutical manufacture countries, each have their own
pharmacopeia, the British Pharmacopoeia and the U.S. Pharmacopoeia. Furthermore, the
European Pharmacopeia does not specify individual dosage forms like other pharmacopeia and
the U.S. Pharmacopoeia analytical techniques require expensive technology that many
developing countries cannot achieve. As a result, it becomes possible for an API to meet
standards of one pharmacopoeia, but not the standards of another pharmacopoeia. Until common
standards are finally achieved, manufactures must identify which standards are being used to be
accepted. Universal standards are further hindered by countries protecting their local production
of pharmaceuticals and markets through selective tariffs providing little incentive for a global
standard. Ultimately, a universal definition of quality requires a harmonization of pharmaceutical
quality standards.
Background on Motivation for CPM
A pharmaceutical drug typically consists of an API combined with non-active
pharmaceutical ingredients and excipients to form the final drug product that is administered to
patients. The high patient driven demand for pharmaceutical medications has put a strain on the
pharmaceutical industry as they face intensive pressure in both aspects of quality and meeting
increasing demand. The manufacturing of pharmaceuticals is expected to become increasingly
flexible to respond to increasing patient demand; however, the pharmaceutical industry has been
largely conservative when it comes to change in the manufacturing process due to regulation
uncertainties and few examples providing a working framework and path toward modernization
Page 19
6
(Zomer, Gupta, & Scott, 2010). As a result, the majority of pharmaceutical productions are
currently produced using batch production technology to produce both the API and the DP.
Examples of batch processing in the pharmaceutical industry includes: tablet coating, milling,
crystallization, extraction of a product from a reactor mixture, and autoclaving. However, batch
processing is inherent to inefficiencies, delays, and batch to batch variations as the start and stop
nature of the process causes breaks in production and introduces more sources for human error.
This is particularly troublesome because maintaining constant quality in pharmaceutical
manufacturing is very important as it directly impacts the quality of patient care. Quality in the
pharmaceutical industry is also unique in that the customers, the patients, cannot evaluate the
quality of the pharmaceutical for themselves through physical appearance or immediate use.
Thus, the pharmaceutical industry must maintain a higher, more consistent quality levels than
any other industries including petrochemical, oil, and chemical (Myerson et al., 2015). By the
time patients realize the quality of a pharmaceutical is compromised, the consequences can be
devastating including adverse side effects and death. Poor product quality may result in several
adverse effects including product recall and disruptions in manufacturing leading to a drug
shortage and patient harm (FDA, 2015).
However, with increasing R&D costs, increasing competition, shorter patent duration
times, longer development times, and regulation concerns, innovation within the pharmaceutical
industry has been slow to evolve. It has remained largely unchanged in the last fifty years as
pharmaceutical manufacturers have stuck with the proven methods of batch manufacturing in
order to avoid high R&D costs and regulatory obstacles. Batch manufacturing is characterized by
all of the required raw materials entering the unit operation at the beginning and being
Page 20
7
completely discharged after a set time. No materials enter or leave the unit until the process is
complete. Consequently, batch manufacturing has many inherent weaknesses including batch-to-
batch variations, slow reactions times, and poor thermal and homogeneity properties. Thus, there
has been a recent surge in research efforts and regulatory support for the pharmaceutical industry
to modernize. Recent guidelines, conferences, and white papers from both the United States and
European regulatory bodies have shown growing support for modernizing manufacturing
equipment and manufacturing processes. This combined with the changing market of
pharmaceuticals has led to a need for increased manufacturing flexibility and shorter process
times while still remaining at a high level of quality assurance. Thus, CPM has emerged at the
forefront of efforts to modernize and represents a paradigm shift from batch processing. CPM is
characterized by material continuously entering the unit and continuously discharging from the
unit throughout the duration of the process. As a result, CPM will not require breaks in
production or lead to batch-to-batch variations as experienced with batch processing. However,
CPM is a new manufacturing structure for the pharmaceutical industry that requires new
technologies and manufacturing concepts.
Literature has shown that through the greater process understanding achieved by CPM, a
high level of pharmaceutical quality can be maintained while also leading to lower
environmental impacts, lower production times, and lower variations when compared to the
traditional batch process. The development of pharmaceutical processes begins with identifying
the synthesis and reaction pathway to produce the API. The multistep processes to develop the
final DP containing the API includes many unit operations, among those are reactions,
separations, purifications, granulation, milling, coating, drying, and blending. Improvements in
Page 21
8
the reaction chemistry and unit operations is then improved upon factors related to lowering the
number of required steps, increasing yield, increasing purity, scalability, economics, and reaction
times. From a manufacturing and technologies perspective, this may be achieved by optimizing
operation conditions like temperature, pressure, and flow rate. In addition, since solvents are
commonly used in reaction to produce the API, separation processes like distillations,
chromatography, liquid-liquid extraction, filtration, membrane separations are also common
between the reaction steps to separate the API from solvents, unwanted by-products, and waste.
Thus, optimizing separation techniques and sequences is also another opportunity for
improvement. Additionally, different process technologies like the use of continuous microflow
reactors can offer significant advantages through process intensification in process time, yield,
and operating costs.
Thus, it has been established by the scientific community that a data-rich environment
and increased product and process understanding leads to significant process improvements.
Furthermore, with support from regulatory bodies for modernization, CPM has been a growing
minority in the pharmaceutical industry. In order for the pharmaceutical industry to continue to
modernize, modernization must be aided through the development of new process technologies
and greater understanding of proper implementation and how it fits into the current regulatory
environment. The concepts of process analytical technologies (PAT), quality by design (QbD),
and the development of a design space have been recently introduced to aid in these efforts.
However, the application of these concepts and technologies has been slow. Thus, the scientific
community and regulatory bodies must continue to work together and with pharmaceutical
Page 22
9
manufacturers to increase understanding and confidence in these concepts while also establishing
a business case for CPM.
CPM Quality Tools
CPM will allow for a higher quality pharmaceutical with greater sustainability, agility,
and affordability of medications for a growing population and patient demand (Girogiorgis &
Jolliffe, 2015). Many examples have been reported of continuous pharmaceutical processes for
chemical synthesis in flow, reactions with workup, crystallization, drying, powder blending, and
tableting; however, only a few others have considered integration of multistep portions of a
process and plant-wide approach (Mascia et al., 2013). However, CPM requires new, innovative
technologies and manufacturing processes and concepts to be successfully implemented. The
pharmaceutical industry and the FDA are striving to develop a modern pharmaceutical industry
that is capable of operating economically while simultaneously consistently delivering high
quality, uniform pharmaceutical products that behave as expected to meet an increasing global
demand and market. Several methodologies have been developed over the years to aid and
encourage pharmaceutical companies in achieving this goal. Furthermore, increased efforts have
been made by regulatory committees to remove barriers and obstacles through early involvement
and building a path for open communication. Introduction of methodologies developed include
QbD, PAT, and the development of a design space. Each considered a milestone in the
pharmaceutical manufacturing way of thinking that fosters a higher level of process
understanding and the idea that quality must be designed into the system. Each methodology is
dependent on the other and must adhere to the philosophy of continual improvement.
Page 23
10
Problem Statement
This research recognizes the difficulties and challenges pharmaceutical
manufacturers face when modernizing pharmaceutical manufacturing equipment and processes.
It will establish the benefits of CPM over traditional batch manufacturing processes reviewed in
literature and obstacles CPM faces that has slowed or halted its implementation. Obstacles
include a lack of a working framework, inexperience, economics, patent durations, appropriate
manufacturing equipment and configurations, establishing process pathways, quality control and
measurement tools, high R&D costs, and regulatory environment barriers. Better tools for
implementation for increased understanding and control will be presented to address many of
these obstacles. It is imperative that the gap between manufacturing confidence in QbD tools and
their applications along with the established business case for CPM be closed in order for CPM
to be successfully implemented. It is estimated by the FDA in, Understanding Challenges to
Quality by Design, in that growing product knowledge and understanding during product
development and manufacturing can lead to five billion dollars in savings for the pharmaceutical
industry.
Research Objectives
The objective of this research is to aid in the development of a QbD framework
for implementing CPM QbD tools to aid in the change of manufacturing from batch to
continuous and improve on current continuous pharmaceutical manufacturing processes. This
research aims to:
1. Explore, develop, and provide guidance on implementation.
Page 24
11
2. Analyze current CPM concepts.
3. Develop in depth comprehension of CPM quality tools.
4. Highlight the applicability of CPM concepts.
5. Research the business case.
6. Identify and analyze gaps in literature and regulatory guidelines that may increase
understanding and manufacture confidence.
7. Identify computer-based methods for the application of QbD principles.
8. Present a QbD algorithm for CPM using an integrated flowsheet models as the central
method.
Research Questions
While conducting an extensive literature review on CPM the central research
questions include:
1. How does CPM practices fall within the existing regulatory environment and what
efforts are being made to remove any existing regulatory barriers?
2. What are the weaknesses of traditional pharmaceutical batch manufacturing practices
and how does CPM compare?
3. What existing pharmaceutical quality concepts, frameworks, and systems are in place
to aid in the implementation of CPM? This includes the development of quality
concepts like QbD, PAT, and design space.
4. Is there a business case for CPM? Does CPM allow manufacturers to sustain or gain
a competitive advantage in the pharmaceutical market?
Page 25
12
5. What are current obstacles in implementing CPM? Is there enough confidence in
CPM quality concepts and frameworks to encourage switching from batch to
continuous manufacturing?
6. Are there sufficient case studies and research on the application of CPM principles
and guidelines that demonstrate their significance and successful implementation?
Does this research apply to plant operation or unit operation?
7. What are the current methods for implementing QbD principles?
Contributions
This research will aid in the understanding, confidence, and successful
implementation of CPM. An in-depth analysis of CPM will be presented to explore the benefits,
obstacles, current regulatory environment, and QbD tools central to CPM implementation.
Through the development and analysis of a QbD algorithm for the application of QbD principles
using an integrated flowsheet model as the central method the gap between manufacturing
understanding and manufacturer confidence will be closed. The application of an integrated
flowsheet model is in alignment with QbD principles of increasing product and process
knowledge. Furthermore, this model will allow pharmaceutical manufactures to create a data-
rich environment to document and aid in the decision-making process. This methods will
increase manufacturer confidence in CPM by answering economical, project feasibility, process
validation and optimization without the initial upfront extensive capital investment required with
ex silico methods.
Page 26
13
Thesis Outline
This thesis will provide a literature review on CPM manufacturing opportunities
and QbD applications and is outlined as follows.
Chapter One discusses the definition of quality as it applies to pharmaceutical
manufacturing and the background motivation for CPM and modernization. The problem
statement, research questions, and research objectives will also be outlined.
Chapter Two provides an extensive literature review on the advantageous of CPM over
traditional batch manufacturing processes traditionally used. This includes a comparison of
traditional quality systems, quality by testing (QbT), compared to the CPM quality system,
quality by design (QbD). The current regulatory environment and the tools and applications of
CPM methodologies being promoted by those regulatory bodies including quality by design
(QbD), design space, and quality by testing (QbT) will also be examined.
Chapter Three discusses the research gaps identified through the literature review in
Chapter Two. Resulting research ideas and methodologies are also discussed.
Chapter Four presents a QbD algorithm for CPM using an integrated flowsheet model to
aid in closing the gap between manufacturer understanding and manufacturer confidence.
Literature extensively reviews ex silico QbD tools including first principle modeling, response
surfaces, and design of experiments (DoE), but there is a gap in addressing integrated, plant-wide
tools and methodologies that align with QbD principle. The applications, advantages, and
regulatory implications are also examined.
Page 27
14
CHAPTER TWO: LITERATURE REVIEW
Introduction
The previous chapters highlighted both the evolving definition of quality and
pharmaceuticals and the importance of maintaining a high, consistent quality standard.
This chapter will provide an extensive literature review on the weaknesses of batch
manufacturing and the need for modernization toward CPM. It is also necessary to examine the
current regulatory environment and how CPM concepts fit within this environment as the
pharmaceutical industry is highly regulated and requires a high level of quality. Once the need
for modernization towards CPM methods has been established, CPM methodologies,
applications, and literature is discussed to increase understanding in CPM. However, while the
need for and advantages of CPM are well established in literature, pharmaceutical manufacturers
have been slow to implement CPM. As a result, the obstacles towards successful implementation
of CPM will be examined in order to determine the gap between manufacturer CPM
understanding and confidence in its applications.
CPM Manufacturing Opportunities Compared to Batch Processes
Compared to the traditional production of APIs and DPs through batch processes, CPM
provides manufactures with several advantages that allow for improved product quality and
increased flexibility to respond to the required increasing precision of medications and changing
demands. Furthermore, the economic savings promised by CPM are well documented on both a
model and real-world examples basis (Mascia et al., 2013, Lee et al., 2015, Schaber et al., 2011,
Seifert et al., 2012,). The U.S. Food and Drug Administration believe that CPM will lead to
Page 28
15
improvements in product quality, purity, safety, and identity outlining four expected benefits to
demonstrate the need in modernizing pharmaceutical manufacturing technology from batch to
continuous processing:
1. Improved manufacturing efficiency and flexibility with fewer production
interruptions.
2. Fewer product failures both before and after distribution leading to a higher quality DP
3. Improved product quality leading to a higher confidence the pharmaceutical will
perform at expected clinical performance.
4. Increased availability to patients in need and flexibility to adjust to changing and
growing demand.
CMP Process Characteristics
Batch processes are inherently inefficient as it requires multiple breaks in production and
long sequential steps of reactions in a batch reactor requiring purification steps in between
(Girogiorgis & Jolliffe, 2015, Sing & Sharma, 2015). In addition, these steps are timely due to
batch processes’ having poor spatial homogeneity that leads to poor mass transfer and heat
transfer. Poor mass transfer requires larger mixing times up to days for batch process that
alternatively can be achieved by continuous mixing in just seconds in order to achieve a
homogenous mix and thorough material distribution. Continuous mixing can also achieve narrow
size distributions and size uniformity that aids in the precision needed for many commercial
drugs that is unachievable through batch processes (Myerson et al., 2015). Furthermore, poor
mass transfer also increases batch to batch variations and can lead to batch failures (Singh &
Page 29
16
Sharma, 2015). Poor heat transfer can also lead to thermal degradation of intermediates, APIs,
and final products. This leads to the formation of unwanted by-products with an increase in the
generation of waste compromising overall product quality, yield, and selectivity (Myerson et al.,
2015).
Continuous flow chemistry is often better than batch process due to the capability of
process intensification: much higher concentrations, pressure, or temperature process conditions.
This intensification allows for the facilitation of new synthetic routes and novel pathways that
are not currently achievable though batch processes (Mascia et al., 2013, Lee et al., 2015, Heider,
2015, Girogiorgis & Jolliffe, 2015). For example, utilizing flow micro-reactor technology for
CPM allows for quick mixing and reactions to occur and effective heat removal to prevent
thermal degradation. This then allows for synthetic routes and novel pathways that may require
highly exothermic or hazardous reactions or involve highly unstable intermediates to be safely
performed efficiently. Thus, flow micro-reactors can handle a number of pharmaceutical
synthesis including hydrogenation, nitration, and organometallic reactions under intensification
with reliable control and a high level of maintained quality (Girogiorgis & Jolliffe, 2015).
However, micro-reactors would not be suitable for the production of pharmaceuticals that require
a slow chemical reaction or reactions mixtures including slurries. Furthermore, the benefits of
CPM must be enough to provide a business based economic decision to promote R&D of
synthesis and development of CPM technology. R&D on flow chemistry and organic synthesis
is vital as continuous flow chemistry may differ from batch chemistry as demonstrated in the
synthesis of aliskiren, where the mechanism (i.e. Lower reaction temperature conditions, solvent
Page 30
17
consumption, and synthetic steps) of achieving the API and the DP are different than the batch
chemistry (Heider, 2015).
CPM Supply Chain
Due to economic constraints and the long process times of batch processing, the supply
chain of APIs and DPs may span several manufacturing plants across multiple countries. Thus,
potentially hazardous APIs and intermediates, despite being sensitive to degradation over time or
changes in environmental conditions, may be stored for long periods of times and shipped to
other manufacturing facilities (O’Connor, Yu, & Lee, 2016). This also results in a long
production process, up to 12 months from the first synthetic step to DP, due to storage and
shipping of material around and between facilities. This extensive supply chain can consequently
result in drug shortages and expensive inventories and working capital (Lee et al., 2015).
Furthermore, this introduces a number of vulnerabilities in the supply chain of pharmaceuticals
and maintaining consistent quality. In addition, the flexibility to meet changes in patient
demands is significantly restricted.
However, with CPM the reaction and purification steps are integrated into a single system
in order to make APIs and DPs start to finish. The FDA estimates that some batch processes that
take months to complete may be completed in hours with CPM, increasing manufacturing
flexibility and reducing the risk of drug shortages in the face of a pandemic (FDA, 2015, Lee et
al., 2015). Furthermore, the continuous flow results in a much shorter supply chain and a shorter
time to market in order to allow more flexibility. By reducing hold times and eliminating
storages of APIs and intermediates, product quality is directly improved. The reduction in
Page 31
18
material handling due to continuous flow from unit to unit operation also decreases the amount
of labor needed and increases operator safety (O’Connor et al., 2016, Mascia et al., 2013).
Additionally, CPM is not subject to current scale-up bottlenecks of batch processes. CPM
permits scale-up through longer operation times and production capabilities, increasing flow
rates of the process, and through the possibility of optimizing commercial equipment (Allison et
al., 2015).
Decreased Footprint
Traditional batch manufacturing involves long, sequential steps requiring large residence
times and multiple isolations, material holds offline, and lengthy purification steps. CPM
significantly reduces capital costs through the reduction of storage facilities and containers
needed to hold offline product or intermediates needed for batch processes. Furthermore, CPM
often requires fewer units of operations through the application of telescoping: collapsing
multistep process into a single unit operation. In addition, operating costs are significantly
lowered due to higher throughput rates, increased yield and selectivity of the API and DP, and
decreased labor requirements (Lee et al., 2015). Increased yields and selectivity also means CPM
produces significantly less waste than batch process. Batch processes can have E-factors (waste-
to-product ratio) as high as 25-100 for the production of APIs. This indicates that for every 1 g of
API there is between 25-100 g of waste being generated by the batch process. In comparison, the
petrochemical industries commonly have E-factors much lower than 1 (Girogiorgis & Jolliffe,
2015). This generation of waste increases operating costs and makes the process significantly
less green and sustainable when compared to CPM.
Page 32
19
Furthermore, the long reaction times, thermal and mass non-uniformity characteristics,
and the limited capability for real time process monitoring leads to NVA process in batch
manufacturing including breaks in production and cleaning procedures. In order to maximize the
profitability of the production of an API or DP, these NVA steps need to be limited. This may be
considered as taking a lean approach. There has been sufficient literature demonstrating the
economic and sustainable benefits of CPM.
Heider (2015) was able to synthesize aliskiren using CPM with savings up to 30% when
compared to an equivalent batch size in large part due to the improved heat and mass transfer
properties of continuous flow resulting in a reduction in operating costs.
Seifert et al. (2012) proved that pharmaceutical manufactures would benefit from the
efficiency and increased productivity, in both yield and selectivity, of CPM over batch plants. In
comparing the production of four recombinant proteins, CPM had a 30% net present value and
faster planning period than the equivalent batch process
Schaber et al. (2011) identified the capital costs of a CPM to be 30 to 76% lower and
operating costs to be as much as 40% lower when recycling is utilized when compared to the
batch process depending on drug loading, cost of key intermediates, and the process chosen. In
most cases, the yield was also higher for CPM process; however, even when the yield is lower
than the batch process, operating costs may still be lower due to a decrease in labor and material
handling.
Girogiorgis & Jolliffe (2016) were able to successfully model and simulate the
continuous manufacturing of artemisinin that generated 66.2% less waste than the batch process
for the same 100 kg per year production level of API. The continuous process has an average E
Page 33
20
factor of 22.52; while, the batch process had an average E factor of 65.28. This signifies that
continuous processes have an enhanced sustainability due to lower waste production which is
especially important with a growing emphasis on green process (Mascia et al., 2013, Heider et
al., 2015)
Table 1: CPM Manufacturing Features and Benefits Over Batch Processing
CPM Manufacturing Features Benefits
Continuous Flow Properties • Lower batch-to-batch variations
• Improved spatial homogeneity
• Improved heat and mass transfer
characteristics
• Facilitation of new synthetic routes and
novel pathways
Non-stop Production of Material • Shorter time to market/ faster responses to
changes in patient demand
• Shorter supply chain
• Reduced degradation/storage of APIs and
intermediates
• Increased throughput rates
• Potentially easier to scale-up/scale-down
Smaller Equipment Footprint • Reduced safety hazards
• Less labor required
Page 34
21
CPM Manufacturing Features Benefits
• Less space and equipment needed
• Decreased capital costs
Integrated Process with Fewer Steps • Fewer unit operations
• Faster response times
• More efficient
• Less equipment needed
• Decreased capital and operating costs
• Integrated control
Online Monitoring and Control • Real time product quality information
• Reduce lengthy testing of end product
• Enhanced development approach
Reduced Waste Generation • More sustainable/environmentally friendly
• Higher yield and selectivity
• Decreased operating costs
• Decreased costs of key ingredients
Current Regulatory Environment
One major challenge to innovation is that there remains limited knowledge and
experience in the pharmaceutical industry with continuous manufacturing that can provide a
working framework for successful implementation (FDA, 2015). This in large part can be
Page 35
22
attributed to the fact that pharmaceuticals are often manufactured on an intermediate production
scale (hundreds of grams to kilograms) where most research in continuous manufacturing has
been done on a large production level for chemical commodities, oils, and petrochemicals
(Heider, 2015). As a result of a lack of experience and understanding of CPM there remains
many questions in how CPM will fit into the current regulatory environment. Manufacturers may
face delay as regulating agencies attempts to achieve a comprehensive understanding of the new
continuous processes and how it affects product quality and fits into existing regulations (FDA,
2015, Myerson et al., 2015). In order for modernization in the pharmaceutical industry to occur,
regulatory bodies need to ensure regulations and regulatory practices do not hinder the
implementation of CPM. This includes reducing associated regulatory risks that may provide a
barrier for manufactures, encouragement of other federal agencies to support CPM to protect
public health, and provide financial support for training of both regulatory staff and universities
in the area of CPM control systems and approaches (Myerson et al., 2015). Ultimately, the
regulatory agencies support CPM and are aiding in the removal of barriers associated with
regulatory review and delays. The FDA and a number of other regulatory agencies promote CPM
and maintaining consistent product quality through the combination of Quality by Design
approaches (QbD) and Process Analytical Technology (PAT). Guidance, cGMP regulations and
statutes have all been released to address CPM.
Regulation Considerations
Current good manufacturing practices (cGMP) defines a batch as a designated amount of
product that is produced during the same cycle of manufacturing and intended to have uniform
Page 36
23
quality characteristics within specified limits. Thus, the term “batch” has regulatory implications
under The Code of Federal Regulations:
21CFR 211.101: the weight and measure of each batch must match the Batch Production
Records; each batch should me made with the intent to provide no less than 100% of the API as
indicated on the label
21 CFR 211.180 (e): Establish procedures and recordkeeping for a review of a
representative number of batches and whether that batch was accepted or not
21 CFR 211.165 (a): Each batch must be determined to meet final DP specifications
before release
21 CFR 211.188: Batch product and control records must be prepared for each batch
21CFR211.192: Extended investigations shall extend to other batches that may be
associated with unexplained failures or discrepancies with specifications
Since the term batch does not specify a mode of manufacturing, it is possible for a
continuous process to produce batches and thus a concept of batch for a continuous process must
be developed and defined (Lee et al., 2015). For CPM, a batch may be defined based on a certain
amount of product produced within a given time frame during the duration of the continuous
process (Allison et al., 2015). However, (Lee et al., 2015) extends the possible definitions of
batch for CPM to be defined by amount of quantity produced, equipment run time capability, or
based on production variations (i.e. lots of incoming raw materials).
In addition, since continuous manufacturing will have different in process control
systems and testing/sampling procedures, acceptable procedures for detecting disturbances,
handling deviations, rejection of nonconformance material, and sampling considerations must be
Page 37
24
taken into consideration by regulatory bodies to see how it fits within existing regulations and if
it will provide an acceptable product quality. The evaluation of changes in manufacturing from
batch to continuous should be considered by regulating agencies as to the relevant risks
associated to product quality, product contamination, dosage form, manufacturing processes
(design, scale-up, start-up/shut/down), and testing technology (Allison et al., 2015).
International Council for Harmonization of Technical Requirements for Pharmaceuticals for
Human Use Guidelines
The International Council for Harmonization of Technical Requirements for
Pharmaceuticals for Human Use (ICH) attempts to bridge the gap between regulatory bodies and
the pharmaceutical industry in order to promote and support advanced pharmaceutical
technology. ICH guidelines emphasize a science and risk based approach to the development of
innovative manufacturing technology in order to facilitate a deeper understanding of the product
development and process involved. As a result, quality is based on a sound, risk-based approach
that must be built into the design in order to have a robust process capable of maintaining a
consistent quality. ICH Q8, Q9, Q10, and Q11 (as cited in Allison et al., 2015, Lee et al., 2015,
Nadpara et al., 2012, Pramod et al., 2016, Yu et al., 2013) outline an integrated systems approach
for the implementation of quality.
ICH Q8: A systematic approach identifying predefined objectives that affect the DP
materials and properties and planning a set of controls from product and process understanding
to ensure product uniformity and quality. ICH also defines what QbD and the design space are.
Control parameters may include drug attributes, operating conditions, real time monitoring, and
finished product specs (Pramod et al., 2016).
Page 38
25
ICH Q9: Focuses on quality risk management. Opportunity to use structured process
thinking
ICH Q10: Focuses on the pharmaceutical quality system across a products lifecycle
ICH Q11: Defines the development and manufacture of Drug Substances
United States Food and Drug Administration Guidelines
There has been a growing emphasis on the need for CPM and support from the FDA to
promote manufactures to work towards building CPM. In 2002, the FDA launched an initiative,
Pharmaceutical cGMPs for the 21st Century: A Risk Based Approach, to encourage the early
adoption of new manufacturing technology and committed to the practice of having all
regulatory regulations based on the most advanced pharmaceutical technology available. In
2004, in two FDA guidances titled PAT-A Framework for Innovative Pharmaceutical
Development, Manufacturing, and Quality Assurance and Risk-Based Method for Prioritizing
CGMP Inspections of Pharmaceutical Manufacturing Sites, the FDA promoted quality assurance
through Quality by Design (QbD) and Process Analytical Technology (PAT).
QbD is defined by the FDA (FDA, 2009) as: “A systematic approach to development that
begins with predefined objectives and emphasizes product and process understanding and
process control, based on sound science and quality risk management.”
Whereas, PAT is defined by the FDA (FDA, 2009) as: “Mechanisms to design, analyze,
and control pharmaceutical manufacturing processes through the measurement of Critical
Process Parameters (CPP) which affect Critical Quality Attributes (CQA)”
Page 39
26
As a result, quality should be built in and evident in the design of the manufacturing
process to ensure quality is inherent to the system. Conversely, quality cannot be simply tested
into the process (FDA, 2009, FDA, 2015). In their Strategic Plan for Regulatory Science, the
FDA (2011) commits support to the development of improved continuous manufacturing
methods through active research and collaborative efforts with external partners to determine the
effects of CPM on product quality, safety, efficacy, and product failure rates. However, despite
these initiatives the year 2011-2014 was marked with quality lapses that lead to drug shortages.
These drug shortages included cancer drugs, anesthetics, emergency medicine, and IV
medications. Furthermore, the FDA indicated that the major reason for these drug shortages were
quality and manufacturing issues. In addition, the FDA insinuated that since consumers are
unable to determine pharmaceutical quality for themselves, manufactures who were not investing
in quality might be compromising patient safety.
In 2015, the FDA found that raw materials, quality manufacturing issues, and quality
delays caused 27%, 37%, and 27% of drug shortages. Thus, quality issues accounted for
approximately 91% of all drug shortages, with loss of manufacturing sites, increase in demand,
and discontinuation accounting for the final 9% of drug shortages. This resulted in
manufacturers’ moving away from retrospective quality and closer to process design. The
industry recognized that QbD and PAT lead to a robust, predictable process that allowed for a
high product quality and better management of business goals (FDA, 2016).
While a growing minority of pharmaceuticals are being produced through continuous
manufacturing, like the cystic fibrosis drug Orkanmbi (lumacaftor/ivacaftor) produced by Vertex
since its approval in 2015, most resistance to modernization of pharmaceutical drugs is coming
Page 40
27
when a change in production (batch to continuous) is required. As a result, in 2016, the FDA
showed further support for CPM and aiding this production change with their drafted guidance
from the agency’s Emerging Technology Team (ETT), Advancement of Emerging Technology
Applications to Modernize Pharmaceutical Manufacturing Base. The guidance was in alignment
with the FDA and the Center for Drug Evaluation and Research’s mission to protect and promote
public health (FDA, 2015). The FDA aimed to aid in the modernization of pharmaceutical
technology by getting engaged with manufactures as early as possible to meet and discuss
manufacturing issues, recommendations, and regulatory reviews of submission (FDA, 2015).
This guidance has already resulted in the FDA approving their first change in production
methods from a batch to continuous manufacturing for the production of Janssen Supply Chain’s
medication, Prezista (darunavir), used for the treatment of HIV-1 infections. The CPM process
integrates all the required manufacturing steps of weighing, milling, blending, compression, and
coating into a single continuous line to produce a solid 600 mg oral dosage at full production
levels. This resulted in a shorter time-to-market as the manufacturing and testing cycle time was
reduced from two weeks to one day; thus, also significantly increasing plant capacity and drug
availability to patients.
However, despite successes, the FDA still has a number of obstacles and
challenges to face (Pramod et al., 2016):
1. Implementation of these new concepts to industry requires a cultural change.
2. Heavy workload and limited resources: The Office of Generic Drugs remains
backlogged due to a large number of applications.
3. Adaption of regulations to meet the expectation of QbD based submissions.
Page 41
28
4. Varying approaches to manufacturing and quality operations across the industry and
how it fits into existing regulations.
5. The time required for regulatory approvals for facilities improvement including site
changes and equipment upgrades may hinder the ongoing innovation of
manufacturing.
6. FDA has yet to identify quality indicators that would help to predict drug shortages
and recalls.
Table 2: Guidance, Regulation, and Statute Applications to CPM Lifecycle
Guidance,
Regulation, or
Statute
Product
Design
Process
Design
Manufacturing Process
Control
Continuous
Improvement
ICH
Q8Pharmaceutical
Development
X X
FDA’s PAT
Guidance
X X X X X
ICH Q9 Quality
Risk Management
X X X X X
FDA Quality
System Guidance
X X X X X
Page 42
29
Guidance,
Regulation, or
Statute
Product
Design
Process
Design
Manufacturing Process
Control
Continuous
Improvement
ICH 10
Pharmaceutical
Quality Systems
X X X X X
ICH Q11
Development and
Manufacturing of
Drug Substances
X X X X X
FDA’s Strategic
Plan for Regulatory
Sciences
X X X X
FDA Process
Validation Guide
X X X X
cGMP X X X X
Quality Assurance
Quality assurance and consistency has remained a foundation in pharmaceutical
manufacturing and DPs. The pharmaceutical requires a higher level of quality than most
industries as quality defects can lead to detrimental adverse effects. The Management of Health
Sciences identifies key risks associated with poor pharmaceutical quality: lack of therapeutic
Page 43
30
effect leading to prolonged illness or death, induced toxic or adverse reactions leading to more
costly treatments, a waste of financial resources, and a negative effect on the health system
credibility. Thus, the approach to quality has evolved within the pharmaceutical industry from
quality by testing to quality by design.
Quality by Testing
Quality by testing is the traditional quality methods through the reliance of analytical
tests of end products to prove performance functionality. End-product testing alone is considered
to be Quality by Testing (QbT). If the end-product passes the tests, it is accepted. As a result,
QbT have strict specification limits that are not grounded in process or product understanding,
but instead based upon observations and data from historical manufactured batches. This leads to
limited regulation flexibility as each change requires approval from the FDA. Consequently,
QbT is not a powerful means of ensuring quality and has been limiting factors (Sangshetti et al.,
2014). Those factors include:
1. Highly dependent on determining an accurate representative sample is tested.
2. A small portion of defective material can only be detected if 100% of the material is tested
which is impractical due to time, resource, and financial constraints.
3. Manufacturers only test what they expect to find.
4. Testing provides little opportunity for continual improvements in quality.
An example of the limitations of QbT includes the manufacturing of penicillin. The
cross-contamination level of penicillin with other DP is zero because of the high probability of
extremely low levels of penicillin to cause serious adverse effects in certain individuals.
Page 44
31
However, detecting penicillin at extremely low levels is not possible with existing analytical
techniques even if cross contamination was suspected. Also, penicillin may not be evenly
distributed throughout the DP it is contaminating magnifying the difficulties associated with
testing for its presence. As a result, current regulation states penicillin cannot be made in the
same manufacturing facility as other medications because this is the only way to ensure
compliance and patient safety (Pallagi et al., 2016).
Furthermore, the total cost companies spent on quality is highly correlated to internal and
external failures of the end-product. Internal failures would be non-conforming end products that
were caught through end-product testing at the manufacturing site. Costs associated with internal
failures include reworking and scrapping. External failures were non-conforming end-products
that was distributed to the consumer and failed while in consumer use. This kind of failure is
much more costly than internal failures because of the costs associated with poor quality drugs
including adverse side effects, prolonged illness, death, and perceived unreliability. However,
through quality by testing alone, it was impossible for organizations to reduce and eliminate
failure rates. As quality became increasingly expected, the total cost of quality became a driving
force for no longer testing in quality, but instead designing into the system through trend analysis
and prevention. While, there are costs associated with prevention methods and controls, the
savings from the reduction of internal and external failures outweighed the upfront costs.
Quality by Design
Quality by Design (QbD) is a holistic based approach to pharmaceutical development
through product and process understanding and continual improvement. It is primarily science
Page 45
32
driven through empirical models, scientific literature and frameworks, design of experiments
(DOES) and based on sound risk assessment. (Nadpara et al., 2012; Singh & Sharma, 2015;
FDA, 2009; FDA, 2015). The FDA (2009) defined QbD as “A systematic approach to
development that begins with predefined objectives and emphasizes product and process
understanding and process control, based on sound science and quality risk management. While,
the ICH interpreted the QbD concept in the ICH Q8 guidelines as a systematic approach to
pharmaceutical development which starts with defining objectives and furthermore continues
with emphasizing product/process understanding and process control, based on science and
quality risk management. Ultimately, QbD in literature is characterized as involving thorough
product understanding, process understanding, and process control. Product understanding is
then achieved through understanding product performance to critical quality attributes to meet
patient needs. Process understanding is achieved through risk management to understand impacts
of variability on product performance and developing a design space to operate within. Lastly, a
process control may be achieved through continuous process monitoring and assessment to
ensure consistent quality over time and continual improvement. This process is cyclical in nature
and requires continuous improvement as demonstrated by the figure below.
Benefits of QbD align with the importance of process understanding and risk
management stressed by the FDA and other regularity bodies. The benefits outlined in literature
are:
1. Good Business: By improving consistency and reducing variation in the end product,
subsequent investigations, scrap, rework, and recall costs are lowered. CPM also
eliminates batch to batch variation seen in batch processing.
Page 46
33
2. Evidence Based Decision Making: QbD requires building a scientific knowledge base
for all products and process parameters. Decisions can be based on science rather than
empirical data.
3. Higher Quality Assurance: By increasing product and process understanding there is a
stronger knowledge base for understanding factor interactions and the impact on the
DP quality.
4. Higher Manufacturing Efficiency: Through QbD the process is much more predictable
and flexible to responding to disturbances and changes in process parameters to ensure
quality is met. Thus, there is a reduced cost in product and process waste.
5. Incorporated Risk Management: Risk management minimizes product deviations and
costly investigations, reduces regulatory compliance problems, and increase
understanding.
6. Continual Improvement: Continual improvement is essential to quality efforts and
ensuring quality assurance.
Product Design:
Target Product Profile and Critical Quality Attributes
The target product profile summarizes the clinical objectives and therapeutic benefits the
drug needs to achieve. The TPP may be built based on label information, packaging insert
information, patent, literature, and clinical studies and trials. The components of a TPP may
include dosage form, strength, route of administration, and proposed indication. The quality
target product profile (QTPP) must be identified to determine specifications of the drug such as
dissolution/release, dosage form, safety, efficacy, and stability in order to achieve the desired in
Page 47
34
vivo performance and clinical expectations. The central idea is that ensuring in vitro performance
will than provide assurance of in vivo performance. As a result, a pre-determined product quality
is determined and is not dictated by the manufacturing capability. Analyzing QTPPs help link the
manufacturing processes with the product and patient for patient health care and benefits (FDA,
2009; Heider, 2015). Furthermore, QTTP should align with the therapeutic benefits and concepts
on the label with a primary focus on safety and efficacy (Singh & Sharma, 2015). Label concepts
may include dosage and administration information, level of API in the DP, adverse reactions,
warnings, pharmacology, and description (Nadpara et al., 2012). This may then translate to
QTPP parameters relating to identity, assay, dosage form, purity, stability often identified as
critical quality attributes (CQAs) (Pramod et al., 2016.) CQAs is defined as the by ICH Q8 as the
“physicochemical, biological, or microbiological properties or characteristics that should be
within the defined limit or distribution to ensure the desired product quality.” Thus, a DP must
conform to the CQAs to ensure consistent product quality performance.
Process Design:
Critical Process Parameters and Critical Material Attributes
The drug formulation design and process development is an interdependent process as
the formulation is dependent on the set process and operating conditions to achieve the desired
product quality. Thus, manufacturers must identify which process parameters are critical to the
product quality and identify the risks and best approaches to manage them (24). (Lionberger et
al., 2008 defines three kinds of process parameters. (1) Unidentified Process Parameters (UPP):
process parameters that are unknown and whose effect on the design space and QTPP has not
been determined. (2) Non-Critical Process Parameters (NCPP): process parameters that do not
Page 48
35
interact with other parameters and who has no significant effect on the QTPP. (3) Critical
Process Parameters (CPP) are process parameters that interact with other parameters and affects
CQAs. Consequently, all CPPs need to be monitored and controlled to ensure all CQAs are
within specifications. Lastly, Critical Material Attributes (CMA) are also important to identify
and may be defined as the characteristics of inputs (physical, chemical, or biological) introduced
to the process that must be controlled within a given range to ensure there are no resulting
process disturbances (FDA, 2009). It is important to note that level of criticality may differ
depending if the manufacturing process is for the production of an API or DP. Identifying CQAs,
CPPs, and CMAs is an iterative, life-cycle process that will enable manufactures to make better
decisions and increase product consistency. All DP CQAs should be considered including
physical attributes, assay, uniformity, dissolution, degradation, and moisture. A CQA may
further be identified as the level of severity of harm to a patient when that CQA is not met.
Conformity of CQAs often is a function of the level of control and conformity of CPPs and
CMAs. For example, if your CQA was content uniformity, CMAs would be particle size and
particle size distribution; while CPPs may include mixer load level, environment temperature,
and number or revolutions per time. The higher the risk a CQA poses, the higher the level of
control that is imposed on the CPPs and CMAs that affect it. Thus, risk assessment has become
an integral part of determining the CPPs, CQAs, and CMAs. Yu et al. provides an extensive
review of typical CMAs, CPPs, and CQAs for varying pharmaceutical Unit Operations including
blending/mixing, wet granulation, drying, extrusions, tableting, and encapsulation.
An example of product and process understanding and identifying CPPs and CQAs is
presented below.
Page 49
36
Table 3: An example of linking CPPs to CQAs to increase product and process understanding
Form Parameter Critical Quality Attributes
API Physicochemical Identity
Impurity
pH
Melting Range
Particle Size Distribution
Density
Water Content
Biological Permeability
Activity
Microbiological Bacteria
Aerobic Organisms
Yeasts
Mold
Excipients Physicochemical Concentration
Stability
Particle Size Distribution
Density
Biological Bioavailability of API
Microbiological Bacteria
Page 50
37
Source: Adapted from Yu et al., 2013
Form Parameter Critical Quality Attributes
Aerobic Organisms
Yeasts
Assay
Drug Product Physicochemical Identity
Assay
Impurities
Correct Dosage Form
Uniformity of Dosage Form
Dissolution
Hardness
pH
Particle Size Distribution
Drug Functionality
Biological IVIVC
Microbiological Sterility
Parental Drug Products
Aerobic Organisms
Mold
Page 51
38
Figure 1: Block Flow Diagram a fluidized bed unit of operation and identification of possible
CMAs, CPPs, and CQA
Source: Adapted from Yu et al., 2013
Process and Process Understanding: Quality by Design Tools
Risk Assessment and Management
A robust risk assessment allows manufacturers to systematically determine,
communicate, control, and study which variables are most critical to the DP quality over its
lifetime. Tools commonly used for risk assessment include:
1. Fishbone diagram to identify potential variables including material, instrumental and
environmental factors
2. Failure mode effect analysis (FMEA) to determine where the system may fail and rank
variables based on risk factors including probability and severity
Page 52
39
3. Failure, Mode, Effects and Criticality Analysis (FMECA), Fault Tree Analysis (FTA),
Preliminary Hazard Analysis (PHA), and a Pareto chart to determine which variables
affect the pharmaceutical characteristics the most (Nadpara et al., 2012, Haleem et al.,
2015, Pallagi, 2016). Defining a clear definition for “risk” is vitally important for the
pharmaceutical industry as there a large number of various stakeholders that have
diverse interests and stakes in the process (Haleem et al., 2015).
The principles of quality assessment may be defined are to use scientific knowledge to
evaluate the risk to quality as it linked to a patient healthcare and therapeutic benefits. In
addition, formal documentation and evaluation of the severity and probability of a risk occurring
in order to determine the level of risk involved is also essential
Pallagi (2016) used a risk estimation approach in early stage development for a dry
powder with meloxicam as the API for pulmonary applications, where each QTPP and CQAs
and then the CPPs and CQAs. Factors were ranked high, medium, or low and interactions
together with an estimation of occurrence was used for rating. Next, using the Pareto principle of
the 80/20 rule which states that while there are a number of variables effecting the process 80%
of those effects will come from about 20% of the cause variables. Edina was then able to
determine that particle size, pulmonary irritation, wettability, solubility, and toxicity properties
were the main CQAs to affect the API. For the CPPs, composition, pressure, temperature and the
feed rate had the highest impact on the final product. Thus, the risk assessment helped to identify
which CQAs and CPPs needed the most attention during drug development and manufacturing.
Meanwhile, Harry and Lanju (2012) performs risk assessment through statistical methods and
parameters to determine the shelf life for excipients.
Page 53
40
While, risk management is spoken mainly in the terms of early pharmaceutical
development and continuous monitoring, risk management should be done by all parts of the
business including the quality, regulatory, production, sales, marketing, business, clinical, and
legal units of the organization and product lifecycle.
Design Space
The CQA space and CPP space is often mapped in a multidimensional space called the
design space. The design space is defined by the FDA and ICH Q8:
“The multidimensional combination and interaction of input variables (e.g. material
attributes) and process parameters that have been demonstrated to provide assurance of quality.”
A full understanding of the design space will lead to a better understanding of sources of
variation and process disturbances and their resulting impacts downstream on the CQAs’ ability
to meet product quality requirements. This in return can for a tighter control of the system and
shift controls upstream, instead of relying on length end product testing (Lee et al., 2015).
Regulatory agencies allow each manufacturer to define their own design space and submit it for
approval. Once a design space is determined, the operating ranges chosen is usually a subset of
the design space. As a result, the FDA does not require regulatory approval for changes within
the design space; however, changes outside of the design space are subject to regulatory approval
in order to demonstrate the DPs ability to meet product quality requirements (Mascia et al., 2013,
FDA, 2009). Having a larger approved design space is especially advantageous as it allows for
process improvements within the DP lifecycle that would require fewer regulatory submissions
including characterization of process and product performance, monitoring and corrective
Page 54
41
actions, and validation of filing changes to the design space. Thus, leading to increased
manufacturing flexibility. However, potential challenges commonly identified among
pharmaceutical manufacturers to developing a design space are the cost of running experiments
to define the design space and applicability of the design space during scale up or ramp in
production.
Design of Experiments
The design space may be mapped using various techniques based on the products CQAs
and amount of data available at each stage of the product lifecycle. Thus, the design space may
be mapped using DoE. DoE is a systematic approach to determine the relationship between
process factors and their impact on product quality. The basic steps of DoE include choosing an
experimental design, conducting randomized experiments, analyzing data, and mapping the
resulting design space. DoE requires experimentation and is aided by previous process
knowledge about potential CQAs and CPPs. Based on the allowable CQA limit, a design space
can be mapped using DoE.
QbD is highly dependent on the capability and accuracy of the DoE procedure chosen for
design space mapping the process. Assumptions and estimations of the API and other chemical
components need to be able to accurately depict the physical, chemical, and biological properties
of the substances including solubility, selectivity, and yield. In addition, modeling of unit
operations must be reliable enough to allow for scale-up and provide results for starting
conditions for modelling of the following unit operation in the manufacturing process. Lastly,
Page 55
42
system modelling must provide an accurate foundation for further risk assessment, capital and
operation costs analysis, and plant scheduling. (Pallagi, 2016)
DoE may be used to gain general process understanding, study effects of individual
variables, identify interactions between variables, and characterize acceptable ranges of critical
process mapping. It is also able to take into account variability within the experiments, the
processes, or raw material. All of this aids in developing and identifying a design space. Shivhare
and McCreath (2010) state that DoE can have returns of four to eight times greater than the cost
of running of the experiments. The Design Space may be determined through various DoE levels
of approaches:
Level 0: Mapping
Mapping an operational space through a large number of experiments varying CPPs in
order to determine the optimal conditions to yield the desired CQAs within specification. This is
a brute force designs that requires a very large number of experiments. Level 0 DoEs are not
commonly used to the infeasibility of the very large number of experiments that are required due
to economical, time, or drug availability reasons.
Level 1: Factorial DoEs and Response Surfaces
Using DoEs to fit the data to a response surface. This requires fewer experiments;
however, requires experiments for center points and determining if curvature is present. Level 1
are most commonly found throughout literature due to the reduced number of experiments from
Level 0 while still providing a good experimental understanding of the overall system. An
example of a Level 1 DoE includes a full factorial design in the form 2k, where 2 is the number of
Page 56
43
levels of each variable (high, low) and k is the number of variables being tested. Thus, the
number of experiments requires increases exponentially with each new variable that needs to be
tested. As a result, the number of variables being tested may need to be systematically reduced
through risk analysis and process knowledge to limit the number of experiments further. The
most simplified form of a Level 1 DoE is a 22 factorial design requiring four experiments. If a
large number of variables must be tested, the number of experiments can then be systematically
reduced through fractional factorial design. This is an efficient method requiring fewer number
of experiments to determine the relationship between multiple process parameters and the
impacts on the process response. Anderson et al. (2013) aimed to optimize tablet formulation that
was highly complex and accurate using the fewest number of experiments and variables possible.
He stressed the importance of using as few of experiments as possible because of the economics
and the limited availability of the drug. Other examples of factorial designs include Plackett-
Burman, central composite design, and Box–Behnken. Applications include optimizing process
and product parameters to increase conversion, product purity, and yield.
Weiyong and Henrik (2003) identified impurities for optimizing the operation conditions
for columns screening and separating organics for pharmaceuticals using Plackett-Burman.
Torrealday at al. (2003) used a combination of fractional factorial designs and central composite
designs to determine the optimal conditions of quantitation telmisartan to fit the data to a
response surface. Miroslav et al. (2010) used a 24 factorial design and 16 experiments to
determine the effects and optimize the conditions of CPPs including temperature, flow rate, and
composition for the CQA dissolution. David at al. (2012) used Box- Behnken DoEs to evaluate
Page 57
44
the main, interaction, and quadratic effects of peptide peaks of protamine sulphate to obtain a
response surface and acceptable ranges for a design space.
Level 2 : First Principle Approach
Level 2 DoEs use experimental data and multidisciplinary knowledge of physics,
chemistry, and engineering principles to predict and model product performance and enhance
process understanding. This includes both chemometric and available mechanistic knowledge to
fit the data and predict product performance and quality. First principle process modeling is also
essential beyond mapping the design space for rapid evaluation of a process and operation
alternatives like solvents. Level 2 DoEs are also commonly found throughout literature. First
Principle modeling as successfully been used to model CPM in the manufacturing of artmisinin
(Girogiorgis & Jolliffe, 2016), crystallization (Lakerveld et al., 2015), ibuprofen Gerogiorgis &
Jolliffe, 2015a). First principle examples in literature include Seifert et al., 2012, Schaber et al.,
2011, and Su, Naggy, & Rielly, 2015.
Level 3: Multivariate Statistical Process Control
Mapping utilizing DOE and multivariate statistical analysis methods to the linking of
feed-forward controls. Multivariate methods include principle component analysis (PCA) and
partial least squares (PLS). Silva et al. has used multivariate statistical control and PCA to
evaluate optimal operating conditions for a twin-screw granulation, fluid bed drying process, and
tablet press for a continuous tablet manufacturing lines. Rosas et al. (2011) used multivariate
statistical process control (MSPC) for the determination of a design space for pharmaceutical gel
manufacturing, which determined water content and temperature as the most influential CPPS
Page 58
45
for the CQAs viscosity and pH. The CPPs were then optimized and used to define the design
space. While, Level 4 DoEs are not commonly found in literature or in practice for CPM due to a
lack of experience and knowledge, MSPC is well documented throughout literature in both
mathematical concepts and applications, including batch pharmaceutical manufacturing.
Burggraeve et al. (2011) used MSPC and PLS for the batch process of fluid bed granulation.
Barla et al. (2014) used MSPC and PLS for the evaluation of chemometric models for a fluidized
be dryer.
With each level, there is an increase in process understanding and growing accuracy and
confidence in the design space for a fixed number of experiments. A risk based approach should
be used when conducting DoEs. If a risk based approach is not done before DoE, the
manufacturer will not know how to allocate resources effectively. Furthermore, risk analysis will
eliminate variables of least significance and levels decreasing the number of experiments
required to be performed. Furthermore, process and product knowledge should also be used to
determine an acceptable experimental range of operating factors to further ensure the number of
experiments performed is economically feasible.
Process Control: Process Analytical Technology
A control strategy is typically used to monitor CQAs through ensuring CPPs are within
the design space. If a control space is smaller than the overall design space, then the process is
robust. Control strategies are closely linked with PAT in QbD practices.
PAT is a system that allows for the measurement of CPPs and CQAs of raw and in
process materials for ensuring a high, consistent final product quality. This aids in the effort of
Page 59
46
process understanding and control to help design quality into CPM and allow for continuous
improvement (Maikern, 25). The FDA defines PAT as:
“A system for designing, analyzing, and controlling manufacturing through timely
measurements of critical quality and performance attributes of raw and in-process materials and
processes with the goal of ensuring final product quality.”
Once the design space has been mapped and the acceptable ranges of critical parameters
are established, PAT allows for the online monitoring and actively control the drug quality
system. PAT can help to monitor attributes like particle size uniformity, granulation, and
polymorphism. This method of online monitoring allows for increased manufacturing flexibility
through direct, real time, continuous assessment of CPPs and CQAs. Within the PAT framework,
a process end-point is when a material has been achieved that satisfies all CQAs and is not time
dependent. In addition, it can be used a process control technique allowing for reduced cycle
times, real time process control, limiting occurrences of unconfirming material, greater
automation, real time release, and identification of continued improvement opportunities.
PAT also naturally lends itself to real time release testing (RTRT). The FDA defined
RTRT as “the ability to evaluate and ensure the quality of in-process materials and/or final
product based on process data.” While ICH Q8 expands RTR as also “typically including a
valid combination of measured raw material attributes and process controls.” RTR includes:
analysis of raw material and API to meet specifications and NIR monitoring to determine blend
uniformity, identity, or assay, and laser diffraction to determine particle size. In line with PAT,
RTRT measurements typically takes place on-line, in-line, or at-line. Benefits of PAT include
higher quality insurance, better process understanding, reduce end product testing, and
Page 60
47
increased manufacturing flexibility. In addition, through the large amounts of process data
collected, PAT also allows for evidence based decision making and corrective actions to be
implemented in real time.
PAT tools are categorized in literature and by the FDA in the following categories:
multivariate tools, process analyzers, process control tools, and continuous improvement and
management tools. It is possible to use one or a combination of many types of PAT tools for both
a single unit of operation as well as plant operation.
Multivariate tools include DoE methods previously discussed as well as using process
simulation and pattern recognition software and tools. This will help to determine the reliability
of models and identify critical factors and their interactions that often times one-factor-at-a-time
experiments do not reveal.
Process analyzers include on-line or in-line measurements. On-line measurements are
where samples are temporarily diverted off the manufacturing process to be tested and then is
returned to the process stream after. While, in-line process measurements are when the sample is
tested while remaining in the process stream and may be either invasive or noninvasive.
Examples include weighing the tablet after compression, determining blend uniformity after
mixing, particle size after compaction or granulation, or present moisture after drying. Process
analyzers may also include fast at-line measurements where the sample is removed from the
process stream and closely examined. For example, in the case of NIR or disintegration tests for
tablets. Process analyzer PAT tools provide a large volume of data that relate to the biological,
physical, or chemical properties of the material and can be used for quality assurance or
regulatory needs. Process analyzers also allows for real time control of the process stream.
Page 61
48
Process Control PAT tools are important to ensure that CQAs are being achieved through
control and manipulation of CPPs. PAT also provides an opportunity for statistical process
control to define acceptance of CQAs.
Continuous Improvement and Management PAT tools are also commonly used. This
involves collecting data over the products lifecycle to continue to optimize controls, process
parameters, and material attributes for better performance and reduction of waste. This data may
also be used in requesting regulatory approval for changes in the design space and facilitate in
clear, transparent communication with regulatory bodies. Today’s information technology
infrastructure aids in the maintained and collection of data. However, improvements in
automation, algorithms, and process technology is still needed to further aid an integrated
systems approach (FDA, 2004).
Process Analytical Technology Tools
PAT tools can also be defined in literature according to the level of PAT. The
three levels commonly identified include:
Level 0: Tight Specifications and CMA and CPP Constraints
The likelihood of nonconforming material is lowered through extensive end-product
testing. Most common for batch processing with the assumption that a tested sample from the
batch is a representative sample of the batch as a whole. Infeasible for continuous manufacturing
due to possible transient process disturbances during continuous production.
Page 62
49
Level 1: End Product Testing
Level 1 consists of end-product testing and process models with flexible process
parameters accounting for variations in raw materials. General understanding of the effects of
process variability and impacts on quality.
Level 2: Active Process Control Systems
Active process control system to monitor CPPs and CMAs in real-time.
Automatically adjusted to respond to disturbances to ensure constant conformance. Represents
thorough product and process knowledge and understanding. Less likely to have a product out of
spec. operating in a design space.
Overcoming process disturbances is one of the main advantages of CPM over batch
processing. While, in theory CPM is to operate in steady state, this is not realistic in multivariate
processes like in pharmaceuticals. Steady state is obtained when all process state variables are
constant over time and do not change. For steady state to be achieved all process state variables
including pressure, temperature, volume, enthalpy, entropy, and chemical composition must not
vary as a function of time (Myerson et al., 2015). However, steady state is theoretical in nature
and instead is used as an approximation for a state of a process in order to substantially reduce
the mathematical computation involved and avoid solving differential equations. This concept
does introduce an underlying error due to the assumptions involved. A control engineer knows
that steady state process cannot be achieved due to fluctuations in disturbances and unit
operations. Thus, the desired objectives of CPM should be satisfying all Critical Quality
Attributes (CQA’s), not operating all variables at steady state. Operating a system at steady state
Page 63
50
would actually result in lower product quality (Myerson et al., 2015). Instead as a control
strategy, non-CQAs are manipulated by process control systems to produce smaller variations
over time in CQAs. For example, the level of a tank is often not a CQA and has no value added
to maintaining the level of the tank at a set point. As a result, the level of the tank may be used to
manipulate CQAs like concentration and DP purity.
PAT are often used in a control strategy to monitor and vary variables over time within a
controllable range to suppress effects of process disturbances and CQA variations over time.
Heider et al., 2014 was able to synthesize aliskiren through utilizing an integrated CPM process
using an advanced intermediate two synthetic steps away from the final API and finished with
the final formulated tablet dosage. The CPM process integrated many manufacturing steps
including two synthetic reactions, a dilution, and a membrane liquid-liquid extraction all linked
together and ran continuously, without offline holding, isolation steps, or breaks in production. A
high level of quality and yield (90%) were maintained despite process disturbances a closed-loop
control. For example, fouling of the membrane based liquid-liquid extraction led to a retention of
the organic phase and fluctuations in pressure which the process was able to automatically adjust
to changes in throughput and pressure using two back pressure regulators downstream in a close-
loop mode. The process was proven robust enough to maintain product quality.
Relationship between Control Strategy, PAT, RTRT, and QbD
RTRT and PAT are commonly used as part of the control strategy for monitoring CQAs
of raw materials, in-process materials, and the end product. However, PAT does not always
imply RTRT. PAT methods can be designed to control CQAs without contributing to RTRT.
Page 64
51
Furthermore, both RTRT and PAT do not require QbD or a design space and vice versa.
However, the incorporation of al four elements is most beneficial to CPM. Both RTRT and PAT
can be hard to justify without the process understanding and risk based approaches involved in
QbD. In addition, having a defined design space allows for PAT to manipulate CPPs in real time
within that design space without additional regulatory approval, increasing manufacturing
flexibility. Furthermore, the use of QbD concepts without PAT or RTRT could result in
extensive and costly end product testing that can be difficult for continuous process where a
sample in time cannot be a representative of a whole as is applicable to taking a batch sample
representing the batch as a whole. As a result, all concepts should be implemented together;
otherwise, the manufacturer will lose out on all that CPM has to offer.
Batch and Quality by Design vs. CPM and Quality by Testing Overview
Traditionally quality is determined through QbT whose steps to achieve quality
may be outlined as determining a target to meet the quality and having fixed process parameters
resulting in variation in product quality. Then end product testing leads to reworking, scrapping,
and possible quality investigations of nonconforming material. However, the steps to achieve
QbD may be outlined as developing product and process understanding to allow for flexible
process parameters that may be manipulated and monitored in real time leading to consistent
quality.
Page 65
52
Table 4: Batch processing and QbT Approach compared to CPM and QbD approach for different
stages of a product’s lifecycle
Aspect Batch and QbT Approach CPM and QbD Approach
Product Development Empirical Systematic
Process Development Data intensive; no “big
picture”
Scientific understanding of
product and process design
Quality Targeted Tight specifications from
historical manufactured
batches
Specifications based on
product performance
requirements
Manufacturing Flexibility Rigid; changes require FDA
approval
Flexible; adjustable within
design space
Response to Deviations Strict adherence to tight
specifications results in waste
and nonconforming products
Designed to be robust
allowing for small process
variations (i.e. raw material,
column filtrations,
temperature)
Risk Management Lack of science and risk
evaluation; discourages
changes
Risk based control; evidence
based decision making
Product Specification End product testing Real time monitoring of CPPs
and CQAs
Control Strategy End product testing PAT and risk based
Page 66
53
Aspect Batch and QbT Approach CPM and QbD Approach
Life Cycle and Knowledge
Management
Reactive, post approval
changes needed
Continual improvement
within design space
Page 67
54
CHAPTER 3: RESEARCH METHODS
This chapter gives an overview about the research methodology applied in this thesis in
order to achieve the research objectives. The methodology starts with the problem identification
and ends with proposed solution.
Figure 2: Research Methods and Approach
Conclusion and Future Research
QbD Algorithm for CPM using Integrated Flowsheet Predicitve Modeling
Literature Gap Analysis
Literature Review
Batch and QbT Approaches Advantages and Obstacles of CPM QbD and QbD Tools
Research Idea
Quality in Continuous Pharmaceutical Manufacturing
Page 68
55
Research Methodology
This thesis began with exploring the weaknesses of the traditional batch
manufacturing processes that dominates the pharmaceutical manufacturing industry as the
predominant manufacturing method. Batch manufacturing has remained largely unchanged in the
last 50 years and consequently has failed to see process improvements and innovations that
characterizes other chemical and process industries. Change has been slow due to the regulatory,
competitive, and educational environment despite the weakness of batch manufacturing and need
for modernization being well recorded throughout literature.
Next, continuous pharmaceutical manufacturing is analyzed as the dominant
proposed method towards modernization by both regulatory bodies and existing literature. CPM
was compared to batch manufacturing in order to determine the benefits of CPM and further
establish the need for the pharmaceutical industry to modernize manufacturing methods. The
issue of achieving a consistent, high quality level required by pharmaceutical drugs in an
economical way using CPM was also examined. A business case for CPM is necessary in order
to encourage manufacturers to modernize.
Obstacles to the implementation of CPM was also examined to determine what
challenges manufacturers can expect to face and identify key reasons why modernization has not
already occurred. The term batch versus continuous in regulations requires a shift in
manufacturing thinking and an accepted definition of continuous pharmaceutical manufacturing
among all stakeholders. Regulation uncertainty and a lack of understanding and confidence in
CPM may reduce the acceptance of CPM among pharmaceutical manufacturers.
Page 69
56
The above research objectives were achieved through a literature review. Once a
literature review was conducted, gaps in literature were identified.
Research Gap Analysis
Gaps in research identified are:
1. Regulation and Guidelines are broad in nature:
Regulation guidelines and practices are too general. Regulation bodies like the FDA are
addressing a diverse drug market in a very broad way that may cause manufacturers to be
hesitant in adopting QbD principles. Despite the potential benefits from CPM, due to a lack of a
working framework and how it applies to their own manufacturing process. The FDA needs to
provide more specific tools and decisions tools. In addition, The FDA has failed to define batch
as it applies to CPM
2. Work with institutions and other research areas to build confidence and understanding:
CPM Requires knowledge of process control, high data analysis like DoE, risk
assessment, and CPM quality concepts that is not covered in today’s curriculum
3. Lack of Integrated Flowsheet Predictive Models:
Integrated flowsheet models are extensively research in other industries including
chemical and petrochemical industry; however, there is little literature on computer simulated
integrated flowsheet models as it applies to CPM. Integrated flowsheet models can be used for
process development and risk mitigation at a reduced cost than approaches that solely focus on
DoE approaches
Page 70
57
4. Lack of Plant Wide Frameworks:
There is a lack of case studies providing real work exampled and evidence for how to
achieve switching from batch processing to CPM. Most literature reviews discuss the
characteristics of QbD and QbD tools principally speaking in comprehensive terms, theory and
definitions. Furthermore, those few case studies provided seem to focus predominantly on unit
operations rather than plant wide
There is a gap between the works of academics to develop continuous manufacturing
technologies and the successful implementation of that work to the commercial sector.
5. CPM as it applies to upstream processes of manufacturing
Failure to address QbD efforts/benefits in other areas before manufacturing in the stages
of pre-clinical and clinical trials in order to establish a better understanding of the DP’s critical
attributes and objectives.
For QbD to implemented properly in the manufacturing stage, most of the knowledge
about the pharmaceutical drug should be generated during R&D and clinical stages then
translated downstream. This helps to encourage product understanding and to properly build in
quality in the process. This also saves time and effort required to develop the design space and
control the process.
6. Oversimplifying pharmaceutical processes
Pharmaceutical process are complex processes estimated to be upwards of a 100-
multivariate process and increasingly autocorrelated. Most CQAs and CMAs are over simplified
and treated as independent to one another. Using a single component specification for CQAs and
CMAs oversimplifies the process and can lead to misleading results.
Page 71
58
Research Ideas
One major gap in literature identified was a QbD approach on a plant wide level rather
than by unit operation. In addition, an integrated flowsheet modeling is not extensively reviewed
in literature as it applies to CPM processes despite being extensively researched in other
industries including the chemical and petrochemical industry. As a result, an algorithm was
developed for CPM process development that was aligned with QbD principles using the central
method of an integrated flowsheet modeling. Research of integrated flowsheet modeling for
CPM includes advantages over current unit operation QbD and DoE approaches, applications,
and possible regulatory constraints.
Page 72
59
CHAPTER 4: FINDINGS
Integrated Flowsheet Models
While potential CQAs, CPPs, and CMAs are extensively discussed throughout literature,
there is gap in how to identify these CQAs, CPPs, and CMAs in a fully integrated continuous
flow system. While there are some literature demonstrating how to determine these critical
design parameters that potentially affect the quality of the DP for a unit operation (a single piece
of equipment), using QbD tools on a unit operation deceivingly lends to manufacturers believing
their process is continuous when in fact it is only a semi-continuous process. Many of the
inefficiency and constraints of batch processing are still present. However, with a fully integrated
system that is inherently more complex and multivariate in nature, it is increasingly difficult to
determine which design parameters are critical and affect quality. In addition, the interaction of
critical design parameters must also be considered. As a result, a systematic framework was
developed utilizing computer simulated process flow and process flow diagrams to aid in the
development and application of an plant-wide integrated flowsheet model for a plant wide
operation.
As the pharmaceutical industry begins to modernize manufacturing practices and
equipment from batch to continuous, it remains important to assess the continuous flow system
for design elements that may infect overall product quality. While the optimization of individual
unit operations remains important, the focus now shifts to identifying and managing risks to
product quality as an integrated system. With this in consideration, it is also then important to
consider the multivariate and autocorrelated nature of the system. Integrated flowsheets are a
Page 73
60
process system engineering tool used for process integration, simulation, and development that
allows for controller design, sensitivity analysis, and the evaluation of process parameter ranges.
An integrated flowsheet model is a tool commonly used in chemical and process
engineering to illustrate the flow of a plants process and order of equipment. In a continuous
process, the integrated flowsheet model will show the equipment in series without isolation of
any intermediates or breaks in production. The output of one unit will be the input of the next
unit in the series. Information that this model will provide includes a process topology, stream
characteristics, and equipment characteristics. As a result, a typical integrated flowsheet model
will include the following:
1. Each piece of equipment will be represented by an icon and assigned a unique
number or name to distinguish it from other equipment. This allows for the analysis
of each unit operation and to determine equipment characteristics and operation
parameters including temperature, horsepower, size, flow capacity, and enthalpy. In
changing from batch to CPM, this will aid manufacturers in determining whether or
not the existing batch equipment can be utilized or retrofitted for a continuous
process.
2. All process flow streams are identified, typically by a number, each with their unique
characteristics including to chemical composition, molar flow rate, inlet temperature,
and outlet temperature. This is particularly advantageous in increasing process
knowledge which in return allows for process optimization and to determine critical
control points within the process.
3. All waste streams, recycle streams, and utility streams are also identified.
Page 74
61
4. All equipment and streams will be depicted in sequential order to aid plantwide
understanding and thus a plant wide approach to design and quality.
Aspen Plus Software
While, it is evident that an integrated flowsheet model may take extensive work to
prepare, there are multiple software packages including AspenPlus (V7 and V8) that have been
demonstrated to be accurate for the design of continuous systems and widely used throughout the
chemical and petrochemical industry. Aspen Plus provides a software engineering practice that
focus on chemical engineering and analysis principles including process control, process
engineering, optimization, and continual improvement. It is capable of handling particulates,
solids processing, and mixed liquid/vapor streams with or without particle distribution common
to pharmaceutical processes. Streams can be manipulated using 19 different property methods
through an extensive thermodynamic and physical property library of which most commonly
used are the ideal property method, Raoult’s Law, and Henry’s Law. Furthermore, there is
diversity in the process models Aspen Plus provides by manipulating the operation mode or
equipment configuration. For example, this includes the reactor design, which is the vessel where
the chemical reactions take place and are often designed to optimize yield, efficiency, chemical
kinetics, and operating conditions including energy input/removal, pressure exchange, frictional
pressure loss, and agitation. Thus, different pharmaceutical processes may require different
reactors; Aspen Plus provides various options including the two most common reactors for
continuous processes: Continuous Stirred-Tank Reactor (CSTR) and a Plug Flow Reactor (PFR).
Each reactor has its own set of energy and heat balances that contains their unique differential
Page 75
62
equations that Aspen Plus uses to simulate the behavior of the reactor. This trend continues for a
variety of unit operations including crystallizers, crushers, distillation columns, mixers, and
condensers. From a process stream standpoint, Aspen Plus also allows the user to simulate input
variables. Each unit may also be further defined by defining unit characteristics such as pressure,
inlet temperature, outlet temperature, molar flow rates, reflux ratio, product purity output,
enthalpy, horsepower, and more depending on the unit being defined. Furthermore, users may
use C++, Fortran, and VBA to allow flexibility and user-defined units to handle their system.
From a material and process stream perspective, Aspen also allows the user to set a number of
input variables through either calculation blocks or equation-oriented modeling.
Use of Aspen Plus software for modeling continuous pharmaceutical manufacturing
processes is not extensively reported in literature. However, Aspen Plus has been used to model
a number of chemical processes in both the chemical and petrochemical industry including
integrated flowsheet models for wet granulation, solids handling, continuous direct compression,
dry granulation which are applicable to the pharmaceutical industry for process design,
development, and optimization (Rogers et al., 2013).
Applications of an Integrated Flowsheet Models for CPM Quality Systems
When designing a pharmaceutical plant, the process may involve a large amount of
equipment and process streams. From a design point of view, an integrated flowsheet model will
help the manufacturer evaluate optimal equipment configuration. This would be particularly
advantageous when considering the pharmaceutical industry whose traditional form of
manufacturing is batch processing. Using, this integrated approach, pharmaceutical
Page 76
63
manufacturers will be able to evaluate the feasibility of a continuous process for their DP. The
route of synthesizing the API and excipients can be evaluated and potential risks and challenges
are more easily foreseen with challenges faced with either upscaling processes or switching from
bath to CPM. This may increase manufacturing confidence in CPM and aid in convincing many
manufactures to take the upfront initial investment costs currently required when switching from
a batch to continuous process. Furthermore, computer simulated integrated flowsheet models
will also provide information on equipment efficiencies, dimensions, and other characteristics
that may aid in determining the capital costs of CPM equipment and build a business case for
CPM. Capital cost may also be reduced using this model by determining the feasibility of
retrofitting batch equipment to be utilized for a continuous process.
Integrated flowsheet models also provide an advantage over traditional DoE approaches
by allowing the integrated plant to be studied on both a unit and plant level to obtain process
information without using additional resources. Process feasibility, sensitivity analysis, risk
analysis, process and equipment design and optimization could all be done through computer
simulation without using APIs, excipients, creating waste, exposure to high-risk materials and
parameters, and without distribution in production. Ideally, this integrated flowsheet method and
DoEs would be used as complimentary tools. The integrated flowsheet model would help to
provide an initial foundation of process knowledge to then narrow the scope of study for DoEs
and further process investigation. Through this method, manufacturers could identify, optimize,
and control CPPs and CMAs, leading to an increase process understanding in line with QbD and
building quality into the process. This in return may result in quicker regulation approval of a
design space and a larger design space to operate within.
Page 77
64
Furthermore, integrated flowsheet models allow for the CPM process to be evaluated on a
plant wide level rather than unit operation. This is extremely advantageous for risk assessment,
which is a key feature in QbD. Risk assessment cannot have a narrow focus; rather, the impact of
both upstream and downstream process and critical elements must be both known and
understood to efficiently mitigate risks. Integrated flowsheet models allow for the equipment to
be evaluated in both series and parallel in the sequential order of the CPM process. As an API,
intermediate, or DP flows out of one unit of operation it then becomes the input of the next unit
of operation in series. Cheaper than the iterative, factorial design of DoE, experimental, and
empirical approaches.
For example, the process stream characteristics of the output of a feeder becomes the
input characteristics of the mixer to follow. This then follows that the mixer must be able to
handle any disturbances introduced from the feeder and not feed those disturbances to the
following units of operations and affect product quality. This example can be easily evaluated in
a computer simulated integrated flowsheet model by simulating the process in a software
package like ASPEN Plus and performing a sensitivity analysis. This type of sensitivity analysis
allows for increased process understanding of process flexibility and robustness. In return, this
helps to determine process parameters and tolerances for the further establishment of a design
space.
Once the established range of parameters has been established, deviations from these
ranges must be managed and controlled in order to ensure a high, consistent product quality.
These disturbances are most commonly controlled using actuators, sensors, feed forwards, and
feedback controls through an integrated control system and interface. Integrated flowsheet
Page 78
65
models may aid in the implementation of these control systems by aiding in the evaluation of the
process and associated risks. Thus, the proper control methods and locations of controls along
the process stream may be determined. As a result, integrated flowsheet models may be
applicable to all stages of product design and process development as demonstrated in the
following figure:
Page 79
66
Figure 3: Applications of an integrated flowsheet models to different stages of product and
process development
Product Design
•Idea Generation
•Strategic Planning
•Project Feasibility
•Increase Product Understanding
•Identify CQAs
•Develop Common Language for Communication
Process Development
•Evaluate Alternative Drug Product Pathways
•Identify Process Bottlenecks
•Process Optimization
•Identify CMAs and CPPs
•Process Engineering
•Identify a Control Strategy
Equipment Development
•Unit Operation Analysis
•Plant Wide Analysis
•Equipment Sequences
•Define Equipment Characteristics
•Retrofitting Equipment
•Identify CMAs and CPPs
Facility Design
•Equipment Footprint
•Equipment and Utility Sizing
•Environmental Impact
•Initial Capital Costs
•Technology Transfer
•Capacity Planning
Manufacturing
•Identify Bottlenecks
•Supply Chain Management
•Production Scheduling
•Material Flow Analysis
•Establish Design Space
•Operating Costs
Continual Improvement
•Sensitivity Analysis
•Increase Product/Process Understanding
•Redefine Design Space
Page 80
67
Benefits and Advantages
Integrated flowsheet models for CPM provide manufacturers with information on
both the process design and process development. For example, it may be used to answer some
of the following questions:
1. Can the DP be manufactured within the existing plant framework or is a new plant
required?
2. Can the existing equipment be used or retrofitted for the development of the DP?
3. What is the total capital investment, manufacturing costs, operating costs?
4. What is the total throughput per unit of time of the DP?
5. What is the plant capacity?
6. What is the final product purity of the DP?
7. Which unit operations, material resources, or process are likely to create bottlenecks
or process disturbances?
8. Is the process robust enough to handle process disturbances?
9. What unit operations or processes may be optimized to increase total throughput or
efficiency?
10. What is the environmental impact of the process (e.g. waste, by-products, resources
required)?
11. Upon evaluation of alternatives, which plant design provides the best decision for the
plant based on the plant’s priorities (e.g. fastest time to market, least expensive,
smaller equipment footprint)?
Page 81
68
As a result, this plant wide level approach provides many advantages to manufacturers
over QbD approaches that focus solely on unit operation analysis in the areas of increased
product understanding, design and optimization, plant wide analysis, reduced cost, and risk
mitigation.
Table 5: Advantages of an Integrated Flowsheet Models
Area of Improvement Advantages
Increase Process Understanding • Evaluate how CPPs and CMAs interact to affect
CQAs rather than a univariate approach
• Process stream information
• Design quality into the Process in align with QbD
principles
• Encourage the QbD mindset
• Larger Design Space
• Risk assessment and mitigation
Design and Optimization • Process design and optimization, especially of high-
risk parameters
• Equipment design and optimization
• Sensitivity Analysis
• Feasibility Analysis
Plant Wide Analysis • Evaluation of equipment in sequence
Page 82
69
Area of Improvement Advantages
• Evaluate how units upstream and downstream
interacts
Reduced Costs • No material usage of APIs, intermediates, or
excipients
• Narrow scope for DoEs
• Helps to build business case of CPM
• Minimize development time/time to market
Page 83
70
QbD Integrated Flowsheet Algorithm
Figure 4: Process flow diagram for the application of QbD for CPM using integrated flowsheet
models as the central method
Continual Improvement
Equipment and Process Optimization Increase Product Understanding
Control Strategy
Validate Control Strategies in Integrated
Flowsheet ModelRisk Assessment Sensitivity Analysis Process Robustness
Validate Integrated Flowsheet Model
DoE Experimental Data Further Process Design if required
QbD by Process Design
Process Design Risk AssesmentProcess CMAs and
CPPsIntegrated Process
Design Space
Determine Process and Operating
Parameters
QbD by Unit Operations
Unit Operation Models Risk Assesment Unit CMAs and CPPsUnit Operation Design
Space in Flowsheet Model
Drug Product Characterization
QTPP CQAs
Page 84
71
The process should always begin with characterization of the DP to increase product
understanding. Drug product understanding should begin upstream of the manufacturing stage of
the product lifecycle during pre-clinical trials, clinical trials, lab scale plants, and test plants.
Thus, the CQAs may be identified and developed from information provided from the label,
intended use, efficacy, and any R&D performed during these stages. If the product is not a
generic drug previously manufactured, the QTPP needs to be developed, followed by a risk
assessment to identify potential CQAs. While a process may contain numerous quality attributes,
not all quality attributes are critical. The manufacturer must consider the promised therapeutic
effects, mechanisms of actions, dosage form, efficacy, clinical safety, patient demographics and
more to select CQAs and establish a link to clinical performances. Another risk assessment may
be performed to determine the risk priority number (RPN) as part of a FMEA to determine the
probability of occurrence, likelihood of detection, and severity to prioritize CQAs. Once all
CQAs have been identified, unit operation design may begin.
QbD by unit operation may begin taking place working from the QTPP and CQAs
identified. For each unit operation, the CQAs must be identified for that unit operation to help
identify possible CMAs and CPPs that affect CQAs. Through another FEMA risk assessment,
CMAs and CPPs may once again be prioritized to determine PPs and MAs that could affect the
output, CQAs, other PPs and MAs, and input variables to identify which are CPPs and CMAs.
Using integrated flowsheet modeling, each unit may be modeled as an individual model and be
tested. A design space may then be developed and operating parameters within that design space
may be determined based on unit optimization and efficiencies. However, it is important to also
be considering that an output of one unit of operation becomes the input of the next unit of
Page 85
72
operation. No unit of operation operates independently of the process itself. As a result, it
possible not all units will be optimized when the process itself is optimized.
Once unit operation design spaces have been established for each individual unit
of operation, the process must now be designed by evaluating CQAs on a plant wide level. In
literature, QbD is often defined on a unit basis, but fails to address the interdependencies and
autocorrelation of these pharmaceutical processes and how CPPs, CMAs, and CQAs are
interrelated and may affected one another. By evaluating on a plant wide level. A deeper
understanding of the DP and processes is developed in alignment with QbD principles. By
combining unit operation design spaces using integrated flowsheet modeling, these design spaces
may be used to determine the optimal manufacturing operating parameters while ensuring each
CQA is addressed throughout the manufacturing process with a total of n manufacturing steps.
Often, through integrated flowsheet modeling, a larger design space is created allowing for
higher manufacturing flexibility and a more robust process.
Once process parameters and material attributes have been determined, it is
always recommended to validate the model with experimentation. One advantage of predictive
modeling is that the scope and focus of experimentation has now been focused through the use of
the integrated flowsheet model data and risk assessments performed without. This means less
time and material are being used reducing costs when compared with QbD approaches that forgo
computer simulated integrated flowsheet modeling. Similarly, computer simulated integrated
flowsheet modeling allows manufacturers to test operating conditions that may be to hazardous
or impractical for experimentations.
Page 86
73
Once the integrated flowsheet model has been validated, a control strategy may
now be identified and implemented. With the use of data from both the integrated flowsheet
modeling and experimental data, process robustness may also be validated. Different control
strategies may also be tested and evaluated using the integrated flowsheet model allowing for
evidence based decision making by manufacturers. A risk assessment is also performed to help
identify control strategies that link to the quality system and spec limits. Once a control strategy
is implemented, the process may be further tuned and optimized leading to continual
improvement and possible changes in the process design space. Continual improvement is a
foundation of QbD that leads to further product and process understanding.
Below is a process flowsheet as an example of applying the QbD algorithm for CPM
using in silica integrated flowsheet models as the central method. While it is not meant to be
used at checklist of items to successfully implement QbD, it helps to facilitate the QbD way of
thinking when using integrated flowsheet models.
Page 87
74
Figure 5: QbD Algorithm for CPM using integrated flowsheet models as the central method
Page 88
75
Figure 6: Blue and Yellow Section of QbD Algorithm for CPM using integrated flowsheet models as the central method
Page 89
76
Figure 7: Red Section of QbD Algorithm for CPM using integrated flowsheet models as the central method
Page 90
77
Figure 8: Green, Orange, and Grey Section of QbD Algorithm for CPM using integrated flowsheet models as the central method
Page 91
78
Potential Regulatory Implications
The use of models for FDA regulation review and approval is not a new concept to the
FDA or pharmaceutical manufacturing. Pharmaceutical manufacturers have used
pharmacokinetics, drug adsorption modeling, activity relationship models, and bioequivalence
models to support regulatory reviews. Furthermore, it is recognized that computer simulated
integrated flowsheet modeling results in deeper product and process understanding, aligning with
the QbD mindset promoted by the FDA and other regulatory bodies.
However, the level of acceptance of integrated flowsheet models in FDA regulatory
submissions is highly dependent on the amount of reliance and support being placed on the
integrated flowsheet model to assure the final DP quality. Integrated flowsheet modeling also
helps to build a business case for CPM while enhancing product knowledge consistent with both
FDA and ICH QbD guidelines and mindset.
Using a plant wide approach allows for a deeper understanding of both the DP and
manufacturing process yielding a larger design space to operate within, without requiring
regulatory submission and approval. Rogers and Ierapetritou (2014) identify the two levels of
impacts as low and medium impact models. Low impact models are integrated flowsheet models
only being used for process development support of experimental data and risk assessments such
as potential toxicity and impurity risks. These models may be used in support of decisions made
during process development. Medium impact models are integrated flowsheet models used to aid
in determining the process design space, operating parameters, and control strategy.
While, computer simulated integrated flowsheet modeling is being utilized in other
industries, it is not yet being utilized in the pharmaceutical industry. The FDA has recognized
Page 92
79
this gap and sponsored two grants to further develop continuous pharmaceutical manufacturing
process computer based simulations and modeling, in particular for solid oral dosage DPs. The
FDA hopes that integrated flowsheet modeling may increase confidence in CPM among
manufacturers and aid in project feasibility, product understanding, and process development.
Integrated flowsheet models may be used as a platform for risk assessment, control strategies,
and aid in developing common communications between manufacturers and regulatory bodies.
Page 93
80
CHAPTER 5: CONCLUSION
Recommendations
While regulatory bodies have made strides towards decreasing the regulatory uncertainty
surrounding CPM, there are still some major strides that need to be made to enhance the current
regulatory environment. The FDA needs to define “batch” as it applies to CPM and current
regulatory guidelines and statutes using the term “batch” in the requirements. Similarly, the FDA
must adapt regulations to meet the expectation of QbD based submissions. This includes
addressing the varying approaches to manufacturing and quality operations across the
pharmaceutical industry.
In addition, technology advancements remain an obstacle towards CPM applications for
both integrated and unit based methods. If manufacturers are to change from batch to continuous
manufacturing, the technology must be able to support it. This technology includes technological
advancement in continuous equipment, process analytical technology, common operating
systems, and computer based simulation software. While technological advancements have been
established extensively in literature as a requirement for continued CPM implementation, no
technology pathway has been developed. Regulatory bodies, manufacturers, and universities
should create a symbiotic relationship to aid in the recognition of technological needs and
innovation of technology to meet those identified needs.
Lastly, regulatory bodies should work with universities to help create a workforce for the
pharmaceutical industry that is already well established in the QbD and PAT methodologies to
help create a cultural shift towards the QbD way of thinking and aid in the paradigm shift of the
Page 94
81
manufacturing way of thinking towards increase product and process understanding. This
includes not only being active in creating university partnerships for increased research into
CPM quality tools, but also incorporating the CPM methodologies into the existing university
curriculums in applicable fields. This includes, but is not limited to: chemical engineering,
manufacturing engineering, pharmaceutical sciences, pharmaceutical engineering, process
engineering, and industrial engineering. Thus, engineering and pharmaceutical curriculums need
to be examined holistically to determine areas of improvements.
Future Research
The FDA and other regulatory bodies have been reducing barriers to the implementation
of CPM and promoting QbD tools and principles; however, pharmaceutical manufacturers have
been slow to modernize. Research could be done to determine the attitudes and confidence of
pharmaceutical manufacturers towards QbD and CPM to see what major challenges prevent the
successful implementation of these tools. In addition, the extent of application of these
methodologies and intent to continue to apply these tools should also be determined.
Furthermore, as the pharmaceutical industry is a complex industry with varying DP dosage forms
and therapeutic benefits, an analysis could also be performed to determine the feasibility and
applicability of CPM by dosage forms. Since manufacturing process vary by dosage forms, some
dosage forms may be more suitable for CPM processes than other dosage forms. In addition,
while CPM of unit operations is a progressive step towards an integrated CPM plant wide
operation, there should be a distinction made in literature. CPM of unit operations leads to a
Page 95
82
semi-continuous manufacturing process and not a true continuous process. Many of the inherent
disadvantages of batch manufacturing will still be present.
While, computer simulated integrated flowsheet models are extensively reviewed in
literature for other industries including the chemical and petrochemical industry there remains a
gap in literature as it applies to the pharmaceutical industry. Future research should be done on
the applications of integrated flowsheet methods as a tool for successfully implementing both
QbD and PAT methodologies for CPM. The benefits of computer simulated integrated flowsheet
methods and case studies should be performed in order to demonstrate the successful application
of this method to pharmaceutical manufacturing process. Furthermore, the technology used for
developing computer simulated integrated flowsheet models needs to be continued to be
advanced and taught in chemical engineering, pharmaceutical engineering, pharmaceutical
sciences, and other applicable coursework to aid in increase CPM knowledge, understanding,
and confidence. Furthermore, while the use of models is not new to the application of regulatory
approval, regulatory bodies need to determine how computer simulated integrated flowsheet
models fit within the existing regulatory environment. This is in addition to continuing to
determine how CPM quality is measured and judges.
Conclusion
Innovation and change in the pharmaceutical industry is imperative to meet the growing
and increasingly customizable drug product market and world demand. CPM provides many
advantages in both optimization of processes, increased DP quality, and economics over the
traditional batch manufacturing process and is extensively reviewed in literature. However,
Page 96
83
continued innovation and research needs to be done to increase manufacturing confidence in
CPM. CPM should not be only implemented on a unit operation basis, but in order to receive all
of the advantages and benefits CPM has to offer, needs to be implemented on an integrated plant
wide basis.
An integrated flowsheet model aims to increase manufacturing confidence and aid in the
implementation of CPM on a plant wide basis, by allowing manufacturers to simulate the
pharmaceutical process and answer many operation and economical questions upfront without a
large initial capital investment solely applying ex silico methods entails. In addition, integrated
flowsheet models can be used as tool for both QbD and PAT by providing a data-rich
environment.
Page 97
84
LIST OF REFERENCES
Allison, G., Cain, Y. T., Cooney, C., Garcia, T., Bizjak, T. G., Holte, O., . . . Zezza, D.
(2015). Regulatory and Quality Considerations for Continuous Manufacturing May
20–21, 2014 Continuous Manufacturing Symposium. Journal of Pharmaceutical
Sciences, 104(3), 803-812. doi:10.1002/jps.24324
FDA (2004). Guidance for Industry PAT — A Framework for Innovative Pharmaceutical
Development, Manufacturing, and Quality Assurance
https://www.fda.gov/downloads/Drugs/GuidanceComplianceRegulatoryInformation/
Guidances/ucm070305.pdf
FDA. (2009). Guidance for industry. [electronic resource] : Q8(R2) pharmaceutical
development. Rockville, MD : U.S. Dept. of Health and Human Services, Food and
Drug Administration, Center for Drug Evaluation and Research : Center for Biologics
Evaluation and Research.
FDA. (2015). Draft Guidance for Industry on Advancement of Emerging Technology
Applications To Modernize the Pharmaceutical Manufacturing Base; Draft Guidance
for Industry; Availability. Federal Register
FDA. (2016). Drug Shortages. Retrieved June 1, 2017, from
https://www.fda.gov/downloads/Drugs/DrugSafety/DrugShortages/UCM441583.pdf
Girogiorgis, D. I., & Jolliffe, H. G. (2015). Continuous pharmaceutical process engineering
and economics: Investigating technical efficiency, environmental impact and
economic viability. Chemistry Today, 33(6), 29-32.
Page 98
85
Haleem, R. M., Salem, M. Y., Fatahallah, F. A., & Abdelfattah, L. E. (2015). Quality in the
pharmaceutical industry - A literature review. Saudi Pharmaceutical Journal, (5), 463.
doi:10.1016/j.jsps.2013.11.004
Heider. (2015). Development of a Multi-Step Synthesis and Workup Sequence for an
Integrated, Continuous Manufacturing Process of a Pharmaceutical.
ISO -Risk management—Risk assessment technique (2009) 31010
ISO-Risk management—Principles and guidelines (2009). 31000. 31000
Jolliffe, H. G., & Gerogiorgis, D. I. (2015). Process modelling and simulation for continuous
pharmaceutical manufacturing of ibuprofen. Chemical Engineering Research and
Design, 97, 175-191. doi:10.1016/j.cherd.2014.12.005
Jolliffe, H. G., & Gerogiorgis, D. I. (2016). Process modelling and simulation for continuous
pharmaceutical manufacturing of artemisinin. Chemical Engineering Research and
Design, 112, 310-325. doi:10.1016/j.cherd.2016.02.017
Kessler, R. W. Prozessanalytik: Strategien und Fallbeispiele aus der industriellen Praxis.
WileyVCH Verlag GmbH & Co. KGaA: Weinheim, Germany, 2006.
Lakerveld, R., Benyahia, B., Heider, P. L., Zhang, H., Wolfe, A., Testa, C. J., . . . Barton, P.
I. (2015). The Application of an Automated Control Strategy for an Integrated
Continuous Pharmaceutical Pilot Plant. Organic Process Research &
Development, 19(9), 1088-1100. doi:10.1021/op500104d
Page 99
86
Lee, S. L., O’Connor, T. F., Yang, X., Cruz, C. N., Chatterjee, S., Madurawe, R. D., . . .
Woodcock, J. (2015). Modernizing Pharmaceutical Manufacturing: from Batch to
Continuous Production. Journal of Pharmaceutical Innovation, 10(3), 191-199.
doi:10.1007/s12247-015-9215-8
Lionberger, R. A., Lee, S. L., Lee, L., Raw, A., & Yu, L. X. (2008). Quality by Design:
Concepts for ANDAs. The AAPS Journal, 10(2), 268-276. doi:10.1208/s12248-008-
9026-7
Management Science for Health. Quality assurance for pharmaceuticals. http://www.msh.org
(direct link to the publication: https://www.msh.org/sites/msh.org/files/mds3-ch19-
qualityassurance-mar2012.pdf
Markarian, J. (2014). Trends in Manufacturing and Equipment. Pharmaceutical Technology,
(7).
Markarian, J. (2015). Taking the pulse of manufacturing trends and equipment use: our 2015
survey shows satisfaction is high and continuous manufacturing and PAT use are
growing but may be limited by lack of knowledge and experience. Pharmaceutical
Technology, (8).
Markarian, J. (2015). Taking the pulse of manufacturing trends and equipment use: our 2015
survey shows satisfaction is high and continuous manufacturing and PAT use are
growing but may be limited by lack of knowledge and experience. Pharmaceutical
Technology, (8).
Page 100
87
Markarian, J. (2016). Measuring equipment and manufacturing trends: PharmTech's 2016
survey shows general satisfaction with existing solid dose and parental manufacturing
equipment, and slow adoption of continuous manufacturing processes.
Pharmaceutical Technology, (8).
Mascia, S., Heider, P. L., Zhang, H., Lakerveld, R., Benyahia, B., Barton, P. I., . . . Trout, B.
L. (2013). End-to-End Continuous Manufacturing of Pharmaceuticals: Integrated
Synthesis, Purification, and Final Dosage Formation, 125(47), 12585-12589.
doi:10.1002/ange.201305429
Myerson, A. S., Krumme, M., Nasr, M., Thomas, H., & Braatz, R. D. (2015). Control
Systems Engineering in Continuous Pharmaceutical Manufacturing. May 20-21, 2014
Continuous Manufacturing Symposium. Journal Of Pharmaceutical Sciences, (3),
832. doi:10.1002/jps.24311
Nadpara, N., Thumar, R., Kalola, V., & Patel, P. (2012). Quality By Design (QBD): A
Complete Review. International Journal of Pharmaceutical Sciences Review and
Research, 17(2), 20-28. Retrieved August 30, 2017.
O’Connor, T. F., Yu, L. X., & Lee, S. L. (2016). Emerging technology: A key enabler for
modernizing pharmaceutical manufacturing and advancing product quality.
International Journal of Pharmaceutics, 509(1-2), 492-498.
doi:10.1016/j.ijpharm.2016.05.058
Page 101
88
Pallagi, E., Karimi, K., Ambrus, R., Szabó-Révész, P., & Csóka, I. (2016). New aspects of
developing a dry powder inhalation formulation applying the quality-by-design
approach. International Journal of Pharmaceutics, 511(1), 151-160.
doi:10.1016/j.ijpharm.2016.07.003
Petrides, D., Carmichael, D., Siletti, C., & Koulouris, A. (2014). Biopharmaceutical Process
Optimization with Simulation and Scheduling Tools. Bioengineering, 1(4), 154-187.
doi:10.3390/bioengineering1040154
Pharmaceutical Quality System Q10-International conference on harmonization of technical
requirements for registration of pharmaceuticals for human use, ICH Harmonised
Tritpartite Guideline (2008)
Pramod, K., Abu Tahir, M., Charoo, N. A., Ansari, S. H., & Ali, J. (2016). Pharmaceutical
product development: A quality by design approach. International Journal Of
Pharmaceutical Investigation, 6(3), 129-138. doi:10.4103/2230-973X.187350
Rogers, A., & Ierapetritou, M. (2014). Challenges and Opportunities in Pharmaceutical
Manufacturing Modeling and Optimization. Proceedings of the 8th International
Conference on Foundations of Computer-Aided Process Design Computer Aided
Chemical Engineering, 144-149. doi:10.1016/b978-0-444-63433-7.50015-8
Rogers, A., Hashemi, A., & Ierapetritou, M. (2013). Modeling of Particulate Processes for
the Continuous Manufacture of Solid-Based Pharmaceutical Dosage
Forms. Processes, 1(2), 67-127. doi:10.3390/pr1020067
Page 102
89
Sangshetti, J. N., Deshpande, M., Zaheer, Z., Shinde, D. B., & Arote, R. (2014). Review:
Quality by design approach: Regulatory need. Arabian Journal Of Chemistry,
doi:10.1016/j.arabjc.2014.01.025
Schaber, S. D., Gerogiorgis, D. I., Ramachandran, R., Evans, J. M., Barton, P. I., & Trout, B.
L. (2011). Economic Analysis of Integrated Continuous and Batch Pharmaceutical
Manufacturing: A Case Study. Industrial & Engineering Chemistry Research,
50(Lionberger et al., 2008), 10083-10092. doi:10.1021/ie2006752
Seifert, T., Sievers, S., Bramsiepe, C., & Schembecker, G. (2012). Small scale, modular and
continuous: A new approach in plant design. Chemical Engineering & Processing:
Process Intensification, 52140-150. doi:10.1016/j.cep.2011.10.007
Sen, M., Rogers, A., Singh, R., Chaudhury, A., John, J., Ierapetritou, M. G., &
Ramachandran, R. (2013). Flowsheet optimization of an integrated continuous
purification-processing pharmaceutical manufacturing operation. Chemical
Engineering Science, 102, 56-66. doi:10.1016/j.ces.2013.07.035
Singh, L., & Sharma, V. (2015). Quality by Design (QbD) Approach in Pharmaceuticals:
Status, Challenges and Next Steps. Drug Delivery Letters, 5(1), 2-8.
doi:10.2174/2210303104666141112220253
Sklamberg, H. R. (2013, July 12). Evolution in FDAs Approach to Pharmaceutical Quality.
Retrieved June 1, 2017, from
https://www.fda.gov/downloads/RegulatoryInformation/LawsEnforcedbyFDA/Signifi
cantAmendmentstotheFDCAct/FDASIA/UCM363523.pdf
Page 103
90
Su, Q., Nagy, Z. K., & Rielly, C. D. (2015). Pharmaceutical crystallisation processes from
batch to continuous operation using MSMPR stages: Modelling, design, and control.
Chemical Engineering & Processing: Process Intensification, 8941-53.
doi:10.1016/j.cep.2015.01.001
Woodcock, J. The concept of pharmaceutical quality. American Pharmaceutical Review
2004, 7 (6), 10-15.
Yu, L., Amidon, G., Khan, M., Hoag, S., Polli, J., Raju, G., & Woodcock, J. (n.d).
Understanding Pharmaceutical Quality by Design. Aaps Journal, 16(4), 771-783.
Zomer, S., Gupta, M., & Scott, A. (2010). Application of Multivariate Tools in
Pharmaceutical Product Development to Bridge Risk Assessment to Continuous
Verification in a Quality by Design Environment. Journal of Pharmaceutical
Innovation, 5(3), 109-118. doi:10.1007/s12247-010-9085-z