Page 1
Western Kentucky UniversityTopSCHOLAR®Honors College Capstone Experience/ThesisProjects Honors College at WKU
12-8-2014
Quality Change and Thermal Inactivation ofEscherichia coli O157:H7 in Non-Intact Beef andVeal Patties by Double Pan-BroilingKawang LiWestern Kentucky University, [email protected]
Follow this and additional works at: http://digitalcommons.wku.edu/stu_hon_thesesPart of the Biology Commons
This Thesis is brought to you for free and open access by TopSCHOLAR®. It has been accepted for inclusion in Honors College Capstone Experience/Thesis Projects by an authorized administrator of TopSCHOLAR®. For more information, please contact [email protected] .
Recommended CitationLi, Kawang, "Quality Change and Thermal Inactivation of Escherichia coli O157:H7 in Non-Intact Beef and Veal Patties by DoublePan-Broiling" (2014). Honors College Capstone Experience/Thesis Projects. Paper 519.http://digitalcommons.wku.edu/stu_hon_theses/519
Page 2
QUALITY CHANGE AND THERMAL INACTIVATION OF ESCHERICHIA COLI
O157:H7 IN NON-INTACT BEEF AND VEAL PATTIES BY DOUBLE PAN-
BROILING
A Capstone Experience/Thesis Project
Presented in Partial Fulfillment of the Requirements for
the Degree Bachelor of Science with
Honors College Graduate Distinction at Western Kentucky University
By
Ka Wang Li
*****
Western Kentucky University
2014
CE/T Committee:
Approved by
Dr. Cangliang Shen, Advisor
Dr. Kerrie McDaniel _______________________
Advisor
Dr. Ajay Srivastava Department of Biology
Page 3
Copyright by
Ka Wang Li
2014
Page 4
ii
ABSTRACT
Escherichia coli O157:H7 (ECOH) may translocate from meat surfaces to internal
tissues during grinding processes. This study evaluated the inactivation of ECOH in
ground beef and veal by cooking to various internal temperatures (55°C, 62.5°C, 71.1°C,
and 76°C). Grounded beef/veal were inoculated with 6 log ECOH and prepared into
patties, stored aerobically (4°C, 4 -days) before double-pan-broiling to the internal
temperatures mentioned above with a three-minute rest. Samples’ color were monitored,
which changed significantly during storage and cooking. Pathogen concentration was
measured by plating the homogenized sample on TSA and McConkey agar. The
pathogen population was below detectable limit when samples were cooked to/above
71.1°C with a three-minute rest time, suggesting that said internal temperature reduces E.
coli amount to an acceptable limit for human consumption. These findings will be useful
to the United States Department of Agriculture Food Safety and Inspection Service
(USDA-FSIS) for risk assessments on non-intact beef/veal products.
Keywords: Escherichia coli O157:H7, Non-intact, color, Beef, Veal, Thermal inactivation
Page 5
iii
Dedicated to
My Mentors, Family and Friends
Page 6
iv
ACKNOWLEDGEMENTS
There are many people who had a hand in helping complete and revise this thesis
project; as such I’d like to express my gratitude towards them for all their help and
support.
First off, I would like to thank the WKU Honors College for approving the
Honors Develop Grant in early spring, 2014. It meant a tremendous amount to me as a
student to be able to have their support and was a great motivator for continuing my
project.
Secondly, this project could not have succeeded without the contribution from Dr.
Cangliang Shen (Biology Dept., WKU). We spent a number of semesters making this
project a reality together and I cannot express my thanks enough to Dr. Shen for spending
his valuable time and effort to help guide me throughout every aspect of this project-
from carrying out the experiments and analyzing the data we collected, to proofreading
the written report and always making sure I am on the right track. It was such an
incredible experience to be able to practice in this field of study with a great mentor and I
greatly look forward to continuing further research in this topic of interest.
I also would like to thank Dr. Amanda McKeith (Animal Sciences and
Agricultural Education Dept., California State University, Fresno, CA) for helping to
Page 7
v
show the correct ways to measure the color in the samples and getting the samples ready
for aerobic storage.
Additionally, a thank you is also in order for my committee, whose input was a
most valuable resource. It was such pleasure to work with my second reader Dr. Kerrie
McDaniel (Biology Dept., WKU) and third reader Dr. Ajay Srivastava (Biology Dept.,
WKU) and I am grateful for their valuable insights and comments that ultimately
contributed a great deal in improving the quality of this thesis.
Last but not least, I would also like to give a special thanks to Brenna Shrill
(Honors College, WKU), and Kelli Hogue (Communication Dept., WKU) for the help in
formatting and editing the document.
Page 8
ii
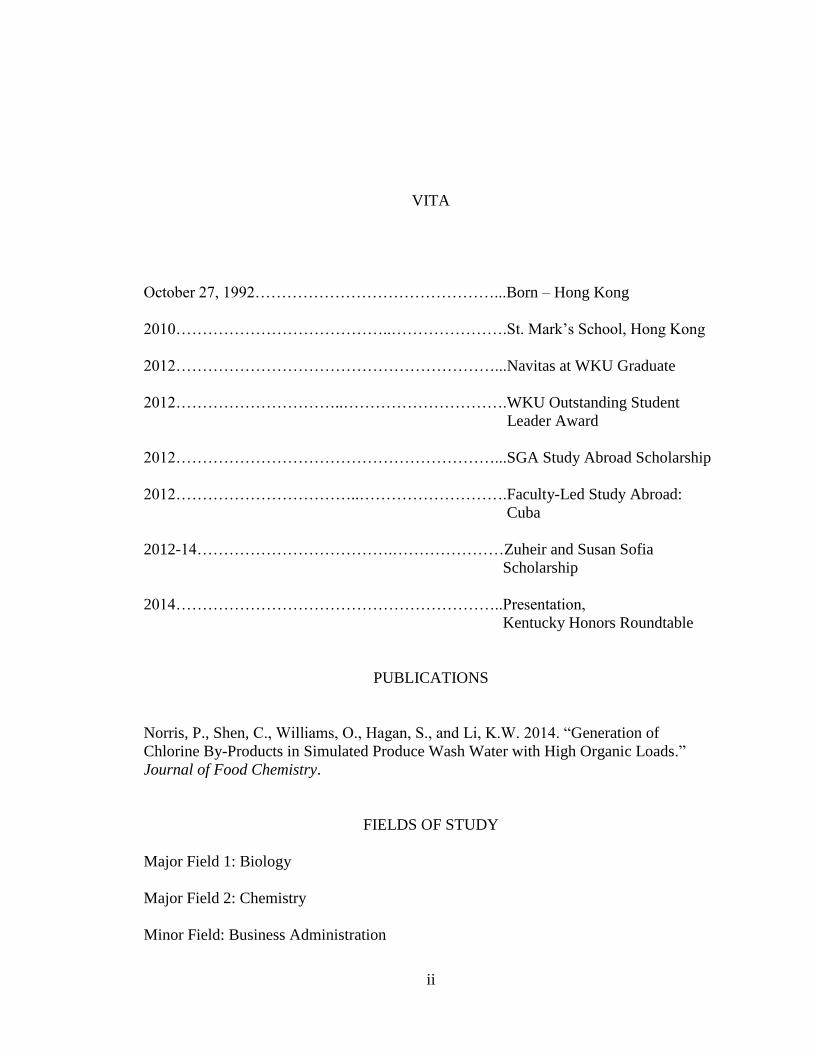
VITA
October 27, 1992………………………………………...Born – Hong Kong
2010…………………………………..………………….St. Mark’s School, Hong Kong
2012……………………………………………………...Navitas at WKU Graduate
2012…………………………..………………………….WKU Outstanding Student
Leader Award
2012……………………………………………………...SGA Study Abroad Scholarship
2012……………………………..……………………….Faculty-Led Study Abroad:
Cuba
2012-14……………………………….…………………Zuheir and Susan Sofia
Scholarship
2014……………………………………………………..Presentation,
Kentucky Honors Roundtable
PUBLICATIONS
Norris, P., Shen, C., Williams, O., Hagan, S., and Li, K.W. 2014. “Generation of
Chlorine By-Products in Simulated Produce Wash Water with High Organic Loads.”
Journal of Food Chemistry.
FIELDS OF STUDY
Major Field 1: Biology
Major Field 2: Chemistry
Minor Field: Business Administration
Page 9
iii
TABLE OF CONTENTS
Page
Abstract……………………………………………………………………………………ii
Dedication………………………………………………………………………………...iii
Acknowledgements……………………………………………………………………….iv
Vita………………………………………………………………………………………...v
List of Figures……………………………………………………………………………vii
Chapters:
1. Introduction………………………………………………………………………..1
2. Materials and Methods……………………………………………………………4
3. Results and Discussion……………………………………………………………9
Bibliography………………………………………………………………..……………17
Appendix…………………………………………………………………………………20
Page 10
iv
LIST OF FIGURES
Figure Page
Table 3.1: Summary of the quality control for beef patty samples…………..……………9
Table 3.2: Summary of the quality control for veal patty samples.………………….……9
Figure A1: Cooking curve for beef patties………………………………………………18
Figure A2: Cooking curve for veal patties………………………………………………18
Table A3: Color variance during storage.……………………………………………….19
Table A4: Internal Color variance before and after cooking…………………………….19
Figure A5: Comparison of pH values…………………………………………...……….20
Figure A6: Comparison of water activity.……………………………………………….20
Figure A7: Comparison of cooking loss………………………………………...……….20
Figure A8: Comparison of change in Fat content.…….……………….………...………21
Figure A9: Comparison of change in moisture ………….…………………..…..………21
Figure A10: Comparison of change of redness (a*)……………………...………...……21
Figure A11: Comparison of change of yellowness (b*)…………………........................22
Figure A12: Comparison of change of lightness (L*)…………………...........................22
Figure A13: Comparison of the internal redness (a*)…………………............................22
Figure A14: Comparison of the internal yellowness (b*)..…………................................23
Figure A15: Comparison of the internal lightness (L*)………………….........................23
Page 11
v
Figure A16: Comparison of the surface redness (a*).…………………….......................23
Figure A17: Comparison of the surface yellowness (b*)..………………………………24
Figure A18: Comparison of the surface lightness (L*)…………………….....................24
Figure A19: Comparison of inactivation of STEC with different treatments……………25
Page 12
1
CHAPTER 1
INTRODUCTION
Escherichia coli O157:H7 and Non-O157:H7 Shiga Toxin producing Escherichia
coli (STEC) can generate shiga toxins that can cause severe hemolytic uremic syndrome
in infected human bodies with as few as 10 cells (Doyle et al, 1997). E. coli 0157:H7 has
been seen as an adulterant of raw non-intact beef products since 1999. The United States
Department of Agriculture, Food Safety and Inspection Service (USDA-FSIS, 2011)
defines non-intact beef products as products that have gone through treatments like
grounding, restructuring or mechanical tenderization processes such as cubing, needling
and pounding devices. These non-intact beef products have been involved in several E.
coli O157:H7 infection outbreaks in the United States since 2000. During non-intact beef
production processes, pathogen cells like E. coli O157:H7 on the meat surface may be
translocated and trapped in sterile internal tissues, protecting themselves from thermal
destruction if the meat is undercooked. A recent survey showed that 40-58% of U.S.
consumers ordered beef steaks at medium rare (60-62.8oC) to rare (54.4-57.2
oC), which
could potentially put them at risk to an E. coli infection and threaten public health.
Although the effectiveness of cooking inactivation of E. coli O157:H7 contaminated in
moisture enhanced non-intact beef has been documented in three studies (Shen et al.,
2010a; 2010b; 2011), limited information is available regarding the thermal inactivation
of E. coli O157:H7 strains on veal products.
Page 13
2
Veal, originated from Europe, is the meat from 16-18 weeks old calves. In the
past 10 years, 25% of American households purchased veal products in restaurant or
retail stores at least once every three months (available at:
http://www.beef.org/udocs/Beef%20Bytes%20Veal%20Trends.pdf.). Different veal cuts,
such as cutlet, coin, rib, breast, and shank, are most popular to restaurant consumers due
to their unique tenderness and flavor. Moreover, nutrition of veal products match the
dietary guidelines recommended by the American Heart Association, the American
Dietetic Association, and the USDA.
Although veal has not been implicated in E. coli outbreaks in the U.S., since 2009
there have been multiple recalls on veal products amounting to 14,600 lbs. (ca. 6649 kg)
due to possible E. coli O157:H7 and STECs contamination (Luchansky et al. 2014).
According to the USDA-FSIS, there is a greater prevalence of STEC in veal products
than in other beef products. For example, as of 14 July 2013, the USDA-FSIS in their
testing of raw ground beef component samples in federal meat-processing factories
discovered 0 (0%) of 383 samples positive for ECOH, and 3 (0.78%) of 383 samples
positive for STEC in beef; whereas 3 (6.12%) of 49 samples were positive for ECOH and
1 (7.69%) of 13 samples were positive for STEC in veal (USDA-FSIS, 2013). The
difference of confirmed STEC positives from veal compared to that from beef is striking
and raises the question of whether consumption of veal poses a greater risk to public
health than beef.
Beef and veal products’ safety is important to the industry and consumer, but
consumers tend to identify the products’ quality based on appearance. Cornforth and
Jayasingh (2004) stated that color is one of the most important characteristics when it
Page 14
3
comes to consumers purchasing decisions, even though color is sometimes poorly related
to the meat quality. Fresh beef or veal meat is often displayed in Styrofoam trays and
covered with PVC oxygen permeable films, which allows the quick desirable red color
development due to the quick pigment oxygenation. However, discoloration often occurs
within 1 week of shelf time. At this moment, the number of studies that focus on the
quality change of veal products during processing, storage and cooking, in terms of
factors like water activity, pH, moisture, fat content and color is very limited.
The objective of this study is to investigate the quality variances, including color
variation in non-intact coarse ground beef and veal during aerobic storage and the
cooking process, and evaluate the thermal inactivation of E. coli O157:H7 in coarse
ground beef and veal patties. We hypothesize that beef and veal patties have similar
tendency in quality change throughout storage and cooking, and similar increases in
inactivation of ECOH and STEC when heated to higher internal temperature.
Page 15
4
CHAPTER 2
MATERIALS AND METHODS
Inoculum preparation
E. coli O157:H7 strains ATCC43895, ATCC43888, ATCC43889 (Shiga toxin
negative, kindly provided by Mr. Beth Whittam, Michigan State University, East Lansing,
MI) were cultured and subcultured individually in 10 mL tropic soy broth (TSB) at 35oC
for 24 hours. The three cultures were then mixed and centrifuged (Eppendorf model
5810R, Brinkmann Instruments Inc., Westbury, NY) at 4,629×g for 15 min at 4°C. The
harvested cells were washed twice with 10 ml of phosphate buffered saline (PBS),
centrifuged as previously described, and re-suspended in 30 ml of fresh PBS. The washed
inoculum was serially diluted in PBS to obtain an inoculation level of ~6 log CFU/g
when 40 ml of inoculum was added to 2 kg of coarse-ground beef or veal.
Preparation of non-intact ground beef and veal patties
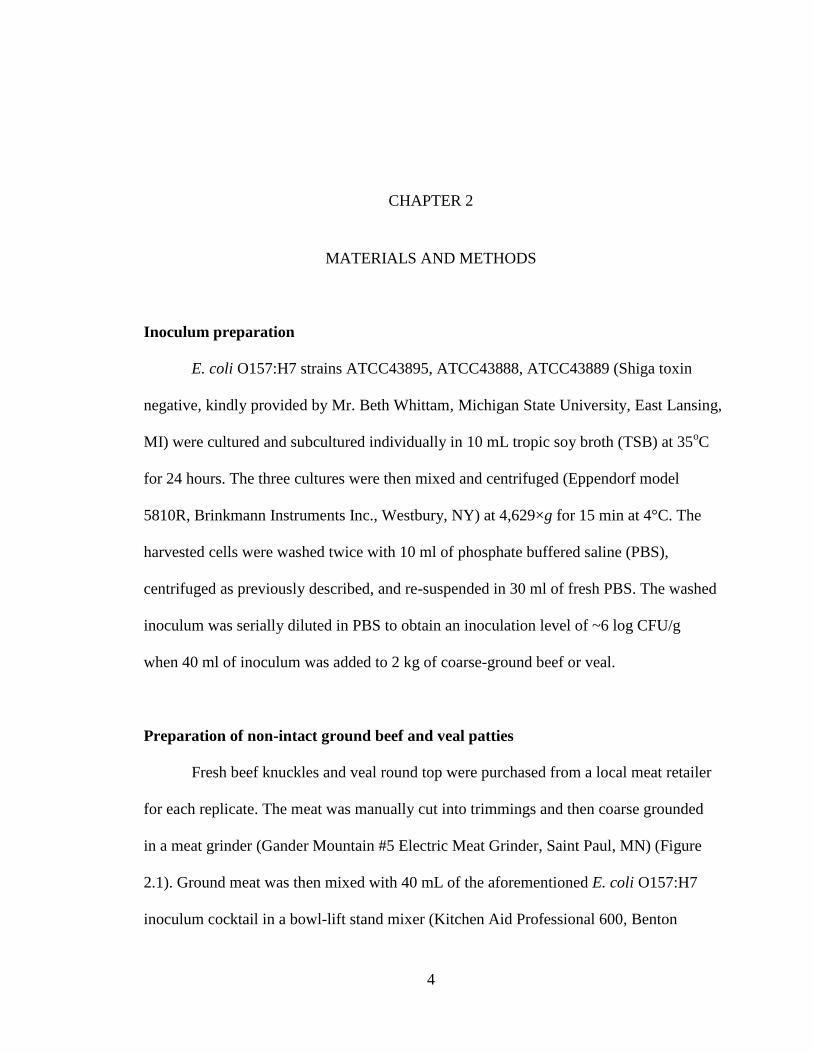
Fresh beef knuckles and veal round top were purchased from a local meat retailer
for each replicate. The meat was manually cut into trimmings and then coarse grounded
in a meat grinder (Gander Mountain #5 Electric Meat Grinder, Saint Paul, MN) (Figure
2.1). Ground meat was then mixed with 40 mL of the aforementioned E. coli O157:H7
inoculum cocktail in a bowl-lift stand mixer (Kitchen Aid Professional 600, Benton
Page 16
5
Figure 2.1: Meat obtained from
local stores were coarse
grounded by the meat grinder
(Gander Mountain #5 Electric
Meat Grinder, Saint Paul, MN).
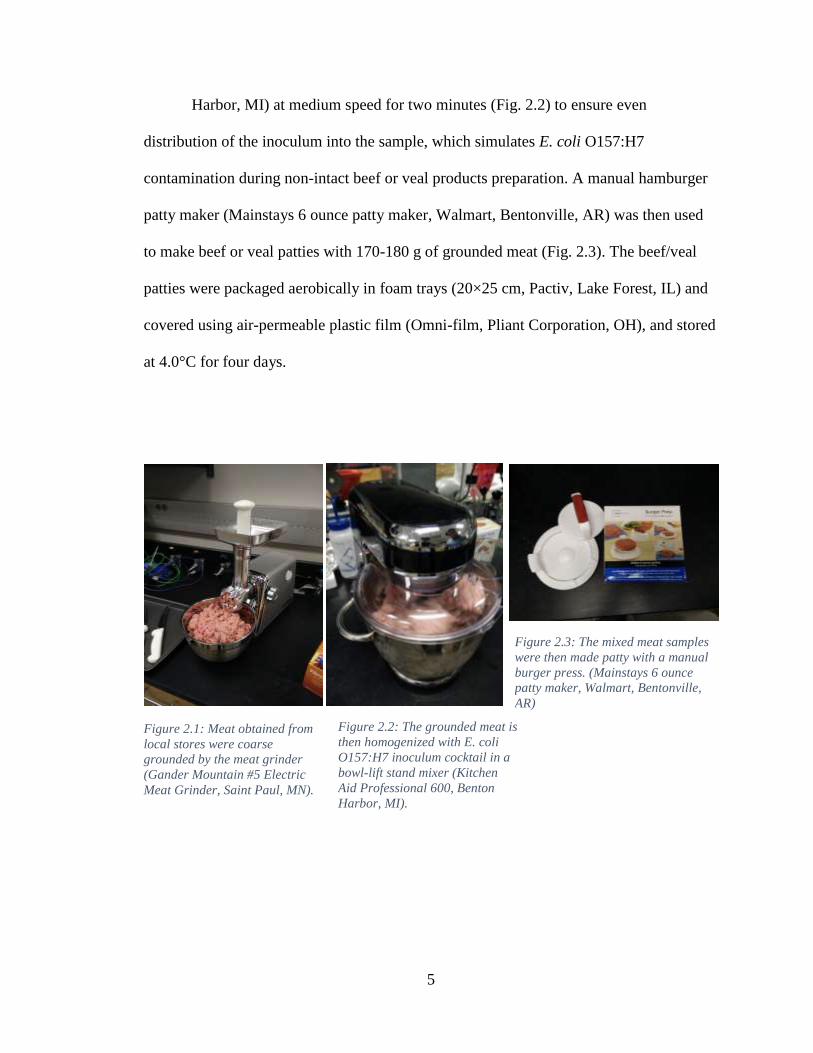
Figure 2.2: The grounded meat is
then homogenized with E. coli
O157:H7 inoculum cocktail in a
bowl-lift stand mixer (Kitchen
Aid Professional 600, Benton
Harbor, MI).
Figure 2.3: The mixed meat samples
were then made patty with a manual
burger press. (Mainstays 6 ounce
patty maker, Walmart, Bentonville,
AR)
Harbor, MI) at medium speed for two minutes (Fig. 2.2) to ensure even
distribution of the inoculum into the sample, which simulates E. coli O157:H7
contamination during non-intact beef or veal products preparation. A manual hamburger
patty maker (Mainstays 6 ounce patty maker, Walmart, Bentonville, AR) was then used
to make beef or veal patties with 170-180 g of grounded meat (Fig. 2.3). The beef/veal
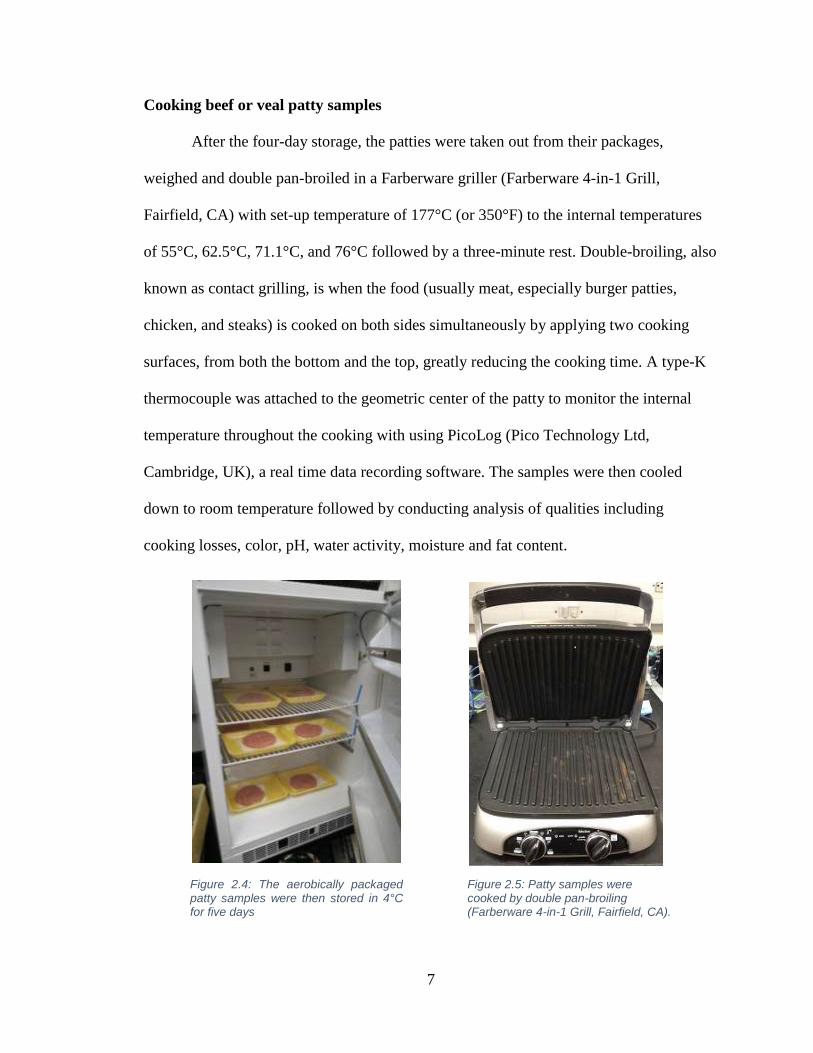
patties were packaged aerobically in foam trays (20×25 cm, Pactiv, Lake Forest, IL) and
covered using air-permeable plastic film (Omni-film, Pliant Corporation, OH), and stored
at 4.0°C for four days.
Page 18
7
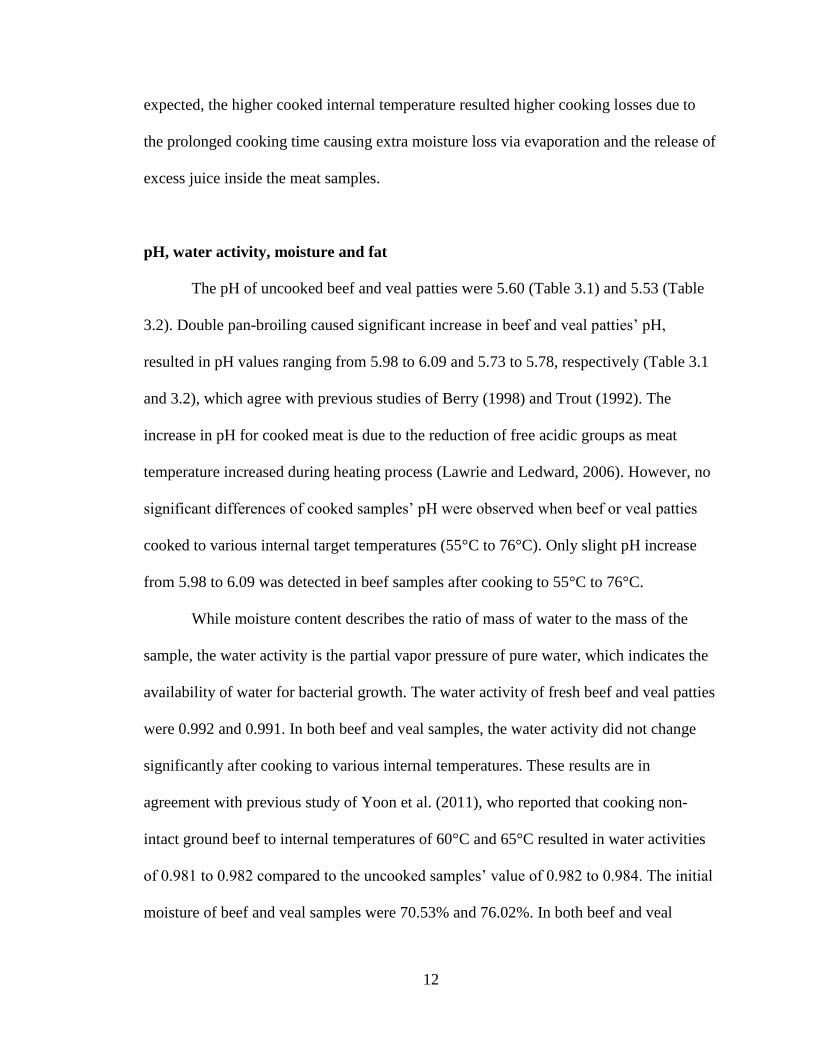
Figure 2.4: The aerobically packaged patty samples were then stored in 4°C for five days
Figure 2.5: Patty samples were cooked by double pan-broiling (Farberware 4-in-1 Grill, Fairfield, CA).
Cooking beef or veal patty samples
After the four-day storage, the patties were taken out from their packages,
weighed and double pan-broiled in a Farberware griller (Farberware 4-in-1 Grill,
Fairfield, CA) with set-up temperature of 177°C (or 350°F) to the internal temperatures
of 55°C, 62.5°C, 71.1°C, and 76°C followed by a three-minute rest. Double-broiling, also
known as contact grilling, is when the food (usually meat, especially burger patties,
chicken, and steaks) is cooked on both sides simultaneously by applying two cooking
surfaces, from both the bottom and the top, greatly reducing the cooking time. A type-K
thermocouple was attached to the geometric center of the patty to monitor the internal
temperature throughout the cooking with using PicoLog (Pico Technology Ltd,
Cambridge, UK), a real time data recording software. The samples were then cooled
down to room temperature followed by conducting analysis of qualities including
cooking losses, color, pH, water activity, moisture and fat content.
Page 19
8
Color measurement
Objective color measurements of non-intact beef or veal patties were determined
at each day of storage, after cooking to 55°C, 62.5°C, 71.1°C, or 76°C (internal and
external parts) using a portable spectrophotometer (HunterLab Miniscan EZ, Reston, VA)
with full spectral data being obtained as L* (lightness), a* (redness), and b* (yellowness),
along with reflectance data. An average value for L*, a*, and b* was determined from the
mean of three random readings on the surface from 3 pieces of each treatments used for
color analysis.
Physical, chemical and microbiological analyses
Cooking losses were determined by measuring the difference in patties’ weight
before cooking, and then after cooking when samples were cooled to room temperature.
The pH of the meat homogenate was measured after microbial analysis using a digital pH
meter (Fisher Scientific, Fair Lawn, NY). Water activity (aw) indicates the availability of
water for bacterial growth. The water activity of uncooked and cooked samples were
measured using an AquaLab water activity meter (model series 3, Decagon Devices Inc.,
Pullman, WA). All samples were tested for fat and moisture content at the meat science
lab of University of Illinois at Urbana– Champaign. For microbiological analysis, the
individual uncooked or cooked beef or veal samples were transferred into a Whirl-Pak
filter bag (1627 ml, 19 × 30 cm, Nasco, Modesto, CA) with 1:1 weight’s worth of
nutrition broth and homogenized (Masticator, IUL Instruments, Barcelona, Spain) for 2
Page 20
9
minutes. Serial tenfold dilutions of each sample, in PBS, were surface-plated onto tryptic
soy agar (Acumedia, Lansing, MI) supplemented with 0.1% sodium pyruvate (Fisher
Scientific, Fair Lawn, NY; TSAP) and Mcconkey agar (Acumedia, Lansing, MI) for
enumeration of total bacterial populations and E. coli O157:H7, respectively. Colonies
were counted manually after incubation at 35°C for 48 hours.
Statistical analysis
The experiment was repeated twice with two to three samples in each replicate.
Quality parameters and microbial populations (log CFU/g) were analyzed with one-way
ANOVA of IBM SPSS Statistics 21. All comparisons were performed with alpha = 0.05.
Page 21
10
CHAPTER 3
RESULTS AND DISCUSSION
Table 3.1: Summary of the quality control for beef patty samples.
Beef Before cooking After heating to (°C)
55 62.5 71.1 76
Cooking loss (%) - 17.83 ± 5.56a 24.17 ± 2.71b 26.67 ± 2.50b 29.00 ± 1.55b
pH 5.60 ± 0.07a 5.98 ± 0.11b 6.07 ± 0.16b 6.08 ± 0.15b 6.09 ± 0.15b
Aw 0.992 ± 0.001a 0.990 ± 0.003a 0.991 ± 0.005a 0.990 ± 0.003a 0.987 ± 0.003a
Moisture (%) 70.53 ± 0.55a 66.63 ± 1.85b 64.36 ± 1.23bc 63.04 ± 1.25c 62.60 ± 1.18c
Fat 6.46 ± 0.77a 8.62 ± 0.65b 9.34 ± 0.44b 9.45 ± 0.55b 8.96 ± 0.60b
Table 3.2: Summary of the quality control for veal patty samples.
Veal Before cooking After heating to (°C)
55 62.5 71.1 76
Cooking loss (%) - 19.00 ± 3.56a 20.75 ± 5.50a 28.25 ± 0.96b 29.00 ± 0.82b
pH 5.53 ± 0.01a 5.78 ± 0.02b 5.74 ± 0.08b 5.73 ± 0.08b 5.74 ± 0.08b
Aw 0.991 ± 0.005a 0.989 ± 0.003a 0.988 ± 0.002a 0.987 ± 0.002a 0.988 ± 0.001a
Moisture (%) 76.02 ± 0.36a 71.19 ± 0.51b 69.57 ± 2.01bc 67.95 ± 0.49cd 67.07 ± 0.89d
Fat 2.19 ± 0.25a 2.79 ± 0.54a 3.00 ± 0.44a 3.02 ± 0.46a 2.92 ± 0.17a
* Means with different letter in the same row are significantly (P < 0.05) different.
Page 22
11
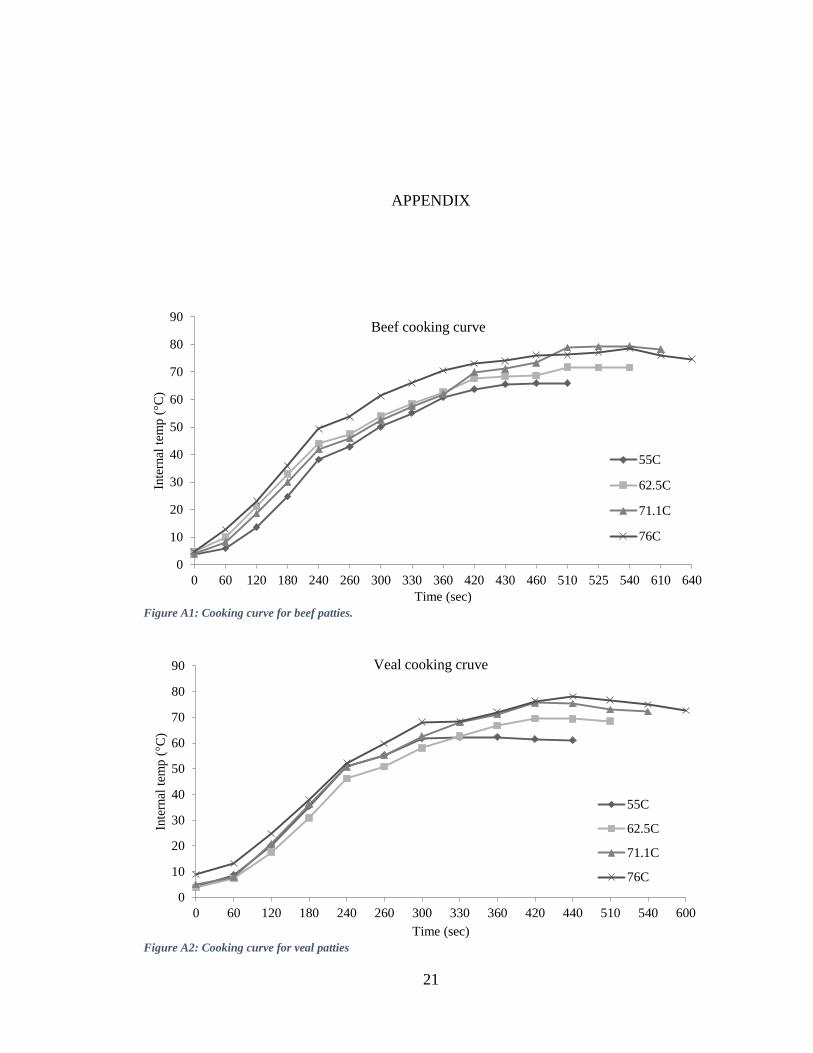
Cooking curve and cooking losses
The initial geometric center temperature of uncooked beef and veal patties ranged
from 3.6°C to 4.8°C and 4.1°C to 8.9°C, respectively. Cooking of beef samples by double
pan-broiling required 330, 360, 430 and 460 seconds to reach the internal center
temperatures of 55, 62.5, 71.1 and 76oC, respectively (Figure A1). In veal samples, it
took 300, 330, 360, and 420 seconds to achieve internal temperatures of 55, 62.5, 71.1
and 76oC, respectively (Figure A2). The slightly shorter cooking time required by veal
samples to reach the same internal temperatures compared to beef is possibly due to the
relative lower muscle fiber content, allowing heat to transfer and penetrate the veal
patties more efficiently. It is also possible that shorter cooking time could be due to the
higher moisture content in veal. As more moisture converts into steam, which has higher
energy, the cooking rate of the veal patties could increase by cooking the patty from
inside. As expected, during the 3-minute resting time, in both beef and veal samples, the
geometric center temperatures continued to increase between 61°C to 65.9°C, 68.4°C to
71.6°C, and 72°C to 78.2°C when cooking samples to 55, 62.5, 71.1oC, respectively
(Figure A1 and A2). When cooking beef and veal samples to 76oC, the temperature
ranged from 74.6°C to 78.5°C and 72.6°C to 78°C, respectively (Figure A1 and A2).
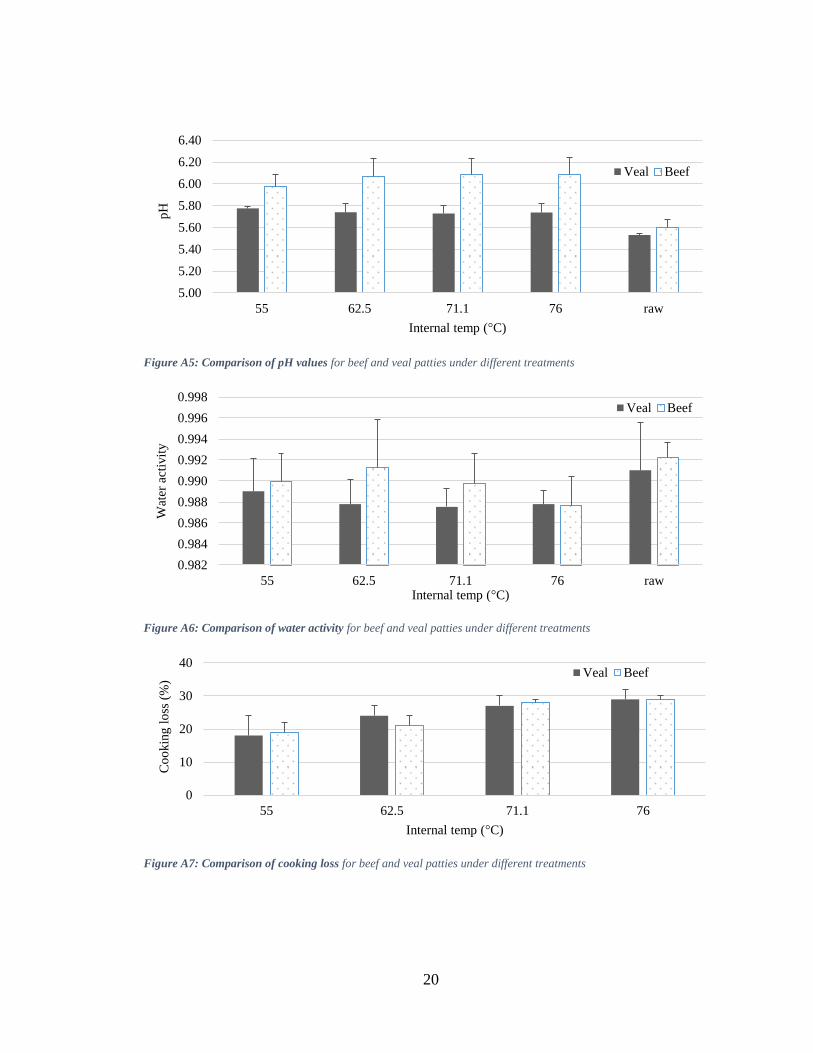
Cooking caused weight losses ranging from 17.83% to 29% in non-intact beef and
19% to 29% in non-intact veal samples (Table 3.1 and 3.2). In beef samples, double pan-
broiling to internal temperatures of 71.1°C and 76°C resulted in higher cooking losses
(28.25-29%) than those from cooked to 55°C and 62.5°C (19-20.75%) (Table 3.1). In
veal samples, cooking to internal temperatures of 65°C to 76°C resulted in higher
cooking losses (24.16-29%) than those from cooked to 55oC (17.83%) (Table 3.2). As
Page 23
12
expected, the higher cooked internal temperature resulted higher cooking losses due to
the prolonged cooking time causing extra moisture loss via evaporation and the release of
excess juice inside the meat samples.
pH, water activity, moisture and fat
The pH of uncooked beef and veal patties were 5.60 (Table 3.1) and 5.53 (Table
3.2). Double pan-broiling caused significant increase in beef and veal patties’ pH,
resulted in pH values ranging from 5.98 to 6.09 and 5.73 to 5.78, respectively (Table 3.1
and 3.2), which agree with previous studies of Berry (1998) and Trout (1992). The
increase in pH for cooked meat is due to the reduction of free acidic groups as meat
temperature increased during heating process (Lawrie and Ledward, 2006). However, no
significant differences of cooked samples’ pH were observed when beef or veal patties
cooked to various internal target temperatures (55°C to 76°C). Only slight pH increase
from 5.98 to 6.09 was detected in beef samples after cooking to 55°C to 76°C.
While moisture content describes the ratio of mass of water to the mass of the
sample, the water activity is the partial vapor pressure of pure water, which indicates the
availability of water for bacterial growth. The water activity of fresh beef and veal patties
were 0.992 and 0.991. In both beef and veal samples, the water activity did not change
significantly after cooking to various internal temperatures. These results are in
agreement with previous study of Yoon et al. (2011), who reported that cooking non-
intact ground beef to internal temperatures of 60°C and 65°C resulted in water activities
of 0.981 to 0.982 compared to the uncooked samples’ value of 0.982 to 0.984. The initial
moisture of beef and veal samples were 70.53% and 76.02%. In both beef and veal
Page 24
13
samples, the moisture content significantly decreased as cooked internal temperature
increased from 55°C to 76°C (Table 3.1 and 3.2). When cooking beef or veal patties to
71.1°C or 76°C significantly decreased moisture contents to approximately 63% (beef)
and 67% (veal) compared to the 66% (beef) and 71% (veal) in samples cooked to 55 °C
(Table 3.1 and 3.2). Previous studies of Trout et al. (1992) and Shen et al. (2010) also
reported that the moisture content of ground beef patties and moisture enhanced
reconstructed beef patties was lower after cooking. The decrease of moisture content of
beef and veal is likely due to the loss of water during cooking/heating process (Shen et al.,
2010).
The fat content of fresh beef and veal patties was 6.46% and 2.19% (Table 3.1
and 3.2). Cooked beef samples had a significant (P< 0.05) increased fat content of 8.62%
to 9.45% irrespectively of cooked internal temperatures (Table 3.1 and 3.2). Trout et al.
(1998), Yoon et al. (2011) and Shen et al. (2010) all reported that cooking low fat ground
beef or non-intact beefs increased fat content due to the moisture loss. A slightly (P=
0.074, >0.05) increased fat content ranging from 2.79% to 3.09% was tested in cooked
veal samples compared to the uncooked ones.
Color variation during storage and cooking
The fresh prepared beef patties’ a*, b*, and L* value was 34.75, 25.89 and 44.94,
respectively (Table A3 and A4). Compared to beef samples, a lower (P<0.05) a* and b*
value of 26.98 and 22.63, and a higher L* value of 59.83 was detected in fresh veal
patties (Table A3 and A4). The less red and lighter color is expected in veal samples
because veal is the meat of bovine animal aged 8 months or less containing less
Page 25
14
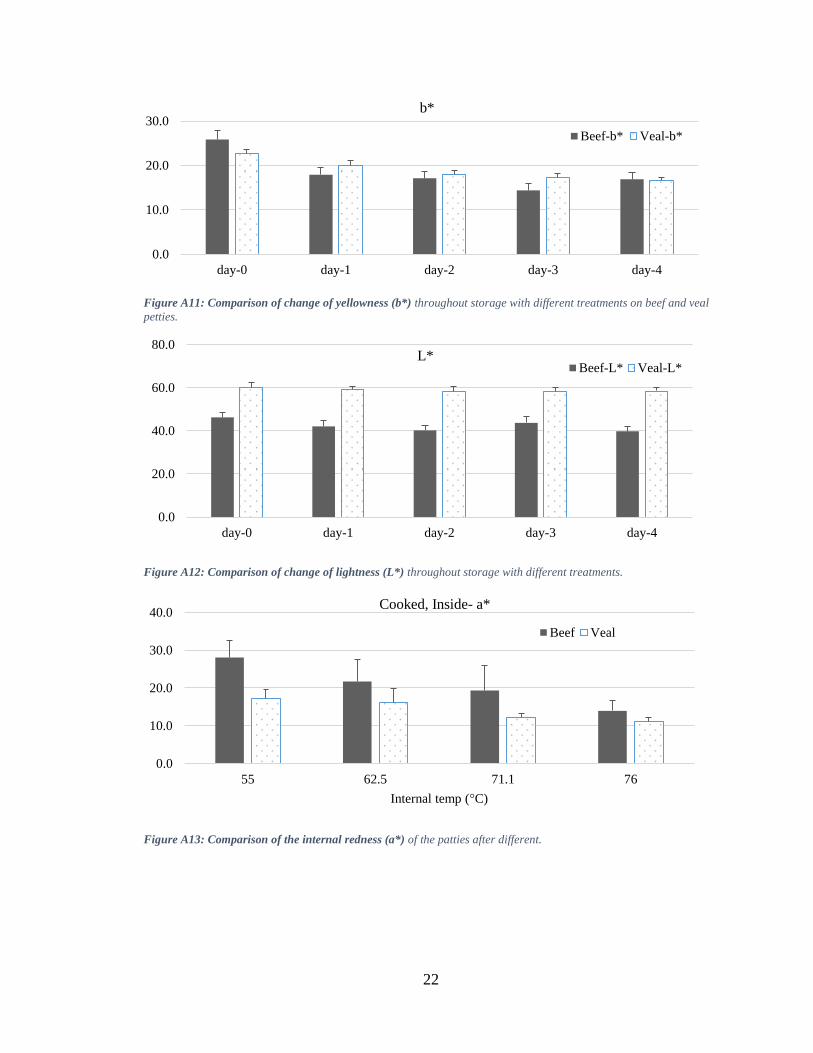
myoglobin contents than those of beefs. During the aerobic storage, in general, the a*, b*,
and L* values were significantly decreased from 34.75 to 15.26, 25.85 to 14.39, and
44.94 to 39.85 in beef patties, and decreased from 26.98 to 12.76, 22.63 to 16.53, and
59.82 to 57.87 in veal samples. These results agree with previous study of Troutt et al.
(1992), who found that a*, b*, and L* value decreased as display time increased from 0
to 3 days. Madhavi and Carpenter (1993), also reported that the discoloration occurs
within 7 days of oxygen permeable film paged beef muscles. During PVC film storage,
the oxymyoglobin reacted with oxygen forming metmyoglobin causing the less red color
of beef or veal samples.
As expected, in general, a* and b* values of cooked beef samples’ internal color
decreased (less red and yellow) (Table A13 and A14) whereas the L* value increased as
the internal end-point temperature increased (Table A15). For a* and b* value, a lower
value of 13.95 (a*, less red) and 17.93 (b*, less yellow) was detected in beef samples
cooked to 76oC compared to the 28.05 (a*) and 24.41 (b*) of samples cooked to 55
oC
(Table A13 and A14). However, beef samples cooked to 62.5°C or 71.1°C had similar a*
values of 19.34 to 21.75, and cooked to 55°C or 62.5°C resulted similar b* values of
23.51 to 24.41 (Table A13 and A14). For L* value, cooking beef samples to 62.5, 71.1
and 76 °C resulted a higher value of 53.66 to 54.19 compared to the value of 50.24 in
samples cooked to 55oC (Table A15). Hague et al. (1994) reported that increasing end-
point cooking temperature from 55°C to 77 °C decreased a* and b* values of ground beef
patties from 14.6 to 11.0 and 18.4 to 15.9, respectively, and increased L* value from 50.9
to 52.2. The variances of internal cooked color is attributed to the denaturation of
Page 26
15
myoglobin in ground beef patties as internal end-point temperatures rose from 55°C to
76 °C (Hunt et al., 1999).
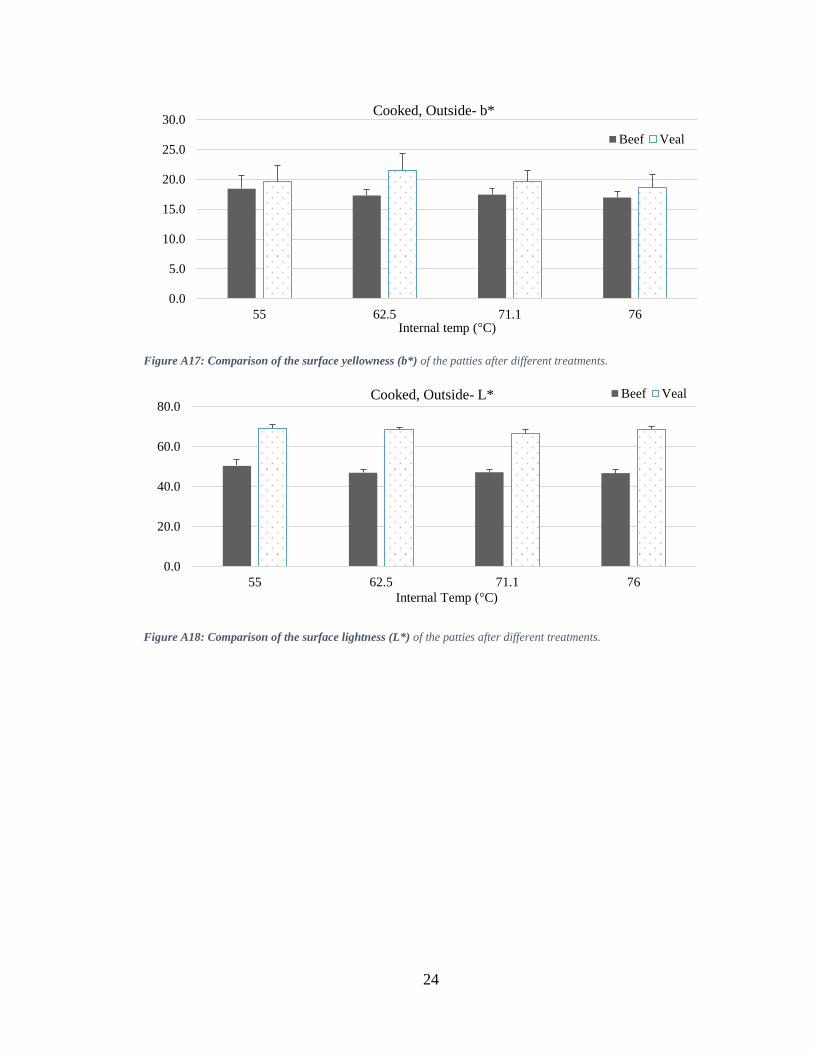
Limited studies reported the internal color variation in ground veal cooked to
different end-point temperatures. A study shown similar color variation tendency was
detected in veal samples as compared to those of beef. In cooked veal patties, cooking to
end-point temperature of 71.1°C and 76°C resulted in lower (P<0.05) a* of 11.21 to 12.2
and b* of 15.56 to 16.25 than those cooked to 55°C and 62.5°C with a* of 16.24 to 17.18
and b* of 18.48 to 18.84. However, there is no difference (P>0.05) of L* values, ranging
from 70.09 to 72.96, among veal samples cooked to 55°C to 76 °C.
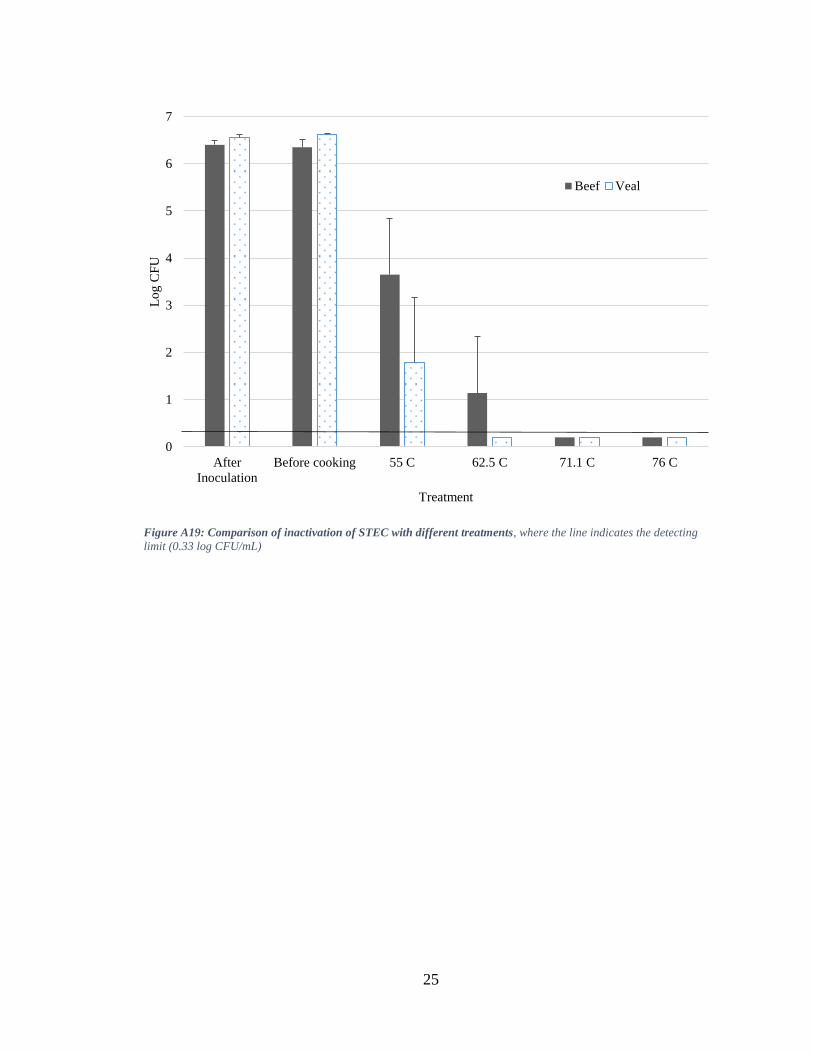
Cooking inactivation of bacterial populations
The initial inoculum level of E. coli O157:H7 in uncooked coarse ground beef and
veal samples were 6.4 and 6.6 log CFU/g, and no significant changes in E. coli O157:H7
populations were observed following 4-day PVC film aerobic storage at 4oC, which is
consistent with previous study of Yoon et al. (2011). The total bacterial population counts
on TSA were similar to those observed on Mcconkey agar indicating that the major
colonies found on TSA were inoculated E. coli O157:H7. As expected, double pan-
broiling beef and veal samples to 71.1°C (medium degree doneness) and 76°C (well-done
doneness) with 3 minute rest time decreased overall pathogen populations below
detection limit (>6 log CFU/g) (Figure A19). The recent study of Luchansky et al. (2013)
reported that cooking refrigerated ground beef patties to internal temperature of 71.1°C
and 76.6°C reduced 5.1-7.0 log CFU/g of E. coli O157:H7. This result also verified that
Page 27
16
cooking ground beef to an internal temperature of at least 71.1oC will not present great
risk to consumers (USDA-FSIS, 2001).
Conclusion
Since food safety is a major concern in the U.S., to reduce the possibility of food-
borne outbreaks due to E. coli O157:H7 contamination, the USDA-FSIS recommended
cooking non-intact beefs and veal products to internal temperature of 63 °C with at least a
3 minute rest time. To the best of our knowledge, no research publication detected the
impact of rest time on the thermal inactivation activity of E. coli O157:H7 on non-intact
beef, and very limited studies focus on veal products. Luchansky et al. (2014) most
recently found that cooking breaded or un-breaded veal cutlets for 1.5 minutes per side
on an electronic skillet set up 191.5 °C achieved internal temperature of 71.1
°C and >5.0
log reduction. In this study, cooking beef or veal samples to 55°C and 62.5°C with a 3
minute rest time reduced 4.0-5.5 and 5.7->6.6 log CFU/g, respectively. It is also
interesting to find that E. coli O157:H7 cells are more (P<0.05) sensitive to heat in veal
samples compared to beef, which might be explained by the relative lack of muscles in
veal allowing more efficient heat transfer, and the higher moisture that produces a
stronger steaming effect inside the veal patties. Our study demonstrated that cooking
coarse ground beef or veal to internal end-point temperature of 62.5 °C with a 3 minute
rest achieves >5.0 log reduction of E. coli O157:H7 cells.
In conclusion, higher internal temperature causes increasing inactivation of
ECOH and STEC, and veal and beef patties presents similar change in quality in terms of
quality change throughout storage and cooking, which supports the hypothesis. Results
Page 28
17
from this study covers various aspects of beef and veal quality changes during grounding,
storage and cooking process, which will be beneficial to intact and non-intact beef or veal
preparation at multiple points including retail, foodservices, and at home. It also verified
that cooking coarse ground beef or veal to internal end-point temperature of 62.5 °C with
a 3-minute rest will not generate great food safety risk. This information will be useful by
USDA-FSIS to develop risk assessments of E. coli O157 on non-intact and intact beef or
veal products.
Page 29
18
BIBLIOGRAPHY
1. Berry, B. W. 1998. Cooked Color In High pH Beef Patties As Related To Fat Content
And Cooking From The Frozen Or Thawed State. Journal of Food Science. 63 (5): 797-
800. doi:10.1111/j.1365-2621.1998.tb17903.x.
2. Cornforth D.P. and Jayasingh P. 2004. Colour and pigment. Encyclopedia of Meat
Sciences. Elsvier Ltd., Oxford, U.K.
3. Doyle M.P., Zhao T., Meng J., and Zhao S. 1997. Food microbiology-fundamental and
frontiers: Escherichia coli O157:H7. ASM Press, Washington, D. C., 171-191.
4. Hague, M.A., Warren, K.E., Hunt, M.C., Kropf, D.H., Kastner, C.L., Stroda, S.L., and
Johnson, D.E. 1994. Endpoint Temperature, Internal Cooked Color, And Expressible
Juice Color Relationships In Ground Beef Patties. Journal of Food Science. 59 (3): 465-
470. doi:10.1111/j.1365-2621.1994.tb05539.x.
5. Hunt, M.C., Sorheim, O. and Slinde, E. 1999. Color and Heat Denaturation Of
Myoglobin Forms in Ground Beef. Journal of Food Science. 64 (5): 847-851.
doi:10.1111/j.1365-2621.1999.tb15925.x.
6. Luchansky J.B., Porto-Fett A.C.S., Shoyer B.A., Phillips, J., Chen, V., Eblen, D.R., Cook,
L.V., Mohr, T.B., Esteban, E., and Bauer, N. 2013. Fate of Shiga toxin-producing
O157:H7 and non-O157:H7 Escherichia coli cells within refrigerated, frozen, or frozen
then thawed ground beef patties cooked on a commercial open-flame gas or a clamshell
electric grill. Journal of Food Protection. 76:1500-1512.
7. Luchansky J.B., Porto-Fett A.C.S., Shoyer B.A., Thippareddi, H., Amaya, J.R., and
Lemler, M. 2014. Thermal Inactivation of Escherichia coli O157:H7 and Non-O157
Shiga Toxin-Producing Escherichia coli Cells in Mechanically Tenderized Veal. Journal
of Food Protection. 77:1201-1206.
Page 30
19
8. Madhavi, D.L. and Carpenter, C.E. 1993. Aging And Processing Affect Color,
Metmyoglobin Reductase And Oxygen Consumption Of Beef Muscles. Journal of Food
Science. 58 (5): 939-942. doi:10.1111/j.1365-2621.1993.tb06083.x.
9. Shen, C., Geornaras I., Belk K.E., Smith, G.C., and Sofos, J.N. 2010. Inactivation Of
Escherichia coli O157:H7 In Moisture-Enhanced Nonintact Beef By Pan-Broiling Or
Roasting With Various Cooking Appliances Set At Different Temperatures. Journal of
Food Science. 76 (1): M64-M71. doi:10.1111/j.1750-3841.2010.01882.x.
10. Shen, C., Geornaras, I., Belk, K.E., Smith, G.C and Sofos, J.N. 2010. Inactivation of
Escherichia coli O157:H7 in Moisture-Enhanced Nonintact Beef by Pan-Broiling or
Roasting with Various Cooking Appliances Set at Different Temperatures. Journal of
Food Science, 76(1), pp.M64-M71.
11. Shen, C., Geornaras I., Belk K.E., Smith, G.C., and Sofos, J.N. 2011. Thermal
Inactivation of Acid, Cold, Heat, Starvation, and Desiccation Stress-Adapted Escherichia
coli O157:H7 in Moisture-Enhanced Nonintact Beef. Journal of Food Protection. 74 (1):
531-538. doi: 10.4315/0362-028X.JFP-10-430.
12. Shen, C. 2014. Cooking Inactivation of Shiga Toxin Producing Escherichia coli (STEC)
in Non-intact Beefs—a mini-Review. Journal of Food Processing & Beverages. 2(1): 5.
13. Trout, G.R. 1989. Variation In Myoglobin Denaturation And Color Of Cooked Beef,
Pork, And Turkey Meat As Influenced By Ph, Sodium Chloride, Sodium
Tripolyphosphate, And Cooking Temperature. Journal of Food Science. 54 (3): 536-540.
doi:10.1111/j.1365-2621.1989.tb04644.x.
14. USDA-FSIS (U.S. Department of Agriculture-Food Safety and Inspection Service). 2011.
Risk assessment of the public health impact of Escherichia coli O157:H7 in ground beef.
Page 31
20
15. USDA-FSIS (U.S. Department of Agriculture-Food Safety and Inspection Service). 2013.
Testing of raw ground beef component (RGBC) samples, including veal, for E. coli
O157:H7 and non-O157 Shiga toxin-producing E. coli (STEC): year-to-date totals source
and serotype.
16. Yoon, Y., Mukherjee, A., Geornaras, I., Belk, K.E., Scanga, J.A., Smith, G.C., and Sofos,
J.N. 2011. Inactivation Of Escherichia coli O157:H7 During Cooking Of Non-Intact Beef
Treated With Tenderization/Marination And Flavoring Ingredients. Food Control. 22
(12): 1859-1864. doi:10.1016/j.foodcont.2011.04.027.
Page 32
21
APPENDIX
Figure A1: Cooking curve for beef patties.
Figure A2: Cooking curve for veal patties
0
10
20
30
40
50
60
70
80
90
0 60 120 180 240 260 300 330 360 420 430 460 510 525 540 610 640
Inte
rnal
tem
p (
°C)
Time (sec)
Beef cooking curve
55C
62.5C
71.1C
76C
0
10
20
30
40
50
60
70
80
90
0 60 120 180 240 260 300 330 360 420 440 510 540 600
Inte
rnal
tem
p (
°C)
Time (sec)
Veal cooking cruve
55C
62.5C
71.1C
76C
Page 33
19
Table A3: Color variance during storage.
Beef Veal
Day 0 Day 1 Day 2 Day 3 Day 4 Day 0 Day 1 Day 2 Day 3 Day 4
L* 46.32±2.11 42.06±2.75 40.20±2.37 43.70±2.71 39.85±2.05 59.96±1.64 59.16±1.55 58.15±2.44 58.26±1.65 58.48±1.64
a* 34.90±2.27 22.92±2.61 19.71±2.26 15.40±1.61 15.27±1.02 26.90±0.94 22.41±1.38 16.97±1.49 14.39±1.04 12.77±0.60
b* 25.86±2.07 17.91±1.62 17.14±1.48 14.40±1.60 16.93±1.49 22.61±0.95 20.07±0.96 17.99±0.95 17.30±0.96 16.53±0.83
Table A4: Internal Color variance before and after cooking to various internal temperature.
After cooking to
55°C
62.5°C
71.1°C
76°C
L* a* b* L* a* b* L* a* b* L* a* b*
Beef 50.32±3.18 13.46±1.66 18.45±2.21 46.87±1.79 12.50±0.97 17.33±1.03 47.08±1.57 12.63±1.28 17.45±1.04 46.67±1.59 11.86±0.75 16.96±1.04
Veal 68.98±2.13 10.76±1.59 19.58±2.69 68.40±1.08 11.15±0.99 21.53±2.78 66.45±1.85 10.58±0.64 19.59±1.84 68.45±1.55 10.03±0.53 18.71±2.09
Page 34
20
Figure A5: Comparison of pH values for beef and veal patties under different treatments
Figure A6: Comparison of water activity for beef and veal patties under different treatments
Figure A7: Comparison of cooking loss for beef and veal patties under different treatments
5.00
5.20
5.40
5.60
5.80
6.00
6.20
6.40
55 62.5 71.1 76 raw
pH
Internal temp (°C)
Veal Beef
0.982
0.984
0.986
0.988
0.990
0.992
0.994
0.996
0.998
55 62.5 71.1 76 raw
Wat
er a
ctiv
ity
Internal temp (°C)
Veal Beef
0
10
20
30
40
55 62.5 71.1 76
Co
okin
g l
oss
(%
)
Internal temp (°C)
Veal Beef
Page 35
21
Figure A8: Comparison of change in Fat content.
Figure A9: Comparison of change in moisture.
Figure A10: Comparison of change of redness (a*) throughout storage with different treatments on beef and veal
petties.
0
2
4
6
8
10
12
Raw 55 62.5 71.1 76
per
centa
ge
(%)
Internal Temp (°C)
Fat Veal Beef
0
20
40
60
80
100
Raw 55 62.5 71.1 76
per
centa
ge
(%)
Internal Temp (°C)
Moisture Veal Beef
0.0
10.0
20.0
30.0
40.0
day-0 day-1 day-2 day-3 day-4
a* Beef-a* Veal-a*
Page 36
22
Figure A11: Comparison of change of yellowness (b*) throughout storage with different treatments on beef and veal
petties.
Figure A12: Comparison of change of lightness (L*) throughout storage with different treatments.
Figure A13: Comparison of the internal redness (a*) of the patties after different.
0.0
10.0
20.0
30.0
day-0 day-1 day-2 day-3 day-4
b*
Beef-b* Veal-b*
0.0
20.0
40.0
60.0
80.0
day-0 day-1 day-2 day-3 day-4
L* Beef-L* Veal-L*
0.0
10.0
20.0
30.0
40.0
55 62.5 71.1 76
Internal temp (°C)
Cooked, Inside- a*
Beef Veal
Page 37
23
Figure A14: Comparison of the internal yellowness (b*) of the patties after different treatments.
Figure A15: Comparison of the internal lightness (L*) of the patties after different treatments.
Figure A16: Comparison of the surface redness (a*) of the patties after different.
0.0
5.0
10.0
15.0
20.0
25.0
30.0
55 62.5 71.1 76Internal temp (°C)
Cooked, Inside- b*
Beef Veal
0.0
20.0
40.0
60.0
80.0
55 62.5 71.1 76Internal temp (°C)
Cooked, Inside- L*
Beef Veal
0.00
5.00
10.00
15.00
20.00
55 62.5 71.1 76Internal temp (°C)
Cooked, Outside- a*
Beef Veal
Page 38
24
Figure A17: Comparison of the surface yellowness (b*) of the patties after different treatments.
Figure A18: Comparison of the surface lightness (L*) of the patties after different treatments.
0.0
5.0
10.0
15.0
20.0
25.0
30.0
55 62.5 71.1 76Internal temp (°C)
Cooked, Outside- b*
Beef Veal
0.0
20.0
40.0
60.0
80.0
55 62.5 71.1 76
Internal Temp (°C)
Cooked, Outside- L* Beef Veal
Page 39
25
Figure A19: Comparison of inactivation of STEC with different treatments, where the line indicates the detecting
limit (0.33 log CFU/mL)
0
1
2
3
4
5
6
7
After
Inoculation
Before cooking 55 C 62.5 C 71.1 C 76 C
Lo
g C
FU
Treatment
Beef Veal