30
Quality Function Deployment Preeti Mishra Preeti Mishra Course Instructor Course Instructor
| Date post: | 13-Jul-2015 |
| Category: |
Software |
| Upload: | preeti-mishra |
| View: | 190 times |
| Download: | 0 times |

Quality Function Deployment
Preeti MishraPreeti MishraCourse InstructorCourse Instructor

Quality Function Deployment
Is a structured method that is intended to transmit and translate customer requirements, that is, the
Voice of the Customer through each stage of the product development and
production process, that is, through the product realization cycle.
These requirements are the collection of customer needs, including all satisfiers, exciters/delighters, and dissatisfiers.

Poor communications and expectations get lost in the complexity of product development.
Lack of structure or logic to the allocation of product development resources.
Lack of efficient and / or effective product / process development teamwork.
Extended development time caused by excessive redesign, problem solving, or fire fighting.
When is QFD Appropriate?

Return on Investment from Using QFD
Companies using QFD to reflect "The Voice of the Customer" in defining quality have a competitive advantage because there is/are:
1. Fewer and Earlier Design Changes
2. Fewer Start-up Problems
3. Shorter Development Time
4. Lower Start-up Costs
5. Warranty Cost Reductions
6. Knowledge Transfer to the Next Product
7. Customer Satisfaction

Brief History of QFDOrigin - Mitsubishi Kobe Shipyard 1972
Foundation - Belief That Products Should Be Designed To Reflect Customer Desires and Tastes
Foundation - Belief That Products Should Be Designed To Reflect Customer Desires and Tastes
Developed By Toyota and Its Suppliers Expanded To Other Japanese Manufacturers
Consumer Electronics, Home Appliances, Clothing, Integrated Circuits, Apartment Layout Planning
Adopted By Ford and GM in 1980s Digital Equipment, Hewlett-Packard, AT&T, ITT

The Houseof Quality
Quality Function Deployment’sHouse of Quality
CustomerPerceptions
Relationshipsbetween
Customer Needsand
Design Attributes
Imp
ort
ance
Ran
kin
gs
CustomerNeeds
DesignAttributes
Costs/Feasibility
Engineering Measures
CorrelationMatrix
12
3
4
5
6
7
8
Establishes the Flowdown Relates WHAT'S & HOW'S Ranks The Importance

Two Types of Elements in Each HouseTwo Types of Elements in Each House
Key Elements Informational Elements
Th
e H
ouse
of
Qu
alit
y

QF
D F
low
dow
n
Customer Wants
Technical Requirements
Part Characteristics
Manufacturing Process
Production Requirements
ManufacturingEnvironment
ManufacturingEnvironment
Customer Wants
Product Functionality
System Characteristics
Design Alternatives
SoftwareEnvironment
SoftwareEnvironment
Customer Wants
Service Requirements
Service Processes
Process Controls
ServiceEnvironment
ServiceEnvironment
Flowdown Relates The Houses To Each Other
Flowdown Relates The Houses To Each Other
Lev
els O
f Gra
nula
rity
Lev
els O
f Gra
nula
rity

Building the House of Quality1. Identify Customer Attributes
2. Identify Design Attributes / Requirements
3. Relate the customer attributes to the design attributes.
4. Conduct an Evaluation of Competing Products.
5. Evaluate Design Attributes and Develop Targets.
6. Determine which Design Attributes to Deploy in the Remainder of the Process.

1. Identify Customer Attributes These are product or service requirements IN THE CUSTOMER’S TERMS.
Market Research;
Surveys;
Focus Groups.
“What does the customer expect from the product?”
“Why does the customer buy the product?”
Salespeople and Technicians can be important sources of information – both in terms of these two questions and in terms of product failure and repair.
OFTEN THESE ARE EXPANDED INTO Secondary and Tertiary Needs / Requirements.
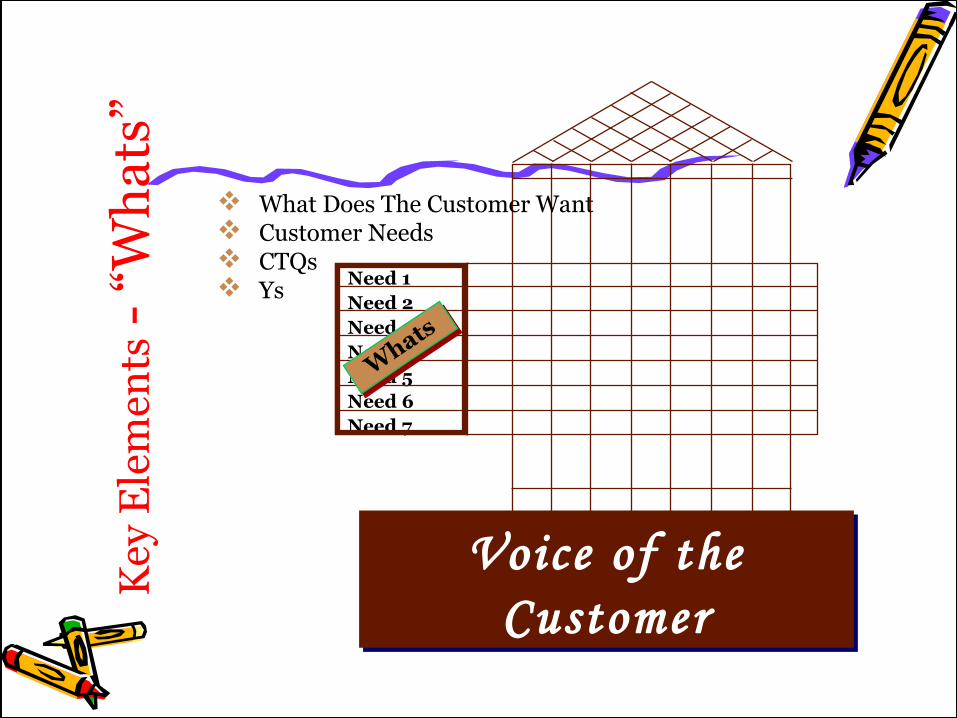
Need 1Need 2Need 3Need 4Need 5Need 6Need 7
Key
Ele
men
ts -
“W
hat
s”
Voice of the Customer
Voice of the Customer
Whats
Whats
What Does The Customer Want Customer Needs CTQs Ys

5534241
Key
Ele
men
ts:
C
ust
omer
Req
uir
emen
ts
Voice of the Customer
Voice of the Customer
How Important Are The What’s TO THE CUSTOMER
Customer Ranking of their Needs
Customer
Importance
Customer
Importance
Need 1Need 2Need 3Need 4Need 5Need 6Need 7

2. Identify Design Attributes. Design Attributes are Expressed in the Language of the
Designer / Engineer and Represent the TECHNICAL Characteristics (Attributes) that must be Deployed throughout the DESIGN, MANUFACTURING, and SERVICE PROCESSES.
These must be MEASURABLE since the Output will be Controlled and Compared to Objective Targets.
The ROOF of the HOUSE OF QUALITY shows, symbolically, the Interrelationships between Design Attributes.

HO
W 1
HO
W 2
HO
W 3
HO
W 4
HO
W 5
HO
W 6
HO
W 7
Ke
y E
lem
en
ts -
“H
ow
’s”
Satisfy the Customer NeedsSatisfy the Customer Needs
How Do You Satisfy the Customer What’s Product Requirements Translation For Action X’s
HowsHows
WHAT'S HOW'S
Need 1Need 2Need 3Need 4Need 5Need 6Need 7
5534241

Info
rma
tion
–
Co
r rel a
tion
Ma
t rix
Confl ict Resolution
Confl ict Resolution
Impact Of The How’s On Each Other
Strong PositivePositiveNegativeStrong Negative
Correlation Matrix
Correlation Matrix
Need 1Need 2Need 3Need 4Need 5Need 6Need 7
5534241
H
H
H
H
L
M
M
M
MM
M L
L L
L
L
HO
W 1
HO
W 2
HO
W 3
HO
W 4
HO
W 5
HO
W 6
HO
W 7
57 41 48 13 50 6 21
65
45
21
36
8
52
43
lbs
12
in.
3 m
ils
40
psi
3 8 a
tm
1 m
m

3.Relating Customer & Design Attributes
Symbolically we determine whether there is NO relationship, a WEAK one, MODERATE one, or STRONG relationship between each Customer Attribute and each Design Attribute.
The PURPOSE it to determine whether the final Design Attributes adequately cover Customer Attributes.
LACK of a strong relationship between A customer attribute and any design attribute shows that the attribute is not adequately addressed or that the final product will have difficulty in meeting the expressed customer need.
Similarly, if a design attribute DOES NOT affect any customer attribute, then it may be redundant or the designers may have missed some important customer attribute.

Key
Ele
men
ts:
Rel
atio
nsh
ip
Untangling The Web
Untangling The Web
Strength of the Interrelation Between the What’s and the How’s H Strong 9 M Medium 3 L Weak 1
Transfer Function Y = f(X)
H
H
H
H
L
M
M
M
MM
M L
L L
L
LRelationship
Relationship
Need 1Need 2Need 3Need 4Need 5Need 6Need 7
5534241
HO
W 1
HO
W 2
HO
W 3
HO
W 4
HO
W 5
HO
W 6
HO
W 7

4. Add Market Evaluation & Key Selling Points This step includes identifying importance ratings for each customer
attribute AND evaluating existing products / services for each of the attributes.
Customer importance ratings represent the areas of greatest interest and highest expectations AS EXPRESSED BY THE CUSTOMER.
Competitive evaluation helps to highlight the absolute strengths and weaknesses in competing products.
This step enables designers to seek opportunities for improvement and links QFD to a company’s strategic vision and allows priorities to be set in the design process.

5. Evaluate Design Attributes of Competitive Products & Set Targets.
This is USUALLY accomplished through in-house testing and then translated into MEASURABLE TERMS.
The evaluations are compared with the competitive evaluation of customer attributes to determine inconsistency between customer evaluations and technical evaluations.
For example, if a competing product is found to best satisfy a customer attribute, but the evaluation of the related design attribute indicates otherwise, then EITHER the measures used are faulty, OR else the product has an image difference that is affecting customer perceptions.
On the basis of customer importance ratings and existing product strengths and weaknesses, TARGETS and DIRECTIONS for each design attribute are set.

Info
rmat
ion
: How
Mu
ch
3 lb
s
12
in.
3 m
ils
40
psi
3 8 a
tm
1 m
m
Consistent ComparisonConsistent Comparison
Target Values for the How’s
Note the Units
How MuchHow Much
Need 1Need 2Need 3Need 4Need 5Need 6Need 7
5534241
H
H
H
H
L
M
M
M
MM
M L
L L
L
L
HO
W 1
HO
W 2
HO
W 3
HO
W 4
HO
W 5
HO
W 6
HO
W 7
57 41 48 13 50 6 21
65
45
21
36
8
52
4

Info
rmat
ion
:
Tar
get
Dir
ecti
on
The Best DirectionThe Best Direction
Information On The HOW'S More Is Better Less Is Better Specific Amount
HO
W 1
HO
W 2
HO
W 3
HO
W 4
HO
W 5
HO
W 6
HO
W 7
Target Directio
n
Target Directio
n
Need 1Need 2Need 3Need 4Need 5Need 6Need 7
5534241
H
H
H
H
L
M
M
M
MM
M L
L L
L
L
57 41 48 13 50 6 21
65
45
21
36
8
52
4

6. Select Design Attributes to be Deployed in the Remainder of the Process
This means identifying the design attributes that: have a strong relationship to customer needs, have poor competitive performance, or are strong selling points.
These attributes will need to be DEPLOYED or TRANSLATED into the language of each function in the design and production process so that proper actions and controls are taken to ensure that the voice of the customer is maintained.
Those attributes not identified as critical do not need such rigorous attention.

36
45
36
45
1
6
15
M
99
12 4
5 5
3
2
57 41 48 13 50 6 21Key
Ele
men
ts:
Tec
hn
ical
Im
por
tan
ce
Ranking The HOW'SRanking The HOW'S
Which How’s are Key Where Should The Focus Lie “CI” = “Customer Importance” “Strength” is measured on a 9, 3, 1, 0
Scale
Technical Importance
Technical Importance
TI = Σcolumn(CI *Strength)
CI
Need 1Need 2Need 3Need 4Need 5Need 6Need 7
534241
HO
W 1
HO
W 2
HO
W 3
HO
W 4
HO
W 5
HO
W 6
HO
W 7

H
H
H
H
L
M
M
M
MM
M L
L L
L
L
65
45
21
36
8
52
4
Key
Ele
men
ts :
Com
ple
ten
ess
Have We Captured the HOW'S
Have We Captured the HOW'S
Are All The How’s Captured
Is A What Really A How
Completeness Criteria
Completeness Criteria
CC = Σ row
(CI *Strength)
CI
Need 1Need 2Need 3Need 4Need 5Need 6Need 7
534241
HO
W 1
HO
W 2
HO
W 3
HO
W 4
HO
W 5
HO
W 6
HO
W 7
57 41 48 13 50 6 21

Using the House of QualityThe voice of the customer MUST be carried THROUGHOUT the production process.
Three other “houses of quality” are used to do this and, together with the first, these carry the customer’s voice from its initial expression, through design attributes, on to component attributes, to process operations, and eventually to a quality control and improvement plans.
In Japan, all four are used.
The tendency in the West is to use only the first one or two.

Cu
sto
me
rA
ttri
bu
tes
Design Attributes1
2
3
4
De
sig
nA
ttri
bu
tes
Component Attributes
Co
mp
on
en
tA
ttri
bu
tes
Process Operations
Pro
cess
Op
era
tio
ns
Quality Control Plan
The How’s at One Level Become the What’s at the Next Level
The How’s at One Level Become the What’s at the Next Level

The Four Houses of Quality
The Cascading Voice of the CustomerNOTES:
“Design Attributes” are also called “Functional Requirements”“Component Attributes” are also called “Part Characteristics”“Process Operations” are also called “Manufacturing Processes” and the “Quality Control Plan” refers to “Key Process Variables.W
HA
TS
HOWS
X
YCritical to Quality
Characteristics(CTQs)
Key ManufacturingProcesses
Key Process Variables

QFD On Everything
Set the “Right” Granularity
Don’t Apply To Every Last Project
Inadequate Priorities
Lack of Teamwork
Wrong Participants
Lack of Team Skills
Lack of Support or Commitment
Too Much “Chart Focus”
“Hurry up and Get Done”
Failure to Integrate and Implement QFD
Common QFD Pitfalls

The “Static” QFD
Review Current Status At Least Quarterly Monthly on 1 Yr Project Weekly on Small Projects
Review Current Status At Least Quarterly Monthly on 1 Yr Project Weekly on Small Projects
Need 1Need 2Need 3Need 4Need 5Need 6Need 7
5534241
H
H
H
H
L
M
M
M
MM
M L
L L
L
L
HO
W 1
HO
W 2
HO
W 3
HO
W 4
HO
W 5
HO
W 6
HO
W 7
57 41 48 13 50 6 21
65
45
21
36
8
52
4
3 lb
s
12 in
.
3 m
ils
40
psi
3 8 a
tm
1 m
m
654521368524

The process may look simple, but requires effort. Many entries look obvious—after they’re written down.
If there are NO “tough spots” the first time: It Probably Isn’t Being Done Right!!!!
Focus on the end-user customer. Charts are not the objective. Charts are the means for
achieving the objective.
Find reasons to succeed, not excuses for failure. Remember to follow-up afterward
Points to Remember


