+ All Categories
Home > Documents > Quality Gates A Tutorial v2 Word Quality Gate Paper by Aaron, Bra ©a and Smith 1993. Powerpoint...

Quality Gates A Tutorial v2 Word Quality Gate Paper by Aaron, Bra ©a and Smith 1993. Powerpoint...

Date post: 16-May-2018
Category:
Upload: doantuyen
View: 215 times
Download: 1 times
Share this document with a friend
27
Rev 2 Date: 07/28/11 Quality Gates: A PRIMMS® Tutorial John Aaron Milestone Planning and Research, Inc. A PRIMMS PROJECT MANAGEMENT TUTORIAL © Copyright 2009 Milestone Planning & Research, Inc. All Rights Reserved
Transcript

Rev 2 Date: 07/28/11

Quality Gates: A PRIMMS® Tutorial

John Aaron Milestone Planning and Research, Inc.

A PRIMMS PROJECT MANAGEMENT

TUTORIAL

© Copyright 2009 Milestone Planning & Research, Inc.

All Rights Reserved

Page 2 Quality Gates

Tutorials 13: Quality Gates

Objectives

Understanding what Quality Gates are and why they are important to project managers 

Iden fying sufficiency criteria for a Quality Gate 

Building a Quality Gate table 

Repor ng Quality Gate status  

Conduc ng a Quality Gate Review   

Data Files

Decision Problems.ppt 

Project Beta.mpp 


MS Word Quality Gate Paper by Aaron, Bra a and Smith 1993. 

Powerpoint Phase Gate Table Example and Template 

MS Project Sample Technology Project Schedule 

Powerpoint Slip Chart Example and Template 

Introduction

As a project manager, you must plan and control scope, schedule, cost and quality in an integrated fashion. Project 

managers frequently have difficulty in planning and controlling quality and its integra on with the scope and schedule. 

Yet, quality can be the most crucial element to managing a project because quality usually affects all other dimensions 

of project performance. If quality is not properly planned and executed, the necessary correc ve ac ons and 

preventa ve ac ons required for overall good project management cannot be performed.  

But managing quality is by no means the only reason to be concerned with Quality Gates. Today’s technology projects 

can be so complex that literally hundreds of thousands of objects need to be considered and worked as part of a 

project’s scope.  Yet, the processing capacity of the human brain is limited to dealing with 7±2 bits of informa on at a 

single point in  me. Consequently project managers can get caught between the highly detailed issues of technologists 

and the high level informa onal requirements of senior managers who just want the big picture. Quality Gates (or 

Milestone Q‐Gates™ as my company refers to them) provide the appropriate level of detail that allow the project 

manager, the project team and senior management to communicate at the right level without becoming overwhelmed.  

Page 3 Quality Gates

This tutorial helps project managers develop their skills in managing quality and its integra on with scope, schedule and 

cost by using a tool commonly referred to as Quality Gates. Over the years the concept of ”Gates” have taken a number of 

different names such stage gates, phase gates and toll gates to name a few. They do not necessarily refer to the same 

concepts as Quality Gates since these other terms originated to describe financial checkpoints to kill or not kill product 

development projects. The Quality Gate concept originated at AT&T Bell Research Labs to help control the so ware 

development of large digital telecommunica ons switches. I learned the concept from Dr. Paul Smith (an alumnus from 

Bell Labs) while we were both doing work at Tellabs in Lisle Illinois in 1992. 

Understanding Quality Gates Of the four project management constraints (scope,  me, cost and quality), the management of the quality constraint has 

remained  the most elusive  for prac oners  to plan and  control.  In many  cases, project quality becomes an  issue only 

during the la er phases of a project. In those cases quality tends to focus primarily upon the func onality or acceptability 

of products in tes ng, working models, or delivered end products. Thus, the quality constraint o en holds li le relevance 

un l the project manager or team has something tangible that approximates the final deliverable to be submi ed to the 

customer. 

Along these  lines quality  inspec ons and tes ng on projects tend to focus  in the  later phases of a project and primarily 

upon the final project deliverables or end products that are delivered to the ul mate customer or project sponsor. Check 

sheets  and  punch  lists  are  the  typical  inspec on‐oriented  tools  used  by  the  project  team  during  the  later  phases  to 

document  observed  defects,  nonconformi es  of  the  final  deliverable  to  contract  specifica ons  or  failures  to  meet 

customer requirements on specific dimensions.  

Final  inspec on  is  an  important  quality  tool,  but  the  reliance  on  a  “quality  by  final  inspec on  approach”  holds many 

pi alls when applied to projects.  Its major shortcomings are that  inspec on usually occurs too  late and seldom  includes 

the examina on of the earlier, interim deliverables. It is this lack of rigor in the earlier project phases that lead to larger 

issues downstream. As a result, we o en hear a project manager complain that he or she had been mee ng the original 

schedule and budget objec ves early on, but the project fell apart in tes ng and required substan al rework resul ng in 

project inefficiencies, schedule delays and cost overruns.  

Experience  indicates  that similar problems occur when project  teams  fail  to secure sufficient closure  to milestones and 

allow projects to prematurely move  forward  into subsequent phases of  their  life cycles. The resul ng  loss of  focus and 

efficiency can result  in chaos as project team members try to do everything at once (e.g. trying to design while tes ng). 

This situa on is shown diagramma cally as Tutorial decision problems.ppt.  

Defini on: A Quality Gate is a collec on of comple on criteria and sufficiency standards represen ng sa sfactory 

execu on of a phase of a project plan. Quality Gates enable a project manager to structure projects in a way that allows 

the integrated repor ng and control of schedule and scope progress against both quality criteria and comple on criteria 

through the en re life cycle. It is the use of Quality Gates that enables project managers to ground their projects in reality 

during the execu on phases of projects and provide clear, unambiguous warnings that the project is not as far along as 

stakeholders may think.   

Quality Gates act as “forcing func ons” that protect projects by ensuring that project team members finish first things first 

and don’t get too far ahead of themselves during the execu on phases. In addi on, without the use of Quality Gates 

project teams run the risk of performing work out of sequence and trying to complete all the work at once which causes 

project execu on efficiency to plummet pu ng the project in jeopardy.  Reference: Read the PMI Quality Gate PMI 

Whitepaper by Aaron, Bra a and Smith 1993.  

© Copyright 2009 Milestone Planning & Research, Inc.

All Rights Reserved

Page 4 Quality Gates

Identifying Sufficiency Criteria  

The essence of Quality Gates is to anchor milestones in sufficiency criteria. Shown below (Figure 1‐1) is a conceptual 

view of super‐milestones and sub‐milestones on a project across the  me dimension. It is assumed that the life cycle for 

this example project follows a Waterfall approach containing mul ple phases and various organiza onal func ons 

(tracks of work) that thread through the life cycle simultaneously. The triangles shown reflect milestones. The phase exit 

points are super‐milestones (large triangles) that slice ver cally through the diagram and func on as Quality Gates. 

These points represent criterion‐based, cross func onal events that are deemed complete only when the sub‐

milestones (smaller triangles) are completed by the various teams (func ons) performing the work.  

Upon  a ainment of sufficiency, each sub‐milestone contributes to the readiness for exi ng a phase. In this regard the 

sub‐milestones (i.e. the criteria) within the figure can be considered “phase exit criteria”. The phases are super‐

milestones (the Quality Gates) reflec ng the summa on of the individual criteria across the sub‐milestones. In prac ce, 

the whole is equal to the sum of its parts. Project managers cannot claim credit for a super‐milestone (i.e. a Phase exit 

Quality gate) un l sufficiency across all sub‐milestones has been reached. 


                Figure 1‐1 


Now we advance our discussion from the abstract to a specific example. Shown in Figure 1‐2 is an example of a Quality 

Gate table containing the names of the sub‐milestones and their sufficiency criteria needed for exi ng a project phase (a 

super‐milestone QR7) on a development project (Alpha Project) in the telecommunica ons industry.  

No ce that the discussion of status at this level of detail offers adequate granularity to conduct meaningful discussions 

with the most detail‐oriented technologists as well as with the more high level minded senior managers who wish to 

aggregate informa on and avoid too much detail. Having this common level of communica on between all stakeholders 

is vitally important for keeping projects on track.  


Page 5 Quality Gates


Figure 1‐2 


No ce in the naming of the sub‐milestones in this table the presence of both comple on criteria and quality 

criteria. For instance, the sub‐milestone “Prototype Hardware Available” references a comple on criterion. 

Sufficiency is reached for this milestone once the corresponding ac vi es on the project plan have been 

completed. On the other hand, the sub‐milestone “95% Pass rate on Hardware Tests” references a quality 

criterion. It is only reached once a sufficient quality level has been met. This requires the mee ng of a 

qualita ve standard by the project team and requires more than just checking off a box on a project 

schedule. 

A way to help interpret the sufficiency table for QR7 shown in Figure 1‐1 is to keep in mind that in order for 

the project manager to claim achievement of this en re Phase, the project team must sufficiently complete 

all of the associated sub‐milestones in the phase by reaching a level of readiness as specified by the criteria. 

Let’s go through the table in Figure 1‐2. It contains a total of 10 sub‐milestones that have been iden fied as 

being necessary for exi ng Phase QR7. Each criterion has an iden fied owner (shown by the ini als of a 

department head); and has an associated number of sufficiency criteria (standards) required for its 

comple on. Collec vely the sub‐milestones and their comple on standards indicate the minimal state of 

readiness necessary for the project manager to claim comple on of the cross‐func onal, super‐milestone 

QR7. The table also contains space to insert the planned and forecasted dates of sufficiency comple on for 

each sub‐milestone. 


© Copyright 2009 Milestone Planning & Research, Inc.

All Rights Reserved

Page 6 Quality Gates

Building a Quality Gate Table

Building upon the concepts discussed thus far we will construct a Quality Gate table containing the sufficiency 

criteria needed for successfully exi ng a project phase. In real life the project manager, in collabora on with the 

project team, constructs a separate Quality Gate table for each execu on phase of the project. Each table contains 

the criteria that must be met for successfully exi ng a phase of the project. Typically, the team constructs all of 

these tables (one for each phase) during the Planning phase of the project. Then, the team refines the criteria as 

the project progresses during the Execu on phases. As a phase in a project nears its target comple on date, the use 

of exit criteria becomes all the more important for objec ve evalua on during a phase exit review mee ng with all 

project stakeholders present. 

The steps necessary for building a Quality Gate table are summarized on the next page. In brief these steps are: 

Crea ng the table template—this will be a blank table that will be used to construct the Quality Gate tables for 

each phase exit milestone. 

Iden fying the phases of the project and preparing to populate the Quality Gate tables with sufficiency criteria 

for each phase exit milestone. 

Iden fying the cri cal benchmarks for each phase—this refers to capturing the key sub‐milestones in each 

track of work that must be accomplished for claiming comple on of the phase —a super‐milestone on the 

project. 

Refining the benchmarks (part 1) by iden fying the key deliverables and their required states of comple on 

that point in the project. 

Refining benchmarks (part 2): iden fying quality criteria other  qualita ve criteria that suggests the required 

state of readiness across the various tracks of work on the project. 

Coun ng the total benchmark criteria 

Iden fying planned dates for reaching sufficiency on each benchmark.  

Documen ng forecasted and actual dates of achieving sufficiency on each criterion in the table . 


Let’s go through these steps using sample projects on the following pages. 

Page 7 Quality Gates

Steps Project Manager Ac ons

Crea ng the Table Template  Using a tool such as Excel or Powerpoint, construct the table template that can be 

used to structure Quality Gate sufficiency criteria for each phase of the project. 

Each table (one for each phase) will be populated with the appropriate sufficiency 

criteria necessary for exi ng that phase. Each phase will have its own unique crite‐

ria. Each table will contain the specific sub‐milestones and their readiness criteria 

needed for phase exit. There will be seven total columns in each table as shown in 

Figure 1‐2.  

Iden fying the Phases of the Project and preparing to Populate Quality 

Gate tables phase by phase 

There will be a Quality Gate table constructed for each execu on phase in your 

project schedule. The default phase names for many projects follows the waterfall 

which includes Requirements, Design, Build, Test and Deploy phases (in that order). 

If the project WBS is phase oriented the project manager can iden fy any phase by 

rolling up the plan to the highest level of the WBS. See Figure 1‐5 

Iden fying the cri cal Benchmarks of each phase  Start with the earliest phase and progress to the latest phase of the project. Break 

out the WBS and the schedule for the first phase in ques on. Try to iden fy the key 

ac vity comple on events that cons tute the essence of that phase. List those 

events in the far le ‐hand column of the Quality Gate table.  These ac vi es be‐

come the benchmarks upon comple on. 

Refining the benchmarks (part 1): Iden fying the key deliverables and 

comple on criteria for key sub‐milestones. 

For the phase in ques on, iden fy tangible deliverables (e.g. documents, decisions, 

and walkthroughs) that result when the ac vi es iden fied in the plan are com‐

pleted and validated. The comple on of important, tangible deliverables marks 

progress unambiguously and o en makes excellent sufficiency criteria). 

Refining the benchmarks (part 2): Iden fying Quality Criteria   For the phase in ques on go back through the list of important deliverables for the 

phase and determine quality criteria (such as test pass rates) that signify appropri‐

ate states of targeted readiness for the project at that point in the project life cycle. 

Then populate the criteria column of the table with a ributes of sufficiency using 

such terms as percentages, yes’s and no’s.  

Coun ng the total benchmark criteria  For the phase in ques on count the total number of comple on criteria and quality 

criteria that are needed for each sub‐milestone. Enter this count into the column 

total. Then review the updated project schedule (i.e. updated with actual comple‐

on dates) and count the number of criteria that have already been met to date. 

Enter these counts into the “Total Criteria Met” column of the table. 

Iden fying planned dates for reaching sufficiency for each benchmark   Go through the project baseline schedule and iden fy the target comple on dates 

for each milestone listed in the Quality Gate table. Populate the Quality Gate table 

with these planned baseline dates. Note: the latest planned milestone date iden ‐

fied becomes the target phase exit date. 

Iden fying forecasted dates for reaching sufficiency for each bench‐

mark 

Perform a cri cal path analysis of the updated project plan. Iden fy new early 

finish dates that are calculated for each of the milestones in the Quality Gate table. 

Evaluate these new dates good judgment and enter forecast dates into the 

“Forecast” column. Take note of any forecasted schedule slippage. 

Repeat the above process for each phase of the project.  There should be one Quality Gate table completed for each phase of the project. 

FIGURE 1‐3: Building the Quality Gate Table]

© Copyright 2009 Milestone Planning & Research, Inc.

All Rights Reserved

Page 8 Quality Gates

Crea ng the Table Template 

Figure 1‐4 is a suitable format for a Quality Gate Quality Gate table. This table can be created using common 

tools such as Excel or Powerpoint. 

[FIGURE 1‐4: Construc ng the Table Template] 


Let’s review the columns of our template. No ce that the far le  column contains the  tle “Benchmark” 

instead of “Milestone”. We have changed the  tle merely to add clarity. That said, the defini ons of our 

columns are as follows: 

 Benchmark‐This column contains the Work Products and Ac vi es for the Phase (gate) to be considered 

complete. 

Responsible‐The organiza on responsible for leading and bringing the ac vity to closure 

Total ‐The total number of work products to be delivered for comple on of the task 

 Done ‐A measure of the work products completed at a given point in  me 

Criteria‐ The comple on criteria to close out the work product. This can be stated in numbers, 

percentages or Yes (all) 

Value‐ A measure of the work ac vity completed against the criteria at a given point in  me 

Baseline Schedule‐ Ini al scheduled date for comple ng the benchmark (Note: the latest scheduled 

benchmark date is the scheduled phase exit date). 

Forecasted Schedule‐ Current es mated comple on date for the work product 

Actual Schedule ‐ Actual comple on date for the work product. 


Page 9 Quality Gates

Iden fying the Phases of the Project and Preparing to Populate the Quality Gate Tables Phase by Phase

Figure 1‐5 


Figure 1‐5 shows the high level WBS of Project Beta, an applica on development project, using a combina on 

waterfall and itera ve development methodology. The view shown in the figure is a roll up of the complete 

schedule. Each line item reflects a phase of the project requiring a Quality Gate table. In prac ce we would build 

a Quality Gate table for the Requirements phase first, and then proceed to the Design and Prototype phase, etc. 

un l all phase tables were completed. 

Iden fying the Cri cal Benchmarks for Each Phase

Here we examine the Design phase of Beta project to illustrate how the project manager iden fies benchmarks 

for a Quality Gate table in a project phase. Refer to Figure 1‐6 below.

This figure breaks out the project schedule to a lower level for the Design and Prototyping Phase. We look for 

those cri cal ac vi es and deliverables that signify the “essence” of the phase. By this we mean those items that 

must be completed in order for the project to legi mately move into the next phase.  

We no ce that five design elements exist. These are: 

Establish Product Design 

Design Applica on Logic 

Design Database 

Design user Interface 

Select Infrastructure components 

© Copyright 2009 Milestone Planning & Research, Inc.

All Rights Reserved

Page 10 Quality Gates

We also observe that Unit Test Plans and Product Ini al Prototype are important. Collec vely the designs, 

unit test plans and prototype become the cri cal benchmarks that should be entered into our Quality Gate 

table for this phase.  


Figure 1‐6

Refining the Benchmarks (part 1): Iden fying the Key Deliverables and Comple on Criteria for Ac vi es

Having iden fied the three cri cal deliverables required for the Design phase exit, we populate these items 

as Benchmarks into our Quality Gate Table as shown in Figure 1‐7. No ce how the wording of the terms 

imply closure of these deliverables by including terms such as “signed off” and “complete”. As stated these 

Benchmarks cons tute the comple on criteria in the Total and Criteria columns of the table. 

Figure 1‐7

Page 11 Quality Gates

Refining the Benchmarks (part 2): Iden fying Quality Criteria

Next, we review our Benchmarks and add needed quality criteria. Refer to Figure 1‐8. During his analysis the project 

manager realizes that all major design issues should be closed before the Design phase should be considered 

complete. So, accordingly, the project manager adds the quality Benchmark Severity 1 and 2 Design Issues Closed to 

the table as shown below. In this case 36 of the total 47 design issues are closed (77%). However, all 47 design 

issues need to be closed for phase exit. 

Figure 1‐8 

Coun ng the total Benchmark Criteria

As a next step we sum up the criteria totals and develop an exit criteria status metric for each benchmark within the 

project phase by coun ng the total number of benchmarks required for phase comple on and comparing that 

number  with the actual number achieved to date. 

Iden fying Planned Dates of reaching Sufficiency for each Benchmark each phase

By examining Figure 1‐8 above closely we see that the latest planned finish date for our benchmarks in the table is 

4/24/09. This date then becomes the official Baseline phase target phase exit date on our project plan. Refer to 

Milestone #2 on the chart shown on the following page (Figure 1‐9). You will no ce that this date becomes the 

official target comple on date for the milestone. This date takes on significance because it is anchored in sufficiency 

criteria sugges ng that its comple on will indicate achievement for the project unambiguously.

Repea ng the process for each phase of the project.

This same series of steps must be performed for each phase exit milestone on the project . The phase exit dates are 

then summarized on the Milestone Chart  (slip chart) as shown in Figure 1‐9 shown on the following page. 

© Copyright 2009 Milestone Planning & Research, Inc.

All Rights Reserved

Page 12 Quality Gates

Reporting Quality Gate Status

Figure 1-9

This is a tool called a Milestone Chart or a “slip chart” that provides a visual status for comple on of criteria 

for Quality Gates (i.e. phase exit milestones) as well as a forecast  (i.e. a current plan). In our example project 

there are five milestones (M1 through M5) that must reach sufficiency. Milestone M1, Requirements Phase 

Complete, is scheduled to meet sufficiency on 01/28/09. As shown in the figure below based upon 

performance to date milestone M1 is forecasted to meet sufficiency on schedule, hence the ver cal line from 

plan to forecast. In addi on the remaining milestones are also forecasted to meet sufficiency on their 

planned target dates. From this status report management should conclude that as of  me now (01/25/09) 

this project is on schedule.  

In Tutorial 19 we will use the slip chart as a tool to control the project by giving early slippage warnings that 

the project is in jeopardy of mee ng milestone sufficiency on the planned dates.  


Page 13 Quality Gates

Once the project enters the execu on phases, the project manager a empts to focus the team on comple ng near term 

milestones. On a daily to weekly basis the project manager monitors performance by the team and enters performance 

informa on on the project scheduling tool (refer to figure 1‐10 below). As the project approaches an upcoming phase 

exit date, the project manager schedules a mee ng with all stakeholders to a end a Phase exit review mee ng where 

the Quality Gate table is discussed and populated and the Milestone Slip Chart is modified to provide official schedule 

status of the project.  

In order for this process to work there must be correspondence between the project schedule, the Quality Gate Table 

and the Slip Chart. 

Figure 1‐10

Conducting a Quality Gate Review

Project Schedule that 

is updated with actu‐

als daily and weekly. 

Quality Gate Table 

that is updated at 

Phase Exit Readiness 

Reviews 

Milestone Slip Chart that is posted publicly a er each Phase exit Readi‐

ness Review. 

The chart shows that the forecast is either an cipa ng on  me comple‐

on of future milestones or an cipated slippage. 

It is the process of collec ng this informa on from stakeholders that 

causes correc ve ac on and preventa ve ac ons to occur. 

© Copyright 2009 Milestone Planning & Research, Inc.

All Rights Reserved

Page 14 Quality Gates

Quality Gates Are Not Substitute for Leadership

When used improperly Quality Gates can instill fear in project managers leading to their hesitation to ever

label anything complete. This can be very non productive, and it is not the intent of the tool. If project managers feel that they might be criticized for calling work finished when it is not, they may needlessly

choose to keep criteria incomplete which can result in team members wasting their time.

Quality Gates should not be used as an excuse to stop projects or to make managers and team members

overly risk averse about calling items finished. Project managers are first and foremost leaders charged with

pushing the project forward. Quality Gates enable the manager to apply checks and balances which keep a project healthy. When performance starts falling behind plan, the use of Quality Gates immediately brings the

team toward identifying and focusing upon the issues preventing the attainment of sufficiency. And that is the art of project management on today’s technology projects.

As described in the chart shown below Quality Gates help project managers lead projects by ensuring that

all stakeholders remain focused upon what is most important-even when the project is highly complex.

Using Quality Gates in PRIMMS®

The PRIMMS Multi-Project Management System is an SaaS product that supports the use of Quality Gates. The following pages are extracted from the PRIMMS Users’ Guide and are relevant to the successful use of

Quality Gates on that tool.

Page 15 PRIMMS User’s Guide

To Previous Screen

Figure 7—Event Screen and Its Functions-Local Admin

During the planning phase of the project each milestone is given a set of sufficiency criteria required

for phase exit. This practice, described in the 1993 PMI paper presented by Aaron, Bratta and Smith,

enables each project manager to manage and update status for both milestone (event) schedule adher-

ence and quality attainment during the project execution phases. .

By clicking on the Risk Management menu button, the user can review the pool of risk statements

identified by project participants for the current week. The user can also review the entire list of pro-

ject risk statements to date and their mapping to higher level consolidated risk constructs which feed the PRIMMS Risk Register.

If the project team elects to use voting functionality any team member can click on the Voting button

for any milestone during project execution and enter risks. Project participants can enter risks and

vote on the likelihood of achieving sufficiency on the target end date. Risks can be entered at any time.

Voting occurs once per week per participant

Following the Risk Management menu button also takes the user to the PRIMMS Risk Register. Project

managers, with Local Admin privileges, can update the register with status and can log narratives de-

scribing risk management activities. Other users can read the risk register. The PRIMMS Risk Register

contains buttons that give the user access to the Bubble chart and Escalation chart that provide sum-

marized, graphical views of risks and their disposition.

Page 16 PRIMMS User’s Guide

With PRIMMS each milestone event is anchored in sufficiency (exit) criteria that maps to a Quality Gate

table. The Quality Gate Table identifies the completion and quality criteria required for reaching sufficien-

cy for that milestone event. This allows the project manager and team to plan and status the milestone

for both schedule and quality accomplishment simultaneously throughout the execution phases of the

project. An important job of the project manager is to ensure that Quality Gate criteria and expecta-

tions for completion are well communicated to the team and to all project stakeholders.

The relationships of screens and reports used for entering sufficiency criteria and Quality Gate planning/

statusing are shown in Figures 8A and 8B respectively on the following page. The reader can consult the

Quality Gate tutorial in PRIMMS for the theory and practice of using Quality Gates.

After planning is completed and execution is underway, the project manager updates the Quality Gate

table for status weekly (or more often if desired). This enables any project participant to review the table

to examine the project manager’s view of current status and of the forecast. Based upon all available in-

formation, each project participant can enter risks into the weekly pool and vote on the percentage of

sufficiency criteria believed to be actually completed by the milestone target end date.

The voting process (if used) can be performed by all participants and applied to all incomplete (non-

closed) milestones. The parimutuel voting process generates odds for the participants’ perceived proba-

bility of meeting sufficiency criteria for that milestone. The results of voting provides a calculated estimate

of expected project slippage as well as a time series index of milestone risk. The visualized results of the-

se calculations are displayed as forecasted slippage (Figure 8D) as well as time series inflections (Figure

8E).

Creating Quality Gates

Page 17 PRIMMS User’s Guide

Figure 8A Exit Criteria for

Requirements Complete Milestone

Figure 8B Quality Gate Table for

Requirements Complete Milestone

Figure 8D Milestone Slip Chart

(Milestone 1 refers to Status of Re-

quirements Complete Milestone)

Figure 8E Milestone Risk Index for

Requirements Phase Complete

Figure 8C Pool of Risks for the Week

PRIMMS Voting

Calculations Voting?

Page 18 PRIMMS User’s Guide

After populating a Quality Gate table with baseline plan information, it is possible that the estimat-

ed finish dates for the exit criteria will differ from the high level Milestone End Dates. To reconcile

the potential inconsistency, the project manager can either change the finish dates for the individual

criteria in the Quality Gate tables or change the overall, high level milestone dates. Whichever ap-

proach you choose will depend upon whether you choose a top down or bottom yp planning ap-

proach.

Changes in overall

Figure 9-Event Modify Screen

Once the Quality Gate tables are populated for all project milestones ,and the milestone high level

exit dates are made consistent with the planned exit dates, the project is ready to move into the

execution phases.

It is important to note that the project manager may also be using scheduling tools such as MS pro-

ject for planning. At this point your baseline schedule should be created, and all of your plans should

be in sync.

Page 19 PRIMMS User’s Guide

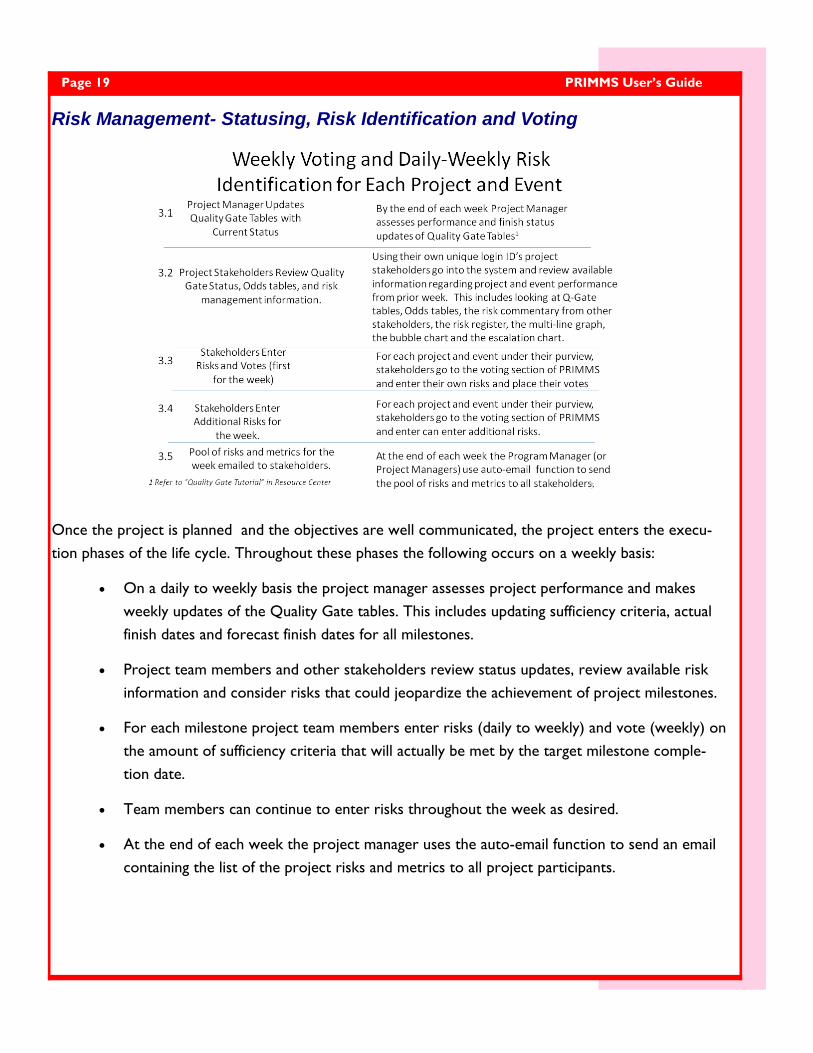
Risk Management- Statusing, Risk Identification and Voting

Once the project is planned and the objectives are well communicated, the project enters the execu-

tion phases of the life cycle. Throughout these phases the following occurs on a weekly basis:

On a daily to weekly basis the project manager assesses project performance and makes

weekly updates of the Quality Gate tables. This includes updating sufficiency criteria, actual

finish dates and forecast finish dates for all milestones.

Project team members and other stakeholders review status updates, review available risk

information and consider risks that could jeopardize the achievement of project milestones.

For each milestone project team members enter risks (daily to weekly) and vote (weekly) on

the amount of sufficiency criteria that will actually be met by the target milestone comple-

tion date.

Team members can continue to enter risks throughout the week as desired.

At the end of each week the project manager uses the auto-email function to send an email

containing the list of the project risks and metrics to all project participants.

Page 20 PRIMMS User’s Guide

Depending upon the project situation on a daily to weekly basis the project manager collaborates with

the responsible owners of the sufficiency criteria for each milestone in order to understand achieve-

ment for the day or week, to understand obstacles and risks and to focus the team on the work at

hand. The PRIMMS Quality Gate table exemplified in Figure 10 below facilitates this process. As illus-

trated in Figure 10 below status information is updated for both Criteria as well as actual and forecast

Figure 10-Example of Updating Quality Gate Table for a Milestone Event

Weekly voting by participants is an important element of the PRIMMS risk management methodology.

This step allows risk observations to be recorded into the system, and it provides participants the op-

portunity to express their perceptions as to overall project health in terms of likelihood of meeting tar-

get schedule objectives through voting. Both are essential elements to an effective project risk manage-

ment process.

The weekly risk identification and voting step begins when a participant logs into the PRIMMS tool and

goes to the appropriate project event screen. Refer to Figure 7. On this screen the participant clicks on an appropriate “Vote” button for a milestone event which leads to the Voting screen containing multiple

views. The “Vote Now” view allows the participant to enter risks (see Figure 11 A) and to Vote (see

Figure 11B on the following page).

In order to vote the participant enters one or more risk statements by answering the first risk question

as shown in Figure 11A and hitting “Add” for each risk identified. The participant must also answers the

second risk question (the senior management question). Then the participant scrolls down and votes by

distributing the available 100 points to each of the six possible outcomes based on his/her perception of

project progress to date. Then the participant hits the “submit” button at the bottom of the screen.

Note: a participant can submit risks anytime during the week after voting by entering and adding risks

and then hitting the submit button.

Page 21 PRIMMS User’s Guide

Figure 11A-Entering

Risk Information

(Daily to Weekly)

Figure 11B-Voting on

Milestone Outcomes

(Weekly)

Page 22 PRIMMS User’s Guide

Figures 11A and 11B illustrate the mechanics of risk identification and voting. But before voting project

participants can view the complete pool of risks for the week identified by other participants. This is

most easily accomplished by going to the events screen and clicking on the risk management button. This

takes the participant to the Risk Categorization screen allowing access to the “Risk Descriptions for the

Week” button. By clicking on that button, the participant views the risk descriptions for the entire pool

of risks for the week. An example of this view is shown in Figure 12 below.

Figure 12-Example of Risk Description Pool for the Week

Before voting the participant can also examine other sources of risk information within the PRIMMS

tool including:

The risk register

The Milestone slip chart

The odds tabulations

The risk index line chart (a time series graph)

Directions to access these screens and reports are covered in the next section of this User’s Guide.

Page 23 PRIMMS User’s Guide

Risk Elimination, Mitigation and Preventative/Corrective Actions

Each project manager has the responsibility to maintain adherence to the scope, schedule cost and quality

objectives for the project. During the execution phases schedule and quality issue rise to the surface on a

daily basis. So, one of the most important tasks is to identify and deal with schedule-quality risks and

problems.

As we have described previously the Quality Gate structure sets the orientation of the team toward a

milestone due date. Also, because each milestone is anchored in sufficiency criteria, the team is working

toward achieving both schedule and quality objectives simultaneously. Note: the assumption here is that, from a day-to-day perspective, cost and scope objectives are considered fixed and under change control.

Remember, we are discussing the Execution phases of the project.

It is expected that each project manager will be working with team members on a daily basis for purposes

of communication, coordination and issue resolution. Consequently, each project manager will be review-

ing and updating the Quality Gate tables with the team at least several times a week. However, it is easy

for a project manager to become insulated and blindsided by unforeseen, hidden issues and problems. For

that reason the risk management tools of PRIMMS are very important to enable each project manager to

keep abreast of and stay ahead of such problems.

Page 24 PRIMMS User’s Guide

PRIMMS is a tool that facilitates the risk management process. Effective risk management also requires

leadership skill as demonstrated by a willingness on the part of each project manager to confront tough

issues as they emerge. It also requires the development of management savvy as demonstrated by an abil-

ity to direct a team through adversity.

Systematic risk identification is a recurring the first step when using the PRIMMS tool. Risks are defined as

any anticipated mismatch between a project plan and actual execution which jeopardizes attainment of a

milestone objective. Therefore, risks can be either anticipated future problems that could materialize or actual problems at hand that have materialized and jeopardize meeting project objectives. Risks are “wake

-up calls” to the project manager.

Risks are identified through the daily to weekly recording of risk observations by project participants as

discussed previously. Each risk statement recorded by a participant is pulled into the PRIMMS Risk Cate-

gorization table. Refer to Figure 13A on the following page. Using this table the project manager consoli-

dates and maps each risk statement into a risk domain. This is a data reduction step that enables the pro-

ject manager to map and consolidate any duplicate statements reflecting the views of multiple individuals

into a smaller group of relevant, mutually exclusive risks. It also allows the project manager to view each

risk domain as a multifaceted, multidimensional construct that is best described by multiple viewpoints.

The PRIMMS database pulls risk domains into the Risk Register enabling the project manager to prioritize

and assign risk management responsibilities to team members and other stakeholders. Refer to Figure

13B.The project manager also uses the Risk Register to update status of each domain through the risk disposition dropdown. The project manager can also use the log functionality to keep a time stamped

narrative of risk management activities and actions.

Columns in the Risk Register include:

Risk Category— A description of each identified risk domain or an actual problem at hand

Risk Severity— A dropdown scale of 1 to 4 identifying the severity of each risk domain should

it materialize

Risk Likelihood— A dropdown scale of 1 to 4 identifying the probability of each risk domain

Risk Impact Cost—The expected economic loss should the risk materialize. Optional column

Owner—Two columns, the organizational level and name of the person responsible for the

elimination or mitigation of the risk.

Running Talley— The number of mentions (risk statements) made that relate to the risk do-

main

Page 25 PRIMMS User’s Guide

Figure 13A-Example of Risk Categorization Table

Figure 13B-Example of Risk Register Screen

Figure 13C-Example of Bubble Chart

Showing Risk Severity By Risk Likeli-

hood

Page 26 PRIMMS User’s Guide

Date Opened— The date that the risk domain was created

Current Risk Disposition— A dropdown of risk statuses

Risk Mitigation Cost— The expected cost to eliminate or mitigate the risk. An optional col-

umn

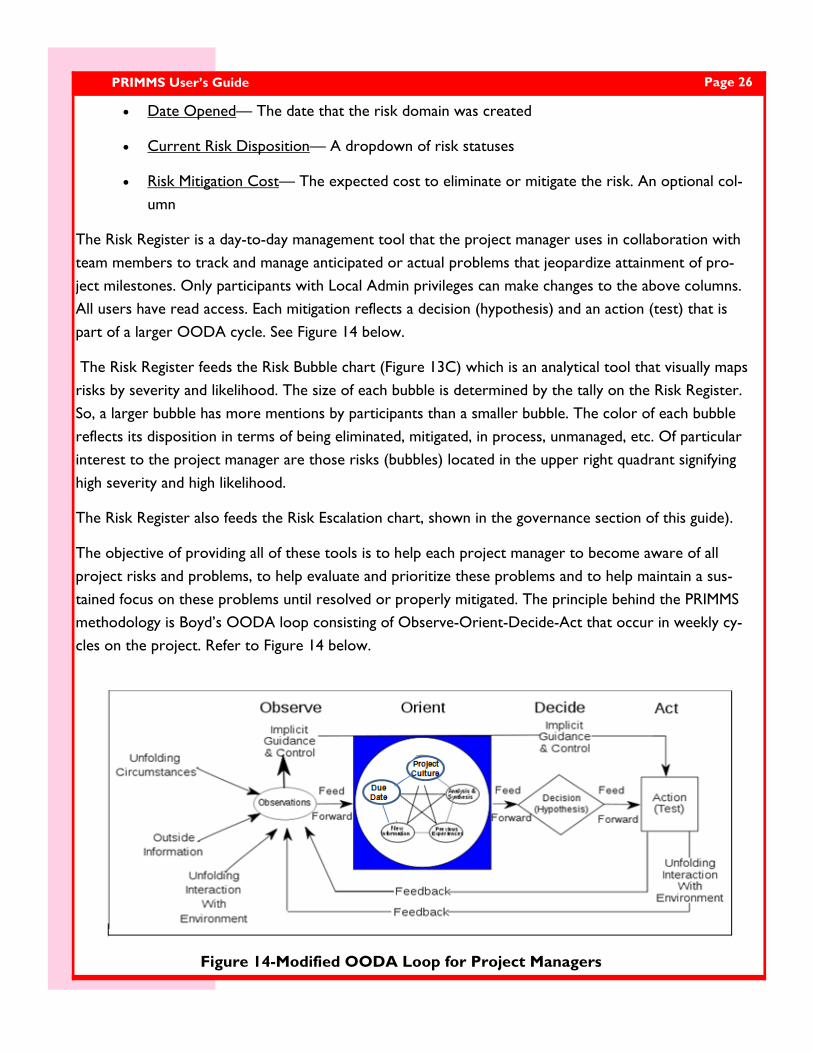
The Risk Register is a day-to-day management tool that the project manager uses in collaboration with

team members to track and manage anticipated or actual problems that jeopardize attainment of pro-

ject milestones. Only participants with Local Admin privileges can make changes to the above columns. All users have read access. Each mitigation reflects a decision (hypothesis) and an action (test) that is

part of a larger OODA cycle. See Figure 14 below.

The Risk Register feeds the Risk Bubble chart (Figure 13C) which is an analytical tool that visually maps

risks by severity and likelihood. The size of each bubble is determined by the tally on the Risk Register.

So, a larger bubble has more mentions by participants than a smaller bubble. The color of each bubble

reflects its disposition in terms of being eliminated, mitigated, in process, unmanaged, etc. Of particular

interest to the project manager are those risks (bubbles) located in the upper right quadrant signifying

high severity and high likelihood.

The Risk Register also feeds the Risk Escalation chart, shown in the governance section of this guide).

The objective of providing all of these tools is to help each project manager to become aware of all

project risks and problems, to help evaluate and prioritize these problems and to help maintain a sus-

tained focus on these problems until resolved or properly mitigated. The principle behind the PRIMMS methodology is Boyd’s OODA loop consisting of Observe-Orient-Decide-Act that occur in weekly cy-

cles on the project. Refer to Figure 14 below.

Figure 14-Modified OODA Loop for Project Managers

Page 27 PRIMMS User’s Guide

Program and Project Governance

Governance refers to the existence of an oversight body that works on behalf of the program/project

owner that :

Ensures good project management practices are in place

Acts as a resource for problem escalation

Authorizes appropriate changes

Typically the governance body is a committee of senior stakeholders to whom the program and project

managers are ultimately responsible and accountable. During the execution phases of a project the gov-ernance body is especially interested in knowing that sufficient project management controls are in place.

Pages 24-27 are reprints from Module 4 of the project management workshop located in the Resource

center of PRIMMS. Module 4 discusses project controls by using a simulation example.

The PRIMMS tool helps the project manager establish and maintain the project management exception

process. PRIMMS enables the project manager to stay ahead of critical exceptions to plan (issues, risks,

problems) that can jeopardize the successful attainment of milestone objectives.


Recommended