Page 1
The Pennsylvania State University
The Graduate School
College of Engineering
QUALITY IMPROVEMENT TO ASSESS AND AUDIT COMPLEXITY IN
TRANSLATIONAL RESEARCH
A Dissertation in
Industrial Engineering and Operations Research
by
David A. Munoz Soto
2015 David A. Munoz Soto
Submitted in Partial Fulfillment
of the Requirements
for the Degree of
Doctor of Philosophy
August 2015
Page 2
ii
This dissertation of David A. Munoz Soto was reviewed and approved* by the following:
Harriet Black Nembhard
Professor and Interim Department Head of Industrial and Manufacturing Engineering
Dissertation Adviser
Chair of Committee
Paul Griffin
Virginia C. and Joseph C. Mello Chair and Professor of Industrial and Systems Engineering
H. Milton Stewart School of Industrial & Systems Engineering
Georgia Institute of Technology
Deirdre McCaughey
Associate Professor of Health Policy and Administration
Ling Rothrock
Associate Professor of Industrial and Manufacturing Engineering
Conrad S. Tucker
Assistant Professor of Industrial and Manufacturing Engineering
Assistant Professor of Engineering Design
* Signatures are on file in the Graduate School.
Page 3
iii
ABSTRACT
The large gap between proven clinical knowledge and its implementation in clinical practice is a pressing
challenge faced by the health community. It has been estimated that adults in the U.S. receive only about
half of their recommended care. This is in part, due to the complexities and current inability of translating
knowledge to effectively impact health outcomes. Moreover, the lack of understanding of the complexities
involved in translational research have resulted in a poor allocation of resources. As an effort to accelerate
the rate at which new discoveries become clinical practice, the National Institutes of Health (NIH) explicitly
made translational research a central priority and has invested heavily in developing an infrastructure
through the Clinical and Translational Science Awards (CTSAs). The arc of this dissertation is in alignment
with this priority.
Translational research experts have argued that the existing models in translational research have not been
able to fully capture the complexities, dynamisms, and fragmentations of this long process. In response,
data-driven tools and robust frameworks are expected to help analyzing, and hence, accelerating this
knowledge translation. These frameworks are needed for assuring an efficient and effective decision-
making process that support the tactical and strategic allocation of healthcare resources.
Although Quality Improvement (QI) approaches have been found to be promising to solve a wide variety
of problems in healthcare, their implementation in translational research has not been fully explored.
Moreover, in healthcare fields, QI has been mostly associated with Lean and Six Sigma techniques.
However, in order for QI techniques to address translational research challenges, a wider QI scope is
needed. In response to these challenges, a comprehensive QI research approach is used in this dissertation
to provide frameworks that inform healthcare decision makers, and hence, have a positive impact on
translational research. The frameworks presented are applied to different case studies that use them to
generate evidence for professional applications.
The main body of this dissertation is divided into three parts. The first part proposes a combined Quality
Function Deployment (QFD) and Analytic Hierarchy Process (AHP) framework for assessing the
complexity of translational research. Specifically, this framework is used to identify and quantify the
importance of the different operational steps and corresponding technical requirements along the
translational research process. This framework was applied to a case study of a primary care-based weight
Page 4
iv
control intervention. The second part proposes a Social Network Analysis (SNA) approach for evaluating
collaboration and multidisciplinarity networks. The evaluation includes the identification of collaboration
patterns, leaders, influencers, bridgers of knowledge, and research clusters. A case study that analyzes
collaboration on obesity research at the intra-institutional level is presented to illustrate the potential
benefits and applicability of this framework. Finally, a goal programming (GP) model and a cost-
effectiveness analysis (CEA) approach is proposed to guide the proposal selection problem and estimate
the potential impact of healthcare interventions respectively. Specifically, a GP model was developed for
the proposal selection of a CTSA’s hub from a strategic perspective. Additionally, a model for rapid
estimation of impact is applied to an early detection of intervention of Parkinson’s disease. Lastly, a
combination of these two techniques is modeled to incorporate cost-effectiveness measures into the
proposal selection problem.
These studies cover relevant topics that aim to support the understanding of translational research and offer
pathways for a more efficient translation of new discoveries into clinical practice through QI research
approaches.
Page 5
v
Table of Contents
List of Tables .............................................................................................................................................. ix
List of Figures .............................................................................................................................................. xi
List of Symbols and Abbreviations ............................................................................................................. xii
Important Terms and Definitions ............................................................................................................... xiv
Acknowledgements ................................................................................................................................... xvi
Chapter 1 ................................................................................................................................................... 1
INTRODUCTION
1.1 Statement of the Problem .......................................................................................................... 2
1.2 Gaps that Need to be Filled and Problems that Need to be Solved ........................................... 3
1.3 Motivation and Challenges ........................................................................................................ 3
1.4 Research Objective and Main Contributions ............................................................................. 4
1.4.1 Research objectives ............................................................................................................. 4
1.4.2 What will be added to the field of knowledge .................................................................... 4
1.5 Methodology Overview, Tools, and Questions to be Addressed .............................................. 5
1.5.1 Overall approach ................................................................................................................. 5
1.5.2 Tools description ................................................................................................................. 7
1.6 Summary of Main Gaps, Motivation, and Contributions ........................................................ 10
Chapter 2 ................................................................................................................................................. 14
LITERATURE REVIEW
2.1 Overview of Systems Engineering Tools in Healthcare .......................................................... 15
2.1.1 Tools for system design .................................................................................................... 15
2.1.2 Tools for system analysis .................................................................................................. 16
2.1.3 Tools for system monitoring and control .......................................................................... 16
2.2 Tools to Capture Customer Needs and Technical Requirements ............................................ 17
2.2.1 Quality function deployment ............................................................................................ 17
2.2.2 House of quality ................................................................................................................ 17
2.2.3 Analytic hierarchy process ................................................................................................ 19
2.2.3.1 AHP procedure for obtaining weights .............................................................................. 19
2.2.3.2 AHP in healthcare applications ........................................................................................ 22
2.2.3.3 AHP and translational research ....................................................................................... 22
2.2.4 Integration of QFD and AHP ............................................................................................ 23
2.3 Social Network Analysis ......................................................................................................... 24
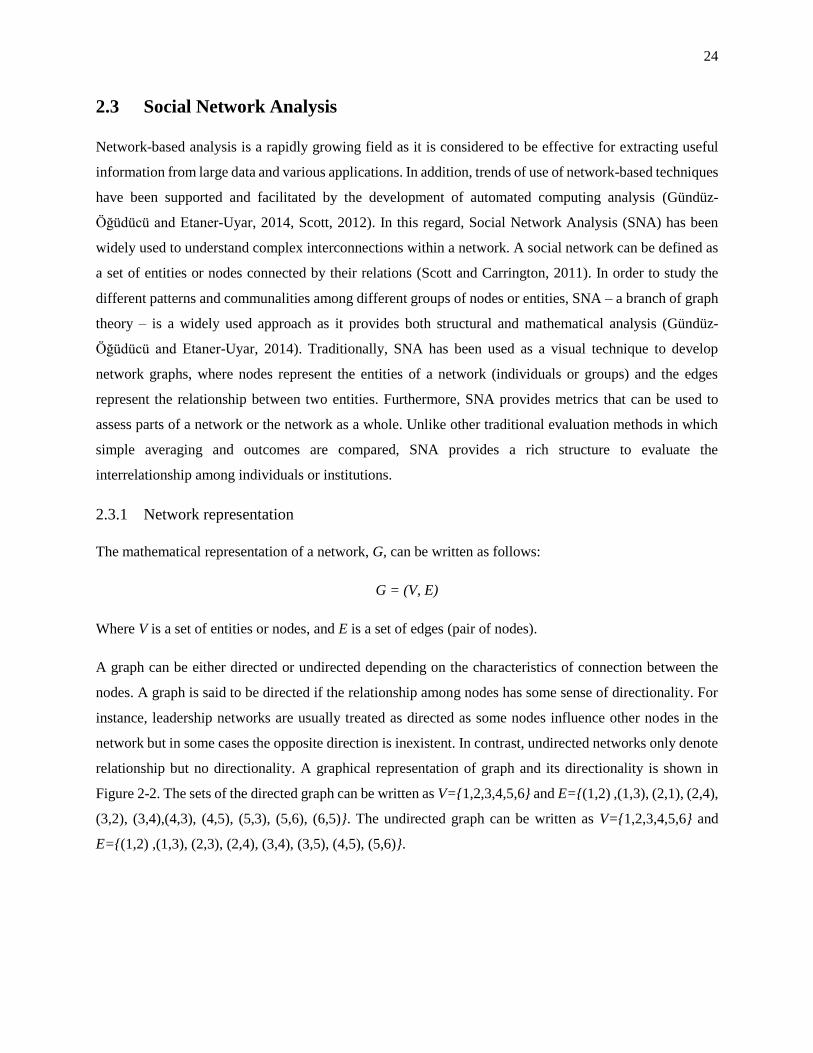
2.3.1 Network representation ..................................................................................................... 24
2.3.2 SNA metrics ...................................................................................................................... 25
2.3.3 Applications of SNA ......................................................................................................... 27
Page 6
vi
2.3.4 SNA in healthcare ............................................................................................................. 28
2.3.5 SNA to assess collaboration networks .............................................................................. 28
2.4 Multiple-Criteria Optimization ................................................................................................ 29
2.4.1 Goal programming ............................................................................................................ 30
2.4.1.1 Weighted goal programming ............................................................................................ 30
2.4.1.2 Preemptive goal programming ......................................................................................... 31
2.4.1.3 Tchebycheff goal programming ........................................................................................ 32
2.4.1.4 Obtaining weights ............................................................................................................. 32
2.4.1.5 Scaling and normalizing goal constraints parameters ..................................................... 33
2.4.2 Goal programming in healthcare ...................................................................................... 33
2.5 Proposal selection methods ..................................................................................................... 34
2.6 Cost-Effectiveness Analysis .................................................................................................... 36
2.6.1 Impact of healthcare interventions and the use of QALY ................................................ 38
2.6.2 Estimating QALY ............................................................................................................. 40
2.6.3 Instruments to estimate QALY ......................................................................................... 42
2.6.3.1 EQ-5D ............................................................................................................................... 42
2.6.3.2 SF-36 ................................................................................................................................. 46
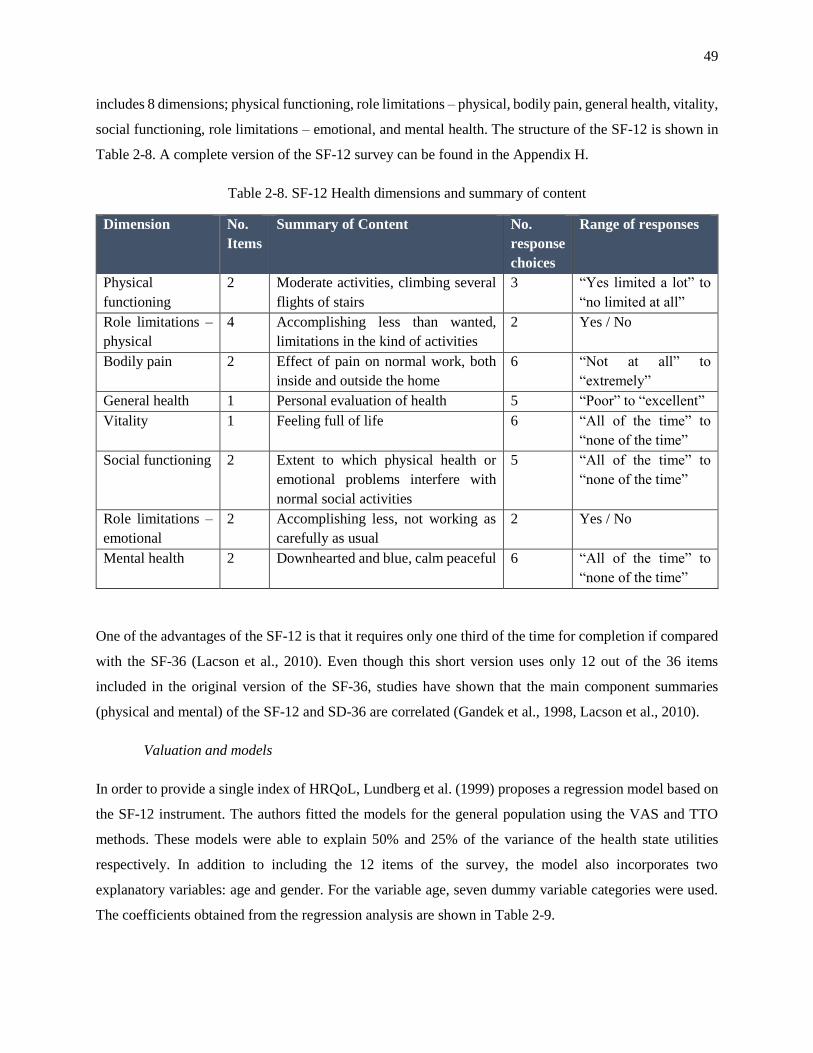
2.6.3.3 SF-12 ................................................................................................................................. 48
2.6.3.4 SF-6D ................................................................................................................................ 51
2.6.3.5 QWB-SA ............................................................................................................................ 53
2.6.3.6 Comparison between instruments ..................................................................................... 54
2.6.3.7 Discussion and limitations ................................................................................................ 54
Chapter 3 ................................................................................................................................................. 56
QUANTIFYING COMPLEXITY IN TRANSLATIONAL RESEARCH: AN INTEGRATED
QUALITY FUNCTION DEPLOYMENT – ANALYTIC HIERARCHY PROCESS APPROACH
3.1 Introduction ............................................................................................................................. 56
3.2 Methodology ........................................................................................................................... 59
3.2.1 Identification of markers and technical requirements ....................................................... 60
3.2.2 Determining marker weights for each translational research phase .................................. 61
3.2.2.1 Pairwise comparison matrix ............................................................................................. 61
3.2.3 Building the house of quality ............................................................................................ 62
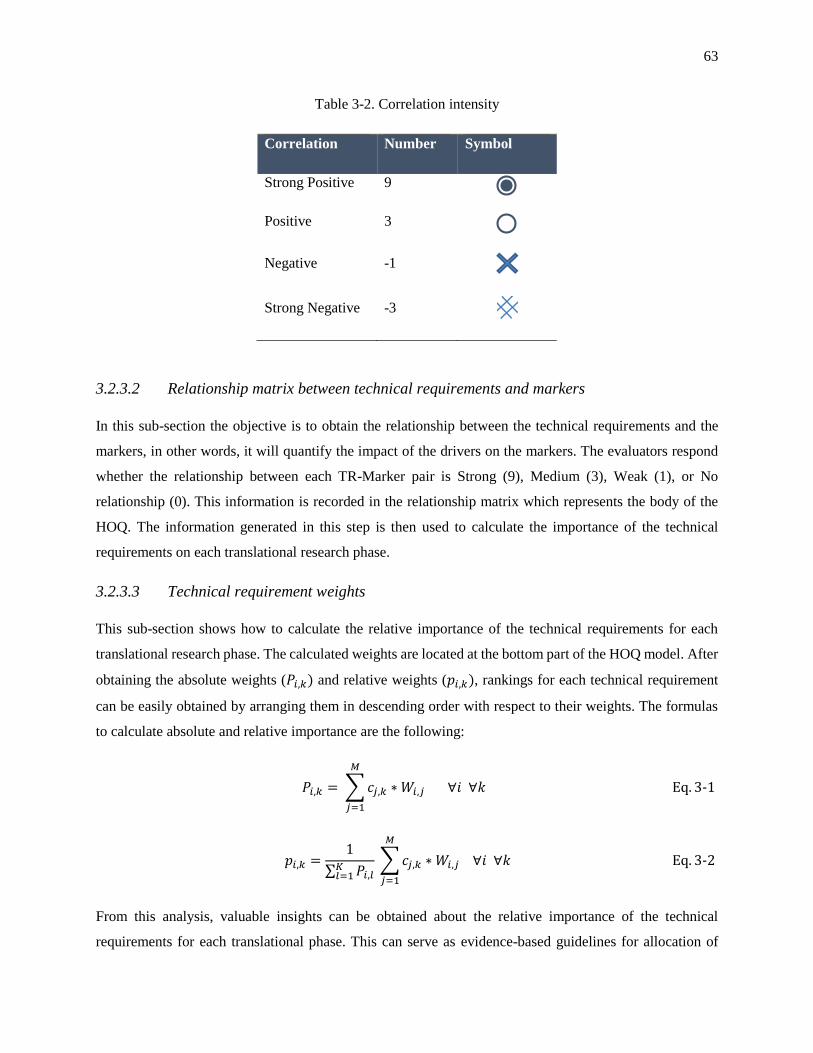
3.2.3.1 Correlation between technical requirements .................................................................... 62
3.2.3.2 Relationship matrix between technical requirements and markers .................................. 63
3.2.3.3 Technical requirement weights ......................................................................................... 63
3.3 Case Study: a Primary Care-based Weight Control Intervention ............................................ 64
3.4 Results ..................................................................................................................................... 65
3.4.1 Identification of process markers and technical requirements .......................................... 65
3.4.2 Pairwise comparison matrices, consistency and weights .................................................. 66
3.4.3 Correlation among TRs and relationship among TR-marker pairs ................................... 69
3.4.4 Determining the importance of each technical requirement in translational research ...... 72
3.5 Discussion ............................................................................................................................... 73
3.6 Conclusion ............................................................................................................................... 74
Page 7
vii
Chapter 4 ................................................................................................................................................. 76
EVALUATING COLLABORATION AND MULTI-DISCIPLINARITY AND THEIR IMPACT
ON TRANSLATIONAL RESEARCH
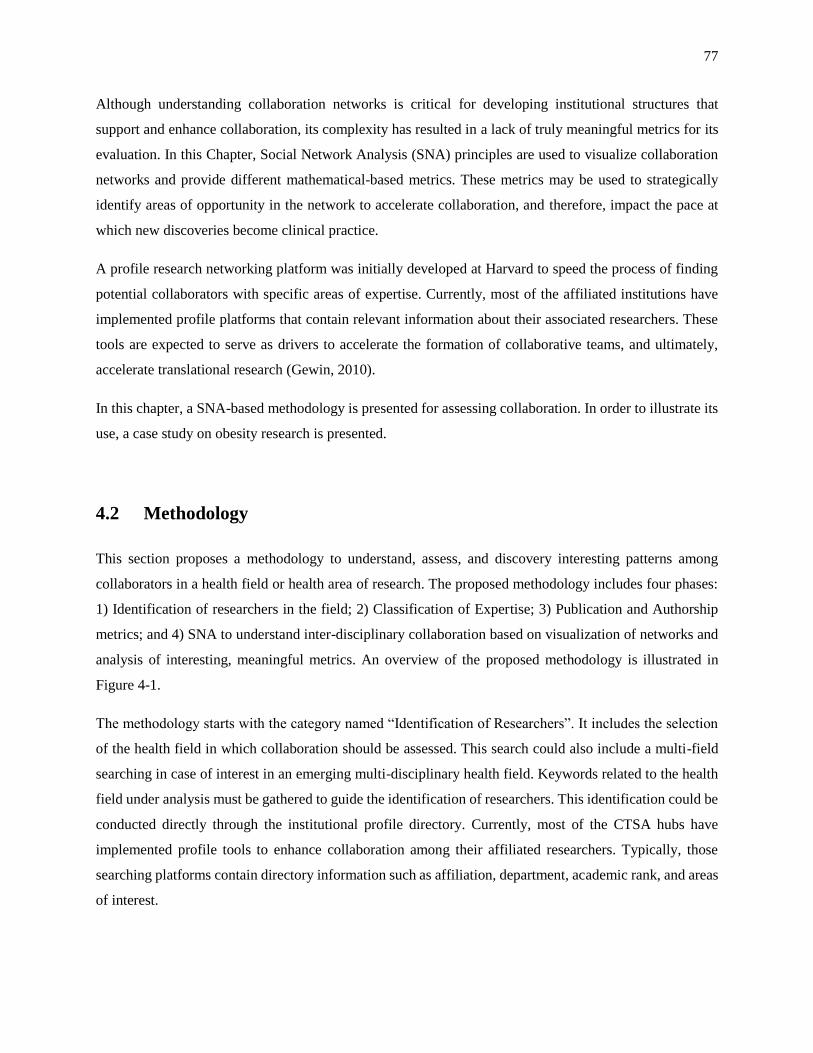
4.1 Introduction ............................................................................................................................. 76
4.2 Methodology ........................................................................................................................... 77
4.3 Case Study: Collaboration in Obesity Research ...................................................................... 78
4.3.1 Identification of obesity researchers ................................................................................. 79
4.3.2 Classification of expertise ................................................................................................. 79
4.3.3 Social network analysis for obesity researchers ............................................................... 80
4.3.4 Cross-institutional collaboration ....................................................................................... 80
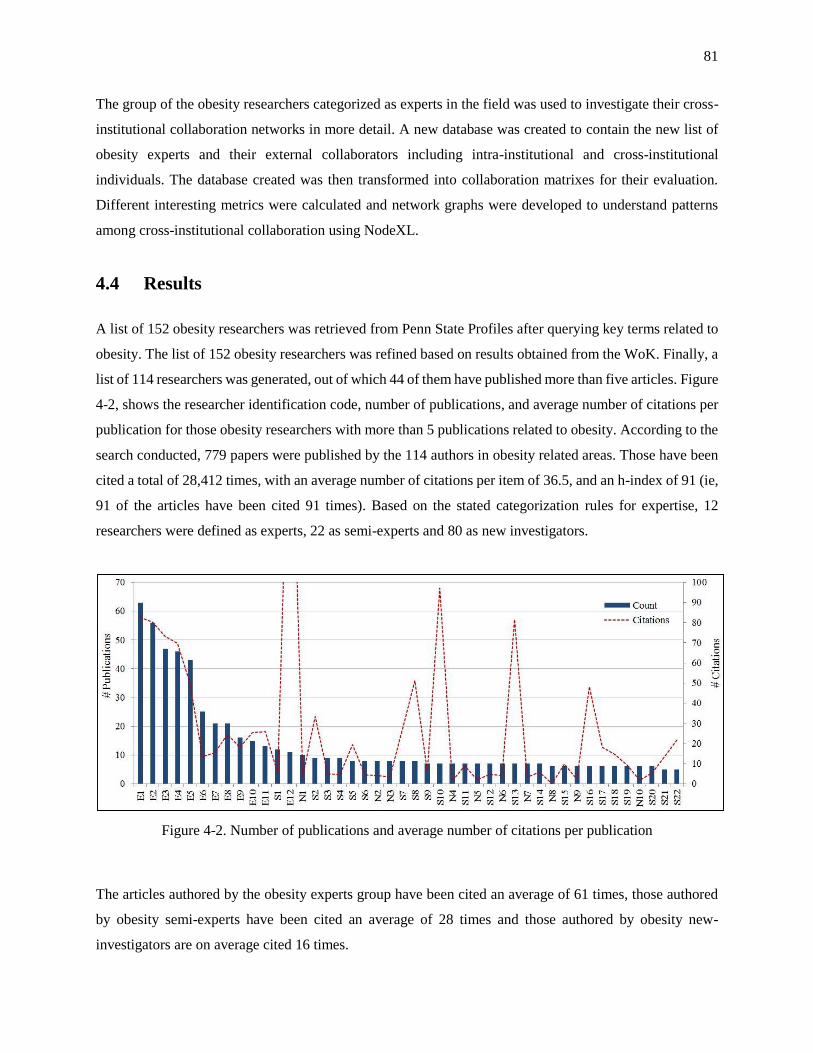
4.4 Results ..................................................................................................................................... 81
4.4.1 Intra-institutional collaboration networks ......................................................................... 82
4.4.2 Interdisciplinary collaboration by affiliation .................................................................... 85
4.4.3 Cross-Institutional collaboration networks ....................................................................... 87
4.5 Discussion ............................................................................................................................... 88
4.6 Conclusions ............................................................................................................................. 89
Chapter 5 ................................................................................................................................................. 91
GUIDING THE STRATEGY AND RESOURCE ALLOCATION OF HEALTHCARE
ORGANIZATIONS BASED ON IMPACT OF HEALTH INTERVENTIONS
5.1 Introduction ............................................................................................................................. 91
5.2 Methodology: Goal Programming Model for Proposal Selection ........................................... 94
5.2.1 Model overview ................................................................................................................ 94
5.2.2 Generic model ................................................................................................................... 97
5.2.2.1 Phase 1: Understanding the strategy ................................................................................ 97
5.2.2.2 Phase 2: Understanding the constraints ........................................................................... 97
5.2.2.3 Phase 3: Formulating the model....................................................................................... 98
5.2.2.4 Phase 4: Solving and validating ..................................................................................... 108
5.3 Case Study: Proposal Selection in a CTSA Hub ................................................................... 109
5.3.1 Identifying goals and constraints .................................................................................... 109
5.3.2 Obtaining goal weights ................................................................................................... 110
5.3.3 Formulating goal constraints........................................................................................... 110
5.3.4 Objective function ........................................................................................................... 114
5.3.5 Set of system constraints ................................................................................................. 114
5.4 Results of Proposal Selection ................................................................................................ 117
5.5 Discussion of Proposal Selection .......................................................................................... 118
5.6 Methodology: A Rapid Impact Estimation of Healthcare Interventions ............................... 120
5.7 Case Study: Impact Estimation for Early Detection of Parkinson’s Disease ........................ 124
5.7.1 Case study overview ....................................................................................................... 124
5.7.2 Parkinson’s disease background ..................................................................................... 126
5.8 Results of Rapid Impact Estimation ...................................................................................... 128
5.8.1 Potential QALYs gained ................................................................................................. 128
Page 8
viii
5.8.2 Cost per QALY ............................................................................................................... 130
5.8.3 Overall impact on society ............................................................................................... 130
5.8.4 Sensitivity analysis ......................................................................................................... 131
5.9 Discussion of Rapid Impact Estimation ................................................................................ 134
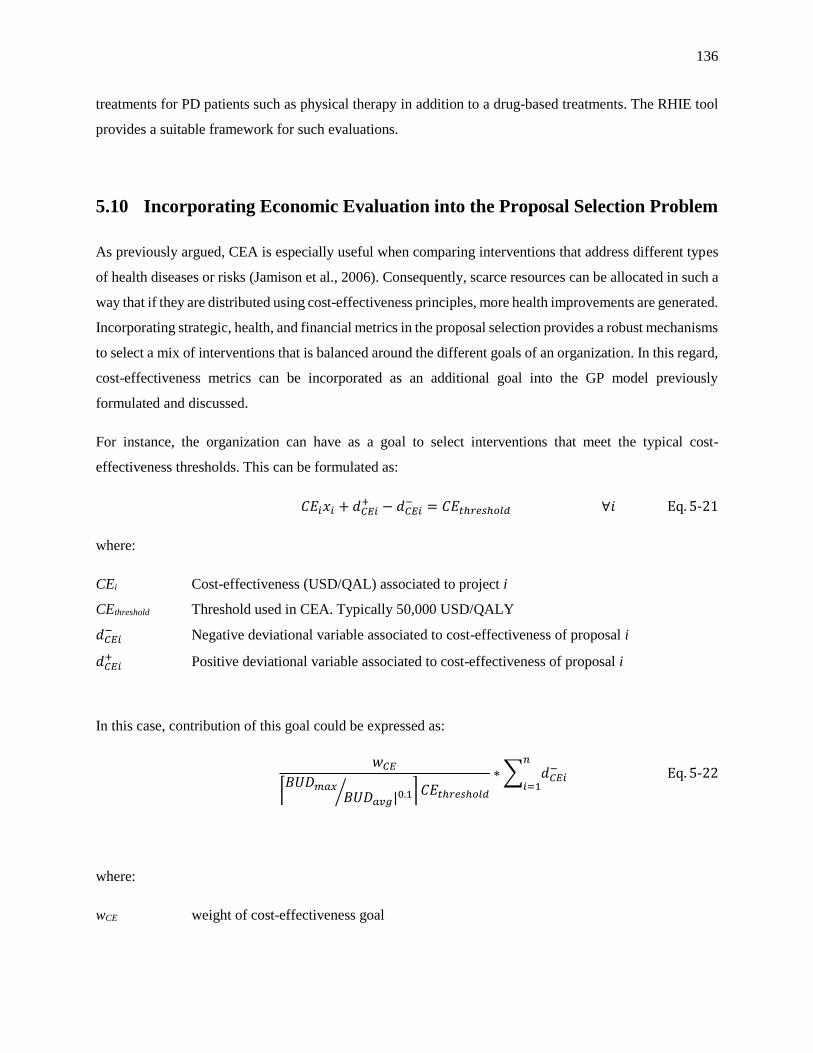
5.10 Incorporating Economic Evaluation into the Proposal Selection Problem ........................... 136
5.11 Conclusions ........................................................................................................................... 137
Chapter 6 ............................................................................................................................................... 139
CONTRIBUTIONS AND FUTURE WORK
6.1 Identifying Key Drivers and Prioritizing Efforts ................................................................... 140
6.2 Closing Existing Gaps ........................................................................................................... 140
6.3 Engaging the Participation of Health Professionals .............................................................. 141
6.4 Guiding the Strategy of Healthcare Organizations ................................................................ 142
6.5 Future Work .......................................................................................................................... 142
REFERENCES ......................................................................................................................................... 145
Appendix A. House of Quality ................................................................................................................. 160
Appendix B. List of Proposals and Characteristics ................................................................................... 161
Appendix C. Proposals’ coefficients ......................................................................................................... 162
Appendix D. PBi coefficients ................................................................................................................... 162
Appendix E. Distribution of enrollment in graduate school (For illustration purposes only)................... 163
Appendix F. LINDO Code ........................................................................................................................ 163
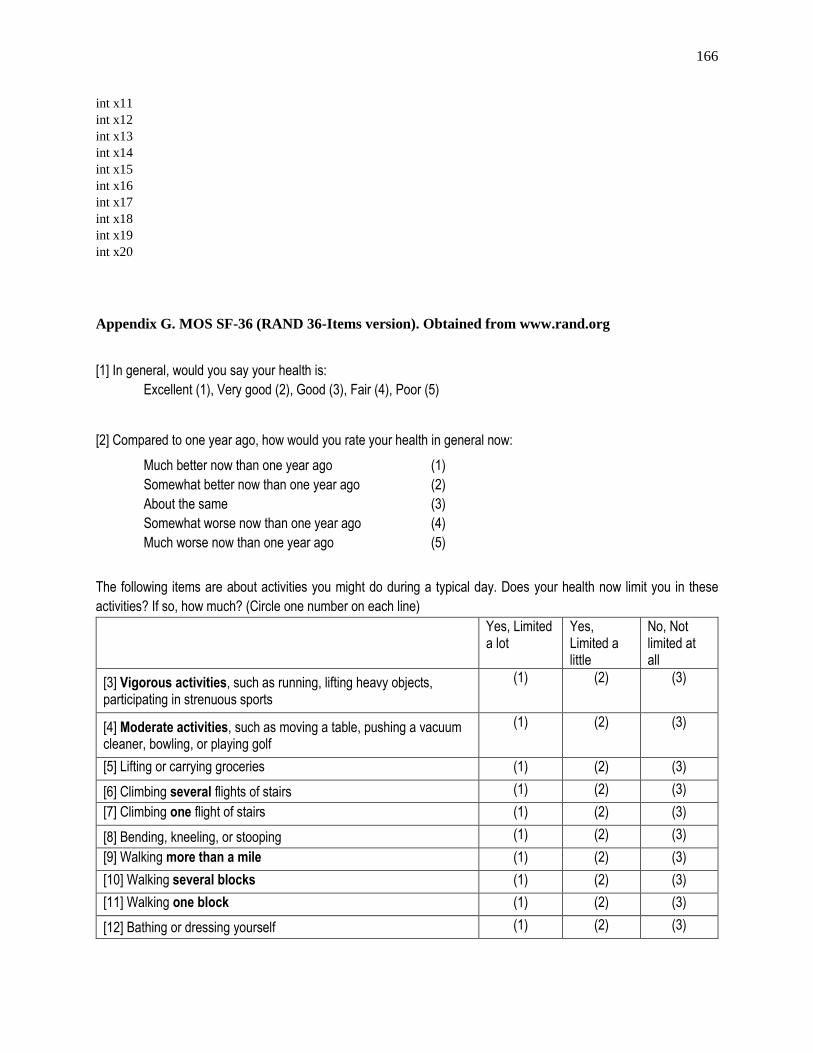
Appendix G. MOS SF-36 (RAND 36-Items version). Obtained from www.rand.org ............................. 166
Page 9
ix
List of Tables
Table 1-1. Research questions .................................................................................................................... 10
Table 1-2. Gaps, approach, and main contributions of Chapter 3 ............................................................... 11
Table 1-3. Gaps, approach, and main contributions of Chapter 4 ............................................................... 12
Table 1-4. Gaps, approach, and main contributions of Chapter 5 ............................................................... 13
Table 2-1. AHP scale definition .................................................................................................................. 20
Table 2-2. Random consistency index ........................................................................................................ 21
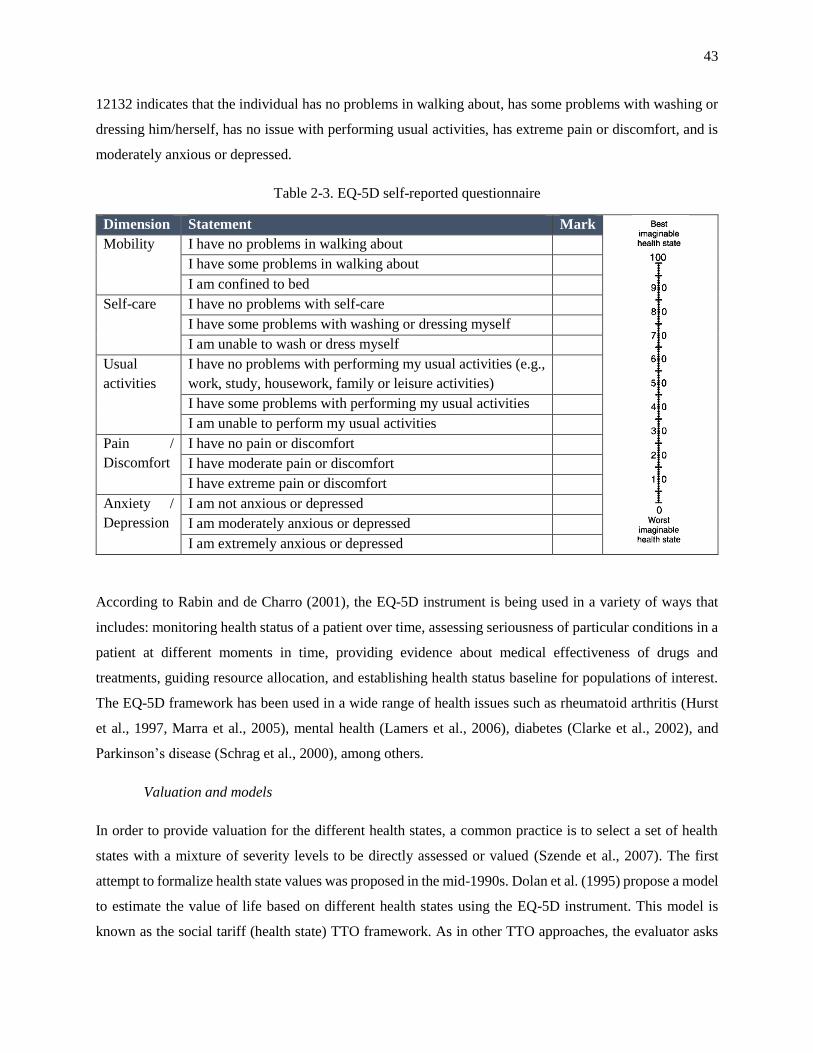
Table 2-3. EQ-5D self-reported questionnaire ............................................................................................ 43
Table 2-4. Coefficients for TTO tariffs (modified from Dolan et al., 1995) .............................................. 44
Table 2-5. EQ-5D - D1 Valuation model .................................................................................................... 45
Table 2-6. SF-36 Health status and interpretation ...................................................................................... 47
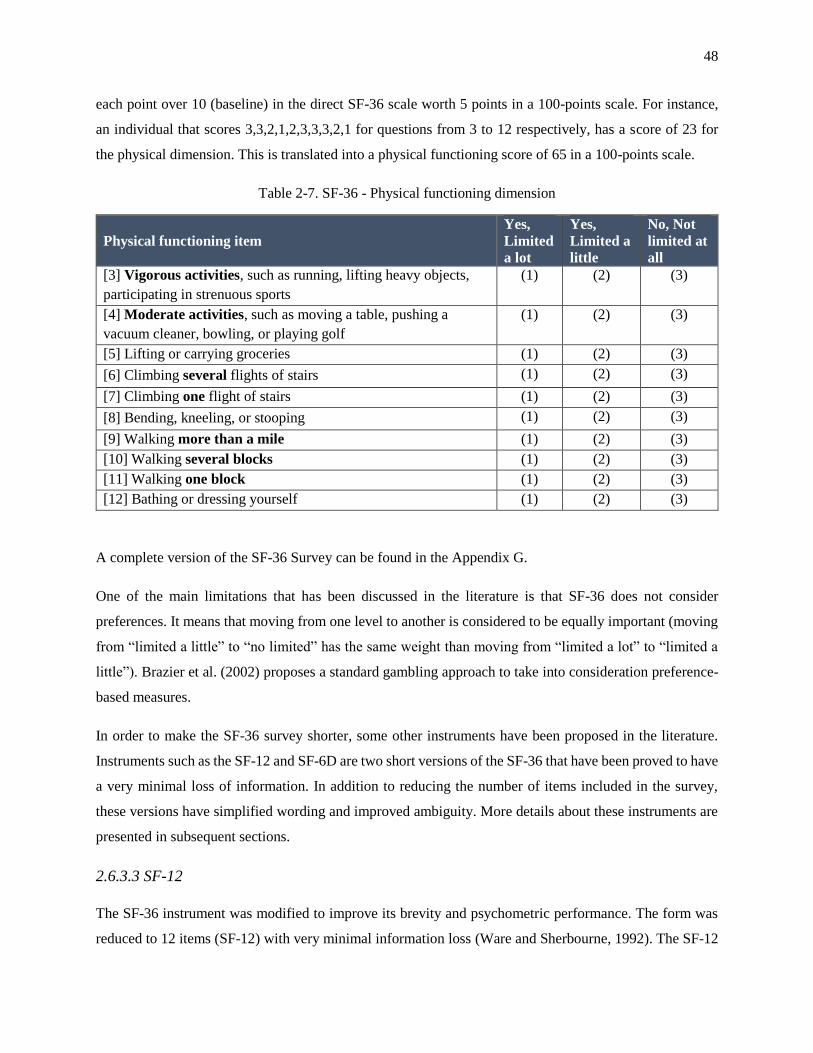
Table 2-7. SF-36 - Physical functioning dimension.................................................................................... 48
Table 2-8. SF-12 Health dimensions and summary of content ................................................................... 49
Table 2-9. SF-12 Regression coefficients ................................................................................................... 50
Table 2-10. SF-6D Health dimensions and levels ....................................................................................... 52
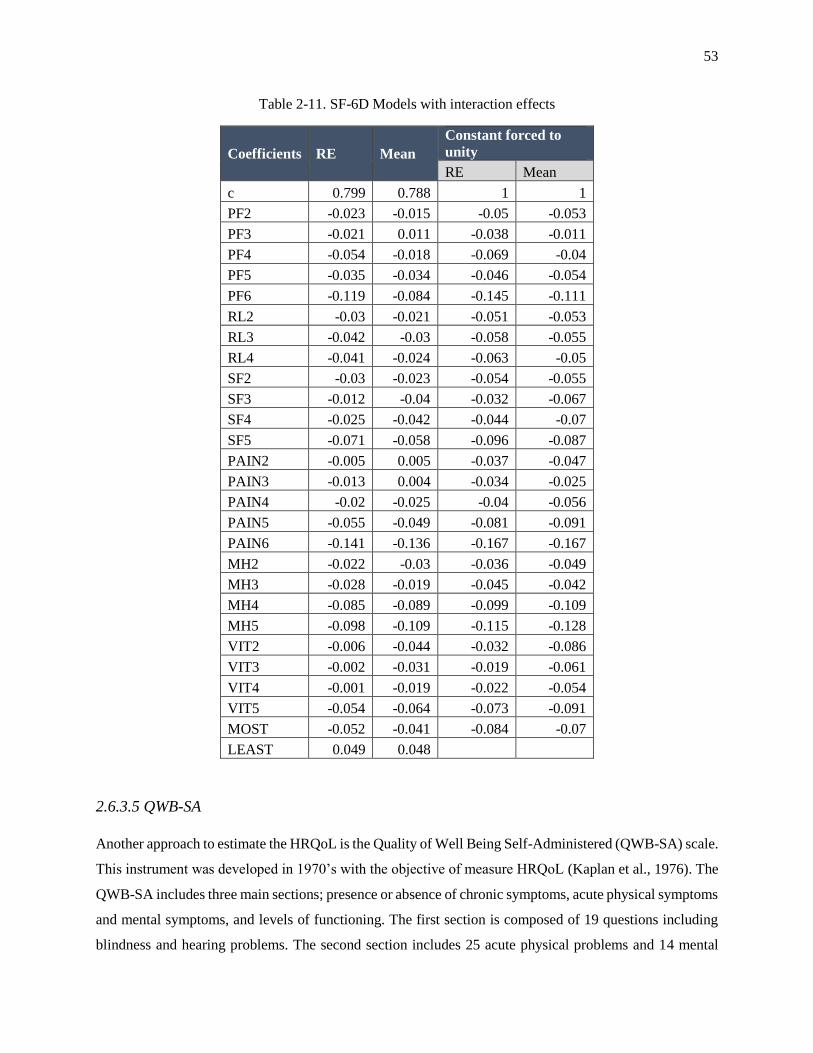
Table 2-11. SF-6D Models with interaction effects .................................................................................... 53
Table 3-1. AHP scale definition .................................................................................................................. 61
Table 3-2. Correlation intensity .................................................................................................................. 63
Table 3-3. Markers for the obesity peer-led intervention ........................................................................... 65
Table 3-4. Technical requirements for the obesity peer-led intervention ................................................... 66
Table 3-5. T1 – Pairwise comparison matrix .............................................................................................. 66
Table 3-6. T2 – Pairwise comparison matrix .............................................................................................. 67
Table 3-7. T3 – Pairwise comparison matrix .............................................................................................. 67
Table 3-8. Consistency analysis values ....................................................................................................... 68
Table 3-9. Marker weights .......................................................................................................................... 68
Table 3-10. Relationship matrix for T1 ...................................................................................................... 70
Table 3-11. Relationship matrix for T2 ...................................................................................................... 71
Table 3-12. Relationship matrix for T3 ...................................................................................................... 71
Table 3-13. Technical requirements relative weights ................................................................................. 72
Table 4-1. Expertise classification criteria .................................................................................................. 79
Table 4-2. 15 Most frequently-used journals .............................................................................................. 82
Table 5-1. Rating method to obtain goal weights ..................................................................................... 108
Page 10
x
Table 5-2. Expert's scores and goal priorities ........................................................................................... 110
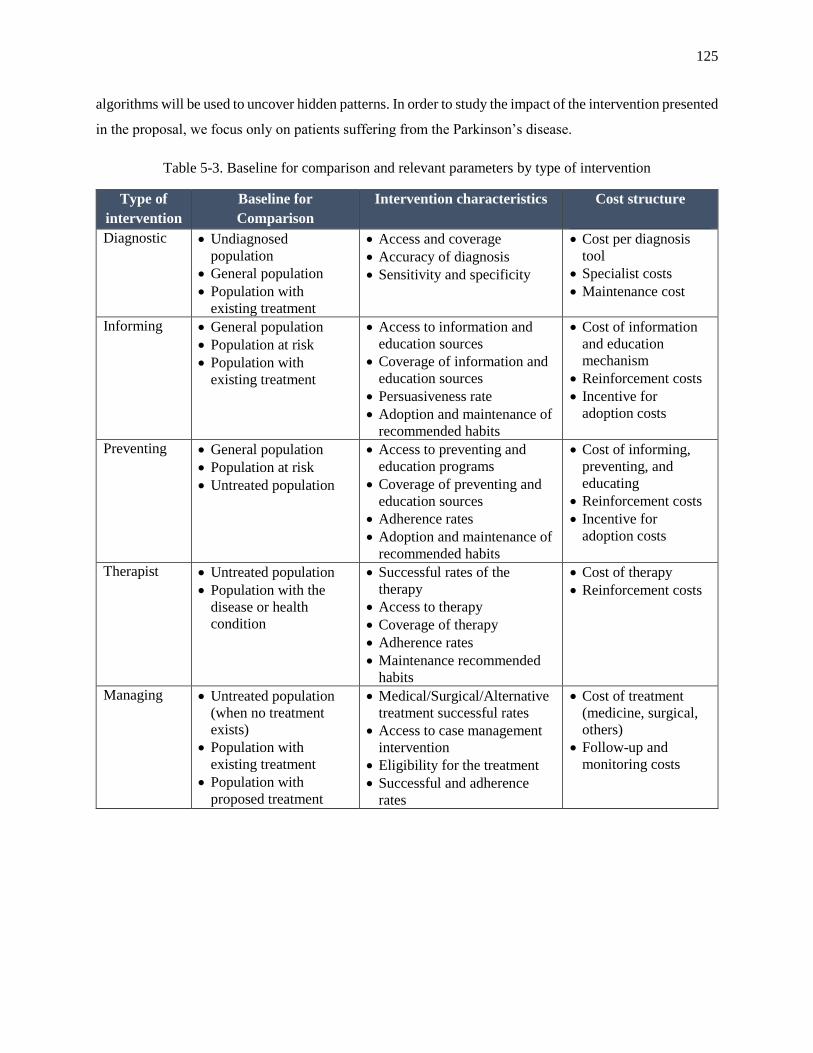
Table 5-3. Baseline for comparison and relevant parameters by type of intervention .............................. 125
Table 5-4. Hoehn and Yahr stages and characteristics ............................................................................. 127
Table 5-5. HRQoL of treated vs untreated PD patients by HY stage ....................................................... 129
Table 5-6. Data for estimating overall impact on society ......................................................................... 131
Page 11
xi
List of Figures
Figure 1-1. Expanded QI research toolkit ..................................................................................................... 5
Figure 1-2. Methodology diagram ................................................................................................................ 6
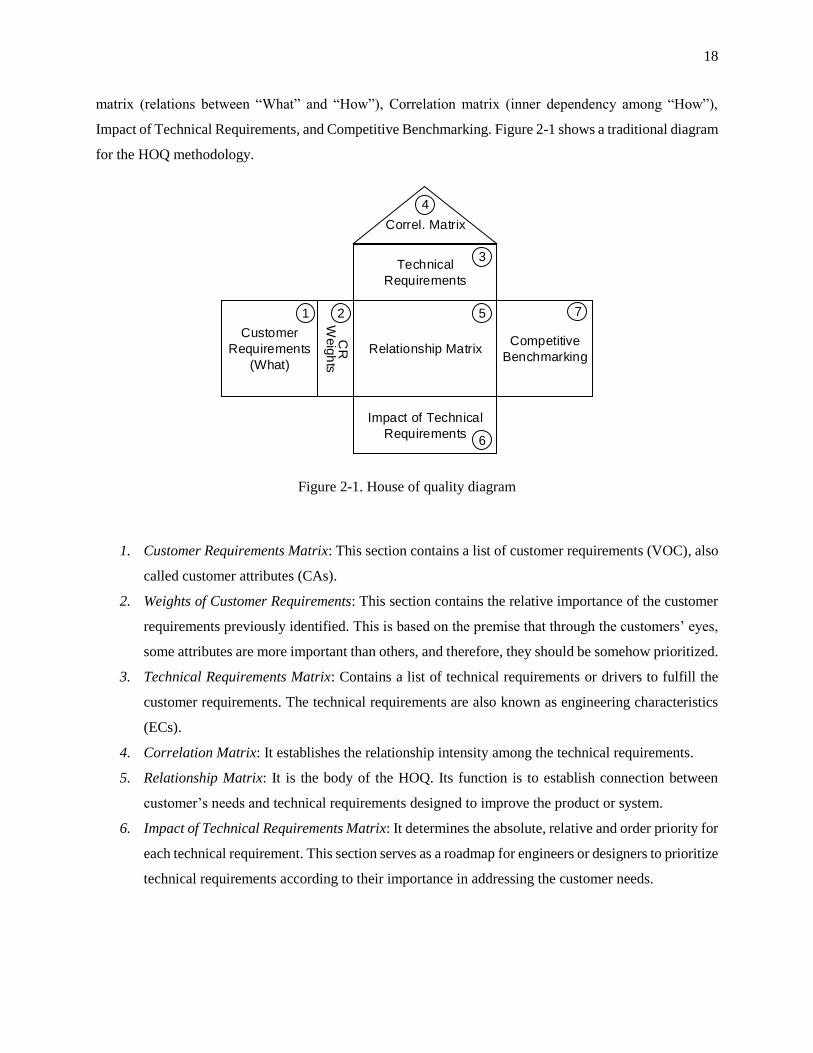
Figure 2-1. House of quality diagram ......................................................................................................... 18
Figure 2-2. Directed and undirected graphs ................................................................................................ 25
Figure 2-3. Types of health interventions (adapted from Jamison et al. (2006)) ........................................ 37
Figure 2-4. Histogram of distribution of HRQoL ranges for US and UK .................................................. 46
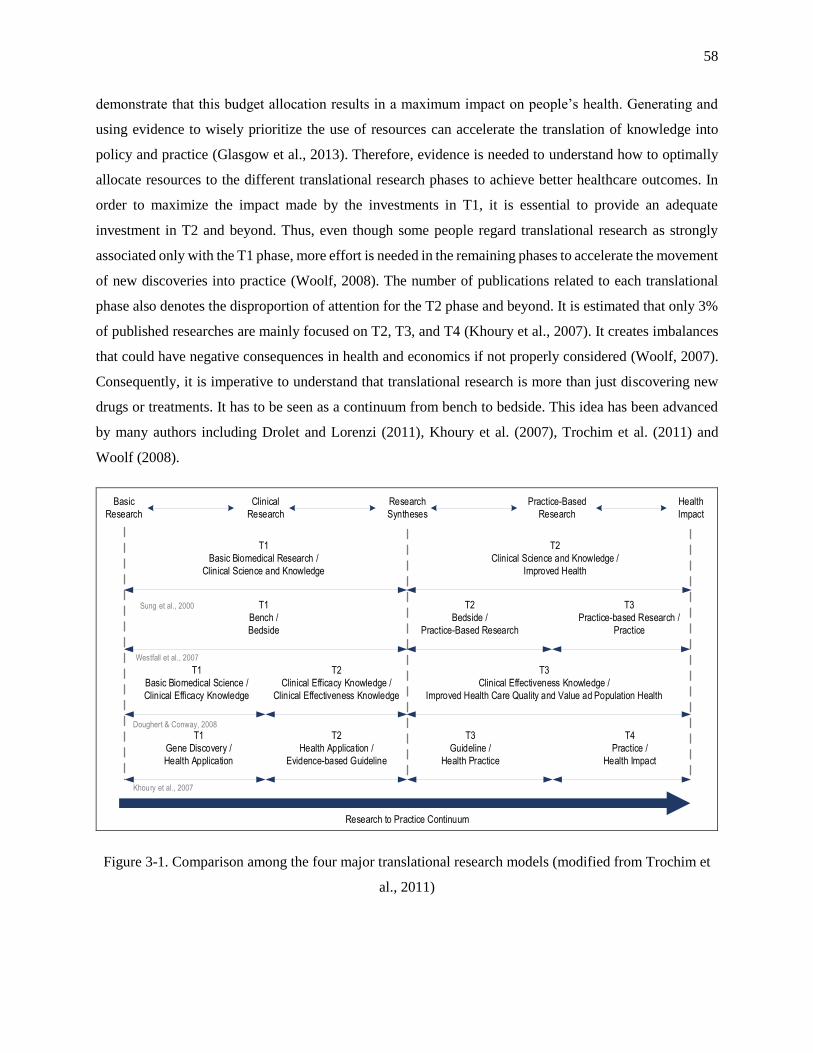
Figure 3-1. Comparison among the four major translational research models (modified from Trochim et
al., 2011) ............................................................................................................................................. 58
Figure 3-2. QFD-AHP Methodology Diagram ........................................................................................... 64
Figure 3-3. Extended process marker model .............................................................................................. 69
Figure 3-4. Technical requirements correlation .......................................................................................... 70
Figure 3-5. Relative importance for technical requirements on each "T" phase ......................................... 73
Figure 4-1. Overview of methodology to assess intra-institutional collaboration ...................................... 78
Figure 4-2. Number of publications and average number of citations per publication ............................... 81
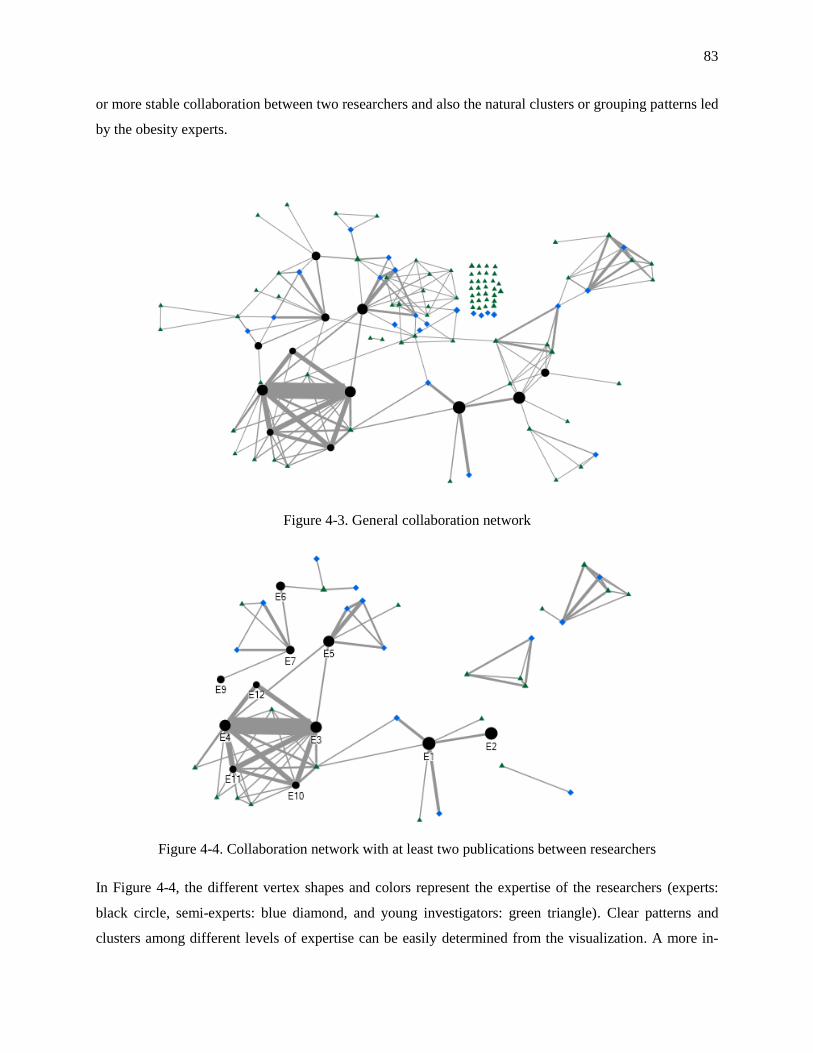
Figure 4-3. General collaboration network ................................................................................................. 83
Figure 4-4. Collaboration network with at least two publications between researchers ............................. 83
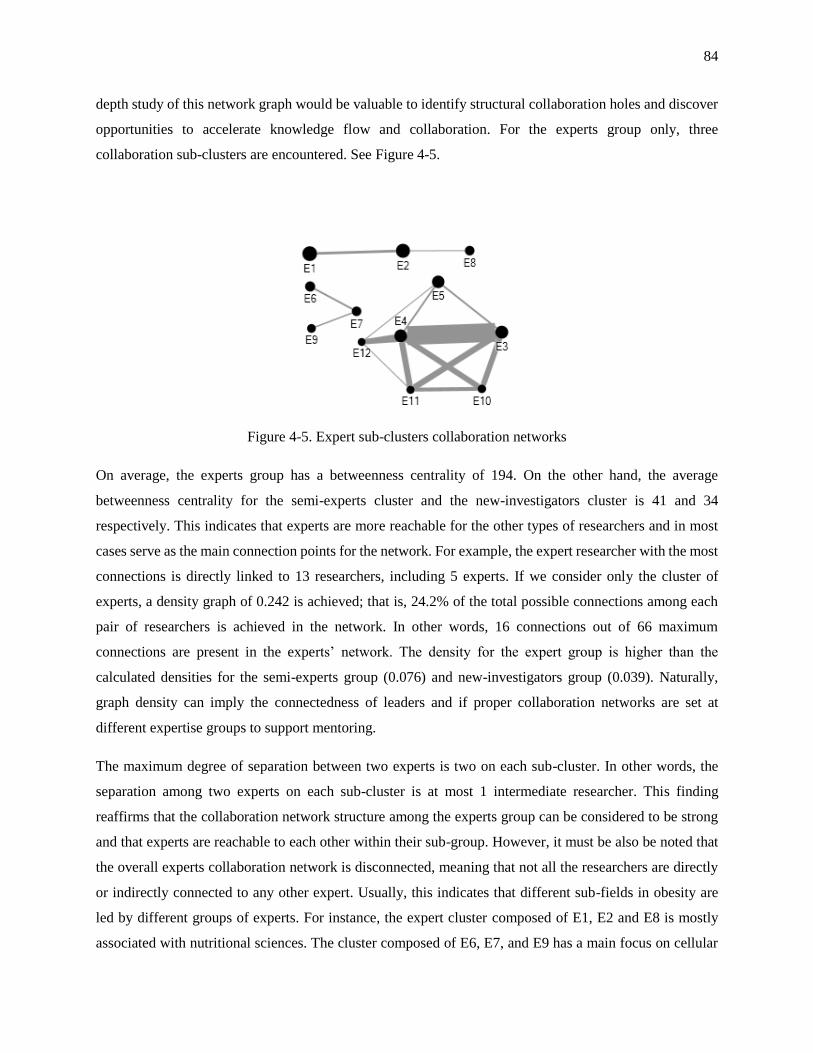
Figure 4-5. Expert sub-clusters collaboration networks ............................................................................. 84
Figure 4-6. Collaboration network per affiliation ....................................................................................... 86
Figure 4-7. Cross-institutional collaboration for obesity experts ................................................................ 87
Figure 5-1. Sections distribution of Chapter 5 ............................................................................................ 93
Figure 5-2. Overview of methodology for the proposal selection problem ................................................ 96
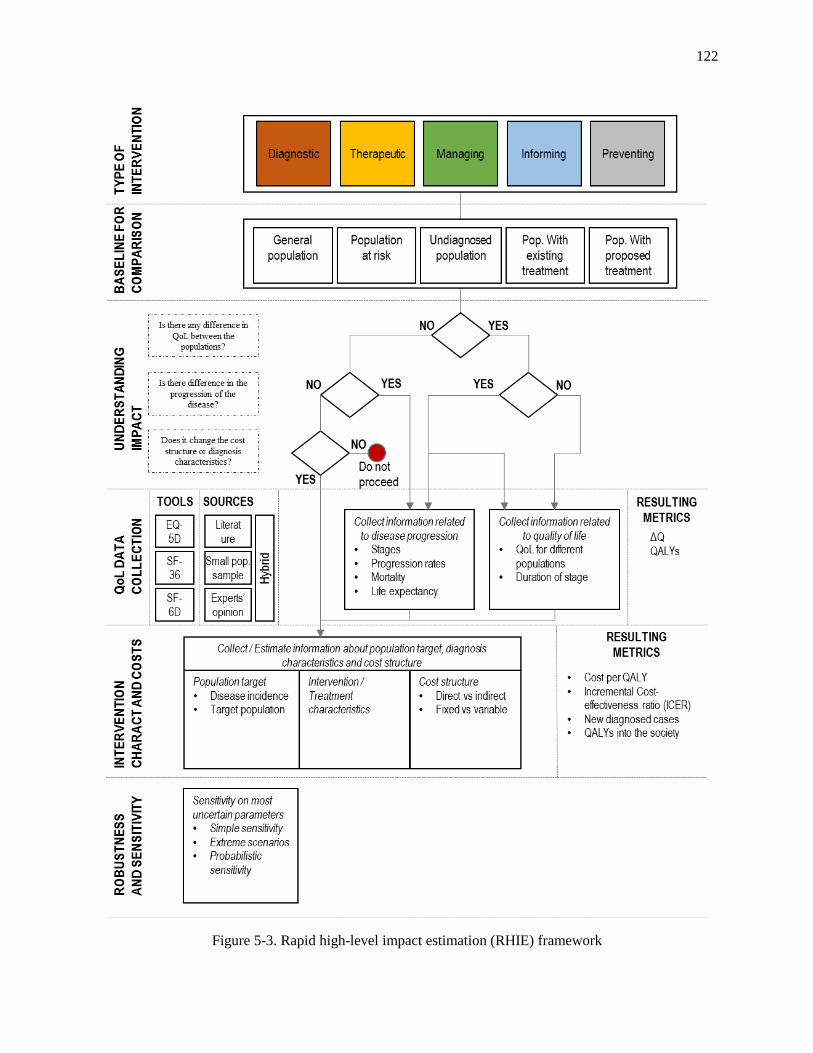
Figure 5-3. Rapid high-level impact estimation (RHIE) framework ........................................................ 122
Figure 5-4. QALYs gained by currently undiagnosed individuals ........................................................... 129
Figure 5-5. Cost-effectiveness sensitivity for QALYs gained and cost per diagnosed case ..................... 133
Figure 5-6. Cost-effectiveness tornado sensitivity for relevant parameters .............................................. 134
Page 12
xii
List of symbols and abbreviations
A&F Audit and Feedback
AHP Analytic Hierarchy Process
AHRQ Agency for Healthcare Research & Quality
CQI Continuous Quality Improvement
CEA Cost-Effectiveness Analysis
CUA Cost-Utility Analysis
CTSA Clinical and Translational Science Award
CTSI Clinical and Translational Sciences Institute
D&I Dissemination and Implementation
DALY Disability-Adjusted Life Year
EBM Evidence-based Medicine
EBP Evidence-based Practice
EHR Electronic Health Record
FMEA Failure Mode and Effects Analysis
GDP Gross Domestic Product
GP Goal Programming
HA Hazard Analysis
HOQ House of Quality
HRQoL Health-Related Quality of Life
ICER Incremental Cost-Effectiveness Ratio
IOM Institute of Medicine
MCDM Multiple Criteria Decision Making
NAE National Academy of Engineering
NIH National Institute of Health
PD Parkinson’s Disease
PSU Pennsylvania State University
QALY Quality-Adjusted Life Year
QFD Quality Function Deployment
QI Quality Improvement
RCA Root Cause Analysis
RHIE Rapid High-level Impact Estimation
Page 13
xiii
SNA Social Network Analysis
SG Standard Gamble
T1 Phase 1 in Translational Research
T2 Phase 2 in Translational Research
T3 Phase 3 in Translational Research
T4 Phase 4 in Translational Research
TQM Total Quality Management
TTO Time Trade-Off
TR Technical Requirements
VAS Visual Analogue Scale
VOC Voice of the Customer
WHO World Health Organization
WoK Web of Knowledge
Page 14
xiv
Important Terms and Definitions
Audit and Feedback In the healthcare field, Audit and Feedback can be defined as “any
summary of clinical performance of health care over a specified period of
time aimed at providing information to health professionals to allow them
to assess and adjust their performance.” (Jamtvedt et al., 2006).
Cost-Effectiveness In the healthcare context, cost-effectiveness analysis “helps identify
neglected opportunities by highlighting interventions that are relatively
inexpensive, yet have the potential to reduce the disease burden
substantially… helps identifying ways to redirect resources to achieve
more.” (Jamison et al., 2006).
Dissemination “Dissemination is the targeted distribution of information and intervention
materials to a specific public health or clinical practice audience. The
intent is to spread knowledge and the associated evidence-based
interventions.” (NIH, 2007)
Evidence-Based Medicine “Evidence based medicine is the conscientious, explicit, and judicious use
of current best evidence in making decisions about the care of individual
patients. The practice of evidence based medicine means integrating
individual clinical expertise with the best available external clinical
evidence from systematic research.” (Sackett et al., 1996).
Implementation “Implementation is the use of strategies to adopt evidence-based health
interventions and change practice patterns within specific settings.” (NIH,
2007).
Intervention According to the AHRQ, an intervention is “any type of treatment,
preventive care, or test that a person could take or undergo to improve
health or to help with a particular problem. Health care interventions
include drugs (either prescription drugs or drugs that can be bought
without a prescription, food, supplements (such as vitamins), vaccinations,
screening tools (to rule out a certain disease), exercises (to improve
fitness), hospital treatment, and certain kinds of care (such as physical
therapy).”
Page 15
xv
Quality Improvement Quality Improvement is a systematic approach to analyze the performance
of a system and combine efforts to improve it. In healthcare settings, it can
be defined “as the combined and unceasing efforts of everyone—
healthcare professionals, patients and their families, researchers, payers,
planners and educators—to make the changes that will lead to better
patient outcomes (health), better system performance (care) and better
professional development.” (Batalden and Davidoff, 2007).
Translational Research “Translational research fosters the multidirectional integration of basic
research, patient-oriented research, and population-based research, with
the long-term aim of improving the health of the public.” (Rubio et al.,
2010).
Page 16
xvi
Acknowledgements
I would like to thank all of those from which I received support during this long academic journey. During
these last four years, I had the opportunity to meet amazing people in different situations and from very
different backgrounds. From all of them, I have learned to see the world differently and develop a very
open mindset.
I would like to express my sincere gratitude to my advisor and mentor, Dr. Harriet Black Nembhard. Her
guidance and mentorship during these years were essential for keeping myself focused and motivated in
researching relevant topics that could potentially have a positive impact on society. I would also like to
thank each one of the members of my dissertation committee — Dr. Paul Griffin, Dr. Deidre McCaughey,
Dr. Ling Rothrock, and Dr. Conrad Tucker — for their advice and helpful insights in developing this
dissertation. There are many others that directly or indirectly helped me to finish this dissertation. I
gratefully acknowledge Dr. Jennifer Kraschnewski, from the College of Medicine at Penn State, for being
willing and excited to exploring new engineering-focused methodologies and their application to
translational research. I would also like to thank Dr. Xuemei Huang for her receptiveness and enthusiasm
about using frameworks to estimate the impact of healthcare interventions. I also want to thank Kate
Camargo for her support, commitment, and availability to help on various topics related to this dissertation.
During the past four years, I had the opportunity to work on several projects with a diverse group of people.
I would like to thank all of those that collaborated with me during my years at Penn State. I am grateful to
the Pediatric Intensive Care Unit at the Penn State Hershey Medical Center, especially to Dr. Gary Ceneviva
and Dr. Robert Tamburro. I am also grateful to Windy Alonso, Dr. Judith Hupcey, and Alison Walsh, from
the College of Nursing at Penn State.
I also want to thank the students, professors, and staff of the Harold and Inge Marcus Department of
Industrial and Manufacturing Engineering at Penn State. Especially, I would like to thank Dr. Jeya Chandra,
Dr. Catherine Harmonosky, Dr. Ravi Ravindran, Dr. Christopher Saldana, Erin Ammerman, and Olga
Covasa. I also want to thank the Center for Integrated Healthcare Delivery Systems (CIHDS) and the Center
for Health Organization Transformation (CHOT) for giving me the opportunity to work on challenging
projects and meet gorgeous people.
I am grateful to the “Comisión Nacional de Investigación Científica y Tecnológica de Chile” (CONICYT)
which provided financial support through the “Becas Chile” scholarship. I also want to thank to the Penn
State Clinical and Translational Sciences Institute for their financial support through a graduate
Page 17
xvii
assistantship. Part of this work was supported by the National Center for Research Resources and the
National Center for Advancing Translational Sciences, National Institutes of Health, through Grant UL1
TR000127.
I also want to thank my lab-mates for making these years more exciting and enjoyable. Especially, I want
to thank Hyojung Kang and Nate Bastian. I am also thankful to all my friends of Happy Valley, especially,
to Los Tikis, Patada FC, and LAGRASA for being our substitute families and for making winters warmer.
Finally, but most importantly, I would like to thank my wife, Carolina, and my lovely sons, Javier, and
Diego, for their support and immeasurable love during our years at Penn State. Additionally, I would like
to thank my parents, siblings, and God. Without their help and love, this would not have been possible.
Page 18
1
Chapter 1
INTRODUCTION
Despite the uncountable achievements in medical discoveries in the U.S., there is still a large gap between
proven knowledge and its impact on people’s health (IOM, 2001, Green et al., 2009, Glasgow et al., 2012).
Some have argued that a main problem in the U.S. healthcare system is its weakness of applying what has
been learned through research (IOM, 2001, Berwick, 2003). It is estimated that adults in the U.S. receive
only about half of their recommended processes involved in care (McGlynn et al., 2003). As a consequence
of this inability of using the evidence generated, poor results have been obtained not only with respect to
impacting health outcomes, but also in terms of costs (Woolf, 2007, Grimshaw et al., 2012a).
In order to close the existing gaps, new designs and solutions must be explored to ensure that patients
receive their recommended healthcare (Reid et al., 2005, McHugh and Barlow, 2010, Davies et al., 2010,
Glasgow et al., 2012). Therefore, a substantial redesign using new tools and approaches is needed to
improve safety and quality, while reducing, or at least maintaining costs (Selker et al., 2011). In this sense,
Quality Improvement (QI) methodologies have been considered to be one of the main strategies for
addressing pressures for change and improvement in healthcare (Grol and Grimshaw, 2003). However, in
healthcare fields, QI methodologies have been mostly limited to the applicability of lean and six sigma
techniques (Ting et al., 2009). As a result of this limited scope, some have argued that these basic
techniques, although useful in several applications, cannot solve the complex problems faced by the
healthcare systems, including translational research efforts. In response, integrating more complex
research-oriented tools into the basic QI toolkit has been argued to be necessary to strengthen the benefits
Page 19
2
and scope of QI in healthcare (Baldwin et al., 2012). Additionally, the integration of a more research-
oriented QI methodology could serve not only to addressing tactical and operational challenges, but also
facing problems at the strategic levels. Therefore, QI research can be used to bridge the gap between what
we know and what we do with this knowledge (Ting et al., 2009) by speeding the translation of effective
interventions into clinical practice and supporting the strategies to implement those interventions at the
point of care (Baldwin et al., 2012).
Auditing change through data-driven techniques is one of the key needs to understand why the efforts
invested in basic research are not producing an optimal effect on people’s health. Although the discussion
of the potential benefits of QI approaches in translational research has already been initiated (Baldwin et
al., 2012, Schmittdiel et al., 2010, Schweikhart and Dembe, 2009, Feldstein and Glasgow, 2008), more
research is needed to clarify their scope and generate frameworks that could be efficiently actionable into
practice. While many systems engineering methodologies, including QI, have been successfully applied to
solve different challenges in healthcare systems, there is still a lack of research focusing on translational
research. Moreover, data-driven tools are needed for assuring the efficiency and effectiveness of the
decision making process, especially, for an optimal allocation of healthcare resources. Certainly, it creates
a motivation to investigate how QI research approaches could be applied to accelerate the pace at which
new discoveries are integrated into clinical practice.
1.1 Statement of the Problem
Various irrefutable facts about the U.S. healthcare system, indicate that new approaches are needed to
improve the quality of care and ensure that the best-known practices are disseminated and implemented
adequately. Although the term translational research has become popular during the past decade, there is
still a lack of agreement on how to measure and monitor its complex, dynamic, and large-scale nature.
These factors have resulted in disagreement and lack of robust tools to address its complexity (IOM, 2001).
Understanding large-scale systems and their dynamics is a prime opportunity for multi-disciplinary
collaboration to fill existing gaps. In order to overcome these challenges, funding agencies from health and
engineering sectors have called for a stronger healthcare-engineering enterprise collaboration effort (IOM,
NAE, AHRQ) (Reid et al., 2005). A major contribution expected from this partnership is the development
of more robust, generalizable and sustainable frameworks to assess and audit the complexity of knowledge
transference (Glasgow et al., 2012). These frameworks should contribute to a wiser distribution of resources
and achievement of the maximum value given those resources, and therefore, reduce the costs of poor
quality.
Page 20
3
1.2 Gaps that Need to be Filled and Problems that Need to be Solved
Although translational research has been studied for more than 30 years (Wolf, 1974), discrepancies in its
meaning and scope have led to the generation of different conceptual models to understand its continuum
nature. However, those models have failed to provide metrics to evaluate the long process of translating
research. It is estimated that on average, it takes 17 years from basic medical discoveries to be included as
regular healthcare practice. Additionally, according to Antes et al. (1999) the time lag between scientifically
proven knowledge and the introduction into medical routine takes on average between 8 and 10 years.
Measuring the effects and complexity of translational research is far from being a trivial task. The inability
of current methods to assess translation has caused that many of the proven discoveries to be lost in
transition (Butler, 2008). Consequently, most of the resources allocated to improve people’s health have
not been distributed based on evidence but mostly on pure intuition. Therefore, despite the investments that
have been made in translational research, public health benefits remain still far from optimal. In response
to this, more robust and data-driven frameworks should be provided not only to demonstrate success in the
integration of new discoveries into health policy and practice, but also to provide feedback and inform
decision makers in the biomedical research enterprise (Glasgow et al., 2012).
1.3 Motivation and Challenges
Systems engineering techniques, including QI, have a vast history of success in evaluating and auditing
complex, dynamic, large-scale systems. The main motivation for this research is to utilize the QI knowledge
gained in other industries to provide robust frameworks to assess and inform translational research at the
strategic level. Although QI has been considered to provide conceptual strategies to address current gaps
between ideal and actual care, its use has remained limited (Ting et al., 2009, Shojania et al., 2004).
Generalizable and sustainable research-oriented frameworks are needed in healthcare to truly accelerate the
journey of new discoveries to become regular clinical practice based on evidence. Although tremendous
advances have been made in generating interventions based on evidence, poor results have been obtained
in terms of implementing the best-known treatments and practices. One of the reasons for this to happen is
the lack of robust frameworks to evaluate and monitor multiple dimensions of translational research and
inform decision makers. The research-oriented QI framework proposed will not only be used to evaluate
complexity, but also to identify interesting interactions among different elements of the healthcare systems,
and guide the allocation of efforts by providing data-driven tools to different key healthcare stakeholders
and decision makers. Hence, resources can be spent wisely to maximize the impact on people’s health. In
summary, the final goal of the QI research approach presented in this dissertation is to provide a better
Page 21
4
understanding of the existing gap in translational research, measuring it, and providing robust tools for
closing it.
1.4 Research Objective and Main Contributions
1.4.1 Research objectives
The objective of this dissertation is to investigate how QI research methodologies can be implemented to
assess the complexity in translational research and support a better strategic allocation of resources. This
broad objective is split into five sub-objectives, as follows:
• Provide models to map and quantify complexity in translational research. These models will
generate evidence that can be used at the strategic level to guide and inform key decision makers
on the allocation of resources along the translational research process.
• Identify the key elements involved in translational research and their impact on the pace at which
new discoveries become regular clinical practices.
• Investigate methods and meaningful metrics to assess collaboration networks and multi-
disciplinarity as well as their effects on an efficient translation of knowledge.
• Provide models to prioritize health interventions based on their value, the potential impact on
people’s health, and multiple-criteria fit on the healthcare organizations’ strategy.
• Develop a robust framework to guide the understanding of healthcare interventions’ impact based
on cost-effectiveness measures.
1.4.2 What will be added to the field of knowledge
This dissertation shows that QI research methodologies can contribute to the understanding, evaluation, and
monitoring of complexity in translational research. Moreover, it must be noted that the scope of QI used in
this dissertation is broader than the one typically used in healthcare fields. Thus, a more research-oriented
QI approach is used by integrating more comprehensive tools into the basic QI toolkit. This will help
addressing complex issues in translational research that require more inclusive approaches. Consequently,
the existing gap between the proven knowledge and its impact on health outcomes can be understood,
measured, and closed. The key contribution of the proposed approach is to provide robust frameworks that
generate evidence to inform healthcare stakeholders and guide the allocation of resources and efforts at
Page 22
5
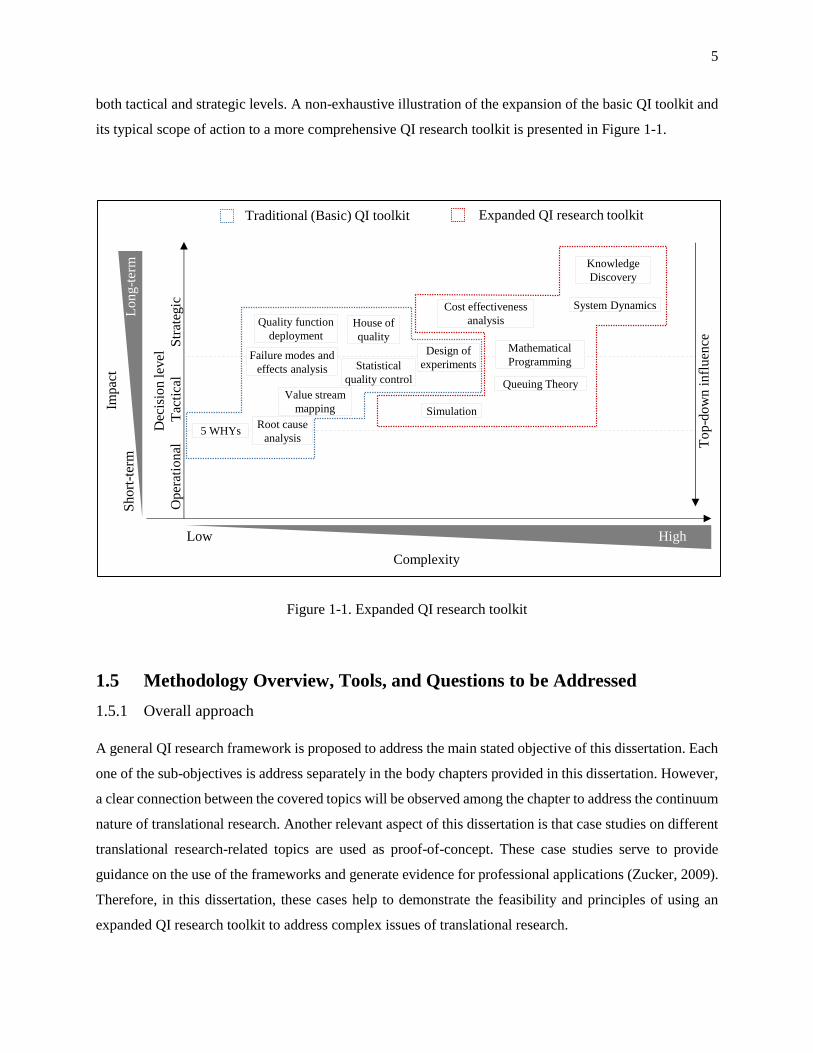
both tactical and strategic levels. A non-exhaustive illustration of the expansion of the basic QI toolkit and
its typical scope of action to a more comprehensive QI research toolkit is presented in Figure 1-1.
Figure 1-1. Expanded QI research toolkit
1.5 Methodology Overview, Tools, and Questions to be Addressed
1.5.1 Overall approach
A general QI research framework is proposed to address the main stated objective of this dissertation. Each
one of the sub-objectives is address separately in the body chapters provided in this dissertation. However,
a clear connection between the covered topics will be observed among the chapter to address the continuum
nature of translational research. Another relevant aspect of this dissertation is that case studies on different
translational research-related topics are used as proof-of-concept. These case studies serve to provide
guidance on the use of the frameworks and generate evidence for professional applications (Zucker, 2009).
Therefore, in this dissertation, these cases help to demonstrate the feasibility and principles of using an
expanded QI research toolkit to address complex issues of translational research.
Low High
Complexity
Op
erat
ion
alT
acti
cal
Str
ateg
ic
Dec
isio
n lev
el
Imp
act
Sh
ort
-ter
mL
ong-t
erm
Quality function
deploymentHouse of
quality
Root cause
analysis
Failure modes and
effects analysis
5 WHYs
Design of
experiments
Simulation
Mathematical
Programming
System Dynamics
Knowledge
Discovery
Queuing Theory
Cost effectiveness
analysis
Statistical
quality control
Value stream
mapping
To
p-d
ow
n i
nfl
uen
ce
Traditional (Basic) QI toolkit Expanded QI research toolkit
Page 23
6
This dissertation is organized into six chapters. In Chapter 1, an introduction to motivate the topics covered
and objectives of this dissertation are presented. Chapter 2 presents a literature review to establish the
foundations under which this dissertation is built upon. Chapters 3, 4, and 5 represent the body of this
dissertation. More specifically, Chapter 3 assesses and quantifies complexity in translational research,
Chapter 4 evaluates collaboration and multidisciplinarity in translational research, and Chapter 5 provides
guidelines for multiple-criteria resource allocation and cost-effectiveness of healthcare interventions.
Finally, in Chapter 6, a summary of the main contributions and future research lines is presented.
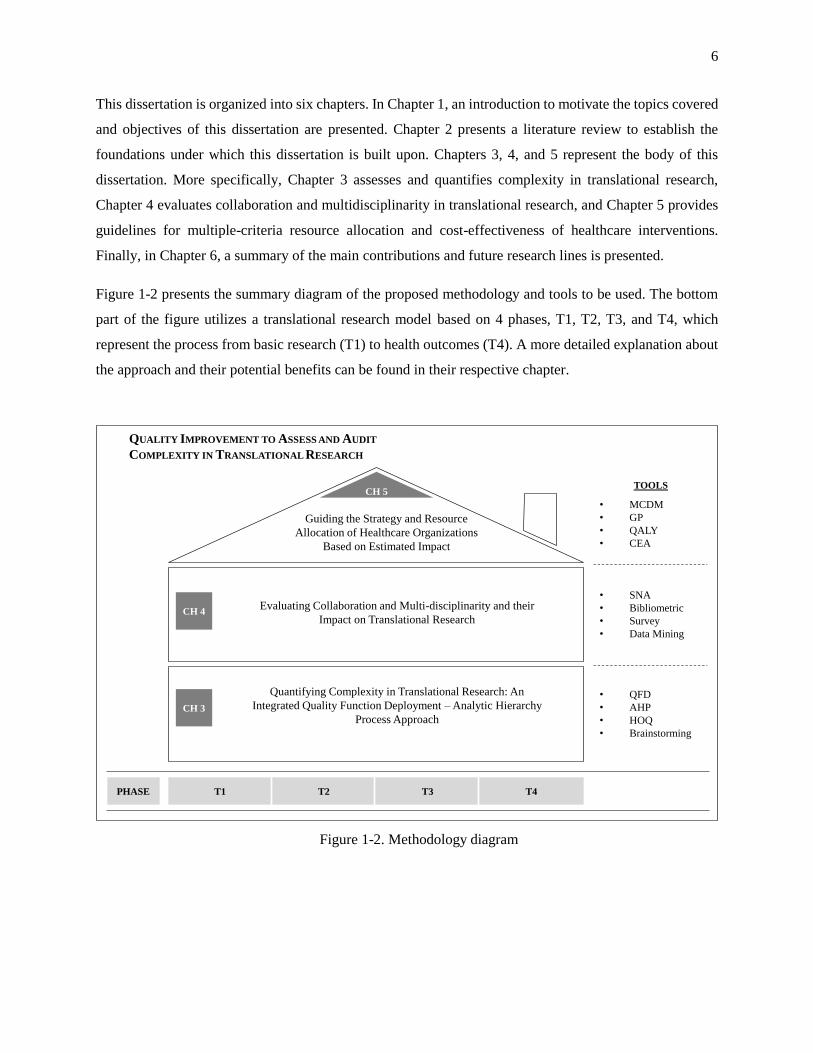
Figure 1-2 presents the summary diagram of the proposed methodology and tools to be used. The bottom
part of the figure utilizes a translational research model based on 4 phases, T1, T2, T3, and T4, which
represent the process from basic research (T1) to health outcomes (T4). A more detailed explanation about
the approach and their potential benefits can be found in their respective chapter.
Figure 1-2. Methodology diagram
T1PHASE T2 T3 T4
• MCDM
• GP
• QALY
• CEA
TOOLS
• SNA
• Bibliometric
• Survey
• Data Mining
• QFD
• AHP
• HOQ
• Brainstorming
QUALITY IMPROVEMENT TO ASSESS AND AUDIT
COMPLEXITY IN TRANSLATIONAL RESEARCH
CH 4
CH 3
CH 5
Quantifying Complexity in Translational Research: An
Integrated Quality Function Deployment – Analytic Hierarchy
Process Approach
Evaluating Collaboration and Multi-disciplinarity and their
Impact on Translational Research
Guiding the Strategy and Resource
Allocation of Healthcare Organizations
Based on Estimated Impact
Page 24
7
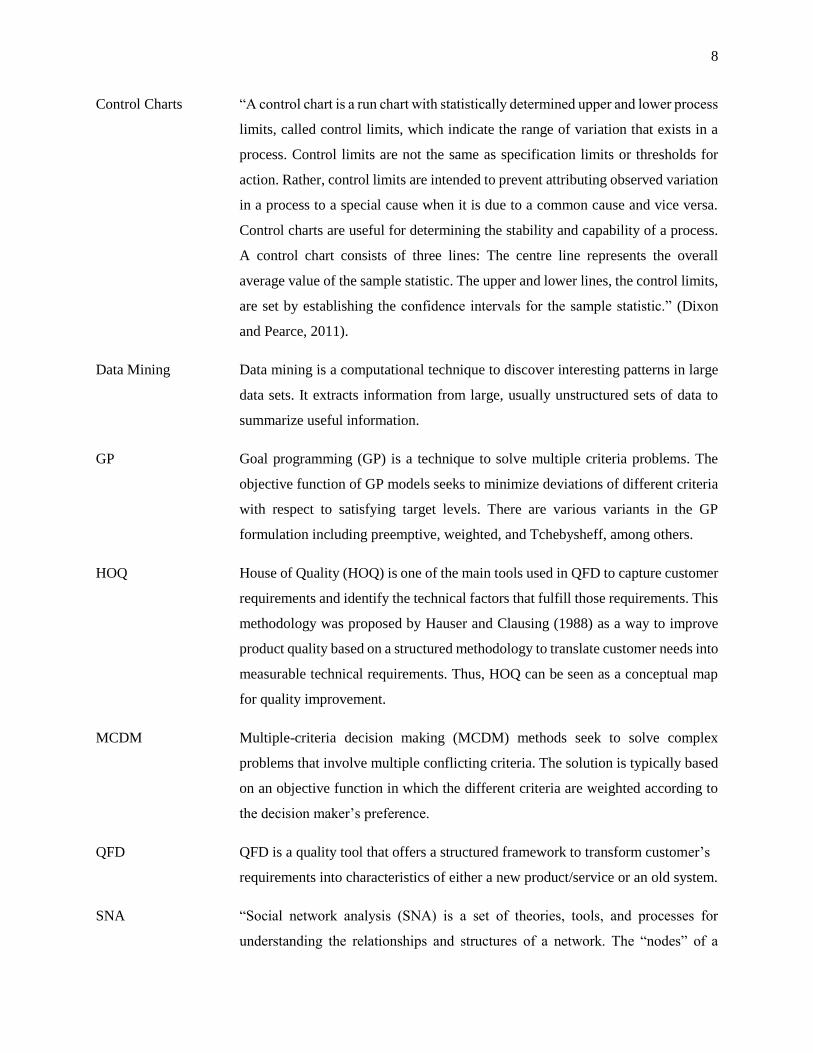
1.5.2 Tools description
As illustrated in Figure 1-2, various tools, most of them widely classified into the QI toolkit, will be used
in the proposed research. As previously mentioned, the basic QI toolkit will be expanded by introducing
other complementary systems engineering and social science tools to maximize the potential benefits of QI
research approaches. A general explanation of the tools used and others proposed for future research is
given below:
AHP “The Analytic Hierarchy Process is a decision making model that aids us in making
decisions in a complex world. It is a three part process which includes identifying
and organizing decision objectives, criteria, constraints and alternatives into a
hierarchy; evaluating pairwise comparisons between the relevant elements at each
level of the hierarchy; and the synthesis using the solution algorithm of the results
of the pairwise comparisons over all the levels. Further, the algorithm result gives
the relative importance of alternative courses of action.” (Saaty, 1977).
Benchmarking “Benchmarking is the process of measuring and improving products, services and
practices in comparison to the toughest competitors or those organizations that are
recognized as industry leaders. Benchmarking is about searching for industry best
practices that lead to superior performance and analyzing and learning from those
practices.” (Dixon and Pearce, 2011).
Bibliometrics Bibliometrics is a set of mathematical and statistical approaches to analyze large
amounts of academic literature. Usually, data related to citations and keywords are
used to identify interesting publication patterns.
Brainstorming “Brainstorming is a way of collecting the maximum number of ideas on a subject
from members of a team without considering the validity or practicality of the
ideas. The purpose of brainstorming is to generate a list of ideas when a team would
benefit from having as broad a range of ideas or alternatives as possible.” (Dixon
and Pearce, 2011).
CEA Cost-effectiveness analysis (CEA) is an economic technique that seeks to
understand and calculate outcomes with respect to costs. In practice, CEA is
widely used to compare alternatives based on their cost-effectiveness metrics. In
healthcare, the most common manner to express CEA is based on quality-adjusted
life years or other units of health gains per units of cost.
Page 25
8
Control Charts “A control chart is a run chart with statistically determined upper and lower process
limits, called control limits, which indicate the range of variation that exists in a
process. Control limits are not the same as specification limits or thresholds for
action. Rather, control limits are intended to prevent attributing observed variation
in a process to a special cause when it is due to a common cause and vice versa.
Control charts are useful for determining the stability and capability of a process.
A control chart consists of three lines: The centre line represents the overall
average value of the sample statistic. The upper and lower lines, the control limits,
are set by establishing the confidence intervals for the sample statistic.” (Dixon
and Pearce, 2011).
Data Mining Data mining is a computational technique to discover interesting patterns in large
data sets. It extracts information from large, usually unstructured sets of data to
summarize useful information.
GP Goal programming (GP) is a technique to solve multiple criteria problems. The
objective function of GP models seeks to minimize deviations of different criteria
with respect to satisfying target levels. There are various variants in the GP
formulation including preemptive, weighted, and Tchebysheff, among others.
HOQ House of Quality (HOQ) is one of the main tools used in QFD to capture customer
requirements and identify the technical factors that fulfill those requirements. This
methodology was proposed by Hauser and Clausing (1988) as a way to improve
product quality based on a structured methodology to translate customer needs into
measurable technical requirements. Thus, HOQ can be seen as a conceptual map
for quality improvement.
MCDM Multiple-criteria decision making (MCDM) methods seek to solve complex
problems that involve multiple conflicting criteria. The solution is typically based
on an objective function in which the different criteria are weighted according to
the decision maker’s preference.
QFD QFD is a quality tool that offers a structured framework to transform customer’s
requirements into characteristics of either a new product/service or an old system.
SNA “Social network analysis (SNA) is a set of theories, tools, and processes for
understanding the relationships and structures of a network. The “nodes” of a
Page 26
9
network are the people and the “links” are the relationships between people. Nodes
are also used to represent events, ideas, objects, or other things. SNA practitioners
collect network data, analyze the data (e.g., with special purpose SNA software),
and often produce maps or pictures that display the patterns of connections
between the nodes of the network.” (Hoppe and Reinelt, 2010).
Survey “A survey is the systematic collection of information by means of self-completed
questionnaires, interviews or observations from a large number of people, events,
records, literature or other data sources. The purpose of a survey usually is to
identify trends or patterns.” (Dixon and Pearce, 2011).
Page 27
10
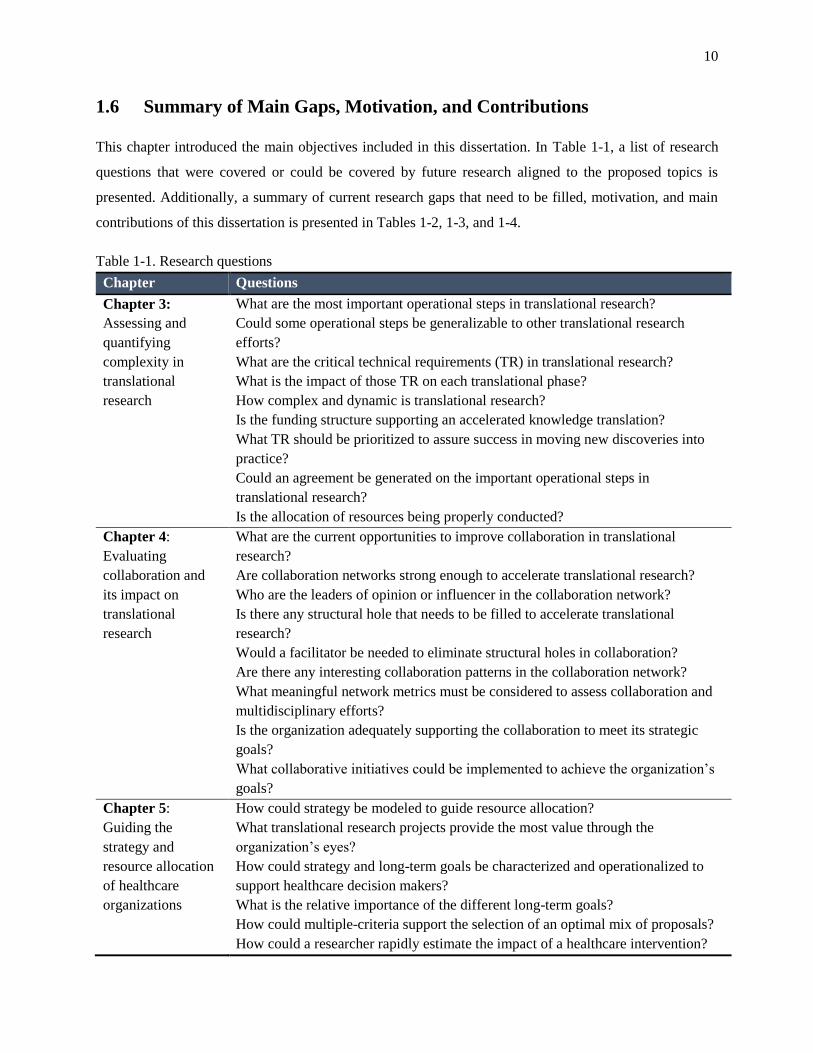
1.6 Summary of Main Gaps, Motivation, and Contributions
This chapter introduced the main objectives included in this dissertation. In Table 1-1, a list of research
questions that were covered or could be covered by future research aligned to the proposed topics is
presented. Additionally, a summary of current research gaps that need to be filled, motivation, and main
contributions of this dissertation is presented in Tables 1-2, 1-3, and 1-4.
Table 1-1. Research questions
Chapter Questions
Chapter 3:
Assessing and
quantifying
complexity in
translational
research
What are the most important operational steps in translational research?
Could some operational steps be generalizable to other translational research
efforts?
What are the critical technical requirements (TR) in translational research?
What is the impact of those TR on each translational phase?
How complex and dynamic is translational research?
Is the funding structure supporting an accelerated knowledge translation?
What TR should be prioritized to assure success in moving new discoveries into
practice?
Could an agreement be generated on the important operational steps in
translational research?
Is the allocation of resources being properly conducted?
Chapter 4:
Evaluating
collaboration and
its impact on
translational
research
What are the current opportunities to improve collaboration in translational
research?
Are collaboration networks strong enough to accelerate translational research?
Who are the leaders of opinion or influencer in the collaboration network?
Is there any structural hole that needs to be filled to accelerate translational
research?
Would a facilitator be needed to eliminate structural holes in collaboration?
Are there any interesting collaboration patterns in the collaboration network?
What meaningful network metrics must be considered to assess collaboration and
multidisciplinary efforts?
Is the organization adequately supporting the collaboration to meet its strategic
goals?
What collaborative initiatives could be implemented to achieve the organization’s
goals?
Chapter 5:
Guiding the
strategy and
resource allocation
of healthcare
organizations
How could strategy be modeled to guide resource allocation?
What translational research projects provide the most value through the
organization’s eyes?
How could strategy and long-term goals be characterized and operationalized to
support healthcare decision makers?
What is the relative importance of the different long-term goals?
How could multiple-criteria support the selection of an optimal mix of proposals?
How could a researcher rapidly estimate the impact of a healthcare intervention?
Page 28
11
Table 1-2. Gaps, approach, and main contributions of Chapter 3
Chapter 3 Gaps that need to be filled and Motivation
Disagreements about the meaning and scope of translational research have led to a lack of
robust frameworks to evaluate complexity of translation (Woolf, 2008). This has caused
inefficiencies in the allocation of resources having as a final consequence a huge gap between
evidence-based interventions and clinical practice (IOM, 2001, Green et al., 2009, Glasgow et
al., 2012). In response to this, major funding agencies have asked for frameworks in which
systems engineering tools and quality improvement efforts can provide data-driven solutions
by informing and supporting the decision making processes (Reid et al., 2005).
Approach and Main Contributions
The proposed QFD-AHP framework contributes to a better understanding of complexity in
translational research. The framework helps to identify and quantify the impact of various
operational steps and technical requirements on translating new discoveries into practice.
These results create evidence on a strategic level to inform key stakeholders about how efforts
and resources should be allocated to optimally move clinical innovations to impact people’s
health.
As claimed by Woolf (2008), discrepancies in the meaning of translational research have led
to an unclear definition of its scope. In response to this, the proposed methodology can quantify
complexity and generate evidence independently of the model or definition adopted by key
stakeholders in translational research. Therefore, the QFD-AHP framework is robust and
flexible enough to be applied consistently across various health disciplines.
A case study is shown to illustrate the usability of the framework. Future research work
includes a more detailed explanation of how this tool can be used to generate agreement on the
most important elements involved in translating knowledge, identification of benchmark
within and between health disciplines, and mechanisms to identify similar translational
research projects in which best practices can be formalized and standardized.
Page 29
12
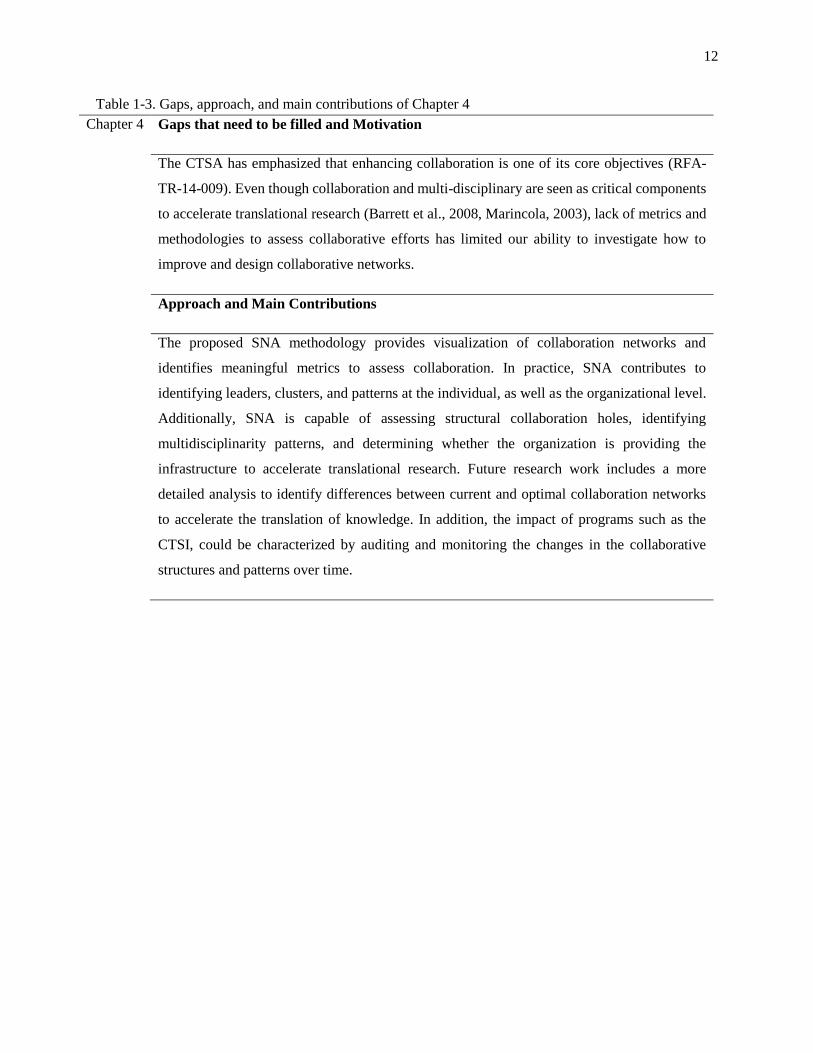
Table 1-3. Gaps, approach, and main contributions of Chapter 4
Chapter 4 Gaps that need to be filled and Motivation
The CTSA has emphasized that enhancing collaboration is one of its core objectives (RFA-
TR-14-009). Even though collaboration and multi-disciplinary are seen as critical components
to accelerate translational research (Barrett et al., 2008, Marincola, 2003), lack of metrics and
methodologies to assess collaborative efforts has limited our ability to investigate how to
improve and design collaborative networks.
Approach and Main Contributions
The proposed SNA methodology provides visualization of collaboration networks and
identifies meaningful metrics to assess collaboration. In practice, SNA contributes to
identifying leaders, clusters, and patterns at the individual, as well as the organizational level.
Additionally, SNA is capable of assessing structural collaboration holes, identifying
multidisciplinarity patterns, and determining whether the organization is providing the
infrastructure to accelerate translational research. Future research work includes a more
detailed analysis to identify differences between current and optimal collaboration networks
to accelerate the translation of knowledge. In addition, the impact of programs such as the
CTSI, could be characterized by auditing and monitoring the changes in the collaborative
structures and patterns over time.
Page 30
13
Table 1-4. Gaps, approach, and main contributions of Chapter 5
Chapter 5 Gaps that need to be filled and Motivation
The healthcare system in the U.S. has been progressively shifting to a paradigm in which data-
driven support is considered to provide guidance to understand value (Kaye et al., 2014).
However, there is still a gap in terms of understanding the drivers of value and how its multiple
factors can be balanced to provide strategic guidance for an effective healthcare service and
management. In this sense, data-driven decision making tools are need to aim for a better
distribution of resources based on anticipated impacts that different healthcare interventions
can have on the population (Patrick and Erickson, 1993).
Approach and Main Contributions
The use of GP based on strategic goals of a healthcare organization allowed for a more
informed and sustainable allocation of resources. In particular, the strategy of the CTSI can be
operationalized and formalized to guide the selection of a mix of proposals that provides the
best value for the organization based on multiple, typically conflicting, criteria. The GP
framework was found to provide good guidance to understanding and formalizing the goals of
the organization, identifying and formalizing the constraints, using historical data to provide
feedback, and selecting an optimal mix of proposals that fit into the strategy of the
organization. Another main contribution of this research is the provision of a rapid impact
estimation framework to guide the researcher through relevant questions to estimate the impact
of a healthcare intervention. Moreover, this multiple-criteria optimization model can be
complemented by incorporating cost-effectiveness analysis. The contributions presented in
this chapter are highly aligned with current needs expressed by the NCATS Advisory Council
Working Group and the recommendations of the External Board Advisory group to strengthen
the impact of the CTSI PSU hub.
Page 31
Chapter 2
LITERATURE REVIEW
This chapter explores literature that helps to build the knowledge in which this dissertation is based upon.
This literature review covers pertinent topics to expand and support a more research-oriented quality
improvement approach to be applied in healthcare fields. Hence, this review explores relevant technical
aspects as well as some areas of applications of current literature in quality improvement and systems
engineering linked to healthcare fields. The tools and methodologies to be reviewed provide a better
understanding of the different complexities in the translational research process, as well as some elements
of the healthcare system. Moreover, these tools can be used to align and design decisions that led to more
informed quality improvement efforts, and hence, improve the performance of healthcare systems.
This literature review chapter is structured according to the main body chapters mentioned in Chapter 1. In
section 2.1 an overview of systems engineering tools that can be applied in the healthcare domain is
presented. Section 2.2 reviews a set of tools to translate customers’ needs into technical requirements.
Section 2.3 provides a review of social network techniques. Finally, in sections 2.4, 2.5, and 2.6 topics
related to multiple-criteria optimization, proposal selection, and cost-effectiveness analysis are reviewed.
Page 32
15
2.1 Overview of Systems Engineering Tools in Healthcare
Systems engineering tools and techniques offer tremendous aid to address complex challenges in healthcare
and improve its performance (Grossman, 2008, Reid et al., 2005, McDonough et al., 2004). Healthcare
systems are by nature dynamic and complex. Therefore, the analysis of such systems requires techniques
that support the understanding of their elements and interactions from a systemic perspective. However,
although systems engineering tools have been successfully applied in various complex industries, their use
in healthcare has remained relatively low. In recognition of this fact, the IOM and NAE have encouraged
the use of system engineering tools as they promise to have a significant impact on quality and effectiveness
of healthcare systems (Reid et al., 2005). The systems engineering tools can be broadly classified into three
groups: 1) tools for system design; 2) tools for system analysis; and 3) tools for system control and
monitoring. The first group of tools aims to developing and designing new and better healthcare systems
and processes. The second group aims to analyzing existing healthcare systems based on a better
understanding of their complexity and performance. The third group of tools seeks to control the
performance of a healthcare system, and thus, recommend corrective or preventing actions to achieve the
targeted levels of performance.
2.1.1 Tools for system design
This set of tools is used to design new healthcare systems assuring that their characteristics meet the
requirements of different stakeholders involved in the supply chain of healthcare provision. This set
includes techniques such as Design for Six Sigma (DFSS) (Breyfogle III, 2003, Yang and El-Haik, 2003),
concurrent engineering (Prasad, 1996), Human Factors (HF) engineering (Sanders and McCormick, 1987,
Lehto and Landry, 2012), and Quality Improvement (QI) for failure analysis tools (Breyfogle III, 2003). In
DFSS, a system is designed based on the expected outcomes of a product or service. An important element
to consider when designing a system is to capture the voice of the customer or key stakeholders. This leads
to the identification of the main customer needs that guide the development of engineering systems
parameters to meet those requirements (Goffin et al., 2012). Similarly, concurrent engineering also seeks
to develop new systems that meet needs and customers’ aspirations. Some of the specific tools used for this
purpose are: quality function deployment (QFD) (Akao et al., 1990), house of quality (HOQ) (Hauser and
Clausing, 1988), design for X (Huang, 1996), and design of experiments (DOE) (Fisher, 1992, Fisher, 1935,
Kuehl and Kuehl, 2000), among others. Two of these techniques; QFD and HOQ, are described in more
details in section 2.2. Human factors engineering tools are also typically used for designing systems. One
of the main considerations of this field is to understand the interaction among different human elements in
a system to simplify its complexity. Some of the HF’s main areas of design include the understanding of
Page 33
16
physical, cognitive, and organizational ergonomics. Finally, QI methods are useful for characterizing a
system as a way to diminish or remove potential causes of error. In this sense, the use of tools such as the
failure mode and effects analysis (FMEA) (Stamatis, 2003) and root cause analysis (RCA) (Wilson, 1993)
can provide an adequate understanding of the system and avoidable defects to guide an enhanced design.
2.1.2 Tools for system analysis
These tools serve to identifying the key elements of a system, understanding their behavior, interactions,
and performance of the system. The main aim of these tools is to identify areas of opportunity for improving
a system. The range of tools that can be used for system analysis is broad. It includes mathematical and
statistical analysis, simulation, management, financial, and knowledge discovery tools. Mathematical and
statistical tools include linear programming, dynamic programming, queuing theory, and multiple-criteria
programming, among others (Ravindran, 2007). A deeper description of multiple-criteria programming is
given in section 2.4. Simulation techniques are typically used to analyze the behavior and performance of
a system and respond to various “what-if” questions or scenarios to improve the system’s performance. In
practice, discrete-event systems (Banks et al., 2000) and Montecarlo simulation techniques (Rubinstein and
Kroese, 2011) have been successfully used in healthcare fields. Systems management techniques are used
to analyze the systems across its different elements. Some of the tools composing this group are: supply
chain management, game theory, and systems dynamic models. Financial engineering tools provide a better
understanding of causal relationships among different system variables. These group includes tools such as
econometrics (Wooldridge, 2012), data-envelopment analysis (Cooper et al., 2007, Coelli et al., 2005), and
risk analysis (Kaplan and Garrick, 1981), among others. Finally, knowledge discovery tools aim to extract
useful knowledge from large databases. Some of the techniques included in this group are: data mining
(Tan et al., 2006), principal component analysis (Jolliffe, 2002), and social network analysis (Borgatti et
al., 2009, Scott, 2012). This last tool is described into more detail in section 2.3 and applied in Chapter 4.
2.1.3 Tools for system monitoring and control
This group of systems engineering tools is used to monitor and control the processes and performance of a
system. The main aim of these tools is to maintain the system performance operating under specified
parameters which are considered to achieve expectations. The most relevant tools of this group are
statistical process control techniques and other QI techniques to complement the monitoring and control of
healthcare processes (Breyfogle III, 2003).
Page 34
17
2.2 Tools to Capture Customer Needs and Technical Requirements
2.2.1 Quality function deployment
QFD is a quality tool that offers a structured framework to transform customer requirements into
characteristics of either a new product/service or an existing system. This methodology was first proposed
in Japan during the late 60’s and formalized in 1972 (Akao, 1972). The main aim of this tool is to translate
customer desires into product design or specific characteristics. Understanding these elements can reduce
the product development time by half and start-up engineering costs by about 30% (Hauser and Clausing,
1988). Although this technique was initially developed to support product design, it has been also
implemented to design new services (Jeong and Oh, 1998, Trappey et al., 1996, Ermer and Kniper, 1998,
Jacques et al., 2009). In practice, QFD is typically supported by a technique called the House of Quality
(Govers, 1996). More details about the HOQ are given in section 2.2.2.
QFD techniques have been used as decision support tools in various industries (Zare Mehrjerdi, 2010, Chan
and Wu, 2002). Main functional fields of QFD include product development, quality management,
customer needs analysis, design, planning, decision-making engineering, management, teamwork, timing,
and costing. Hence, QFD is considered to be a very versatile and flexible tool for a wide number of
applications (Chan and Wu, 2002). Although the applications of QFD in healthcare have remained low,
they are expected to increase (Gremyr and Raharjo, 2013). In healthcare, QFD has been applied to improve
rehabilitation services (Einspruch, 1996), improve quality of services in healthcare systems (Radharamanan
and Godoy, 1996), transferring residents’ expectations into improvements in a residential nursing home
(Chang, 2006), radiation safety management (Moores, 2006), and incorporating customer requirement to
redesign and renewal of healthcare organizations (Dijkstra and van der Bij, 2002), among few other
applications. Chaplin and Akao (2003) propose a comprehensive methodology for using QFD within the
healthcare domain. Their methodology is based on five steps; the voice of the customer, the voice of the
organization, the voice of the process, the voice of the staff, and actions of staff.
2.2.2 House of quality
The HOQ is one of the main tools used in QFD to capture customer requirements and identify the technical
factors that fulfill those requirements. This methodology was proposed by Hauser and Clausing (1988) as
a way to improve product quality based on a structured methodology to translate customer needs into
measurable technical requirements. Thus, HOQ can be seen as a conceptual map for quality improvement.
Usually, seven elements are needed to build a HOQ framework; Customer Requirements (What), Technical
Requirements (How), Customer Requirements Weights (relative importance of “What”), Relationship
Page 35
18
matrix (relations between “What” and “How”), Correlation matrix (inner dependency among “How”),
Impact of Technical Requirements, and Competitive Benchmarking. Figure 2-1 shows a traditional diagram
for the HOQ methodology.
Figure 2-1. House of quality diagram
1. Customer Requirements Matrix: This section contains a list of customer requirements (VOC), also
called customer attributes (CAs).
2. Weights of Customer Requirements: This section contains the relative importance of the customer
requirements previously identified. This is based on the premise that through the customers’ eyes,
some attributes are more important than others, and therefore, they should be somehow prioritized.
3. Technical Requirements Matrix: Contains a list of technical requirements or drivers to fulfill the
customer requirements. The technical requirements are also known as engineering characteristics
(ECs).
4. Correlation Matrix: It establishes the relationship intensity among the technical requirements.
5. Relationship Matrix: It is the body of the HOQ. Its function is to establish connection between
customer’s needs and technical requirements designed to improve the product or system.
6. Impact of Technical Requirements Matrix: It determines the absolute, relative and order priority for
each technical requirement. This section serves as a roadmap for engineers or designers to prioritize
technical requirements according to their importance in addressing the customer needs.
Relationship MatrixCompetitive
Benchmarking
Customer
Requirements
(What)
Impact of Technical
Requirements
Technical
Requirements
Correl. Matrix
CR
W
eig
hts
1 2
3
4
5
6
7
Page 36
19
7. Competitive Benchmarking: Its purpose is to compare how well customer needs are met compared
to the competitors. This section provides a self-evaluation that could be used to generate
competitive advantages and a better understanding of the competition.
2.2.3 Analytic hierarchy process
AHP was first proposed by Saaty (1980) as a mechanism to determine the importance of different criterion
and be able to compare alternatives based on multiple objectives. AHP is a powerful decision making tool
capable to deal with complex, non-linear and multiple-criteria problems, such as those presented in
healthcare systems. The range of applications of AHP is wide; it includes but is not limited to resource
allocation, evaluating alternatives, and conflict resolution. A main advantage of this tool is that it is suitable
for both tangible and intangible factors. AHP allows for quantifying complex qualitative factors in a
structured way. Another clear advantage of AHP is its flexibility since it has a tolerance for judgment
inconsistency.
An extensive survey of the areas of application of AHP is presented in Vaidya and Kumar (2006). In the
article, eight main categories in the use of AHP were identified; selection, evaluation, benefit-cost analysis,
allocations, planning and development, priority and ranking, decision making, and forecasting. Areas of
application of AHP are wide; they include but are not limited to business, logistics, manufacturing,
education, military and also healthcare.
2.2.3.1 AHP procedure for obtaining weights
One of the main uses of AHP is to obtain weights that can serve to rank different criteria according to their
relative importance. To obtain these weights, a pairwise comparison between all the criteria is conducted.
From this step, a pairwise comparison matrix A is developed by determining the relative importance of one
criteria over the other. Typically, a 9-point scale is used to complete the matrix (Saaty, 1980). An
explanation of this scale and its appropriateness for AHP is given by Saaty (2001). A description of the
intensities of importance using a 9-point scale is presented in Table 2-1.
The pairwise comparison matrix A is constructed as follows:
𝐴 =
[
1 𝑎1,2 𝑎1,3
𝑎2,1 1 𝑎2,3
𝑎3,1 𝑎3,2 1
… … 𝑎1,𝑀
… … 𝑎2,𝑀
… … …… … …… … …
𝑎𝑀,1 𝑎𝑀,2 …
. . . … …… . . . …… … 1 ]
Page 37
20
Where a1,2 represents how much more important is criterion 1 with respect to criterion 2. It must be noted
that a2,1 is the reciprocal of a1,2. It is also intuitive the fact that the main diagonal is populated by 1s since a
criterion compared to itself is equally important. The pairwise comparison matrix is an 𝑀x𝑀 matrix. The
number of pairwise comparison questions needed to generate the matrix is 𝑀(𝑀 − 1)/2.
Table 2-1. AHP scale definition
Intensity of
Importance Definition Explanation
1 Equal importance Two activities contribute equally to the objective
3 Moderate importance According to experience a criterion is slightly more
important than the other
5 Strong importance According to experience a criterion is strongly more
important than the other
7 Very strong or
demonstrated importance
According to experience a criterion is favored very
strongly over the other
9 Extreme importance Evidence shows that a criterion is absolutely more
important than the other
2,4,6,8 Intermediate values
After building the pairwise comparison matrix, a normalization procedure is needed to obtain the relative
weights for each criterion. A normalized pairwise comparison matrix N is constructed by dividing each cell
value by the sum of its corresponding column represented by Sj. Finally, the weight or relative importance
of the criterion is obtained by averaging the cell values across the correspondent raw. The formulas and
matrix structure used are as follows:
𝑆𝑗 = 1 + ∑ 𝑎𝑞,𝑗 , 𝑗 = 1,… ,𝑀
𝑀
𝑞=1,𝑞≠𝑗
Eq. 21
𝑁 =
[ 𝑛1,1 𝑛1,2 𝑛1,3
𝑛2,1 𝑛2,2 𝑎2,3
𝑛3,1 𝑛3,2 𝑛3,2
… … 𝑛1,𝑀
… … 𝑛2,𝑀
… … …… … …… … …
𝑛𝑀,1 𝑛𝑀,2 …
… … …… … …… … 𝑛𝑀,𝑀
]
Page 38
21
𝑁 =
[
1/𝑆1 𝑎1,2/𝑆2 𝑎1,3/𝑆3
𝑎2,1/𝑆1 1/𝑆2 𝑎2,3/𝑆3
𝑎3,1/𝑆1 𝑎3,2/𝑆2 1/𝑆3
… … 𝑎1,𝑀/𝑆𝑀
… … 𝑎2,𝑀/𝑆𝑀
… … …… … …… … …
𝑎𝑀,1/𝑆1 𝑎𝑀,2/𝑆2 …
. . . … …… . . . …… … 1/𝑆𝑀 ]
Thus, the weights for each criteria are given by the following column vector w:
𝑤 =
[ 𝑊1
𝑊2
⋮⋮
𝑊𝑀
]
=1
𝑀
[ ∑ 𝑛1,𝑗
𝑀
𝑗=1
∑ 𝑛2,𝑗
𝑀
𝑗=1
⋮⋮
∑ 𝑛𝑀,𝑗
𝑀
𝑗=1
]
Since the values were normalized, the weights will sum to 1. These values could be used to prioritize criteria
and conduct a comparison among different alternatives based on their scores for each criterion.
In order to assure the consistency of the responses, a consistency procedure should be used to minimize
errors and make valid inferences at the end of the procedure. For these purposes, a consistency index (CI)
and consistency ratio (CR) can be used and calculated as follows:
𝐶𝐼 =𝜆𝑚𝑎𝑥 − 𝑛
𝑛 − 1 Eq. 22
Where 𝜆𝑚𝑎𝑥 is the average of the maximum eigenvalues and can be obtained by solving:
𝐴𝑤 = 𝜆𝑚𝑎𝑥𝑤 Eq. 23
Then, the consistency index can be calculated as follows:
𝐶𝑅 =𝐶𝐼
𝑅𝐼 Eq. 24
Where RI is the random consistency index depending on n, and can be obtained from Table 2-2.
Table 2-2. Random consistency index
n 1 2 3 4 5 6 7 8 9
RI 0 0 0.58 0.9 1.12 1.24 1.32 1.41 1.45
Page 39
22
Usually, a threshold of 0.1 is used to determine if the consistency is acceptable. In case of achieving a
consistency ratio greater than 0.1, the evaluator is asked to revise his/her pairwise judgments to reduce
inconsistency and be able to make credible inferences from this technique (Saaty, 1977).
2.2.3.2 AHP in healthcare applications
Liberatore and Nydick (2008) reviewed AHP use in medical and healthcare decision making. According to
their article, AHP appears to be a promising support tool that can be used in almost every healthcare
process/area. Evaluation and selection of the best treatment or therapies for a certain population can be
determined as well as healthcare technologies and policies. From the 50 articles reviewed by Liberatore
and Nydick (2008), 29 of them were classified into management and administration, while 21 of them were
categorized as patient care applications.
Lai (2010) proposed an AHP methodology to evaluate the sustainability of knowledge-based communities
in the healthcare industry. Pecchia et al. (2011) used AHP to assess the relative importance of risk factors
for preventing falls in the elderly population. They identified and prioritized 35 risk factors organized into
general and clinical categories. Interesting differences in opinion from the various physicians involved in
the process were identified. Generating agreement was found to be critical to facilitate the implementation
and diffusion of evidence-based programs to allocate the resources in a wise manner. A novel application
of Monte Carlo-AHP to rank quality attributes in dental services was proposed by Hsu and Pan (2009). The
article presents a two phases methodology in which the authors examine the structure of dental services
using AHP. Then, they use Monte Carlo simulation to determine the priorities of the attributes identified.
Health technology assessment using AHP was studied by Danner et al. (2011), in which they include both,
patients and healthcare professionals to elicit patient preferences.
2.2.3.3 AHP and translational research
Although the popularity in the use of AHP in the health domains has been growing consistently, few
researchers have explicitly investigated the use of AHP to help assess and quantify translational research.
Cheever et al. (2009) presented one of the first articles published explaining that the use of AHP can be
very helpful to address the lack of speed in the translational research process. They used AHP for a pilot
project to prioritize cancer antigens. By the time of the publication, no cancer vaccine was yet approved.
Their methodology proposed four modules: 1) Identification of participants, criteria to be evaluated and
alternatives; 2) Essential criteria identification, categorization and comparison of these criteria. This phase
also included the weight of the criteria; 3) Evaluation of alternatives; and 4) Report and analysis of
information to help the decision making process. This study was able to rank 75 selected antigens. Even
Page 40
23
though the AHP study conducted did not make a decision to launch a new vaccine, it provided a structured
way to evaluate different alternatives. To date, this article has been cited more than 400 times capturing the
attention of various researchers. It is expected that the number of related work will increase over the
following years.
Fernandez et al. (2010) agree with Cheever et al. (2009) that AHP is a very suitable tool to be used in
translational research in various settings including cancer clinical decisions. On the other hand Lang et al.
(2009) believe that AHP is not well described for translational research since it has many sources of bias.
They criticized the use of AHP and stated that besides its popularity in other areas, many potential
drawbacks can be found once it is used to prioritize cancer antigens. They argue that lack of transparency
in the AHP approach could lead to inaccurate results in the aim of prioritizing the antigens. However, by
properly selecting a group of evaluators, “lack of transparency” is reduced as well as potential bias.
Therefore, accurate results can be obtained to make valid inferences from the AHP methodology and its
application in translational research.
2.2.4 Integration of QFD and AHP
Many successful attempts of integrating QFD and AHP can be found in the literature (Kwong and Bai,
2002, Kwong and Bai, 2003, Karsak et al., 2003). These tools have been demonstrated to complement each
other, and therefore, significant benefits can be extracted by combining both methods. Ho (2008) conducted
a literature review for the integrated analytic hierarchy process and its applications. According to his article,
the integration QFD-AHP is one of the most suitable approaches for various areas since they complement
each other. AHP is able to overcome inconsistency to evaluate the relative importance for the attributes
described by the customers. Then, those weights can be used by QFD tools.
A handful of studies in healthcare have attempted to use the QFD-AHP integration with promising results.
Chang (2006) applied these concepts to enhance nursing home service quality. QFD was used to capture
resident expectations and transfer them to improvements. A Fuzzy AHP helped to prioritize and calculate
quality based on the client requirements. Although QFD-AHP has been found to be extremely helpful in
many areas, there is still a lack of investigation in its use in healthcare, especially in translational research.
Our main hypothesis is that the use of an integrated QFD-AHP could help to better understand complexity
and the factors that impact the acceleration of discovery into health outcomes. Thus, it can provide a robust
framework to understand and quantify complexity in translational research, which could be later used as
evidence for strategic decision making tool. In Chapter 3, a QFD-AHP approach is presented and applied
to translational research.
Page 41
24
2.3 Social Network Analysis
Network-based analysis is a rapidly growing field as it is considered to be effective for extracting useful
information from large data and various applications. In addition, trends of use of network-based techniques
have been supported and facilitated by the development of automated computing analysis (Gündüz-
Öğüdücü and Etaner-Uyar, 2014, Scott, 2012). In this regard, Social Network Analysis (SNA) has been
widely used to understand complex interconnections within a network. A social network can be defined as
a set of entities or nodes connected by their relations (Scott and Carrington, 2011). In order to study the
different patterns and communalities among different groups of nodes or entities, SNA – a branch of graph
theory – is a widely used approach as it provides both structural and mathematical analysis (Gündüz-
Öğüdücü and Etaner-Uyar, 2014). Traditionally, SNA has been used as a visual technique to develop
network graphs, where nodes represent the entities of a network (individuals or groups) and the edges
represent the relationship between two entities. Furthermore, SNA provides metrics that can be used to
assess parts of a network or the network as a whole. Unlike other traditional evaluation methods in which
simple averaging and outcomes are compared, SNA provides a rich structure to evaluate the
interrelationship among individuals or institutions.
2.3.1 Network representation
The mathematical representation of a network, G, can be written as follows:
G = (V, E)
Where V is a set of entities or nodes, and E is a set of edges (pair of nodes).
A graph can be either directed or undirected depending on the characteristics of connection between the
nodes. A graph is said to be directed if the relationship among nodes has some sense of directionality. For
instance, leadership networks are usually treated as directed as some nodes influence other nodes in the
network but in some cases the opposite direction is inexistent. In contrast, undirected networks only denote
relationship but no directionality. A graphical representation of graph and its directionality is shown in
Figure 2-2. The sets of the directed graph can be written as V={1,2,3,4,5,6} and E={(1,2) ,(1,3), (2,1), (2,4),
(3,2), (3,4),(4,3), (4,5), (5,3), (5,6), (6,5)}. The undirected graph can be written as V={1,2,3,4,5,6} and
E={(1,2) ,(1,3), (2,3), (2,4), (3,4), (3,5), (4,5), (5,6)}.
Page 42
25
Figure 2-2. Directed and undirected graphs
Another useful representation of these set of nodes and edges is called adjacency matrix. This matrix is a
square matrix of size nxn in which n represents the number of nodes in the network. The cells of the matrix
represent the presence of an edge between two nodes. For instance, a non-zero entry at position (i,j)
represents that there is an edge between nodes i and j. Additionally, this entry can represent the strength of
the corresponding edge. For undirected graphs, the adjacency matrix is symmetric.
2.3.2 SNA metrics
The study of SNA involves the graphical visualization of networks and the measurement of relevant metrics
that help understanding and characterizing the networks’ structure. These metrics seek to provide useful
information to understand the characteristics of the nodes, cluster, and network as a whole (Borgatti et al.,
2009, Hansen et al., 2010, Scott and Carrington, 2011). Network or cluster metrics are those which are
calculated for the whole network or subgroups of it. This group includes metrics such as density and
geodesic distance. On the other hand, vertex-related metrics are those which are calculated for each node
of a network. This group includes centrality metrics such as degree centrality, betweenness centrality, and
eigenvector centrality.
Density
One of the most used graph metrics is the density of the network. The density represents the number of
links among all the nodes as a proportion of all the potential links, indicating the connectedness of the entire
network. Density values range from 0 to 1, being 1 the value representing a completely connected network
(i.e. every entity is directly connected to each network member). This metric can be calculated for the
network as a whole or for different groups or clusters within the network. The maximum number of edges
in an undirected semantic network is given by |V|*(|V|-1)/2. The density of the network can be defined as:
Page 43
26
𝐷𝑒𝑛𝑠𝑖𝑡𝑦 =2|𝐸|
|𝑉|(|𝑉| − 1) Eq. 25
Where |V| is the size of the network, represented by the number of nodes in the network, and |E| is the
number of edges in the network.
In a social network context, including healthcare organizations, denser networks are better for dissemination
of knowledge. However, from a collaborative perspective, denser networks can also indicate lack of
specialization, and potentially, decrease the rate of innovation.
Geodesic distance
The geodesic distance is defined as the shortest path or route between two nodes. In non-weighted edges
networks, the geodesic distance between two nodes is the minimum number of edges connecting them. This
metric indicates how reachable a particular node is for the other nodes. Typically, this metric is used to
evaluate the cohesion of a network. In order to characterize networks or clusters, the maximum and average
geodesic distances are used. In a social network context, the geodesic distance indicates the level of
reachability between the individuals composing the network.
Degree centrality
While the density and geodesic distance metrics are related to the whole network or clusters, the degree
centrality is a vertex-related network metric. In an undirected network, it measures the number of direct
connections of a particular node. Consequently, the degree centrality can be used as an indicator of the
importance of a node. In directed graphs, this metric is split into two; indegree and outdegree centrality
which represent the number of edges towards or from a node respectively. The degree centrality of a node
v is usually written as Cd(v) = deg(v). In a social network context, nodes with a relatively high degree
centrality are considered to be central for the network as they have a higher probability or receiving and
transmitting the information that flows within the network (Abraham et al., 2009). Hence, the centrality is
used as the main indicator to identify leaders. Therefore, it can be seen as a metric of influence (Freeman,
1979). A mathematical theoretical perspective on centrality metrics can be found in Borgatti and Everett
(2006).
Page 44
27
Betweenness centrality
Betweenness centrality is another widely used vertex-related metric in SNA. This metric indicates the
relative level of centrality of a node with respect to other groups in the network. Technically, it quantifies
the number of times that a node serves as a bridge along the shortest path between other pairs of nodes.
Mathematically, the betweenness centrality of a node v can be written as:
𝐶𝑏(𝑣) = ∑𝜎𝑠𝑡(𝑣)
𝜎𝑠𝑡𝑠≠𝑣≠𝑡∈𝑉
Eq. 26
where σst is the total number of shortest paths between node s and node t, and σst(v) is the number of those
shortest paths that pass through node v.
In a social network context, individuals with high betweenness centrality are known as “bridgers” since
they support connectivity among different clusters. Bridgers play an important role for emerging healthcare
fields that require collaborative efforts from multiple disciplines. In other words, bridgers serve as
facilitators for multi-disciplines to advance at a faster rate.
Eigenvector centrality
Another relevant centrality measure of a node is the eigenvector centrality (Estrada and Rodriguez-
Velazquez, 2005). This metric is typically used to quantify the influence of a given node in a network.
Those nodes with a high eigenvector centrality are well connected to other nodes which are also well
connected. Hence, individuals with relatively high eigenvector centrality are also perceived as influencers
and are considered to have a higher degree of popularity within the network (Abraham et al., 2009).
2.3.3 Applications of SNA
The range of applications of SNA is wide. It has been applied to social sciences (Ma et al., 2014, Hatala,
2006), communication (Luo and Zhong, 2015, Liao et al., 2014, Hancock and Raeside, 2010), management
(Cross et al., 2002, ZHAO et al., 2014, Aubke et al., 2014), politics (Vasquez et al., 2011, Leifeld, 2013,
Matti and Sandström, 2013, Crooks et al., 2014, Khan et al., 2014), defense and crime (Duijn et al., 2014,
Nash et al., 2013, Sparrow, 1991, Ting and Tsang, 2014, Lu et al., 2010, Malm and Bichler, 2011), and
healthcare, among others.
Page 45
28
2.3.4 SNA in healthcare
Applications of SNA in health related areas have been increasing during the past years. SNA has been used
in a wide range of health applications including collaboration, behavior change, and management, among
others. Collaboration applications include the assessment of physician collaboration (Uddin et al., 2013),
assessment of multidisciplinary health sciences collaboration (Weng et al., 2008), and evaluation of medical
culture (Lurie et al., 2009). Behavior change and disease spread applications of SNA include the assessment
of the spread of obesity in large social networks (Christakis and Fowler, 2007), the visualization of the
network phenomena in smoking cessation (Christakis and Fowler, 2008), the interaction patterns that
predict weight loss (Chomutare et al., 2014), and the description of the outbreak dynamics of tuberculosis
(Gardy et al., 2011). SNA has also been used to support management decision making. Other applications
include the design of dissemination strategies and innovations (West et al., 1999), support the introduction
of new vaccines (Wonodi et al., 2012), validation of infrastructure for inter-institutional translational
research (Hunt et al., 2012), evaluation of political feasibility of healthcare reforms (Wang, 2012), and
identification of next generation of trainers in nurse development programs (Benton and Fernández, 2014).
A review of other applications of SNA in healthcare can be found in Chambers et al. (2012).
Recently, SNA has gained major attention in translational research fields. The CTSA has called for a
stronger multidisciplinary collaboration across the multiple CTSA hubs. In response, some authors have
argued that using SNA could bring many advantages for analyzing collaboration patterns ((Long et al.,
2014, Hunt et al., 2012, FalkKrzesinski et al., 2010, Bian et al., 2014). Therefore, SNA is seen as a
promising technique for understanding mechanisms in which research collaboration can be enhanced to
develop a stronger multidisciplinary network (Bian et al., 2014).
2.3.5 SNA to assess collaboration networks
From a managerial and organizational perspective, SNA has been extensively validated as a tool to
investigate collaboration patterns to inform management about current opportunities in organizational
networks (Tichy et al., 1979, Brass, 1995, Borgatti et al., 2009). In this sense, understating the social capital
of an organization becomes relevant for management (Tsai and Ghoshal, 1998, Borgatti and Foster, 2003).
It has been argued that social capital facilitates the creation of value at both the dyadic and business unit
levels (Tsai and Ghoshal, 1998). Practical applications such as identifying flows of information, generating
teams, and understanding the impact of informal networks are just some examples of how SNA can be
implemented at the organizational level to assess collaboration. This last application has been found to be
relevant for supporting the strategy of organizations. Studies have demonstrated the importance of informal
Page 46
29
networks and their impact on employee job satisfaction and performance (Cross et al., 2002). Hence, this
provides an opportunity for management to improve organizational efficiency through the use of
collaborative networks. Benton and Fernández (2014) use SNA to identify the influencers or leader of a
nurse network as a way to identify future generations of trainers.
Due to the importance of collaboration in research fields, SNA techniques have been used for analyzing
research collaboration networks (Li et al., 2013, Wang et al., 2012, Bornmann and Leydesdorff, 2015, Bian
et al., 2014, Zare-Farashbandi et al., 2014, Zhang et al., 2013, Abbasi et al., 2012, Zhai et al., 2014).
According to a recent study, more than half of the publications in various areas are co-authored (Bozeman
et al., 2013). The majority of the studies of research collaboration relies on bibliometric data. According to
Bozeman et al. (2013), this type of data has the advantages of being verifiable, stable, and easy to obtain.
In Chapter 4, a SNA bibliometric-based approach is used to evaluate collaboration networks in obesity
research. The study includes insights about the identification of leader or influencer, bridgers of knowledge,
clusters of research, and different multidisciplinary collaborative patterns.
2.4 Multiple-Criteria Optimization
In real life applications, decision makers are often exposed to problems in which multiple criteria must be
considered to select the best course of action among different alternatives. These decisions often exhibit
three main characteristics: the presence of multiple criteria, criteria that are conflicting, and the need for
making compromises or trade-offs among those criteria to achieve a balanced decision (Ravindran, 2007).
These problems are often classified into the field of multiple criteria decision making (MCDM) problem.
Usually, the main aim of MCDM techniques is to identify the best alternative given various conflicting
criteria.
In healthcare, for example, various criteria are considered when allocating resources, prioritizing patients,
scheduling patients, etc. (Hans et al., 2012). Unfortunately, given the complexity of these settings, usually
conflicting criteria are present and compromises among them are required. Therefore, in practical situations,
methods should be used to address those criteria based on their importance to reach a given objective.
A generic multiple criteria mathematical problem can be written as:
𝑀𝑖𝑛 𝑍 = (𝑓1(𝑥), 𝑓2(𝑥),… , 𝑓𝑘(𝑥))
Subject to: 𝑥 ∈ 𝐹
Page 47
30
Where x is a set of m decision variables over which the decision maker has control. The set F is a feasible
subset of the solution space X. Therefore, F is defined by a set of constraints as function of x.
One of the most used techniques to solve these types of problems is Goal Programming (GP). In GP, all the
objectives are assigned target levels for desired achievement and also a relative priority to meet those
targets. In other words, GP treats those targets as aspirational levels and not as absolute constraints as in
other mathematical approaches.
2.4.1 Goal programming
Goal programming has been extensively used to help multiple criteria decision making (MCDC) since its
introduction in mid-1950s (Charnes et al., 1955). A more formal structure and theory was given by Charnes
and Cooper (1961). Further development of this technique was presented by Ijiri (1965), Lee (1972), and
Ignizio (1976). Since mid-1970 and due to its wide range of applications, GP became one of the most
popular techniques in MCDM field. There are four main philosophies under which GP is framed:
satisficing, optimizing, ordering or ranking, and balancing (Jones and Tamiz, 2010). Satisficing refers to
the situation in which the decision maker is satisfied with a level of aspiration that is typically less than
optimal. This is clearly incorporated into GP models as they contain a set of goals to be reached. Optimizing
refers to selecting the best option or alternative given a set of possible decisions. Ordering and ranking is
present in all GP models as decision makers may have some preferences to achieve certain goals. Finally,
balancing seeks to find a trade-off between the achievements of the goals.
In GP, the main objective is to minimize undesired deviations from pre-specified targets. For example, a
goal that is not fully achieved has an under-achievement, which is associated to a negative deviation. On
the other hand, some goals can be over-achieved, then, a positive deviation is associated to that goal.
In goal programming there are two types of constraints; systems constraints and goal constraints. Systems
constraints are also called hard constraints as they cannot be violated. In other words, these set of constraints
are more restrictive and have to be satisfied before the goal constraints. Goal constraints are called soft
constraints. There are different variants of GP formulations to minimize unwanted deviations; weighted,
preemptive, and Tchebycheff, among others. The selection of a specific formulation depends on the
problem that is being considered.
2.4.1.1 Weighted goal programming
In the weighted GP, also called non-preemptive GP, it is assumed that the decision maker believes that
goals are not equally important. Hence, they are assigned different weights. In such cases, the objective of
Page 48
31
the model seeks to minimize the total weighted deviations from the targets. In general, a GP model can be
written as follows:
𝑀𝑖𝑛𝑖𝑚𝑖𝑧𝑒 𝑍 = ∑(𝑤𝑖+𝑑𝑖
+ + 𝑤𝑖−𝑑𝑖
−) Eq. 27
𝑘
𝑖=1
𝑆𝑢𝑏𝑗𝑒𝑐𝑡 𝑡𝑜 𝑓𝑖(𝑥) + 𝑑𝑖− − 𝑑𝑖
+ = 𝑏𝑖 for 𝑖 = 1,… , 𝑘
𝑔𝑗(𝑥) ≤ 0 for 𝑗 = 1,… ,𝑚
𝑥𝑗, 𝑑𝑖−, 𝑑𝑖
+ ≥ 0 for all 𝑖 and 𝑗
This model seeks to minimize the weighted sum of deviational variables in which the variables
𝑑𝑖− and 𝑑𝑖
+ represent the under achievement and over achievement of the i-th goal with respect to its target
bi. In this approach, the decision maker is asked to specify an acceptable level of achievement (bi) for each
criterion fi and a positive weight wi representing the relative importance of the criterion associated with the
deviation between fi and bi. This approach for GP model is also referred as pre-specified or cardinal. A
different approach is required when absolute priorities exists. In such cases, preemptive GP is used.
2.4.1.2 Preemptive goal programming
Given the fact that in practical applications it is sometimes difficult to assign relative priorities for meeting
different criteria, ordinal order or absolute priorities can be used instead. In such a case, the different criteria
and their goals are being met in a pre-specified order according to their preemptive priority. In other words,
preemptive goal programming is a sequential optimization process in which low priority goals are
considered only after high priority goals are achieved. The preemptive GP can be formulated as follows:
𝑀𝑖𝑛𝑖𝑚𝑖𝑧𝑒 𝑍 = ∑𝑃𝑝
𝑝
∑(𝑤𝑖𝑝+𝑑𝑖
+ + 𝑤𝑖𝑝−𝑑𝑖
−) Eq. 28
𝑖
𝑆𝑢𝑏𝑗𝑒𝑐𝑡 𝑡𝑜 𝑓𝑖(𝑥) + 𝑑𝑖− − 𝑑𝑖
+ = 𝑏𝑖 for 𝑖 = 1,… , 𝑘
𝑔𝑗(𝑥) ≤ 0 for 𝑗 = 1,… ,𝑚
𝑥𝑗, 𝑑𝑖−, 𝑑𝑖
+ ≥ 0 for all 𝑖 and 𝑗
where Pp represents priority k with the underlying assumption that Pp is much larger than Pp+1. The ith
deviational variable at priority k are represented by the weights 𝑤𝑖𝑝+ and 𝑤𝑖𝑝
− . In essence, this approach
Page 49
32
consists of sequential single objective optimizations by successive optimizing the goals with higher priority.
Then, in order to optimize the goal associated to Pp+1, the goal Pp must be optimized previously.
2.4.1.3 Tchebycheff goal programming
A third variant of GP is the Tchebycheff GP also known as MinMax GP. This variant seeks to minimize
the maximum deviation from the stated goals. In other words, instead of minimizing the sum of all
deviations from the targets, the model minimizes the maximal deviation from any target. The use of this
approach is practical when the decision maker tries to achieve a balance of achievement for the set of goals
instead of prioritizing some goals over the others.
The objective function of this model becomes:
𝑀𝑖𝑛 𝑀𝑎𝑥 (𝑑1−, 𝑑2
−)
This can be reformulated as a linear objective by setting
𝑀𝑎𝑥 (𝑑1−, 𝑑1
−) = 𝑀 ≥ 0
This formulation is equivalent to the following:
𝑀𝑖𝑛 𝑍 = 𝑀
𝑆𝑢𝑏𝑒𝑐𝑡 𝑡𝑜 𝑀 ≥ 𝑑1−
𝑀 ≥ 𝑑2−
2.4.1.4 Obtaining weights
Typically, not all criteria can be considered equally important. In this case, the GP variant that should be
used is the weighted GP. In such cases, it is important to weight the criteria based on the decision maker’s
preferences. Assigning weights has two main purposes: accounting for changes in the variation range for
each evaluation measure, and accounting for the degrees of importance to these ranges of variation
(Kirkwood, 1997).
There are various techniques that can be used to obtain the weights or relative importance of the different
criteria. One of the most used methods consists of using a rating scale. In this technique the decision maker
is asked to rate the importance of each criteria in a scale from 1 to 10, being 1 the least important and 10
the most important. An alternative to this approach is the ranking method, in which Borda Count can be
used to rank criteria accordingly (Black, 1976). Another widely used method is the Analytic Hierarchy
Page 50
33
Process (Saaty, 1980). In this method the decision maker is asked to conduct a pairwise comparison among
all the criteria. The respondent quantifies how important one criteria is compared with the others in a scale
from 1 to 9 (Vaidya and Kumar, 2006).
2.4.1.5 Scaling and normalizing goal constraints parameters
As in goal programming multiple criteria are incorporated into a single objective function, goal constraints
must be scaled or normalized. This reduces the bias due to the magnitude of the parameters used. The main
aim of normalizing procedures is to put those goal constraints or deviational weight variables into a
comparable basis. Although the interpretation of the results becomes harder, they are more accurate in
reflecting the decision makers’ preferences. The selection of a specific scaling method or a group of them
will depend on the nature of the problem under analysis and decision makers’ preference. Various scaling
methods have been studied, including simple scaling, ideal value, linear normalization, and vector scaling,
among others (Masud and Ravindran, 2008). Velazquez et al. (2010) study different combinations of
weighting and scaling methods, and how their selection may yield to considerably different solutions.
2.4.2 Goal programming in healthcare
Giving the nature of the healthcare system in which multiple criteria must be considered by decision makers,
GP has become a popular approach for determining an optimal allocation of resources. As stated by Lee
and Kwak (1999), the problem of resource allocation in healthcare is a significant and integral part of
strategic planning to provide effective healthcare service and management. Wacht and Whitford (1976)
were pioneers in using GP in healthcare. They proposed a model for expenditure allocation in non-profit
hospitals. Some of the goals included in their paper are: facilitate teaching and research, create a center of
excellence in healthcare, maintain skilled and motivated healthcare workforce, among others. Tingley and
Liebman (1984) developed a model for public health resource allocation. Specifically, they used integer
GP to support resource allocation of a state program aiming to provide nutritious food supplements and
nutrition education to low income groups. Lee et al. (1999) used an AHP-based integer GP model to identify
the best healthcare information resource planning. In their approach, they considered four main goals:
budget allocation, project implementation, network construction, and human resource allocation. A two-
phase approach using simulation and GP for healthcare planning is proposed by Oddoye et al. (2009). In
the first phase of their approach, they estimate key metrics using simulation. In the second phase they use
GP for trade-off analysis. The objectives used were patient queue lengths for nurses, patient queue lengths
for doctors, total length of queues in the system, waiting time within the queues, and number of beds. Blake
and Carter (2002) use GP to strategic resource allocation in acute care hospitals. The main objective of the
proposed model is to provide a right case mix while accounting for case cost. Thus, the objective function
Page 51
34
of this problem ensures that the hospital is able to generate enough revenue, ensures that physicians are able
to generate their expected income level, right level of capacity use, and allow physicians to perform a case
mix preferred by them. A model for human resource allocation is presented by Kwak and Lee (1997) to
assign personnel to different shifts considering the minimization of total payroll while accounting for
patient satisfaction. Kwak and Lee (2002) used GP to support resource allocation with strategic planning
for business process infrastructure in healthcare systems. For their purposes, four main goals were
considered: financial budget process, information management process, operational process, and personnel
process. These goals were incorporated to allow the healthcare system to respond to new innovations and
competitiveness. A model for planning resource requirements in healthcare organizations is proposed by
Bretthauer and Cǒté (1998). They present two specific applications: a blood bank and a health maintenance
organization.
Other applications of GP in healthcare include nurse scheduling (Moz and Pato, 2005, Arthur and
Ravindran, 1981, Azaiez and Al Sharif, 2005, Musa and Saxena, 1984, Ozkarahan and Bailey, 1988,
Ozkarahan, 1991), allocation of surgeries to operating rooms (Ozkarahan, 2000), supply and demand
planning considering hospital location and service allocation (Chu and Chu, 2000), and healthcare waste
management (Chaerul et al., 2008), among others.
In summary, GP models have been applied in healthcare to facilitate decision-making planning process and
managerial policy. This technique provides a rich structure to overcome the challenges of balancing
different criteria to achieve the “best” solution for different MCDC problems. Applications of GP in
healthcare have been proposed for both tactical and strategic levels to optimize the allocation of resources.
Although GP has been extensively studied in healthcare applications, the proposal selection problem has
not been addressed in the literature. Given the nature of this problem, in which multiple strategic goals
should be taken into account, the authors envision that GP models can bring its various advantages to
address the proposal selection problem.
2.5 Proposal selection methods
Decision makers in various industries, including healthcare, deal with complex resource allocation
dilemmas. From a utilitarian perspective, decision makers aim to distribute the resources and select a certain
mix of projects that maximizes the value given the available resources. However, most of the time, assessing
the potential value of those projects is on its own a very challenging task. This fact is especially relevant in
scientific resource allocation decisions. In this case, scientific organizations providing internal or external
funding require different proposal selection methods to assess the quality and broadly estimate the potential
impact of those proposals. Most of the existing and currently used proposal selection methods to assess the
Page 52
35
quality of a proposal include: overall impact, significance, innovation, approach, investigator’s credentials,
and broad impact of the proposal, among other indicators that could serve as predictors of success. These
elements are typically used as estimators of value. However, there is no general agreement on what
scientific excellence means (van Arensbergen and van den Besselaar, 2012). In addition, most scoring
methods for proposal selection are used as screening tool as some other considerations are difficult to
quantify in isolation, and their value is better assessed in terms of mix of selected proposals. Hence, the
final selection of proposals is typically conducted by expert evaluators considering only those proposals
that meet some minimum quality criteria.
One of the main challenges in proposal selection is to remove subjectivity. Bias has been found to be
impossible to eliminate completely from the review process (Lamont, 2009). Therefore, the same proposal
could be given significantly different scores depending on the composition of the reviewing committee. For
example Sandström and Hällsten (2008) found that the relationship between the reviewer and the applicant
influences the rating. Additionally, studies have concluded that the grant allocation is apparently determined
about half by the characteristics of the proposal and the applicant, and half by chance (Cole and Simon,
1981). In this sense, more robust proposal selection methods are needed to optimally allocate resources
while considering multiple relevant criteria in the decision making process. Moreover, these methods are
needed for improving transparency, quality, and legitimacy of grant allocation practice and policy (van
Arensbergen and van den Besselaar, 2012).
Although proposal selection methods have been proposed in fields of decision analysis, operations research,
economic models and others (Tian et al., 2005, Yager, 1993), it has been found that, in general, these
elaborated knowledge-based models and methods are not being used, and therefore, their impact has been
limited in practice (Liberatore and Stylianou, 1995). One of the key considerations that has been recognized
to be important in proposal selection is that the selected projects should have a fit into the overall
programmatic agenda of the organization (Yager, 1993). However, there is still a lack of tools and
understanding for organizations to guide the proposal selection to support their long-term goals, vision, and
strategy. In response to these needs, multiple-criteria optimization models provide a god fit for
incorporating multiple objectives into a single optimization function.
Page 53
36
2.6 Cost-Effectiveness Analysis
Cost-utility analysis (CUA) and cost-effectiveness analysis (CEA) are two of the most used tools to guide
health policy making in resource allocation. Cost-effectiveness research integrates 1) measurements of
change of health post-intervention, 2) duration of life expectancy, and 3) cost of treatment or intervention
(Lubowitz and Appleby, 2011). The integration of these three elements provides a support for guiding
choices about public health policies based on effectiveness and costs of health interventions. Therefore,
opportunities of a better allocation of scarce resources could be achieved while improving health outcomes.
Consequently, the use of CEA in health and medicine has been recommended to provide an appropriate
baseline for comparisons in resource allocation decisions (Weinstein et al., 1996). One of the key
characteristics of CEA is that it standardizes the gains in health relative to the cost of different interventions
(Jamison et al., 2006). Although it is not the only criteria that is considered in resource allocation decisions,
it is an important one as it integrates financial and scientific aspects.
In practice, CEA is mostly used to compare different health interventions based on cost-effectiveness
measures such as cost per quality-adjusted life years (QALYs) and incremental cost-effectiveness ratio
(ICER). To conduct a CEA, researchers need to understand and specify the different impacts of the health
intervention (Jamison et al., 2006). Therefore, the researcher should anticipate what aspects of the health
will change due to the intervention. These aspects could include the risk, duration, or severity of a health
problem. The potential impact will mostly depend on the characteristics of the intervention. The types of
interventions can be categorized into three groups; primary prevention, secondary prevention, and case
management or tertiary interventions. The first group includes those health interventions that aim to
decrease the risk of an adverse health event. The secondary prevention group seeks to prevent an adverse
health event to occur again. Finally, the case management group includes cures, acute care, rehabilitation,
and other interventions that occur after an adverse health event (Figure 2-3).
As in any other methods to provide a fair estimation, an adequate level of detail is required. In this sense,
to conduct a CEA, the intervention needs to be fully characterized and defined at its different levels of care.
In addition, the costs involved in the implementation and delivery of the health intervention should be
understood. The cost structure selected for conducting the CEA depends on the type of intervention and
researcher focus. Hence, the estimation could include direct and/or indirect costs. For comparison of
interventions, however, the cost structure used for the estimation must be the same to avoid bias due to
inconsistent bases. For consistency across studies, including only direct costs is generally recommended
(Jamison et al., 2006).
Page 54
37
3
4 Figure 2-3. Types of health interventions (adapted from Jamison et al. (2006))
5
Cost-effectiveness analysis generally uses QALY to guide and distribute healthcare resources more
efficiently (Shiroiwa et al., 2010). Typically, cost-effectiveness thresholds are used determine whether an
intervention achieve an acceptable value given the costs involved (Torrance et al., 1996). However, even
though the concept of threshold is used by healthcare decision makers in practice, explicitly setting them is
politically sensitive (Zwart-van Rijkom et al., 2000). Moreover, not using explicit thresholds can be
considered attractive by decision makers as it gives them room for other considerations (Eichler et al.,
2004). Nevertheless, the thresholds can be inferred from past allocation decisions. In U.K., for example, an
ICER of £20,000 - £30,000 per QALY (approximately between US$ 30,000 – 50,000) is typically used
(Devlin and Parkin, 2004, McCabe et al., 2008), while in the U.S., the threshold is US$50,000 –
US$100,000 per QALY. A justification for these thresholds can be found in Shiroiwa et al. (2010). In
practice, most decision makers in the U.S. agree that interventions that cost less than US$50,000 – 60,000
per QALY gained provide good value (Owens et al., 2011). A different method to evaluate whether an
intervention is or not cost-effective was presented by the WHO. They say that an intervention that costs
less than three times the per capita GDP per DALY is cost-effective. Additionally, an intervention is very-
cost effective when its cost is less than the per capita GDP per DALY.
As claimed by the WHO, the estimation of disease burden metrics through CEA can be useful for informing
decision makers about the overall impact of different health interventions (World Health Organization,
2009). Economic burden studies also require incorporating metrics on the effectiveness of interventions. In
recognition of the importance of this last point, the WHO called for a much coherent use of conceptual
foundations to guide economic impact studies. This aims to enhance consistency, comparability, and
coherence of economic impact among different health studies. Therefore, a more informed health policy
Page 55
38
discussion can be held to improve people’s health and close existing disparities while accounting for cost-
effectiveness factors.
Assessing the benefits, harms, and costs of an intervention is important to truly understand whether it
provides a good value for the money (Owens et al., 2011). Consequently, systematic approaches to support
the resource allocation should be used rather than intuition of the health policy makers (Eichler et al., 2004).
According to Neumann et al. (2005), the use of CEA could help Medicare to spend its resources more
efficiently. Thus, CEA must be used as a comprehensive strategy to change the incentives at different levels.
Finally, CEA must not be used as strict guideline for resource allocation. There may be other ethical
considerations to implement interventions that do not achieve the typically used cost-effectiveness
threshold (Owens et al., 2011).
2.6.1 Impact of healthcare interventions and the use of QALY
Typically, most of the journal articles describe interventions with results that are statistically significant,
however, most of those articles fail to provide guidance and metrics to evaluate their potential health impact.
As argued by Fielding and Teutsch (2013), articles concerning clinical or population-health interventions
should provide structured information to quantify their potential impacts, and thus, justify their
implementation.
Although it must be recognized that investing on different types of interventions is important to fairly
distributing resources, there should also be considered that investments that lead to the greatest health
impact should have priority when competing for scarce resources. In order to examine the benefits and
harms of an interventions that is expected to be implemented in practice, Fielding and Teutsch (2013)
propose the use of quantitative factors; burden of disease, preventable burden, and economic value.
To account for these quantitative factors, the use of QALYs appears to be an attractive solution to normalize
the comparison among different interventions. The main principle behind QALY is to correct or calibrate
people’s expectancy of life based on their quality of life or health status. This measure has been widely
used to guide the allocation of resources in healthcare settings (Weinstein et al., 2009). The main purpose
or practical reason for using QALY is the assumption that decision makers in healthcare seek to maximize
health improvement across the population given limited resources to be allocated. An alternative metric
based on similar concepts is the disability-adjusted life years (DALYs). The DALY is a measure that
combines the time lost due to premature death and the time lived in a health state lower than the optimal
health state, also referred as disability (World Health Organization, 2013).
Page 56
39
Challenges and need for coherent methods to compare interventions
Recently, the CTSA called for more coordination and collaboration within the CTSA hubs and CTSA
networks with the overall objective of improving the Nation’s capacity to address and eliminate health
disparities. According to their recent RFA (RFA-TR-14-0009), the vision of the program has to be
supported by an emphasis on three main themes: workforce diversity, track record in translational and
clinical research, and integration of healthcare and research. This last theme becomes very relevant to
ensure the synergies between the health care delivery system and the translational research enterprise.
Therefore, assuring the implementation of research advances into clinical care settings and prioritize
translational research interventions. In addition, the NCATS Advisory Council Working Group developed
some guidelines to guide strategies to strengthen the CTSA program. One of the specific strategic goals is
to train researchers about how to properly conduct studies that anticipate the impact of their proposals.
While a lot of effort has been put in demonstrating the statistically significance of health interventions,
there are still gaps in assessing the potential impact that those interventions can have on people’s health.
Most of the reported interventions have not quantified their impact on reducing health disparities, size of
the population to be targeted, potential to improve quality of life, potential to reduce the risk of a certain
disease, etc. In order to optimally allocate the resources to impact people’s health, metrics that estimate this
impact are needed. Calls for proposals should encourage a formal mechanism to estimate impact, and thus,
improve their ability to impact society.
Another key factor for encouraging health researchers to pay more attention to the estimation of the real
impact of their interventions is that it can result in more credibility, and therefore, more willingness from
funding agencies to provide funding to those initiatives. This is not something new, Winslow (1951)
collected and disseminated evidence about the potential economic impact associated to various health
interventions as a way to encourage and persuade governments to invest more money into public health.
Additional challenges might also be addressed to properly estimate the impact of a certain public health
intervention on “intangibles”. Future research should be oriented to developing frameworks that transform
those intangibles to metrics that can be measured and valued. As argued by Fielding and Teutsch (2013),
presenting this type of information can be somehow technically challenging, however, it is even more
challenging for researchers to find new ways to think about the value of their work. In order to support the
comparison of interventions based on their impact, coherent metrics such as QALYs should be used. This
standard metric would add coherence and consistency when comparing different interventions from a cost-
effectiveness perspective.
Page 57
40
According to Weinstein et al. (2009) there are six principles and assumptions that underlay the conventional
QALY approach used in resource allocation decisions.
1. A resource allocation has to be made.
2. The consequences of the resources allocated might have an impact on health states and the
duration of those health states.
3. Resources are limited.
4. The main objective of the decision maker is to maximize the population’s health subject to
resource constraints.
5. Health is defined as a weighted function of value over a relevant time horizon
6. Value can be measured in terms of preferences and desirability
Although using metrics such as QALY and DALY do not solve all the challenges in the resource allocation
process, it certainty helps when comparing interventions based on a coherent baseline that accounts not
only for people’s health but also can be incorporated as cost-effectiveness metrics that inform the economic
evaluation of interventions.
2.6.2 Estimating QALY
As previously mentioned, QALY is one of the most used metrics to assess the impact of health
interventions. This metric has been used consistently for about four decades. Zeckhauser and Shepard
(1976) used the term QALY for the first time to propose a metric that combines duration and quality of life.
A few years later, Pliskin et al. (1980) demonstrated that QALY maximization based on the utility theory
is justifiable under two conditions; utility independence between health status and life of years, and risk
neutrality with respect to life of years. Technically, the QALY incorporates the different health related
quality of life status (HRQoL) that can range from 0, being dead, and 1 which represents a maximum or
perfect health status.
Currently, QALYs are used in most economic assessments conducted by agencies that encourage the cost-
effectiveness factors as fundamental component of their decision-making processes (Sassi, 2006).
Mathematically, the number of QALYs lived by a person can be expressed as follows:
𝑄𝐴𝐿𝑌 𝑖𝑛 𝑜𝑛𝑒 𝑦𝑒𝑎𝑟 = 1 ∗ 𝑄, 0 ≤ Q ≤ 1 Eq. 29
where Q is the health status or HRQoL weight lived during the year under calculation. Then, the expected
quality-adjusted life or quality-adjusted life expectancy (QALE) at a certain age a of disease is defined as:
Page 58
41
𝑄𝐴𝐿𝐸 = ∑ 𝑄𝑡
𝑎+𝐿
𝑡=𝑎 Eq. 210
where L is the residual life expectancy of the individual at age a, and t is the number of years that the
individual is expected to be attached to the corresponding HRQoL. Typically, discounting factors are used
to calibrate the utility of QALY. In other words, translating future QALYs into a present value. Then, in
this case we can calculate a discounted QALE.
𝐷𝑖𝑠𝑐𝑜𝑢𝑛𝑡𝑒𝑑 𝑄𝐴𝐿𝐸 = ∑𝑄𝑡
(1 + 𝑟)𝑡−𝑎
𝑎+𝐿
𝑡=𝑎 Eq. 211
where r is the discount rate or normalization factor to evaluate health using present value. Typically a
discount rate between 3 – 5% is in line with the Global Burden of Disease (GBD) and practical guidelines
(Brouwer et al., 2000). In order to compare the impact of health interventions, pre-intervention QALY and
post-intervention QALY must be compared. This metric will give an estimate of the QALYs gained as a
result of the health intervention.
𝑄𝐴𝐿𝑌𝑠 gained = ∑𝑄𝑡
𝑖
(1 + 𝑟)𝑡−𝑎
𝑎+𝐿𝑖
𝑡=𝑎− ∑
𝑄𝑡
(1 + 𝑟)𝑡−𝑎
𝑎+𝐿
𝑡=𝑎 Eq. 212
where Qi is the vector related to the health status quality of life weights predicted after the health
intervention for each time step t.
Although these calculations appear to be easy, the big challenge is to accurately obtain an estimate of the
parameter Q. Most of the methods to estimate Q are based on general public’s opinion. Usually, individuals
are asked to imagine themselves in different health states and then to think about the trade-off of sacrificing
years of life or what risk in death (percentage) they would be willing to take in order to achieve a full health
state (Dolan, 2008). These methods are known as the time trade-off method (TTO) and the standard gamble
method (SG). Typically, these methods utilize two ways to obtain the data; patients and general public.
When asking patients, they can relate their values of health based on current experiences. On the other hand
when asking the general public, they should imagine themselves being in different health states. Out of
these two data sources, many health economists prefer the valuations from the general public. However,
some others have argued about the suitability of using preference-based methods of the general public
(Dolan, 2008).
Page 59
42
2.6.3 Instruments to estimate QALY
In this section, a brief description of different instruments utilized to calculate “the Q of QALY” is given.
Typically, there are three main methods to estimate the Q or HRQoL; visual analogue scale (VAS), time
trade-off, and standard gamble (Bravo Vergel and Sculpher, 2008). From these methods, various health
valuation instruments have been proposed in the literature including the EQ-5D, SF-36, SF-12, SF-6D, and
WBQ, among others.
2.6.3.1 EQ-5D
In order to facilitate the calculation of QALYs, Williams (1995) developed the EuroQol instrument to
measure the HRQoL or Q. The purpose of this instrument is to provide a single index score for each health
state. The instrument relies on a questionnaire and a rating scale used as a “thermometer” of health state.
According to this, the three main contributions of EuroQol to measure HRQoL are:
1. Simple way to generate descriptive data
2. Simple way to utilize people’s perception to evaluate their own health status
3. Provide a preference-based generic index of health benefits
The EQ-5D instrument consists of a self-reported questionnaire that includes five main dimensions: 1)
mobility, 2) self-care, 3) usual activities, 4) pain/discomfort, and 5) anxiety/depression. The key question
asked to guide the respondent is “which statements best describe your own health state today?”, only one
of the levels (alternatives) is selected per dimension. In order to generate the value sets for the EQ-5D,
TTO and VAS are typically used. The VAS consists of a vertical diagram, typically 20-cms long, whose
scale ranges from 0 (worst imaginable health state) to 100 (best imaginable health state). In the VAS, the
respondent is asked to indicate how well or bad his/her own health is today. The EQ-5D survey is presented
in Table 2-3.
Under the EQ-5D model, the health state of an individual can be represented by a string of category levels.
In this sense, the value of the health state is a function of the categories already presented.
𝑄 = 𝑓(𝑀𝑖, 𝑆𝑖, 𝑈𝑖 , 𝑃𝑖 , 𝐴𝑖)
Where Mi, Si, Ui, Pi, and Ai represent the level (1,2, or 3) of the dimensions mobility, self-care, usual
activity, pain / discomfort, and anxiety / depression, respectively. As each one of the five categories contains
three levels, there are 243 different health states (35), in addition, two other health states are added; “dead”
and “unconscious”, giving a total of 245 health states. An individual’s health state can be represented as a
string containing the levels for the different dimensions. For example, an individual with a health status of
Page 60
43
12132 indicates that the individual has no problems in walking about, has some problems with washing or
dressing him/herself, has no issue with performing usual activities, has extreme pain or discomfort, and is
moderately anxious or depressed.
Table 2-3. EQ-5D self-reported questionnaire
Dimension Statement Mark
Mobility I have no problems in walking about
I have some problems in walking about
I am confined to bed
Self-care I have no problems with self-care
I have some problems with washing or dressing myself
I am unable to wash or dress myself
Usual
activities
I have no problems with performing my usual activities (e.g.,
work, study, housework, family or leisure activities)
I have some problems with performing my usual activities
I am unable to perform my usual activities
Pain /
Discomfort
I have no pain or discomfort
I have moderate pain or discomfort
I have extreme pain or discomfort
Anxiety /
Depression
I am not anxious or depressed
I am moderately anxious or depressed
I am extremely anxious or depressed
According to Rabin and de Charro (2001), the EQ-5D instrument is being used in a variety of ways that
includes: monitoring health status of a patient over time, assessing seriousness of particular conditions in a
patient at different moments in time, providing evidence about medical effectiveness of drugs and
treatments, guiding resource allocation, and establishing health status baseline for populations of interest.
The EQ-5D framework has been used in a wide range of health issues such as rheumatoid arthritis (Hurst
et al., 1997, Marra et al., 2005), mental health (Lamers et al., 2006), diabetes (Clarke et al., 2002), and
Parkinson’s disease (Schrag et al., 2000), among others.
Valuation and models
In order to provide valuation for the different health states, a common practice is to select a set of health
states with a mixture of severity levels to be directly assessed or valued (Szende et al., 2007). The first
attempt to formalize health state values was proposed in the mid-1990s. Dolan et al. (1995) propose a model
to estimate the value of life based on different health states using the EQ-5D instrument. This model is
known as the social tariff (health state) TTO framework. As in other TTO approaches, the evaluator asks
Page 61
44
the respondent to quantify the trade-off between sacrificing quantity of life (years) in order to improve their
quality of life. This EQ-5D tariff framework is based on empirical results obtained from a large survey
study in the U.K. in which a set of HRQoL valuations were obtained for 45 health states. The scores are
explained by 12 parameters including a constant associated with any distance from the full health status
(11111), two components within each dimension (10 components in total), and a term referred as N3 that
is an additional coefficient included when any dimension is at level 3. The coefficients for these 12
components are presented in Table 2-4.
Table 2-4. Coefficients for TTO tariffs (modified from Dolan et al., 1995)
Dimension (Component) Coefficient
Constant (a) -0.081
Mobility Level 2 -0.069
Level 3 -0.314
Self-care Level 2 -0.104
Level 3 -0.214
Usual activity Level 2 -0.036
Level 3 -0.094
Pain / Discomfort Level 2 -0.123
Level 3 -0.386
Anxiety / Depression Level 2 -0.071
Level 3 -0.236
N3 -0.269
Hence, the health state index of this model is given by:
𝑄 = 1 − 0.081 (if any deviation from full health) − 0.069𝑀2 − 0.314𝑀3 − 0.104𝑆2 − 0.214𝑆3
− 0. .036𝑈2 − 0.094𝑈3 − 0.123𝑃2 − 0.386𝑃3 − 0.071𝐴2 − 0.236𝐴3
− 0.269𝑁3 Eq. 213
The variables used are binary, in addition only one level can be 1 for each dimension. The value of health
for the example previously shown (12132) is 0.124 (1 – (0.081 + 0 + 0.069 + 0 + 0.386 + 0.071 + 0.269)).
As it can be seen from the model, the two dimensions in level 3 that impact the HRQoL the most are pain
/ discomfort and mobility. On the other hand, the dimension of usual activity presents the lowest impact for
level 2 (-0.036) and level 3 (-0.094). Although the Pearson coefficient (r2) for this valuation model was not
very high (0.46), given the type of data analyzed for the generation of the model, it is considered very good
(Dolan et al., 1995).
Page 62
45
As previously mentioned, the model proposed by Dolan et al. (1995) is based on a valuation survey
conducted in U.K. including 3,395 respondents. Similar studies have been conducted around the world,
including the U.S. Shaw et al. (2005) uses a TTO approach to generate a model based on a sample of 4048
respondents using 45 health states. This model is called D1 valuation model and its coefficients are shown
in Table 2-5.
Table 2-5. EQ-5D - D1 Valuation model
Dimension (Component) Coefficient
Mobility Level 2 -0.146
Level 3 -0.558
Self-care Level 2 -0.175
Level 3 -0.471
Usual activity Level 2 -0.140
Level 3 -0.374
Pain / Discomfort Level 2 -0.173
Level 3 -0.537
Anxiety / Depression Level 2 -0.156
Level 3 -0.450
D1 +0.140
I2-square -0.011
I3 +0.122
I3-square +0.015
where:
D1 : ordinal variable that represents the number of movements away from full health state (11111)
beyond the first
I2 : ordinal variable that represents the number of dimensions at level 2 beyond the first
I3 : ordinal variable that represents the number of dimensions at level 3 beyond the first
Then the health state index is given by:
𝑄 = 1 − 0.146𝑀2 − 0.558𝑀3 − 0.175𝑆2 − 0.471𝑆3 − 0.140𝑈2 − 0.374𝑈3 − 0.173𝑃2 − 0.537𝑃3
− 0.156𝐴2 − 0.450𝐴3 + 0.140𝐷1 − 0.011𝐼22 + 0.122𝐼3 + 0.015𝐼3
2 Eq. 214
Returning to the previous example, in this case the individual with health state 12132 would have a value
of health of 0.401 (1- 0 – 0 – 0.175 – 0 – 0 – 0 – 0 – 0.537 – 0.156 – 0 + 2*0.140 – 0.011 + 0 + 0). This
model is considered to be fairly accurate as in only 7 health state valuations prediction (out of the 45 health
states included) the errors exceeded 0.05 in absolute magnitude. In terms of consistency, as in the previous
Page 63
46
model, mobility and pain / discomfort are the most impactful dimensions in level 3. Similarly, the least
impactful dimension in this model is also usual activity for level 2 (-0.140) and level 3 (-0.374).
As argued by Shaw et al. (2005), the D1 valuation model is more appropriate for the U.S. population. A
comparison of the distributions of HRQoL obtained for the models proposed by (Dolan et al., 1995) for the
U.K. population and (Shaw et al., 2005) for the U.S. population is shown in Figure 2-4. Other studies from
different countries can be found in Szende et al. (2007).
Figure 2-4. Histogram of distribution of HRQoL ranges for US and UK
From the histogram of the HRQoL valuations for the U.S. and U.K. population-based models we can say
that for the same health states, the U.S.-based valuations are higher than the U.K.-based valuations. One of
the similarities of the models is that both of them present a bi-modal distribution.
As recommended by the Panel on Cost-Effectiveness in Health and Medicine (Weinstein et al., 1996, Gold,
1996), these approaches in which population-based preference weights are considered should be used to
inform decision makers in charge of allocating resources in the U.S.
2.6.3.2 SF-36
The 36-item short-form (SF-36) health survey is a self-reported measure of health status. The SF-36 was
developed as part of the Medical Outcomes Study (MOS) and formalized by the RAND Corporation (Ware
and Sherbourne, 1992). This instrument is defined as a “set of generic, coherent, and easily administered
quality-of-life-measures”. This form assesses eight health dimensions: 1) limitations in physical activities;
0
5
10
15
20
25
30
35
40
45
50
]-1 ; -0.5 ] ]-0.5 ; -0.4 ] ]-0.4 ; -0.3 ] ]-0.3 ; -0.2 ] ]-0.2 ; -0.1 ] ]-0.1 ; 0 ] ]0 ; 0.1 ] ]0.1 ; 0.2 ] ]0.2 ; 0.3 ] ]0.3 ; 0.4 ] ]0.4 ; 0.5 ] ]0.5 ; 0.6 ] ]0.6 ; 0.7 ] ]0.7 ; 0.8 ] ]0.8 ; 0.9 ] ]0.9 ; 1 ]
Fre
qu
ency
HRQoL
US UK
Page 64
47
2) limitations in social activities; 3) limitations in usual role activities given physical problems; 4) bodily
pain; 5) general mental health; 6) limitation in usual role activities given emotional problems; 7) vitality;
and 8) general health perception. The SF-36 health states scales and the interpretation of its extreme scores
are presented in Table 2-6.
Table 2-6. SF-36 Health status and interpretation
Dimension
No of
items
No of
levels
Meaning of scores
Low High
Physical
functioning
10 21 Limited a lot in performing
physical activities including
bathing or dressing
Performs all types of physical
activities including the most
vigorous without limitations due to
health
Role limitation
– physical
4 5 Problems with work or other
daily activities as a result of
physical health
No problems with work or other
daily activities as a result of
physical health, past 4 weeks
Social
functioning
2 9 Extreme and frequent
interference with normal
activities due to physical and
emotional problems
Performs normal social activities
without interference due to
physical or emotional problems,
past 4 weeks
Bodily pain 2 11 Very sever and extremely
limiting pain
No pain or limitations due to pain,
past 4 weeks
General mental
health
5 26 Feelings of nervousness and
depression all of the time
Feels peaceful, happy, and calm all
of the time, past 4 weeks
Role limitation
– emotional
3 4 Problems with work or other
daily activities as a result of
emotional problems
No problems with work or other
daily activities due to emotional
problems, past 4 weeks
Vitality 4 21 Feels tire and worn our all of
the time
Feels full of pep and energy all of
the time, past 4 weeks
General health
perceptions
5 21 Believes personal health is
poor and likely to get worse
Believes personal health is
excellent
Several studies using this instrument have demonstrated its clinical validity in a wide range of diseases such
as gastrointestinal dysfunction (Bensoussan et al., 2001), asthma (Bousquet et al., 1994), HIV (Shahriar et
al., 2003, Hsiung et al., 2005, Riley et al., 2003), breast cancer (Mosconi et al., 2001, Bower et al., 2000),
migraine (Solomon et al., 1995, Osterhaus et al., 1994, Monzon and Lainez, 1998, Hung et al., 2013), and
digestive disorders (Hahn et al., 1999, Whitehead et al., 1996, Gralnek et al., 2000), among others.
The scores assigned depend on each dimension, for example the first category physical functioning
(limitation in physical activities) is composed of responses coded 1 (limited a lot), 2 (limited a little), and
3 (not limited at all). The physical functioning dimension is composed by 10 items or questions. These
items are shown in Table 2-7. In order to score the health index for this dimension, it should be noticed that
the scale of values ranges from 10 to 30. To transform this scale into a 0 to 100 scale, it can be said that
Page 65
48
each point over 10 (baseline) in the direct SF-36 scale worth 5 points in a 100-points scale. For instance,
an individual that scores 3,3,2,1,2,3,3,3,2,1 for questions from 3 to 12 respectively, has a score of 23 for
the physical dimension. This is translated into a physical functioning score of 65 in a 100-points scale.
Table 2-7. SF-36 - Physical functioning dimension
Physical functioning item
Yes,
Limited
a lot
Yes,
Limited a
little
No, Not
limited at
all
[3] Vigorous activities, such as running, lifting heavy objects,
participating in strenuous sports
(1) (2) (3)
[4] Moderate activities, such as moving a table, pushing a
vacuum cleaner, bowling, or playing golf
(1) (2) (3)
[5] Lifting or carrying groceries (1) (2) (3)
[6] Climbing several flights of stairs (1) (2) (3)
[7] Climbing one flight of stairs (1) (2) (3)
[8] Bending, kneeling, or stooping (1) (2) (3)
[9] Walking more than a mile (1) (2) (3)
[10] Walking several blocks (1) (2) (3)
[11] Walking one block (1) (2) (3)
[12] Bathing or dressing yourself (1) (2) (3)
A complete version of the SF-36 Survey can be found in the Appendix G.
One of the main limitations that has been discussed in the literature is that SF-36 does not consider
preferences. It means that moving from one level to another is considered to be equally important (moving
from “limited a little” to “no limited” has the same weight than moving from “limited a lot” to “limited a
little”). Brazier et al. (2002) proposes a standard gambling approach to take into consideration preference-
based measures.
In order to make the SF-36 survey shorter, some other instruments have been proposed in the literature.
Instruments such as the SF-12 and SF-6D are two short versions of the SF-36 that have been proved to have
a very minimal loss of information. In addition to reducing the number of items included in the survey,
these versions have simplified wording and improved ambiguity. More details about these instruments are
presented in subsequent sections.
2.6.3.3 SF-12
The SF-36 instrument was modified to improve its brevity and psychometric performance. The form was
reduced to 12 items (SF-12) with very minimal information loss (Ware and Sherbourne, 1992). The SF-12
Page 66
49
includes 8 dimensions; physical functioning, role limitations – physical, bodily pain, general health, vitality,
social functioning, role limitations – emotional, and mental health. The structure of the SF-12 is shown in
Table 2-8. A complete version of the SF-12 survey can be found in the Appendix H.
Table 2-8. SF-12 Health dimensions and summary of content
Dimension No.
Items
Summary of Content No.
response
choices
Range of responses
Physical
functioning
2 Moderate activities, climbing several
flights of stairs
3 “Yes limited a lot” to
“no limited at all”
Role limitations –
physical
4 Accomplishing less than wanted,
limitations in the kind of activities
2 Yes / No
Bodily pain 2 Effect of pain on normal work, both
inside and outside the home
6 “Not at all” to
“extremely”
General health 1 Personal evaluation of health 5 “Poor” to “excellent”
Vitality 1 Feeling full of life 6 “All of the time” to
“none of the time”
Social functioning 2 Extent to which physical health or
emotional problems interfere with
normal social activities
5 “All of the time” to
“none of the time”
Role limitations –
emotional
2 Accomplishing less, not working as
carefully as usual
2 Yes / No
Mental health 2 Downhearted and blue, calm peaceful 6 “All of the time” to
“none of the time”
One of the advantages of the SF-12 is that it requires only one third of the time for completion if compared
with the SF-36 (Lacson et al., 2010). Even though this short version uses only 12 out of the 36 items
included in the original version of the SF-36, studies have shown that the main component summaries
(physical and mental) of the SF-12 and SD-36 are correlated (Gandek et al., 1998, Lacson et al., 2010).
Valuation and models
In order to provide a single index of HRQoL, Lundberg et al. (1999) proposes a regression model based on
the SF-12 instrument. The authors fitted the models for the general population using the VAS and TTO
methods. These models were able to explain 50% and 25% of the variance of the health state utilities
respectively. In addition to including the 12 items of the survey, the model also incorporates two
explanatory variables: age and gender. For the variable age, seven dummy variable categories were used.
The coefficients obtained from the regression analysis are shown in Table 2-9.
Page 67
50
Table 2-9. SF-12 Regression coefficients
SD-12 Items VAS TTO
Constant 0.3473 0.5714
Age 20-29 years
30-39 years 0.0062 0.0056
40-49 years -0.0116 -0.0075
50-59 years -0.0175 -0.0117
60-69 years -0.0292 -0.0421
70-79 years -0.0551 -0.1410
80 - years -0.0835 -0.1920
Gender Women 0.0157 0.0014
Physical function [2a] Moderate activities Limited a little 0.0249 0..0051
Not limited at all 0.0821 0.0406
[2b] Climbing Limited a little 0.0223 0.0744
Not limited at all 0.0633 0.0974
Role functioning
- physical
[3a, 3b]Physical health
interfered with work
Did not accomplish less 0.0171 0.0218
Was not limited in the kind of work 0.0170 0.0032
Bodily pain [5] Pain interfered with
work
Quite a bit 0.0545 0.0237
Moderately 0.0949 0.0056
A little bit 0.1220 0.0291
Not at all 0.1390 0.0326
Vitality [6b] Energy A little of the time 0.0209 0.0252
Some of the time 0.0446 0.0417
A good bit of the time 0.0500 0.0362
Most of the time 0.0762 0.0357
All of the time 0.1010 0.0478
Social Function [7] Physical and emotional
health interfered with work
Most of the time 0.0513 0.0031
Some of the time 0.0677 0.0489
A little of the time 0.0832 0.0552
None of the time 0.0977 0.0805
Role function –
emotional
[4a, 4b] Emotional health
interfered with work
Did not accomplish less -0.0016 0.0129
Did work as carefully as usual 0.0021 -0.0075
Mental Health [6a] Calm and peaceful A little of the time 0.0089 0.0206
Some of the time -0.0056 -0.0019
A good bit of the time 0.0043 0.0010
Most of the time 0.0204 0.0157
All of the time 0.0317 0.0133
[6c] Downhearted and blue Most of the time -0.0282 0.0160
A good bit of the time 0.0216 0.0686
Some of the time 0.0426 0.0531
A little bit of the time 0.0559 0.0716
None of the time 0.0584 0.0711
Page 68
51
2.6.3.4 SF-6D
Another reduced version of the SF-36 is the SF-6D which contains 6 main dimensions; physical
functioning, role limitations, social functioning, pain, mental health, and vitality (Brazier et al., 2002). Each
one of the dimensions (δ) has between two and six levels (λ). Under this model, a total of 18,000 health
states can be defined. The health dimensions and levels of the SF-6D are shown in Table 2-10.
In the SF-6D, the full health state is defined by 111111 and the worst health state possible is defined by
645655. For example an individual whose health state is 233322 means that the individual’s health limits
his/her a little in vigorous activities, accomplish less than he/she would like as a result of emotional
problems, individual’s health limits his/her social activities some of the time, have pain that interferes with
his/her normal work a little bit, he/she feels tense or downhearted and low a little of the time, and he/she
has a lot of energy most of the time.
Valuation and models
Brazier et al. (2002) present a preference-based measure of health for the SF-6D applied to a representative
sample of the U.K. The valuation survey used a version of the standard gamble method. The models were
based on responses from 836 individuals that were asked to rank, and then value six different health states.
An orthogonal design procedure was used to generate 49 out of the 18,000 health states. The coefficients
found for these models are presented in Table 2-11.
This model incorporates two interaction effects; MOST and LEAST. The variable MOST assumes a value
of 1 if any of the five dimensions is at the most severe level. The variable LEAST assumes a value of 1 if
any of the five dimensions is at the least severe level. The best SF-6D mean model achieved an adjusted R2
of 0.58 which makes it very relevant for its use in cost-utility analysis (Brazier et al., 2002). Under the
different four models provided, for example, the value health for an individual with health state 233322
would be 0.223 (RE), 0.272 (Mean), 0.341 (RE-constant forced to unity), and 0.366 (Mean-constant forced
to unity). Out of these models, the Mean-constant forced to unity model is the one that is recommended to
be used in cost-utility analyses (Brazier et al., 2002).
Page 69
52
Table 2-10. SF-6D Health dimensions and levels
Level Physical functioning Role limitation Social functioning Pain Mental health Vitality
1 Your health does not
limit you in vigorous
activities
You have no problem with
your work or other activities
as a result of your physical
health or any emotional
problem
Your health limits
your social activities
none of the time
You have no pain You feel tense or
downhearted and
low none of the time
You have a lot of
energy all of the time
2 Your health limits you a
little in vigorous
activities
You are limited in the kind
of work or other activities as
a result of your physical
health
Your health limits
your social activities
a little of the time
You have pain but it
does not interfere
with your normal
work
You feel tense or
downhearted and
low a little of the
time
You have a lot of
energy most of the
time
3 Your health limits you a
little in moderate
activities
You accomplish less than
you would like as a result of
emotional problems
Your health limits
your social activities
some of the time
You have pain that
interferes with your
normal work a little
bit
You feel tense or
downhearted and
low some of the
time
You have a lot of
energy some of the
time
4 Your health limits you a
lot in moderate
activities
You are limited in the kind
of work or other activities as
a result of your physical
health and accomplish less
than you would like as a
result of emotional
problems
Your health limits
your social activities
most of the time
You have pain that
interferes with your
normal work
moderately
You feel tense or
downhearted and
low most of the time
You have a lot of
energy little of the
time
5 Your health limits you a
little in bathing and
dressing
Your health limits
your social activities
all of the time
You have pain that
interferes with your
normal work quite a
bit
You feel tense or
downhearted and
low all of the time
You have a lot of
energy none of the
time
6 Your health limits you a
lot in bathing and
dressing
You have pain that
interferes with your
normal work
extremely
Page 70
53
Table 2-11. SF-6D Models with interaction effects
Coefficients RE Mean
Constant forced to
unity
RE Mean
c 0.799 0.788 1 1
PF2 -0.023 -0.015 -0.05 -0.053
PF3 -0.021 0.011 -0.038 -0.011
PF4 -0.054 -0.018 -0.069 -0.04
PF5 -0.035 -0.034 -0.046 -0.054
PF6 -0.119 -0.084 -0.145 -0.111
RL2 -0.03 -0.021 -0.051 -0.053
RL3 -0.042 -0.03 -0.058 -0.055
RL4 -0.041 -0.024 -0.063 -0.05
SF2 -0.03 -0.023 -0.054 -0.055
SF3 -0.012 -0.04 -0.032 -0.067
SF4 -0.025 -0.042 -0.044 -0.07
SF5 -0.071 -0.058 -0.096 -0.087
PAIN2 -0.005 0.005 -0.037 -0.047
PAIN3 -0.013 0.004 -0.034 -0.025
PAIN4 -0.02 -0.025 -0.04 -0.056
PAIN5 -0.055 -0.049 -0.081 -0.091
PAIN6 -0.141 -0.136 -0.167 -0.167
MH2 -0.022 -0.03 -0.036 -0.049
MH3 -0.028 -0.019 -0.045 -0.042
MH4 -0.085 -0.089 -0.099 -0.109
MH5 -0.098 -0.109 -0.115 -0.128
VIT2 -0.006 -0.044 -0.032 -0.086
VIT3 -0.002 -0.031 -0.019 -0.061
VIT4 -0.001 -0.019 -0.022 -0.054
VIT5 -0.054 -0.064 -0.073 -0.091
MOST -0.052 -0.041 -0.084 -0.07
LEAST 0.049 0.048
2.6.3.5 QWB-SA
Another approach to estimate the HRQoL is the Quality of Well Being Self-Administered (QWB-SA) scale.
This instrument was developed in 1970’s with the objective of measure HRQoL (Kaplan et al., 1976). The
QWB-SA includes three main sections; presence or absence of chronic symptoms, acute physical symptoms
and mental symptoms, and levels of functioning. The first section is composed of 19 questions including
blindness and hearing problems. The second section includes 25 acute physical problems and 14 mental
Page 71
54
symptoms. Finally, the third section contains a scale for self-reported levels of functioning including
mobility, physical activity, and social activity. In order to obtain preference weights for the different
elements included in the QWB-SA form, a sample that included 239 females and 191 males with ages in
the range of 18 to 85 was used (Seiber et al., 2008). The lowest score obtained for a living individual in the
QWB-SA is 0.09. As argued by Kaplan et al. (1993), although the QWB-SA model has been used in several
studies, its length and difficulty in administration have limited its implementation.
2.6.3.6 Comparison between instruments
The instruments that were described in this section represent just a small group of the most used generic
instruments that have been proposed in the literature. The selection of one instrument over the others will
depend mostly on the objective of the evaluation (including the level of detail and accuracy required),
patient population, and types of treatments involved. Out of the various generic multi-attribute utility
instruments available, the EQ-5D appears to be the most used one (Richardson and Manca, 2004, Wisløff
et al., 2014). However, several researchers have proposed the use of more than one instrument in parallel
as a way to avoid biasing the results due to the use of a specific instrument to estimate the HRQoL.
Moock and Kohlmann (2008) provides a comparison among different preference-based quality-of-life
measures. In their study, EQ-5, 15D, HUI2, HUI3, SF-6D, and QWB-SA were included for comparison
using results from rehabilitation patients with musculoskeletal, cardiovascular, or psychosomatic disorders.
Other studies comparing different valuation methods can be found in the literature (Brazier et al., 2004,
Walters and Brazier, 2005, Marra et al., 2005, Longworth and Bryan, 2003, Sach et al., 2006, Petrou and
Hockley, 2005, Bharmal and Thomas, 2006, Lamers et al., 2006, van Stel and Buskens, 2006, Grieve et al.,
2009, Stavem et al., 2005, Barton et al., 2008, Hatoum et al., 2004, Tsuchiya et al., 2006, Mutebi et al.,
2011, Kontodimopoulos et al., 2012, Gaujoux-Viala et al., 2011).
2.6.3.7 Discussion and limitations
The use of metrics such as QALYs has been found to be helpful for estimating the impact of health
interventions. In order to properly approximate the real impact that an intervention can have in an individual
and society, the estimation of the Q or HRQoL becomes relevant. Generic and disease-specific instruments
have been proposed to help calculating the HRQoL of various health states. The main advantage of using
these instruments is that the same baseline is maintained for different interventions. Therefore, the
comparison among interventions is coherently facilitated. As argued in the literature, calculating HRQoL
can be used in several ways that include the monitoring of a patient’s health status over time, assessing the
seriousness of a particular health condition and its progression over time, providing evidence regarding the
Page 72
55
impact or medical effectiveness of different treatments, establishing health status baseline for different
populations of interest, and guiding resource allocation, among others (Rabin and de Charro, 2001). This
last point is critical for achieving an optimal impact on the population’s health given the scarce resources.
Moreover, studies have estimated that in the U.S., the number of life years saved could be doubled if
resources were properly allocated to those interventions which are relatively more cost-effective. Then, it
becomes substantially relevant to consider the cost-effectiveness of interventions as key factors for health
policy making in resource allocation decisions (Jamison et al., 2006).
Limitations of QALY
Although the QALYs have been extensively used for guiding health policy, there are still some challenges
and limitations that must be considered. In this sense, QALYs have been criticized not only on technical,
but also ethical grounds (Prieto and Sacristán, 2003). While traditional health economists have proposed
the maximization of health gains using QALYs, others have argued that fairness and equity in the
distribution of public resources are also important (Schwappach, 2002).
One of the technical limitations that has been discussed with respect to the use of QALY is that it does not
consider distributive factors such as relative priority in terms of age of life expectancy. For example, one
QALY weight the same for a child versus an older person. In order to overcome this, studies have been
presented to weight priorities accordingly. However, according to Schwappach (2002), it is still moderate
evidence that the general population tends to favor young over elderly in healthcare resource allocation.
Others have preferred to use DALYs as they account for particular age ranges. Another limitation of the
traditional use of QALY is that it does not discriminate with respect to the ranges in which a certain
treatment can act. For example, for QALYs, it is the same to improve Q from 0.2 to 0.4 than from 0.7 to
0.9. However, there is evidence that support that the general public tends to give priority to worst health
conditions (Ryynänen et al., 1999). Schwappach (2002) also argues that the assumption of proportionality
between the duration of the health improvement and social value can be misleading. In this sense, according
to QALY a health intervention that can improve life by 20 years is numerically twice as beneficial as
improving life by 10 years assuming the same benefits in the quality of life.
Even though the discussion about the proper use of QALYs is still not fully under agreement, it provides a
pragmatic and necessary guidance to improve complex decisions related to resource allocation (Garrison
Jr, 2009). Moreover, it has been stressed that formal models are necessary for informing the resource
allocation processes. However, formal evaluations should not be used as final answers, but as inputs for
further deliberations and fair decision processes (Nord et al., 2009).
Page 73
56
Chapter 3
QUANTIFYING COMPLEXITY IN TRANSLATIONAL
RESEARCH: AN INTEGRATED QUALITY FUNCTION
DEPLOYMENT – ANALYTIC HIERARCHY PROCESS
APPROACH
3.1 Introduction
The foundation of knowledge in healthcare and health-related sciences has been established through a
tremendous investment of financial support by governmental and private agencies. Yet, there is a large gap
between the knowledge discovery and routine practice. To address this gap, a science has emerged to
“systematically study how a specific set of activities and designated strategies are used to successfully
integrate an evidence-based public health intervention within specific settings” (CDC, 2007). Work in this
domain goes by many titles, including: translation research, translational research, knowledge translation,
knowledge exchange, technology transfer, implementation research, and dissemination and implementation
(D&I) research (Brownson et al., 2012).
The National Institutes of Health (NIH) explicitly made translational research a central priority on their
roadmap for medical research (Zerhouni, 2003). As a way to support and help the acceleration of
translational research, the NIH launched the Clinical and Translational Science Award (CTSA) program in
2006. In 2013, the CTSA Consortium was comprised of 62 medical research institutions across the nation
(CTSA, 2011). The National Center for Advancing Translational Sciences (NCATS), a part of the NIH,
requested a FY 2013 budget of $639 million to support the CTSA initiative (DHHS, 2013). The funding
opportunity announcement (RFA-TR-12-006) clearly states the mission:
“Under NCATS, the goal of the CTSA program remains focused on integrated academic homes for
the clinical and translational sciences that increase the quality, safety, efficiency and speed of
clinical and translational research, particularly for NIH supported research.”
Page 74
57
Some of the earliest work in translational research can be traced back to over 30 years ago (Wolf, 1974). In
the early 2000s translational research became a more widely used term and studied concept. Since then, a
number of publications and programs have been initiated to better understand and evaluate the importance
of translational research and its impact on healthcare outcomes (Woolf, 2008, Nathan, 2002, Drolet and
Lorenzi, 2011, Zerhouni and Alving, 2006).
Although the CTSA hubs supported over 5,000 publications during 2010 in diverse domains across the
translational research spectrum, there is still a lack of agreement on how to measure their impact on
healthcare outcomes. Evaluation methodologies must be proposed to ensure that the efforts placed on
translating basic research to clinical practice are effective and, ultimately, will have an impact on people’s
health. This lack of evaluation and tracking of translational research stems from the fact that it takes too
long to move from basic research to clinical practice. According to Westfall et al. (2007) it takes an average
of 17 years for new discoveries to become regular clinical practice. In addition, just 14% of those new
discoveries enter day-to-day clinical practice.
Discrepancies in the meaning of translational research have led to the generation of various models and
definitions. Although translational research can be defined in several different ways, the majority agree that
it is important for improving health (Woolf, 2008). The most popular models proposed to understand the
continuum of translational research are based on “T” phases or “translational blocks”. Sung et al. (2003)
described translational process in two phases. The first phase (T1) includes the knowledge gained from
laboratory testing to the development of new diagnosis and treatment tools. The second phase (T2)
translates those clinical studies to clinical practice. Due to the unclear scope of T2, a three-phase model
was proposed by Westfall et al. (2007) and Dougherty and Conway (2008). The third translational block
(T3) proposed accounts for the process necessary to implement knowledge into practice. This phase is also
known as the practice-based research block. Despite this additional phase added, some researchers argued
that the model was still incomplete and that the implementation of knowledge was made mostly through
physicians’ eyes not including other key practitioners in the translation and implementation of new
discoveries (Woolf, 2008). A new phase (T4) was included in the model offered by Khoury et al. (2007),
the phase of moving from health practice to healthcare outcome impact. The ultimate success of the T4
phase would be the improvement of public health and decreased cost of interventions (Kon, 2008). A
diagram to compare the four major translational research models was prepared by Trochim et al. (2011)
and is presented in Figure 3-1.
Currently, most of the research investments are made in the T1 phase. According to Moses et al. (2005),
more than half of the NIH budget is spent in basic research. However, no study has been proposed to
Page 75
58
demonstrate that this budget allocation results in a maximum impact on people’s health. Generating and
using evidence to wisely prioritize the use of resources can accelerate the translation of knowledge into
policy and practice (Glasgow et al., 2013). Therefore, evidence is needed to understand how to optimally
allocate resources to the different translational research phases to achieve better healthcare outcomes. In
order to maximize the impact made by the investments in T1, it is essential to provide an adequate
investment in T2 and beyond. Thus, even though some people regard translational research as strongly
associated only with the T1 phase, more effort is needed in the remaining phases to accelerate the movement
of new discoveries into practice (Woolf, 2008). The number of publications related to each translational
phase also denotes the disproportion of attention for the T2 phase and beyond. It is estimated that only 3%
of published researches are mainly focused on T2, T3, and T4 (Khoury et al., 2007). It creates imbalances
that could have negative consequences in health and economics if not properly considered (Woolf, 2007).
Consequently, it is imperative to understand that translational research is more than just discovering new
drugs or treatments. It has to be seen as a continuum from bench to bedside. This idea has been advanced
by many authors including Drolet and Lorenzi (2011), Khoury et al. (2007), Trochim et al. (2011) and
Woolf (2008).
Research to Practice Continuum
T1
Gene Discovery /
Health Application
T2
Health Application /
Evidence-based Guideline
T3
Guideline /
Health Practice
T4
Practice /
Health Impact
T1
Basic Biomedical Science /
Clinical Efficacy Knowledge
T2
Clinical Efficacy Knowledge /
Clinical Effectiveness Knowledge
T3
Clinical Effectiveness Knowledge /
Improved Health Care Quality and Value ad Population Health
T1
Bench /
Bedside
T2
Bedside /
Practice-Based Research
T3
Practice-based Research /
Practice
T1
Basic Biomedical Research /
Clinical Science and Knowledge
T2
Clinical Science and Knowledge /
Improved Health
Basic
Research
Clinical
Research
Research
Syntheses
Practice-Based
Research
Health
Impact
Khoury et al., 2007
Doughert & Conway, 2008
Westfall et al., 2007
Sung et al., 2000
Figure 3-1. Comparison among the four major translational research models (modified from Trochim et
al., 2011)
Page 76
59
It is essential to start generating agreement in translational research and its evaluation. In order to address
the lack of agreement in the various “T” models proposed, a general framework based on a process marker
model was presented by Trochim et al. (2011). This methodology consists of a series of process markers or
operational steps which are defined as a set of observable and measurable points specific to the study along
the translational research process. A main advantage of the process marker methodology is that it can be
used either by itself or under the “T” phases models previously mentioned. Even though the process marker
model provides a very clear framework to understand translational research and its steps, there is still a lack
of research determining the impact or contribution of each process marker to the overall goal of improving
and accelerating translation from basic to clinical practice.
In this chapter, we present an integrated Quality Function Deployment (QFD) – Analytic Hierarchy Process
(AHP) methodology to assess and quantify complexity in translational research. The first part of this
methodology serves as an extension of the process marker model since it provides a way to quantify the
importance of each operational step to accelerate translational research. In addition, the proposed
methodology captures the dynamic impact of different drivers along the translation from bench to bedside.
Finally, valuable insights are obtained to generate guidelines to better allocate resources and efforts when
moving from new discoveries to health outcomes.
3.2 Methodology
In this section, we introduce and explain in detail the three-phase methodology proposed to quantify
complexity in translational research. In the first phase, the objective is to identify the markers for each one
of the phases of translational research as well as the technical requirements or drivers for those markers.
The results obtained from this phase are used to present an extended process marker model. The second
phase will use the AHP methodology to determine the absolute and relative importance of the markers for
each “T” phase with respect to their ability to produce an impact on translational research. Finally, in the
third phase, an HOQ model will be developed as a way to find correlations between the technical
requirements and also the importance of those technical requirements for each translational research phase.
Page 77
60
The variables and notation that will be used in the methodology are as follows:
𝑀𝑖,𝑗: 𝑀𝑎𝑟𝑘𝑒𝑟 𝑗 𝑖𝑛 𝑝ℎ𝑎𝑠𝑒 𝑖,
𝑊𝑖,𝑗: 𝑟𝑒𝑙𝑎𝑡𝑖𝑣𝑒 𝑤𝑒𝑖𝑔ℎ𝑡 𝑓𝑜𝑟 𝑚𝑎𝑟𝑘𝑒𝑟 𝑗 𝑖𝑛 𝑝ℎ𝑎𝑠𝑒 𝑖
𝑅𝑘: 𝑡𝑒𝑐ℎ𝑛𝑖𝑐𝑎𝑙 𝑟𝑒𝑞𝑢𝑖𝑟𝑒𝑚𝑒𝑛𝑡 𝑘
𝑟𝑘,𝑙: 𝑐𝑜𝑟𝑟𝑒𝑙𝑎𝑡𝑖𝑜𝑛 𝑏𝑒𝑡𝑤𝑒𝑒𝑛 𝑡𝑒𝑐ℎ𝑛𝑖𝑐𝑎𝑙 𝑟𝑒𝑞𝑢𝑖𝑟𝑒𝑚𝑒𝑛𝑡 𝑘 𝑎𝑛𝑑 𝑡𝑒𝑐ℎ𝑛𝑖𝑐𝑎𝑙 𝑟𝑒𝑞𝑢𝑖𝑒𝑚𝑒𝑛𝑡 𝑙
𝑃𝑖,𝑘: 𝑎𝑏𝑠𝑜𝑙𝑢𝑡𝑒 𝑤𝑒𝑖𝑔ℎ𝑡 𝑜𝑓 𝑡𝑒𝑐ℎ𝑛𝑖𝑐𝑎𝑙 𝑟𝑒𝑞𝑢𝑖𝑟𝑒𝑚𝑒𝑛𝑡 𝑘 𝑖𝑛 𝑝ℎ𝑎𝑠𝑒 𝑖
𝑝𝑖,𝑘: 𝑟𝑒𝑙𝑎𝑡𝑖𝑣𝑒 𝑤𝑒𝑖𝑔ℎ𝑡 𝑜𝑓 𝑡𝑒𝑐ℎ𝑛𝑖𝑐𝑎𝑙 𝑟𝑒𝑞𝑢𝑖𝑟𝑒𝑚𝑒𝑛𝑡 𝑘 𝑖𝑛 𝑝ℎ𝑎𝑠𝑒 𝑖
𝑐𝑗,𝑘: 𝐼𝑚𝑝𝑎𝑐𝑡 𝑜𝑓 𝑡𝑒𝑐ℎ𝑛𝑖𝑐𝑎𝑙 𝑟𝑒𝑞𝑢𝑖𝑟𝑒𝑚𝑒𝑛𝑡 𝑘 𝑖𝑛 𝑚𝑎𝑟𝑘𝑒𝑟 𝑗
where i = 1 … I, representing the i-th “T” phase, j = 1 … J, representing the j-th marker, k = 1 … K and l
= 1 … K, representing the k-th and l-th technical requirement respectively.
3.2.1 Identification of markers and technical requirements
As stated previously, the main objective of this phase is to identify a list of markers for each phase in the
translational research process and the technical requirements affecting those markers or operational steps.
Brainstorming will be the primary tool to generate a list of process markers and technical requirements.
The recommended brainstorming group size is at least 5 and at most 10 participants (Osborn, 1963). This
group size is adequate to identify the most important elements from various participants’ opinion.
In order to reduce the risk of cognitive burden in the use of AHP, the maximum number of markers per “T”
phase and technical requirements should be limited to 9. This number is known as Miller’s law which
determines that 7 ± 2 elements is the upper limit of human cognitive capacity to process information and
make inferences in a reliable and accurate manner (Miller, 1956). Additionally, this number was validated
by Saaty and Ozdemir (2003) as a way to reduce inconsistencies in judgment. Therefore, valid inferences
can be made from the results obtained from the pairwise comparison.
In the case of having a list of markers or technical requirements exceeding 9 elements, Borda count
methodology could be used to determine the 9 most important elements. In the Borda count methodology,
each evaluator ranks a list of n elements on a descending order of importance. Then, n points are assigned
to the first element in the list, the second element receives n-1 points and so on. The last element in the list
receives 1 point. Finally, the points are summed up for each element and the 9 elements with most points
are selected to be part of the final list.
Page 78
61
3.2.2 Determining marker weights for each translational research phase
In the second phase of the proposed methodology, marker weights are determined for each translational
research phase using the AHP approach. From the marker list (i.e., operational steps in the translational
research process) obtained in phase 1, the relative importance of each marker is calculated using a pairwise
comparison among them. In this phase, it is recommended to check for consistency to reduce judgment
inconsistencies and assure valid results.
3.2.2.1 Pairwise comparison matrix
A pairwise comparison matrix needs to be built to further calculate the weights of each marker. Each pair
of markers is compared in terms of its importance and contribution to the final goal of producing impact on
its corresponding translational research phase, and therefore, on people’s health.
The evaluator is asked in a scale from 1 (equally important) to 9 (extremely more important) to determine
the importance of one marker over the other. Table 3-1, contains an explanation of the intensity importance
used for the pairwise comparison between the markers.
Table 3-1. AHP scale definition
Intensity of
Importance Definition Explanation
1 Equal importance Two activities contribute equally to the objective
3 Moderate importance According to experience an activity is slightly more
important than other
5 Strong importance According to experience an activity is strongly more
important than other
7 Very strong or
demonstrated importance
According to experience an activity is favored very
strongly over the other,
9 Extreme importance Evidence shows that an activity is absolutely more
important than the other
2,4,6,8 Intermediate values
Page 79
62
From the results obtained, a pairwise comparison matrix A is constructed. Where a1,2 represents how much
more important is marker 1 with respect to marker 2 in terms of their impact on translation.
𝐴 =
[
1 𝑎1,2 𝑎1,3
𝑎2,1 1 𝑎2,3
𝑎3,1 𝑎3,2 1
… … 𝑎1,𝑀
… … 𝑎2,𝑀
… … …… … …… … …
𝑎𝑀,1 𝑎𝑀,2 …
. . . … …… . . . …… … 1 ]
This matrix is used to calculate the weights or relative importance of the markers, and to check the level of
consistency of the evaluator. These procedures were explained in section 2.2.3.
3.2.3 Building the house of quality
The last phase of the proposed methodology is to “build the house of quality”. The main goal in this section
is to use the HOQ tool to find the correlation among technical requirements, contribution of each technical
requirement and its impact on the markers, and finally, calculate the importance of the technical
requirements for each translational research phase. This section will be divided into three subsections:
identifying correlation; identifying the impact of technical requirements; and calculation of the importance
of the technical requirements.
3.2.3.1 Correlation between technical requirements
From phase 1 in our methodology, we have already identified a list of technical requirements. In this sub-
section, the objective is to quantify the correlation among those technical requirements. This information
is recorded in the “roof” of the HOQ. The evaluators have to decide whether two technical requirements
are strongly positively correlated, positively correlated, non-correlated, negatively correlated or strongly
negatively correlated. The procedure should be repeated for each pair of technical requirements. It is
recommended to use the numbers provided in Table 3-2 to complete the pairwise comparisons. For instance,
let’s assume that ‘Administrative Support’ and ‘Regulations and Standards’ were identified as two of the
technical requirements. If the evaluator believes that those drivers are strongly positively correlated, then
the correspondent cell should be filled with a ‘9’.
Page 80
63
Table 3-2. Correlation intensity
Correlation Number Symbol
Strong Positive 9
Positive 3
Negative -1
Strong Negative -3
3.2.3.2 Relationship matrix between technical requirements and markers
In this sub-section the objective is to obtain the relationship between the technical requirements and the
markers, in other words, it will quantify the impact of the drivers on the markers. The evaluators respond
whether the relationship between each TR-Marker pair is Strong (9), Medium (3), Weak (1), or No
relationship (0). This information is recorded in the relationship matrix which represents the body of the
HOQ. The information generated in this step is then used to calculate the importance of the technical
requirements on each translational research phase.
3.2.3.3 Technical requirement weights
This sub-section shows how to calculate the relative importance of the technical requirements for each
translational research phase. The calculated weights are located at the bottom part of the HOQ model. After
obtaining the absolute weights (𝑃𝑖,𝑘) and relative weights (𝑝𝑖,𝑘), rankings for each technical requirement
can be easily obtained by arranging them in descending order with respect to their weights. The formulas
to calculate absolute and relative importance are the following:
𝑃𝑖,𝑘 = ∑𝑐𝑗,𝑘 ∗ 𝑊𝑖,𝑗 ∀𝑖 ∀𝑘
𝑀
𝑗=1
Eq. 31
𝑝𝑖,𝑘 =1
∑ 𝑃𝑖,𝑙𝐾𝑙=1
∑𝑐𝑗,𝑘 ∗ 𝑊𝑖,𝑗 ∀𝑖 ∀𝑘 Eq. 32
𝑀
𝑗=1
From this analysis, valuable insights can be obtained about the relative importance of the technical
requirements for each translational phase. This can serve as evidence-based guidelines for allocation of
Page 81
64
resources and efforts. In other words, priorities in investments can be determined to achieve a faster impact
on health outcomes. An illustrative summary of the methodology proposed is shown in Figure 3-2.
Figure 3-2. QFD-AHP Methodology Diagram
3.3 Case Study: a Primary Care-based Weight Control Intervention
A case study to illustrate the usability of the proposed QFD-AHP methodology is shown in this section.
The case study used is based on a pilot randomized controlled trial conducted by Dr. Jennifer Kraschnewski
(JK), a physician in the Penn State College of Medicine, to evaluate the impact of a volunteer peer-led
intervention for weight control in primary care. The main objective of the research is to determine the short-
term efficacy of a primary care-based weight control intervention in which successful volunteer peers
deliver a group-based program.
In order to facilitate the usability of the proposed methodology, a completely automated excel-based
template was created to obtain and collect the results. For illustrative purposes only, a 3T model was applied
by a single evaluator (JK) and the preference results are based on her opinion. More instances will be
required in a future to avoid the bias, reduce inconsistencies, and provide robust results to make valid
inferences.
Page 82
65
3.4 Results
3.4.1 Identification of process markers and technical requirements
The process markers and technical requirements identified for the obesity program are shown in Table 3-3
and Table 3-4 respectively. Most of the markers and technical requirements are generalizable and could be
applied consistently in various initiatives and translational research efforts. Avoiding the lack of generality
in the identification of process markers and technical requirements will serve, in a future, to compare
interventions across different fields and identify appropriate benchmarks.
Table 3-3. Markers for the obesity peer-led intervention
Phase Code Process Marker Description
T1
M1,1 Pilot proposal
M1,2 Pilot funded
M1,3 Study proposal
M1,4 Study proposal funded
M1,5 Lab intervention
M1,6 Result analysis
M1,7 Guidelines for clinical trial
T2
M2,1 Develop obesity program and select target
M2,2 Submit IRB
M2,3 Recruit volunteers
M2,4 Training volunteers
M2,5 Program implementation
M2,6 Measure efficacy in sample population
M2,7 Larger sample and validity
M2,8 Patenting program
M2,9 Publish results
T3
M3,1 Pressing for public health reform
M3,2 Implementing research
M3,3 Study dissemination
M3,4 Population study and measure effectiveness on different populations
M3,5 Dissemination and best practices included in health policy
M3,6 Healthcare outcomes
Page 83
66
Table 3-4. Technical requirements for the obesity peer-led intervention
Code Name
R1 Collaboration networks
R2 Administrative support
R3 Funding availability
R4 Community engagement
R5 Information technology
R6 Regulation and standards
R7 Equipment availability
R8 Organizational leadership
R9 Multidisciplinary team capacity
3.4.2 Pairwise comparison matrices, consistency and weights
A pairwise comparison matrix was constructed to compare the markers for each translational research
phase. Matrices for T1, T2 and T3 are shown in Table 3-5, 3-6, and 3-7 respectively.
Table 3-5. T1 – Pairwise comparison matrix
T1 M1,1 M1,2 M1,3 M1,4 M1,5 M1,6 M1,7
M1,1 1 3 3 5 3 3 3
M1,2 1/3 1 1 5 3 3 3
M1,3 1/3 1 1 3 5 5 5
M1,4 1/5 1/5 1/3 1 3 3 3
M1,5 1/3 1/3 1/5 1/3 1 1 1
M1,6 1/3 1/3 1/5 1/3 1 1 1
M1,7 1/3 1/3 1/5 1/3 1 1 1
From Table 3-5, it can be said, for instance, that Pilot proposal (M1,1) is moderately more important than
Study proposal (M1,3) and that Lab interventions (M1,5) is equally important than Result analysis (M1,6.). A
similar procedure to compare the importance of one marker over the other can be made for the following
phases.
Page 84
67
Table 3-6. T2 – Pairwise comparison matrix
T2 M 2,1 M 2,2 M 2,3 M 2,4 M 2,5 M 2,6 M 2,7 M 2,8 M 2,9
M2,1 1 1 5 3 3 5 7 1 7
M2,2 1 1 5 3 3 5 7 1 7
M2,3 1/5 1/5 1 1/3 3 3 5 1 7
M2,4 1/3 1/3 3 1 1/3 3 3 1 5
M2,5 1/3 1/3 1/3 3 1 3 3 1 5
M2,6 1/5 1/5 1/3 1/3 1/3 1 1 1 5
M2,7 1/7 1/7 1/5 1/3 1/3 1 1 1/3 1
M2,8 1 1 1 1 1 1 3 1 5
M2,9 1/7 1/7 1/7 1/5 1/5 1/5 1 1/5 1
Table 3-7. T3 – Pairwise comparison matrix
T3 M3,1 M3,2 M3,3 M3,4 M3,5 M3,6
M3,1 1 3 5 5 7 7
M3,2 1/3 1 3 3 5 5
M3,3 1/5 1/3 1 3 3 3
M3,4 1/5 1/3 1/3 1 1 1
M3,5 1/7 1/5 1/3 1 1 1
M3,6 1/7 1/5 1/3 1 1 1
From the consistency analysis, it can be said that all three matrices are consistent. Consistency ratio values
for each pairwise comparison matrix are lower than 0.1, and therefore, the consistency of the evaluator is
acceptable. These values are shown in Table 3-8.
Page 85
68
Table 3-8. Consistency analysis values
Translational
Phase
T1 T2 T3
n 7 9 6
CI 0.111 0.139 0.039
RI 1.320 1.450 1.240
CR 0.084 0.096 0.032
After checking consistency, the weights for each marker were calculated and are shown in Table 3-9.
Table 3-9. Marker weights
T1 Weight T2 Weight T3 Weight
M1,1 0.314 M2,1 0.223 M3,1 0.454
M1,2 0.187 M2,2 0.223 M3,2 0.239
M1,3 0.218 M2,3 0.113 M3,3 0.135
M1,4 0.108 M2,4 0.103 M3,4 0.063
M1,5 0.057 M2,5 0.109 M3,5 0.054
M1,6 0.057 M2,6 0.055 M3,6 0.054
M1,7 0.057 M2,7 0.031
M2,8 0.120
M2,9 0.022
According to the weights obtained for T1, it can be said that for the evaluator, marker M1,1 Pilot proposal is
the operational step with the highest relative importance, having a weight of 0.314. For T2, according to
the evaluator’s opinion, M2,1 Develop obesity program & select target and M2,2 Submit IRB are the most
important operational steps with a weight of 0.223 each. Finally, M3,1 Pressing for public health reform, was
the marker with the highest relative importance with a weight of 0.454. From the relative weights obtained,
many inferences can be made about what are the critical operational steps in this obesity peer-led
intervention program. The allocation of efforts can be conducted in a manner that is consistent with the
data.
Figure 3-3 shows an extended process marker model in which the height of the bars represents the relative
importance of the markers. It must be noticed that the relative importance is graphically valid for markers
within its corresponding translational phase. Therefore, we are not trying to evaluate how important one
Page 86
69
translational phase compared to the others but rather how important the different operational steps are
within each translational phase. However, if the relative importance of each phase over the others is
available (using AHP, for example), the weights could have been normalized to graphically reflect the
importance of the markers not only in terms of its own phase, but in terms of its impact on the overall
process of accelerating translational research from bench to bedside.
Figure 3-3. Extended process marker model
3.4.3 Correlation among TRs and relationship among TR-marker pairs
In Figure 3-4, the correlation between each pair of technical requirements is shown. It can be seen, for
instance, that according to the evaluator, R1 Collaboration networks is strongly correlated to R5 Information
technology. On the other hand, there is no correlation between R6 Regulations and standards and R7
Equipment availability. The relationship matrixes for T1, T2 and T3 are shown in Table 3-10, Table 3-11,
and Table 3-12 respectively.
Page 87
70
R1 R2 R3 R4 R5 R6 R7 R8 R9
Co
llab
ora
tion n
etw
ork
s
Adm
inistra
tive s
up
port
Fu
ndin
g a
vaila
bility
Co
mm
un
ity e
ngag
em
en
t
Info
rmatio
n te
chn
olo
gy
Regu
latio
n a
nd
sta
nd
ards
Eq
uip
men
t availa
bility
Org
aniz
atio
nal le
ad
ersh
ip
Mu
ltidisc
iplin
ary te
am
cap
acity
Figure 3-4. Technical requirements correlation
Table 3-10. Relationship matrix for T1
Marker Weight R1 R
2 R
3 R
4 R
5 R
6 R
7 R
8 R
9
M1,1
0.314 3 1 3 1 1 1 1 1 3
M1,2
0.187 3 3 9 1 1 1 3 3 3
M1,3
0.218 3 1 1 1 1 1 3 3 3
M1,4
0.108 3 3 9 1 1 1 1 3 3
M1,5
0.057 3 1 3 1 1 3 9 3 3
M1,6
0.057 3 1 3 1 3 1 1 1 3
M1,7
0.057 3 1 3 1 1 1 1 3 3
Page 88
71
Table 3-11. Relationship matrix for T2
Marker Weight R1 R
2 R
3 R
4 R
5 R
6 R
7 R
8 R
9
M2,1
0.223 3 1 3 1 1 1 1 3 3
M2,2
0.223 1 3 1 1 1 3 1 1 1
M2,3
0.113 3 1 3 3 1 1 1 3 3
M2,4
0.103 3 1 3 3 1 1 1 1 3
M2,5
0.109 3 3 9 3 1 3 3 3 3
M2,6
0.055 3 3 9 3 1 3 3 1 3
M2,7
0.031 3 3 9 9 1 3 3 3 3
M2,8
0.120 3 3 9 3 1 1 1 3 3
M2,9
0.022 3 3 3 1 1 1 1 3 3
Table 3-12. Relationship matrix for T3
Marker Weight R1 R
2 R
3 R
4 R
5 R
6 R
7 R
8 R
9
M3,1
0.454 3 1 3 3 1 1 1 3 9
M3,2
0.239 3 3 9 9 1 1 3 3 9
M3,3
0.135 9 3 9 9 1 1 1 3 9
M3,4
0.063 9 3 9 3 1 3 3 3 9
M3,5
0.054 9 3 9 9 1 1 1 3 9
M3,6
0.054 3 1 3 3 1 1 1 3 3
According to the evaluator, the relationship between M1,5 Lab intervention and R7 Equipment availability
is strong (9), while the relationship between M1,5 Lab intervention and R2 Administrative support is weak
(1). From the relationship matrix, valuable inferences can be made about the most and least important
technical requirements required dynamically by each marker on each translational phase. This will also
allow understanding that translational research is dynamic and its needs change over time. The impact of
the technical requirements on the markers is not static; it will vary dynamically to fulfill current needs. For
Page 89
72
instance, according to the evaluator’s opinion, R7 Equipment availability is strongly related to M1,5 Lab
intervention. On the other hand, it is weakly related with M1,1 Pilot proposal. This type of information
indicates that coordination of technical requirements is highly necessary to help the acceleration of
knowledge translation.
3.4.4 Determining the importance of each technical requirement in translational research
With the information previously collected, the importance or impact of the technical requirements on each
one of the phases in translational research can be quantified. The relative weights obtained are shown in
Table 3-13.
Table 3-13. Technical requirements relative weights
R1 R
2 R
3 R
4 R
5 R
6 R
7 R
8 R
9
Phase
T1 0.15 0.08 0.22 0.05 0.06 0.06 0.12 0.11 0.15
T2 0.13 0.10 0.22 0.11 0.05 0.09 0.07 0.11 0.13
T3 0.14 0.06 0.18 0.17 0.03 0.03 0.05 0.09 0.26
As expected, R3 Funding availability was found to be one of the most important technical requirements for
the markers to succeed on each T phase. According to the evaluator, R1 Collaboration network and R9
Multidisciplinary team capacity are crucial for T1 and T2. For T3, it is also important to consider R4
Community engagement to accelerate the translation of new discoveries to practice. The relative importance
or impact of the technical requirements on each “T” phase is shown in Figure 3-5.
From these results, useful guidelines of what and when technical requirements are critical for each phase
can be easily obtained. Thus, resources can be spent wisely throughout the large-scale, complex, and
dynamic translational research process.
Page 90
73
A completed version of the HOQ developed is shown in Appendix A.
Figure 3-5. Relative importance for technical requirements on each "T" phase
3.5 Discussion
Mapping and evaluating translational research is essential to accelerate the implementation of new
discoveries into practice. Current translational research models provide little to no clues on how to evaluate
and quantify complexity of the long process of moving from basic science to health outcomes. Trochim et
al. (2011) address the discrepancies in the meaning of translational research by providing a process marker
model to map its continuum nature. Their framework aims to identify a set of clearly definable and
measurable steps. An advantage of the process marker model is that it can be either used independently –
i.e., just using operational steps – or under the “T” phases models used in translational research. Although,
their framework helps identifying the different operational steps along the translational research process,
there exists a need for a robust methodology to quantify this complexity and evaluate the importance or
impact of each one of those operational steps on the acceleration of discoveries to practice. In the first part
of the proposed methodology, a robust framework is presented to map translational research and determine
the relative importance of the operational steps within the process. Therefore, this approach can be seen as
an extended process marker model.
Additionally, the proposed QFD-AHP methodology includes many features that have not been previously
explored in translational research. For example, it allows for quantifying both the tangible and intangible
in a structured way. By understanding the importance and impact of each marker and the drivers that make
them succeed, resource allocation can be conducted in a smart manner based on evidence. Thus, a more
accurate strategic guideline to spend funds, effort, time and resources in the different phases of translational
0
0.05
0.1
0.15
0.2
0.25
0.3
R1 R2 R3 R4 R5 R6 R7 R8 R9
T1
T2
T3
Page 91
74
research can be generated. As a consequence, we anticipate that limited resources could be wisely used to
support an accelerated, but smoother, journey from basic research to improving public health.
Although the main objective of the proposed methodology is to evaluate and determine the importance of
the operational steps and their drivers in translational research, some other useful features are worthy of
mention. One example is the possibility of identifying similar projects based on the values obtained for the
HOQ model. Usually, similar operational steps and technical requirements are present in various types of
researches and fields. Further analysis could be conducted to identify similar projects based on similarity
metrics. This approach could facilitate the sharing of best practices for similar studies, both between and
within a field. Additionally, collaboration of intra and cross-disciplinary studies could be promoted based
on evidence. Another advantage that can arise from identifying similar projects based on the QFD-AHP
methodology is the generation of benchmarks for each operational step. Although we did not provide
specific metrics to evaluate markers, similar best practices of procedures could be shared and adapted from
different projects and compared against the identified benchmarks.
To date, most of the engineering-based tools that have been applied successfully to solve healthcare-related
problems have been framed under an operational or tactical vision. Naturally, since translating research
from bench to bedside takes a very long time, operational and tactical tools could not be used to understand
and cover this scope under a systemic view. The QFD-AHP approach will allow understanding and
quantifying complexity in the large-scale, dynamic translational research process from a more strategic
perspective. Finally, future research is needed to incorporate more case studies that allow the use of this
framework in practice, and therefore, take advantage of all the potential benefits and applications already
mentioned.
3.6 Conclusion
The proposed QFD-AHP methodology can effectively quantify the complexity in translational research.
This well-structured methodology is robust and can be generalizable for various translational research
programs. From the results obtained, the dynamic impact of technical requirements on the process markers
can be identified. Additionally, it provides insights to coordinate those technical requirements to fulfill the
needs at different “T” phases. The evidence obtained from the QFD-AHP methodology could be used to
generate guidelines to assure that the proven best-known clinical procedures are transferred into health
policy and impacting health outcomes.
Page 92
75
In summary, the proposed methodology could contribute significantly to generate agreement on the
important markers and technical requirements to be included when mapping and quantifying complexity in
translational research, allocate resources wisely, identify benchmarks within and between disciplines,
identify similar research projects to promote collaboration and share best practices. All the potential benefits
mentioned will aim to move from basic research to day-to-day clinical practice in a more effective and
efficient manner.
Page 93
76
Chapter 4
EVALUATING COLLABORATION AND MULTI-
DISCIPLINARITY AND THEIR IMPACT ON
TRANSLATIONAL RESEARCH
4.1 Introduction
Collaboration is a key element in translational research (Marincola, 2003, Long et al., 2012, Bennett et al.,
2010). The National Institutes of Health (NIH) has explicitly made translational research a central priority
on their roadmap for medical research (Zerhouni, 2003). One of the initiatives to support team science and
collaboration efforts is the Clinical and Translational Sciences Award (CTSA) with a strategic goal to
enhance collaboration across the consortium. In order to achieve this goal, strong intra-institutional
collaboration networks are required and must be properly supported by the institutions.
Translational research networks aim to provide conditions under which research can be efficiently initiated
and spread. In addition, these networks can strategically bridge the gap between basic research and clinical
practice through interdisciplinary collaboration (Long et al., 2012). Further, given that disease etiologies
are multifactorial, collaboration across multiple disciplines is necessary to integrate medical research into
primary care (Carey et al., 2005, Calhoun et al., 2012). As a consequence, the study of multidisciplinary
teams has become increasingly investigated in the past years (Calhoun et al., 2012). The key hypothesis
behind this argument is that valuable synergies can be obtained by merging the expertise gained from
various fields (Choi and Pak, 2006, Knoben and Oerlemans, 2006). In consideration of these facts, the
CTSA consortium is encouraging its affiliated academic and medical institutions to adopt frameworks for
assessing collaboration.
Page 94
77
Although understanding collaboration networks is critical for developing institutional structures that
support and enhance collaboration, its complexity has resulted in a lack of truly meaningful metrics for its
evaluation. In this Chapter, Social Network Analysis (SNA) principles are used to visualize collaboration
networks and provide different mathematical-based metrics. These metrics may be used to strategically
identify areas of opportunity in the network to accelerate collaboration, and therefore, impact the pace at
which new discoveries become clinical practice.
A profile research networking platform was initially developed at Harvard to speed the process of finding
potential collaborators with specific areas of expertise. Currently, most of the affiliated institutions have
implemented profile platforms that contain relevant information about their associated researchers. These
tools are expected to serve as drivers to accelerate the formation of collaborative teams, and ultimately,
accelerate translational research (Gewin, 2010).
In this chapter, a SNA-based methodology is presented for assessing collaboration. In order to illustrate its
use, a case study on obesity research is presented.
4.2 Methodology
This section proposes a methodology to understand, assess, and discovery interesting patterns among
collaborators in a health field or health area of research. The proposed methodology includes four phases:
1) Identification of researchers in the field; 2) Classification of Expertise; 3) Publication and Authorship
metrics; and 4) SNA to understand inter-disciplinary collaboration based on visualization of networks and
analysis of interesting, meaningful metrics. An overview of the proposed methodology is illustrated in
Figure 4-1.
The methodology starts with the category named “Identification of Researchers”. It includes the selection
of the health field in which collaboration should be assessed. This search could also include a multi-field
searching in case of interest in an emerging multi-disciplinary health field. Keywords related to the health
field under analysis must be gathered to guide the identification of researchers. This identification could be
conducted directly through the institutional profile directory. Currently, most of the CTSA hubs have
implemented profile tools to enhance collaboration among their affiliated researchers. Typically, those
searching platforms contain directory information such as affiliation, department, academic rank, and areas
of interest.
Page 95
78
Identification of
Researchers
Selection of Health
Field
Keywords related to the
Health Field
Identify Researchers
through Institution
Profile Directory
Search Engine
Search keywords in a
Search Engine
Refine List of
Researchers
Retrieve publications
database and clean data
Expertise Classification
Categorize researchers
according to expertise
Data Preparation
Create collaboration
matrix ad database
structure
Social Network Analysis
Intra-institutional
collaboration networks
Interesting Metrics and
Clustering
Selection of SNA
software
Figure 4-1. Overview of methodology to assess intra-institutional collaboration
The second phase is named “Search Engine”. Its main objective is to refine the list of researchers and
retrieve their publications to further bibliometric analysis. Various search engines such as PubMed or the
Web of Sciences can be used to easily conduct the advanced searching and retrieve publication information.
A database is generated for the identified researchers and their publications related to the health field under
analysis.
Based on the information retrieved, researchers can be classified into groups according to their expertise.
This will be helpful to analyze collaboration patterns among different types of researchers. In addition, it
will serve to generate an overall understanding of potential leaders in the field. Due to the difficulty of
defining expertise, some broad assumptions or rules are needed. These rules could incorporate the number
of publications, average citations, date of the first publication in the field, etc. In parallel, a collaboration
matrix must be created to provide a structured database of co-authorships in an adjacency matrix format.
This is a symmetric matrix that contains pairwise publications based on co-authorship.
Finally, a SNA is conducted to identify collaboration patterns and visualize collaboration networks.
Currently, various SNA software are available, most of them free such as Pajek and NodeXL. Such software
will graph the collaboration networks, identify different collaboration patterns, and calculate interesting
metrics such as degree centrality, betweenness centrality, and density, among others.
4.3 Case Study: Collaboration in Obesity Research
Obesity is a major health issue in the United States. Its multi-factorial character makes multi-disciplinary
collaboration a relevant driver to truly understand the causes and potential interventions to support obesity
Page 96
79
research. In this section, an illustration of the proposed approach is presented to assess intra-institutional
collaboration networks in obesity research.
4.3.1 Identification of obesity researchers
The first step was to identify researchers whose main area of research is obesity or related areas. The initial
list of obesity researchers was obtained through the Penn State Profiles webpage, available on the PSU
Clinical and Translational Sciences Institute (CTSI) website. Typical directory information such as
affiliation, department and academic rank were obtained in addition to a list of collaborators and
recommended similar researchers based on areas of interests, affiliations, and co-authorships. Since the
Penn State Profiles application was recently launched, when it was acceded, in October (2013), it only
contained the faculty members from the Penn State Hershey campus. However, faculty members as well as
select staff scientists from other campuses will be added soon to the system. The publications database used
by the Penn State Profile is updated monthly directly from PubMed.
After obtaining the initial list of obesity researchers, a more refined list was elaborated contrasting the
results against a list referred from the Web of Knowledge (WoK) search platform. The search conducted
included keyword in obesity fields and was restricted to the participation of at least one author affiliated to
PSU with no date restriction. Finally, a list of publications was retrieved, cleaned, and saved as the starting
database for further analysis.
4.3.2 Classification of expertise
The refined list of obesity researchers was used to categorize them into three groups based on their level of
expertise, defined as knowledge and skills (Todd, 2012). Due to the difficulty and lack of widely accepted
techniques to measure level of expertise, three main factors are proposed to categorize the researchers:
number of publications, average number of citations per publication, and year of first publication related to
obesity. The classification criteria mentioned are shown in Table 4-1.
Table 4-1. Expertise classification criteria
Group #
Publications
Average
citations
Year of 1st
publication
Expert >= 10 >=10 < 2005
Page 97
80
Semi-Expert >= 5 >=5 < 2010
Young
Investigators Otherwise
The proposed classification is valuable to gain understanding and assess if different collaboration patterns
are obtained according to the level of expertise of the researchers. After classifying the authors according
to their level of expertise, different basic metrics were obtained to assess collaboration. Metrics such as co-
authorship, citation trends, frequently-used journals to disseminate, and average number of citations per
publication were calculated.
4.3.3 Social network analysis for obesity researchers
Bibliometric - a set of quantitative methods to analyze academic literature - was used to generate a database
that contains relevant information about the authors including affiliations, department, academic rank, and
publications. The data entries were obtained from multiple sources such as Penn State Profile, WoK and
Google Scholar. This database was cleaned, checked for integrity and analyzed using Microsoft Excel
2010® to create the collaboration matrixes based on co-authorship. NodeXL – a SNA software based on
Excel - was used to generate the collaboration network structure for individual researchers as well as for
affiliations, ranks, and interesting clusters.
Networks were graphed and analyzed to understand the dynamics of the collaboration patterns between
researchers and also among department affiliations. As usual in SNA, the vertexes represent the entities
(i.e., researchers or departments) under analysis and the edges represent the connection between two
different entities. In general, the algorithm used to generate the network graph was based on the Harel-
Koren Fast Multiscale algorithm (Harel and Koren, 2001). Cluster algorithms were also used to facilitate
the interpretation of the networks and to make valuable inferences from them. In most of the graphs
presented, the size of the vertexes was drawn proportionally to the number of publications. Consequently,
the width of the edges represents the intensity of the collaboration between two entities. Interesting metrics
such as betweenness centrality, in-degree centrality, and density are calculated and interpreted once
pertinent.
4.3.4 Cross-institutional collaboration
Page 98
81
The group of the obesity researchers categorized as experts in the field was used to investigate their cross-
institutional collaboration networks in more detail. A new database was created to contain the new list of
obesity experts and their external collaborators including intra-institutional and cross-institutional
individuals. The database created was then transformed into collaboration matrixes for their evaluation.
Different interesting metrics were calculated and network graphs were developed to understand patterns
among cross-institutional collaboration using NodeXL.
4.4 Results
A list of 152 obesity researchers was retrieved from Penn State Profiles after querying key terms related to
obesity. The list of 152 obesity researchers was refined based on results obtained from the WoK. Finally, a
list of 114 researchers was generated, out of which 44 of them have published more than five articles. Figure
4-2, shows the researcher identification code, number of publications, and average number of citations per
publication for those obesity researchers with more than 5 publications related to obesity. According to the
search conducted, 779 papers were published by the 114 authors in obesity related areas. Those have been
cited a total of 28,412 times, with an average number of citations per item of 36.5, and an h-index of 91 (ie,
91 of the articles have been cited 91 times). Based on the stated categorization rules for expertise, 12
researchers were defined as experts, 22 as semi-experts and 80 as new investigators.
Figure 4-2. Number of publications and average number of citations per publication
The articles authored by the obesity experts group have been cited an average of 61 times, those authored
by obesity semi-experts have been cited an average of 28 times and those authored by obesity new-
investigators are on average cited 16 times.
Page 99
82
Out of the 779 articles analyzed, 264 were published in the 15 most popular journals shown in Table 4-2,
which additionally defines the journal’s impact factor and total number and percent of manuscripts
published of the 779 articles.
Table 4-2. 15 Most frequently-used journals
Journal Title IF Count %
Am J Clin Nutr 6.5 35 13.3%
J Am Diet Assoc 3.8 33 12.5%
FASEB J 5.7 20 7.6%
Int J Obesity 5.2 20 7.6%
Obesity 3.9 18 6.8%
Appetite 2.5 17 6.4%
J Clin Endocrinol Metab 6.4 17 6.4%
J Nutr 4.2 17 6.4%
Sleep 5.1 17 6.4%
Physiol Behav 3.2 15 5.7%
Am J Physiol Endocrinol Metab 4.5 14 5.3%
Diabetes 7.9 11 4.2%
Obes Res 3.9 11 4.2%
Pediatrics 5.1 11 4.2%
Obes Surg 3.1 8 3.0%
4.4.1 Intra-institutional collaboration networks
The general collaboration network for obesity researchers was composed of 114 vertexes and 170 edges
representing the pairwise collaboration between the authors. An initial network graph was generated using
the Harel-Koren Fast Multiscale algorithm (shown in Figure 4-3).
The publication volume (i.e., number of publications) can be visualized by the size of the vertex and the
intensity of collaboration is illustrated by the width of the edges between two researchers. For illustration
purposes and to decrease the highly dense network obtained initially, Figure 4-4, shows only the edges or
connection among authors which have at least two co-authored publications. In addition, the code names
of the researchers categorized as experts are shown. This network graph could serve to visualize continuous
Page 100
83
or more stable collaboration between two researchers and also the natural clusters or grouping patterns led
by the obesity experts.
Figure 4-3. General collaboration network
Figure 4-4. Collaboration network with at least two publications between researchers
In Figure 4-4, the different vertex shapes and colors represent the expertise of the researchers (experts:
black circle, semi-experts: blue diamond, and young investigators: green triangle). Clear patterns and
clusters among different levels of expertise can be easily determined from the visualization. A more in-
Page 101
84
depth study of this network graph would be valuable to identify structural collaboration holes and discover
opportunities to accelerate knowledge flow and collaboration. For the experts group only, three
collaboration sub-clusters are encountered. See Figure 4-5.
Figure 4-5. Expert sub-clusters collaboration networks
On average, the experts group has a betweenness centrality of 194. On the other hand, the average
betweenness centrality for the semi-experts cluster and the new-investigators cluster is 41 and 34
respectively. This indicates that experts are more reachable for the other types of researchers and in most
cases serve as the main connection points for the network. For example, the expert researcher with the most
connections is directly linked to 13 researchers, including 5 experts. If we consider only the cluster of
experts, a density graph of 0.242 is achieved; that is, 24.2% of the total possible connections among each
pair of researchers is achieved in the network. In other words, 16 connections out of 66 maximum
connections are present in the experts’ network. The density for the expert group is higher than the
calculated densities for the semi-experts group (0.076) and new-investigators group (0.039). Naturally,
graph density can imply the connectedness of leaders and if proper collaboration networks are set at
different expertise groups to support mentoring.
The maximum degree of separation between two experts is two on each sub-cluster. In other words, the
separation among two experts on each sub-cluster is at most 1 intermediate researcher. This finding
reaffirms that the collaboration network structure among the experts group can be considered to be strong
and that experts are reachable to each other within their sub-group. However, it must be also be noted that
the overall experts collaboration network is disconnected, meaning that not all the researchers are directly
or indirectly connected to any other expert. Usually, this indicates that different sub-fields in obesity are
led by different groups of experts. For instance, the expert cluster composed of E1, E2 and E8 is mostly
associated with nutritional sciences. The cluster composed of E6, E7, and E9 has a main focus on cellular
Page 102
85
and molecular physiology. The remaining cluster is mostly integrated by members associated with the field
of psychiatry.
Additionally, the metrics generated from the network graphs can be used to identify bridgers and central
researchers. For example, in the network there are 18 researchers with relatively high betweenness
centrality. This group was composed of 7 experts, 3 semi-experts, and 8 new investigators. The members
of this group serve as facilitators among different clusters or groups in the network. On the other hand,
leaders or central researchers to the overall network were identified by their in-degree centrality. Within
the network, there were 9 researchers with more than 7 connections. This group was composed of 4 experts,
2 semi-experts, and 4 new investigators. This type of insight is relevant for decision makers in charge of
the design of strategies to better disseminate, identify mentors, and provide optimal collaboration structures.
4.4.2 Interdisciplinary collaboration by affiliation
Interdisciplinarity at the researcher level
Interesting patterns of multidisciplinary collaboration are found within the obesity research network. When
considering all the publications at the researcher level, 201 connections or co-authorships occur within the
same health discipline (department) and 234 connections occur between researchers from different health
discipline. This gives an overall cross-inter discipline ratio of 1.164, which indicates that the within and
between disciplines collaboration is slightly favored to multidisciplinary collaboration. The cross-inter
discipline ratio for the semi-experts group (2.286) is higher than the experts (0.993) and young-investigators
groups (1.433). This might indicate that semi-experts tend to be more develop more multidisciplinary
collaborations. On the other hand, expert researchers have a collaboration pattern that slightly favored the
collaboration within their own disciplines.
Interdisciplinarity at the departmental level
In the previous section, SNA was used to visualize collaboration among individuals. In this section, network
graphs are shown to illustrate collaboration among the different health sciences. Thus, the multidisciplinary
capacity at PSU can be better understood for obesity research. In the following graphs, vertexes represent
the different department affiliations and edges represent the collaboration between two departments based
on co-authorship publications.
For this analysis, just those departments with at least 5 obesity related publications were considered. Of the
14 departments analyzed, 36 edges or collaboration connections were found. The network graph
representing the interdepartmental collaboration can be seen in Figure 4-6.
Page 103
86
Figure 4-6. Collaboration network per affiliation
Collaboration clusters were identified using the Wakita-Tsurumi algorithm and the network layout was
created with the Harel-Koren Fast Multiscale algorithm. Three groups or clusters were identified according
to their collaboration patterns. The first departmental group is composed of Cellular and Molecular
Physiology (CMP), Neural and Behavioral Sciences (NBS), Pediatrics (PED), Psychiatry (PSY) and
Surgery (SUR), the second group includes Health Policy and Administration (HPA), Medicine (MED),
Obstetrics and Gynecology (O&G), Pathology (PATH) and Public Health Sciences (PHS), and the third
group is composed of Biobehavioral Health (BH), Human Development and Family Studies (HDFS) and
Nutritional Sciences (NS). From the collaboration network graph, it can be seen that there is a strong
collaboration between PHS and PSY, PHS and MED, PHS and O&G, MED and O&G, PED and HDFS,
HDFS and NS, and finally between HDFS and BH.
The departments with higher betweenness centrality are PHS, SUR, and MED with values of 26.633,
10.992, and 9.858 respectively. These values indicate that this set of health sciences serve as central points
to connect other disciplines in the field of obesity. The department with the most direct collaborative
connections is PHS, with 11 links with other departments. It is also interesting that the maximum separation
of the health departments with PHS is 2. This implies that PHS is an essential node in the health sciences
collaboration networks. It also indicates that PHS reaches a wider range of disciplines. However, it must be
noted that the main function of PHS is to provide statistical expertise services to other health science
departments. In this type of graph, it is also meaningful to calculate the network density. For the affiliation
network, an overall density of 0.396 was calculated. If PHS is removed from the network to properly assess
the connectedness of the other health sciences, we obtain a density of 0.321. The densities for clusters 1
Page 104
87
(PED, PSY, SUR, NBS, and CMP), 2 (HPA, KIN, PHS, MED, O&G, and PATH), and 3 (HDFS, NS, and
BH) are 0.867, 0.700, and 1.000 respectively. These values may represent the level of integration of health
sciences in the field of obesity research.
The maximum degree of separation between two health sciences is three, which means that at most two
intermediate connections are needed to reach any other health science. The average distance between the
entities is 1.571.
4.4.3 Cross-Institutional collaboration networks
Although the main objective of this study was to assess intra-institutional collaboration among the different
obesity researchers at PSU, a cross-institutional collaboration network is presented for the researchers
categorized as experts. Based on the co-authorship analysis conducted, the group of experts was connected
with 588 individuals. The weighted average of collaborators per paper for the obesity experts group is 4.6
co-authors. In Figure 4-7 is presented the collaboration network which includes individuals from different
fields and institutions.
Figure 4-7. Cross-institutional collaboration for obesity experts
From this collaboration network, different clusters were identified by the Wakita-Tsurumi algorithm,
represented by different colors. For visualization purposes, contrary to the previous graphs that were shown,
the edges only represent the connection but not the intensity of the collaboration. An interesting observation
Page 105
88
from the graph is that there is a cluster – in dark green - containing five of the researchers classified as
obesity experts. On the other hand, there is one cluster containing just one obesity expert.
As seen, SNA is a helpful methodology to understand the dynamics of collaboration networks, not only in
an intra-institutional setting, but also in cross-institutional collaboration. Most of the institutions awarded
by the CTSA have adopted SNA to assess collaboration and provide adequate internal structures that
facilitate interdisciplinary collaboration. However, a broader and more detailed analysis is needed to
evaluate cross-institutional collaboration and its effect on the acceleration of new discoveries to become
health policy.
4.5 Discussion
Building strong collaborative networks is required to accelerate translational research and provide effective
implementation of best practices. SNA techniques are helpful to assess collaboration and its changes over
time. It may be helpful to identify the factors of the complex setups to better collaborate and advance the
transfer of knowledge through efficient dissemination and implementation methodologies. As explicitly
stated by the CTSA consortium, generating multidisciplinary teams and enhancing cross-institutional
collaboration are required to ensure that the efforts of this grant will impact the public’s health.
In this chapter, SNA was applied at the health field level to identify leaders, identify clusters, quantify
network connectedness, identify bridgers or facilitators, and visualize interesting collaboration patterns.
The network graphs and interesting metrics provided will help to inform management about areas in which
networks can be improved, and therefore, impact dissemination, implementation and collaboration growth.
Decision makers in charge of developing collaborative programs among different health sciences can easily
visualize the structural holes that need to be filled to integrate the network. Additionally, by identifying the
leaders for each cluster, integration efforts can be conducted efficiently by using leaders as pillars to
enhance collaboration and communication channels to persuade other members of the networks. Moreover,
it has been shown that active dissemination methods, such as those involving leaders, are much more
effective than passive dissemination methods such as journals or other types of publications (Grimshaw et
al., 2001, Grimshaw et al., 2004, Grimshaw et al., 2012b). Then, researchers who are considered central or
bridger should be the first contact points to better disseminate interventions, policies, or knowledge
translation activities. Despite having different characteristics, all of these roles are essential for institutional
managers to assure the efficient knowledge transference.
Page 106
89
Multidisciplinarity holds the promise of accelerating translational research, and hence, organizations should
generate mechanisms to promote multidisciplinary collaboration. In the obesity network analyzed, it was
found that between discipline ties or collaboration are slightly favored over within discipline ties. This was
especially notorious for the semi-experts group in which for each within discipline tie there were more than
two between discipline ties. The focus on multidisciplinary research was also observed when accounting
for the health science departments as the agents or nodes of the network. This analysis served to identify
the departments that serve as the bridgers between other departments, and hence, serve as multidisciplinary
facilitators. Again, this information is useful to better design collaborative efforts that aim to improve the
integration among health disciplines.
Some of the limitations of the first SNA approach are the inability of capturing all collaborative connections
using co-authorship analysis only, collaboration patterns could be hidden due to the lag to publish results,
and various other non-tangible collaborations cannot be captured by analyzing co-authorship. More detailed
and robust analysis could be achieved by mixing different data sources including surveys, questionnaires
or direct observations could complement the framework provided.
Finally, SNA should not be seen merely as technique to create network graphs, but as a technique to identify
teams and mentoring patterns, discover opportunities to accelerate knowledge flow and collaboration, raise
awareness and enhance networks, leverage peer support, identify structural holes, discover hidden patterns,
and assess collaborative efforts over time among others. Benefits of using SNA to understand collaboration
patterns are huge. It represents a suitable tool to evaluate, identify opportunities and enhance consortium-
wide collaboration across the nation.
4.6 Conclusions
Multi-disciplinary collaboration is seen as a critical element to succeeding in translational research, not
only for the development of pharmacological and non-pharmacological interventions, but also to implement
and disseminate those innovations (Hall et al., 2008). Although collaboration is known to be an important
component in translational research, evaluating it is complex. This research aimed to take advantage of
SNA to advance collaboration by understanding its complexity. As pointed out by Green et al. (2009), SNA
has become a widely used tool in health communication and diffusion theory. In this sense, diffusion is
essential to advance in dissemination and implementation sciences, and therefore, various potential benefits
can be obtained from SNA if properly used.
Page 107
90
For the case presented, SNA was found to be a valuable technique to understand and visualize the intra-
institutional collaboration in obesity-related areas at the Penn State Hershey Medical Center. The use of a
recently launched tool – Penn State Profiles – and the WoK platform were highly helpful to identify obesity
researchers and generate collaboration matrixes. From the analysis conducted, different collaboration
patterns were presented and clusters were identified. The insights obtained are highly valuable to provide
advice and create an institutional structure to support an effective collaboration among different health
sciences and institutions as recommended by the CTSA consortium. This is critical to successfully move
new discoveries into clinical practice. In addition, leaders play a crucial role in social networking as they,
usually, have a considerable influence over the other members of the network. Therefore, promoting
collaboration networks is an important aspect not only to develop and testing better treatments but also to
accelerate their dissemination and implementation. In public health, there is a growing consensus with
respect to the ability of social networking to help developing more effective health programs. In part, this
is due to the increasing acceptability of system thinking and ecological approaches (Green et al., 2009, Best
et al., 2003). Moreover, the CTSA has argued that team science techniques should be adopted by every
CTSA hub as a way to better understand how to generate teams and generate long-term collaborations.
Certainly, SNA can also provide support to understand and monitor the performance metrics and structures
of team collaboration.
Page 108
91
Chapter 5
GUIDING THE STRATEGY AND RESOURCE
ALLOCATION OF HEALTHCARE ORGANIZATIONS
BASED ON IMPACT OF HEALTH INTERVENTIONS
5.1 Introduction
Distributing resources in healthcare is a complex process as they are scarce relative to needs. Consequently,
understanding the drivers of value is relevant for an optimal resource allocation. The healthcare system in
the U.S. has been progressively shifting to a paradigm that focuses on value-based data-driven care (Kaye
et al., 2014). In order to accomplish a high quality care delivery at lower costs, audit and feedback efforts
are essential components to formalize the use of data and lessons learned, and therefore, the wise
prioritization of efforts. A key objective of data-driven healthcare is to maximize the value that scarce
resources can have on society. In this sense, using decision making resource allocation techniques is
important to support the effective use of those limited resources. As stated by Lee and Kwak (1999), the
problem of resource allocation in healthcare must be considered as a significant and integral part of s-
trategic planning to provide effective healthcare service and management. However, given the complexity
of the healthcare systems, allocating resources to different interventions is typically a difficult multiple-
criteria problem in which conflicting objectives are present (Guindo et al., 2012). This fact becomes
especially challenging and pressing for healthcare organizations and funding agencies to decide what mix
of interventions might be funded to maximize the allocation value. In addition, defining value on its own is
already challenging for decision makers. From a health policy point of view, policy makers should aim to
distribute resources among different competing interventions and populations based on their anticipated
benefits (Patrick and Erickson, 1993).
Page 109
92
In order for organizations to define value, its vision must be well-articulated and its strategic planning must
be well-understood. Thus, resource allocation decisions are made not based solely on traditional criteria
such as quality and economic aspects, but also incorporating the fit of different courses of action into the
strategy of the organization or specific program. This alignment with the strategic plan motivates and guides
the investments to support the achievement of long-term objectives (Venkatraman, 1989). Hence, allocating
resources properly plays an important role in this aim. As a result, a good allocation of resources will lead
to a mix of projects and interventions that generate the greatest value through the organization’s eyes. For
example, the NIH through its CTSA program has stated the need of promoting diversity and
multidisciplinarity to take advantage of the synergies generated by these different groups of knowledge. In
addition, the CTSA encourages the development of a vision that promotes teamwork, facilitates
multidisciplinary translational teams, and enhances collaborations. Giving these general directions, it is
expected that CTSI awardee institutions allocate their resources considering the CTSA’s general
alignments. Hence, these multiple objectives should be taken into account to support health policy
guidelines, and thus, justify the implementation of health interventions that result in the greatest population
benefit.
By nature, data is needed to wisely conduct the resource allocation process and prioritization of health
interventions. In order for organizations such as governmental funding agencies, universities, and research
institutes to be able to evaluate and prioritize proposals, researchers should provide structured information
to quantify the potential impact of the proposed intervention, and thus, justify their implementation
(Fielding and Teutsch, 2013). This structured information should be coherent and comparable among
different types of interventions. Consequently, metrics concerning burden of disease, preventable burden,
and economic value are needed. In this sense, cost-effectiveness measures provide a clear and coherent
framework for intervention evaluation and comparison among them. Such metrics incorporate not only the
impact in terms of health but also the intervention’s cost, which is relevant for decision makers to effectively
allocate resources (Jamison et al., 2006). Nevertheless, it must be also recognized that cost-effectiveness
results should not be used as a strict guideline for resource allocation. There may be other considerations
(e.g., ethical issues, closing health disparities among different population, strategic focus on certain
diseases, etc.) to implement interventions that do not achieve the typically used cost-effectiveness
guidelines (Owens et al., 2011). Additionally, as previously argued, organizations should also consider the
prioritization of interventions that better fit their vision and long-term strategy. In order to properly account
for these multiple elements involved in the resource allocation decision making problem, multiple-criteria
techniques such as goal programming (GP) are suitable approaches for addressing this complexity, and also
serve to operationalize the organization’s strategy and drivers of value.
Page 110
93
This chapter covers two relevant topics related to the resource allocation process: 1) mathematical
programming for the proposal selection problem; and 2) cost-effectiveness analysis. Finally, a combination
of these two main topics is briefly presented to guide the proposal selection incorporating cost-
effectiveness. The methodology for the proposal selection problem is presented in Section 5.2. The
framework proposed uses a multiple-criteria decision making technique to select a mix of interventions that
incorporates multiple objectives and the fit of these set into the organization’s strategy. Specifically, a GP
model is proposed for generating an optimal solution based on the value that a certain mix of interventions
provides (Section 5.3). In addition, a framework is presented to guide researchers through a rapid high-
level estimation of the impact of an intervention based on cost-effectiveness measures (Section 5.6). A case
study based on the rapid high-level impact estimation (RHIE) framework is presented in Section 5.7. These
topics potentially provide valuable insights and benefits for three main healthcare stakeholders:
organizations that provide funding; healthcare researchers; and people. Moreover, in Section 5.10 different
formulations are proposed to integrate these two topics. Summarizing, the first part of the chapter focuses
on providing models for organizations to guide an informed allocation of resources based on value. The
second part provides insights for healthcare researchers to think about health interventions in terms of their
potential impact. Finally, these two parts aim to have a positive impact on people’s health as a result of a
better understanding of drivers of value to a wise allocation of health resources. Hence, the sections of this
chapter are distributed according to Figure 5-1.
Figure 5-1. Sections distribution of Chapter 5
Proposal Selection
Method: Goal
Programming
Impact Estimation
Method: Cost-
Effectiveness Analysis
Strategic proposal selection incorporating cost-
effectiveness goals
Sections 5.2 – 5.7 Sections 5.6 – 5.9
Section 5.10
Page 111
94
5.2 Methodology: Goal Programming Model for Proposal Selection
Proposal selection is a challenging organizational decision-making task. Organizations such as government
funding agencies, universities, and research institutes have to deal with complex decisions to select a
relatively reduced number of projects or proposals to be funded and implemented. In this sense, two of the
main reasons behind this challenging task are: 1) the difficulty of predicting the future success and impact
of the proposed projects, and 2) the decision involves a multi-evaluator system through multiple stages
(Tian et al., 2005). Hence, determining which of the relatively large set of the received proposals would
provide the greatest value, and consequently, are worthy of funding is a difficult task (Burstein and
Holsapple, 2008). In addition, decision making problems involving multiple experts become even more
complicated when multiple criteria must be considered (Yager, 1993). An additional challenge in resource
allocation, specifically in project or proposal selection, is to select a mix of them such that a course of action
is oriented to the achievement of the programmatic agenda or strategy of the organization. In order to
overcome these challenges, a multiple criteria-based framework is presented. This framework uses GP to
support decision makers in the proposal selection problem. A case study based on the Clinical and
Translational Sciences Institute at The Pennsylvania State University is used for illustration.
5.2.1 Model overview
In this section, a description of the proposed approach is provided to guide the proposal selection process.
This approach is divided into four phases: 1) Understanding the strategy, 2) Understanding the constraints,
3) Formulating the model, and 4) Solving and validating. The diagram of this approach is presented in
Figure 5-2.
Understanding the strategy: This is the initial phase of the approach and aims to understand the intent of
the organizational strategy, and how different goals could help to achieve its vision. This phase helps to
properly define the frame in which the organization wants to be not only in the short-term, but also in the
medium-long term guided by its strategic plan. For these reasons, the involvement of key leaders of the
organization is important to guide the identification of relevant organization’s goals. Additionally, we argue
that the strategy of an organization should be considered “alive”, as it must be able to take different shapes
to adapt to internal and external factors. In this model, the vision and mission of the organization receive
feedback and gain knowledge from historical and other data sources as a way to calibrate its strategy. This
calibration procedure is important to overcome current challenges to address population’s health in a more
dynamic manner. From this phase a list of goals and respective targets is identified. Finally, as some of
these goals might have different levels of relative importance, goal priorities must be defined.
Page 112
95
Understanding the constraints: The second phase aims to identify current constraints that strictly define the
region of feasible solutions (restrict courses of action). These constraints can be related to compliance with
guidelines, regulations, and policy, and/or resource availability including people, equipment, and budget.
Although most of these constraints are internal, some others, especially those related to regulations can
have external components. As clearly developed in the theory of constraints principles (Goldratt, 1990), it
is fundamental to understand the constraints as they establish the limits of performance for any system, in
this case, resource allocation. In this phase, experts are asked to identify the set of constraints as well as
defining the limits of those constraints.
Formulating the model: Goal and system constraints have already been identified. In this section the aim is
to develop a mathematical model to solve the proposal selection model that incorporates an objective
function (minimize deviations from targets) subject to the set of constraints. One of the key challenges of
this phase is to properly incorporate meaningful data into the model. In this sense, extracting information
from historical data might be challenging in practice. Tools such as regression and decision trees could be
helpful to extract insights from this data. On the other hand, some of the coefficients used in the model will
require the collection of data from different sources such as researchers’ profile, scientific search engines,
and proposals’ characteristics among others. Finally, the analysis of historical data can also support the
calibration or modification of current strategic lines of the healthcare organizations.
Solving and validating: The last phase of the proposed approach aims to solve the model and validate its
results. There are various multipurpose and specialized software available in the market to solve multiple-
criteria problems (e.g., LINDO, LINGO, GAMS, and Microsoft Excel). Once the results have been
obtained, the experts or leaders of the organization must validate that those results are reflecting the
preferences and constraints that they wanted to incorporate in the proposal selection decision. In case that
the results are unreasonable from the experts’ perspective, the model might be calibrated by revisiting the
strategy (Phase 1) and the constraints (Phase 2). Otherwise, the selected proposals are announced.
Page 113
96
Figure 5-2. Overview of methodology for the proposal selection problem
Identify Goals
Define Goal
priorities
Set targets for
those goals
Identify hard
constraints
Define
coefficients
Define limits
Understanding
strategy
Understanding
constraints
Formulating
the model
Formulate goal
constraints
Formulate
objective func.
Formulate syst.
constraints
Solving and
validating
Solve the
model
Reaso
nable
Assign funds
YES
NOCA
LIB
RA
TE
PHASE
DATA
SOURCE PROPOSED STEPS
POTENTIAL
TOOLS
• Vision
• Mission
• CTSA
• Guidelines
• Regulations
• Resource
availability
Historical
Data and
Data
Preparation
Steps
• Experts group
• Needs
assessment
• Ranking /
Rating / AHP
methods
• Experts group
• Budget analysis
• Mathematical
bound
approaches
• Regression
• Decision tree
analysis
• Experts’ opinion
• Bibliographic
search
• Software (Excel,
LINDO,
GAMS)
• Experts’ opinion
• Statistical
testing
FE
ED
BA
CK
Page 114
97
5.2.2 Generic model
A generic model is presented to illustrate how this model can be implemented in an organization such as
the CTSI at PSU.
5.2.2.1 Phase 1: Understanding the strategy
The CTSI at PSU has five main goals that might be considered when selecting proposals.
1. Strategic planning goals: The selected proposals should be aligned with the strategy and vision of
the center.
2. Risk associated goals: The selected proposals should be aligned with current willingness or levels
of risks accepted by the center.
3. Potential benefits: One of the goals of the center is to fund proposals that will potentially lead to
benefits for the center’s prestige.
4. Training the new generation of researchers. The center is highly committed to fund proposals that
include new investigators.
5. Catalyze multidisciplinarity. One of the objectives of the center is to support proposals in which
multiple disciplines collaborate to advance knowledge.
In order to set targets for these goals, the metrics to operationalize them must be identified. Finally, different
procedures (rating, ranking, AHP) could be used to estimate the relative importance of each goal. A detailed
explanation is given in subsequent sections.
5.2.2.2 Phase 2: Understanding the constraints
The CTSI at PSU identifies the main constraints that must be considered for proposal selection
1. Budget constraints: The center cannot exceed the maximum budget to be allocated.
2. Quality constraints: The center cannot fund proposals whose quality is lower than a certain
threshold.
3. Mutually exclusiveness constraints: The center consider that two proposals that are very similar
cannot be simultaneously selected.
4. Minimum number of proposals selected constraints: The center is strict in the minimum number of
proposals to be selected.
5. Balancing fund constraints: The center is strictly committed to providing a fair balance of fund
across the departments.
Page 115
98
Each one of these constraints is tied to a pre-defined limit that cannot be exceeded.
5.2.2.3 Phase 3: Formulating the model
After identifying the goals and constraints to be included, the GP model must be formulated based on its
corresponding parameters/coefficients.
Decision variable
The GP model proposed uses a binary approach in which the proposal i is either selected to receive fund or
not. Then the decision variable xi can take values 0 (non-selected) or 1 (selected).
Goal Constraints
1. Strategic planning
The strategic planning goal will account for a selection of projects that incorporates the vision of the center.
The strategy goals could be related to the study of a specific type of disease, use of a specific methodology
or framework, theme of health research, etc.
2. Risk associated
The risk associated to the project depends on various factors including PI’s experience, project team size,
health field, years of project, etc. Then, a risk factor is included on each project to account for the
dimensions mentioned.
𝑟𝑖𝑥𝑖 + 𝑑𝑟𝑖+ − 𝑑𝑟𝑖
− = 𝑅𝐼𝑆𝐾max _𝑡𝑎𝑟𝑔𝑒𝑡 for all 𝑖 Eq. 51
where:
ri Risk score associated to project i
RISKmax_target Maximum overall risk accepted by the center
𝑑𝑟𝑖− Negative deviational variable associated to the risk of proposal i
𝑑𝑟𝑖+ Positive deviational variable associated to the risk of proposal i
3. Potential Benefit
Some of the projects, if funded, might have the capacity for generating potential benefits for the center. For
instance bringing external funding to extend the projects or take them to a deeper level of research or/and
Page 116
99
resulting in journal publications could be considered as beneficial for the center’s prestige. In order to
account for this, historical information might be used to estimate the potential benefit coefficient. For
example, the coefficient PBi could incorporate a score or probability of project i to eventually lead to
external funding (e.g., NIH, NSF, etc). This coefficient could also incorporate the academic history of the
investigators and their ability to submit proposals to external agencies, quality of the proposal, theme of
research or other relevant attributes. Usually, these types of goals are treated as consolidated targets and
not at the proposal level.
∑ 𝑃𝐵𝑖𝑥𝑖 + 𝑑𝑃𝐵+ − 𝑑𝑃𝐵
− = 𝑃𝐵min _𝑡𝑎𝑟𝑔𝑒𝑡 Eq. 52𝑛
𝑖=1
where:
PBi Potential benefit score associated to project i
PBmin_target Minimum overall potential benefit required by the center
𝑑𝑃𝐵− Negative deviational variable associated to the risk of the proposals
𝑑𝑃𝐵+ Positive deviational variable associated to the risk of the proposals
4. Training the new generation of researchers
One of the key strategic goals of the center is to train the new generation of health researchers and
investigators. In order to account for this goal, new investigators (young investigators) should be prioritized
or at least secured a minimum number of positions. For example, a coefficient represented by the number
of new investigators included on each proposal could be used. These types of goals are usually treated at
the group level. In this sense, the right hand side (RHS) value could be the minimum number of new
investigators expected by the center.
∑ 𝑁𝐼𝑖𝑥𝑖 + 𝑑𝑁𝐼+ − 𝑑𝑁𝐼
− = 𝑁𝐼min_𝑡𝑎𝑟𝑔𝑒𝑡 Eq. 53𝑛
𝑖=1
where:
NIi Training new investigators score associated to project i
NImin_target Minimum overall score for training new investigators required by the center
𝑑𝑁𝐼− Negative deviational variable associated to the training new investigators of the proposals
𝑑𝑁𝐼+ Positive deviational variable associated to the training new investigators of the proposals
Page 117
100
5. Catalyze interdisciplinarity
Multidisciplinary research is seen as a positive aspect in proposal selection (Lowe and Phillipson, 2006).
Promoting multidisciplinarity by enhancing investigators and professionals to cross the health field
boundaries between disciplines is part of the vision of the center. This goal is aligned to the NIH’s stated
need to promote diversity and multidisciplinarity to take advantage of the synergies generated by these
different groups (RFA-TR-14-009). Recently, the CTSA lunched a RFA in which they formally encourage
the development of a vision that provides guidelines to incentive teamwork, to facilitate multidisciplinary
translational teams, and promote collaborations.
The coefficient MDi represents how well multi-disciplines are integrated in project i. This coefficient could
include factors such as number of researchers from different fields, number of institutions participating of
the project, integration of non-healthcare fields, and/or cross-campus collaboration, among others.
𝑀𝐷𝑖𝑥𝑖 + 𝑑𝑀𝐷𝑖+ − 𝑑𝑀𝐷𝑖
− = 𝑀𝐷min _𝑡𝑎𝑟𝑔𝑒𝑡 for all 𝑖 Eq. 54
where:
MDi Multidisciplinarity score associated to project i
MDmin Minimum multidisciplinarity score required by the center
𝑑𝑀𝐷𝑖− Negative deviational variable associated to multidisciplinarity of proposal i
𝑑𝑀𝐷𝑖+ Positive deviational variable associated to multidisciplinarity of proposal i
Some other goals could have been included if pertinent are:
Fund proposals that are more likely to increase the “value” or impact society. In other words, fund
those proposals whose expected research outcomes will have an important impact on people’s
health, and consequently, center prestige.
Account for a balance between the budget allocations among different health fields or departments.
Parameters such as the size of the departments or colleges could be used for this formulation.
Fund projects in which synergies can be obtained. For example, an intervention of informing and
diagnosing could provide much more value if they are implemented together.
Fund proposals that despite their good quality have little chances of receiving funds from external
agencies. This is especially notorious in under investigated diseases.
Fund proposals that are focused on contingent issues or others that have been stated by recognized
institutions such as the NIH as pressing issues that have not been explored enough.
Page 118
101
Prioritize and balance proposals that can provide “quick wins” and others that are seen as critical
to supporting the strategy and vision of the center in the long-term.
System Constraints
1. Budget constraints
There is a fixed budget that cannot be exceeded.
∑ 𝐵𝑈𝐷𝑖𝑥𝑖 ≤ 𝐵𝑈𝐷𝑚𝑎𝑥
𝑛
𝑖=1 Eq. 55
where:
BUDi Budget required by proposal i
BUDmax Maximum budget allowed by the center to be distributed among the proposals
In this constraint we could have also incorporated a minimal amount (𝐵𝑈𝐷𝑖𝑚𝑖𝑛) to be allocated which the
decision maker believes that the project can receive without affecting the quality nor outcomes of the
project.
2. Quality constraints
A first filter of the center is to remove from the analysis those proposals that do not comply with the
minimum quality threshold established (Qmin). This constraint could be either used as an initial filter or
incorporated into the model.
(𝑄𝑖 − 𝑄min)𝑥𝑖 ≥ 0 for all 𝑖 Eq. 56
where:
Qi Quality score of proposal i
Qmin Minimum quality score for a proposal to be considered for funding
3. Mutually exclusiveness constraints
There are constraints related to mutually exclusiveness. In this case, depending on the characteristics of the
proposals, they cannot be selected simultaneously. For example, let us say that project 2 (x2) and project 4
(x4) are mutually exclusive.
Page 119
102
Then this constraint can be modeled as follows:
𝑥2 + 𝑥4 ≤ 1
4. Fund at least a minimum number or proposals
At least a minimum number of proposals must be funded.
∑ 𝑥𝑖 ≥ 𝑁𝑃𝑅𝑂𝑃𝑚𝑖𝑛
𝑛
𝑖=1 Eq. 57
where:
NPROPmin Minimum number of proposals to be funded
5. Balancing funds constraints
These constraints account for providing a fair distribution of resources. Thus, strict rules are placed to avoid
that one department receives significantly more funding than the others. In this example, let us balance the
funding with respect to the proportion of graduate students in each department. Let us assume that proposals
2, 8, 19, and 20 come from the same department. Additionally, not more than a certain proportional amount
can be given to the department.
𝐵𝑈𝐷2𝑥2 + 𝐵𝑈𝐷8𝑥8 + 𝐵𝑈𝐷19𝑥19 + 𝐵𝑈𝐷20𝑥20
𝐵𝑈𝐷𝑚𝑎𝑥≤ (1 + 𝐵𝐹𝑚𝑎𝑥) ∗
𝑁𝑈𝑀𝑠𝑡𝑢_𝑙
𝑇𝑂𝑇𝐴𝐿𝑠𝑡𝑢 Eq. 58
where:
BFmax Maximum proportional amount that a department can receive
NUMstu_l Number of graduate students enrolled in department l
TOTALstu Total number of students enrolled
6. Non-negativity and binary constraint
The GP modeled is based on a 0 – 1, therefore, either the project is selected (1) or not (0). Additionally,
deviational variables are non-negative.
𝑥𝑖 is binary for all 𝑖
𝑑𝑟𝑖+ , 𝑑𝑟𝑖
− , 𝑑𝑀𝐷𝑖+ , 𝑑𝑀𝐷𝑖
+ ≥ 0 for all 𝑖 Eq. 59
Page 120
103
Objective Function
The objective function in GP formulations aims to minimize unwanted deviations from targets. Hence, the
objective function of this GP model is:
𝑀𝑖𝑛𝑖𝑚𝑖𝑧𝑒 𝑍 = 𝑤𝑟 ∑ 𝑑𝑟𝑖+
𝑛
𝑖=1+ 𝑤𝑃𝐵𝑑𝑃𝐵
+ + 𝑤𝑁𝐼𝑑𝑁𝐼+ + 𝑤𝑀𝐷 ∑ 𝑑𝑀𝐷𝑖
+𝑛
𝑖=1 Eq. 510
where:
wr is the relative importance of the risk-associated goal
wPB is the relative importance of the potential benefits-associated goal
wNI is the relative importance of the new investigators-associated goal
wMD is the relative importance of the multidisciplinarity-associated goal
It must be noticed that a goal was not included for a specific funding strategy. They will mostly depend on
specific short or long-term objectives (e.g., promoting community-based programs, use of big-data tools,
integration of technology, etc.).
Summary of Decision Variables and Coefficients
xi Decision variable indicating whether the proposal i is selected (1) or not (0)
ri Risk score associated to project i
RISKmax_target Maximum overall risk accepted by the center
𝑑𝑟𝑖− Negative deviational variable associated to the risk of proposal i
𝑑𝑟𝑖+ Positive deviational variable associated to the risk of proposal i
PBi Potential benefit score associated to project i
PBmin Minimum overall potential benefit required by the center
𝑑𝑃𝐵− Negative deviational variable associated to the risk of the proposals
𝑑𝑃𝐵+ Positive deviational variable associated to the risk of the proposals
NIi Training new investigators score associated to project i
NImin_target Minimum overall score for training new investigators required by the center
𝑑𝑁𝐼− Negative deviational variable associated to the training new investigators of the proposals
𝑑𝑁𝐼+ Positive deviational variable associated to the training new investigators of the proposals
MDi Multidisciplinarity score associated to project i
MDmin Minimum overall multidisciplinarity required by the center
Page 121
104
𝑑𝑀𝐷𝑖− Negative deviational variable associated to multidisciplinarity of proposal i
𝑑𝑀𝐷𝑖+ Positive deviational variable associated to multidisciplinarity of proposal i
BUDi Budget required by proposal i
BUDmax Maximum budget allowed by the center to be distributed among the proposals
BFmax Maximum proportional value to account for balanced allocation of resources
Qi Quality score of proposal i
Qmin Minimum quality score for a proposal to be considered for funding
NPROPmin Minimum number of proposals to be funded
NUMstu_l Number of students enrolled in department l
TOTALstu Total number of students enrolled
wr Relative importance of the risk-associated goal
wPB Relative importance of the potential benefits-associated goal
wNI Relative importance of the new investigators-associated goal
wMD Relative importance of the multidisciplinary-associated goal
Model Coefficients
One of the key factors of success of GP models is to properly select and obtain the coefficients to be used
in both goal and system constraints. In this section, the description of different coefficients that could be
used in this generic model is presented. Some of the coefficients proposed seek to gain advantage from the
knowledge built through past experiences of funded proposals. In this regard, the CTSA has been actively
pushing for a better use and formalization of best practices within the CTSA’s awardees. Therefore, using
historical data as a way to formalize and operationalize best practices to be used in proposal selection is
required to advance the capabilities of the CTSA’s managers to better allocate resources based on evidence.
Risk Associated Score
In the proposed GP, one goal constraint accounts for the maximum amount of risk allowed by the center.
As previously proposed, the risk factor could include the years of experience of the PI, the average years
of experience of the PI, the health field or disease, the coverage of expertise required.
An alternative way to generate this score could be using historical data with different proposal attributes
such as those mentioned above and ask experts to classify those with respect to their perceived success. In
this case, according to the attributes, a risk score could be predicted for the new proposals under
Page 122
105
consideration. This alternative is in practice difficult to implement as data points are currently limited.
However, as encouraged by the CTSA, sharing histories of success between the CTSA hubs in a repository
could tremendously increase the data available to make this type of analysis. Therefore, CTSA hubs could
learn not only from internal experiences, but also from other CTSA hubs making the use of its resources
much more efficient.
For this model, let us say that the PI’ expertise, including experience and intensity of publication, were
considered as the drivers of proposals’ risk. As previously mentioned, other factors such as team size and
disease investigated could also be incorporated as components of the risk goal.
PI expertise coefficient
In scientific research fields, the number of publications of a researcher can be seen as a measure of expertise
(Rodriguez and Bollen, 2005). In addition, publication data is usually seen as a suitable way to be used for
obtaining expertise (Cameron et al., 2007, Cameron et al., 2010). Another dimension of expertise is
experience (McEnrue, 1988). This experience can be typically measured as the length of time of a person
within a profession.
In this study, we considered that expertise is achieved after 8 years of experience. This information could
be estimated using the year of the first publication of the author in the given research field. Additionally
the number of papers could be extracted by querying databases such as PubMed. We will consider that
having published five or more scientific articles is a fair estimator of expertise in the area. A normalization
procedure can be used to express expertise in a range from 0 to 1. Thus, expertise score for a proposal can
be expressed as follows:
𝑃𝐼𝑒𝑥𝑝 =[𝑚𝑖𝑛 {(
𝑌𝑒𝑥𝑝 − 88 ) , 0} + 1] + [𝑚𝑖𝑛 {(
𝑁𝑝𝑎𝑝𝑒𝑟 − 55
) , 0} + 1]
2 Eq. 511
where:
PIexp: is the expertise score assigned to the PI
Yexp: is the years of experience of the PI
Npaper: is the number of papers of the PI
Page 123
106
It must be noticed that, in this case, PIexp was obtained as the simple average between the two factors
mentioned. However, if the decision maker has some other insights or preferences in terms of the
importance of these factors, a weighted average can be used instead.
In order to simplify the analysis, the evaluator could use only one of the proposed metrics to determine the
level of expertise. However, using the two metrics gives a fairly good and complete balance in the
estimation of expertise. Solely using metrics of time or frequency could conduct to errors. In this regard,
studies have demonstrated that experience is a necessary, but not sufficient dimension for expertise
(Ericsson et al., 2007). In the healthcare domain, there are some examples in which experience has been
found to be significantly positively correlated to expertise (McHugh and Lake, 2010).
A more elaborated approach to quantifying topic expertise of a researcher based on bibliographic data from
scientific publications can be found in Cameron et al. (2010). However, for our purposes this level of detail
was not considered as value-added.
Potential Benefits Score
In order to support the proposed formulation, a Potential Benefit score (PBi) is required. This score can be
composed by likelihood of receiving external funding and potential to result in article publications. In this
case, a characterization of the type of research including type of disease and method might be used. A
prediction based on past proposals funded can be used for these purposes. Obtaining data about external
funding received and publications from already funded proposals is relatively easy. However, it must be
realized that it might be difficult to identify the right attributes to categorize papers.
The most straightforward metrics to use tangibles to quantify potential benefits are the number of papers
and capabilities of bringing external fund. In this case study, it will be assumed that based on historical
data, the likelihood of a proposal to result in an ideal number of papers and/or bringing external fund depend
on the PI’s experience, multidisciplinary score, and quality score.
If more historical data is available, metrics such as impact on people’s health, ability to reduce health
disparities, and size of potentially impacted population, among others could be incorporated into this
analysis. However, these metrics are not easily obtained or estimated especially due to the time that it takes
to get reliable estimations and the reduced size of historical data.
Other analysis including decision tree techniques could also be used to generate clusters or categories based
on significant attributes. Multiple-regression analysis techniques can also be explored to estimate the
potential benefits of a proposal given certain significant attributes based on past experiences.
Page 124
107
Training the New Generation of Researchers Score
A key objective of the CTSI is to train the new generation of investigators. This goal can be set in terms of
proportion of new investigators involved in the proposals or simply using the number of new investigators
(NIi) to which a target of minimum expected total number of your investigators in the pool of selected
proposals is set. This last option is used in the proposed model. The number of young investigators can be
easily obtained directly from the proposal.
Catalyze Multidisciplinarity
A score to account for multidisciplinarity can also be easily obtained from the proposal information. One
of the metrics that can be used is the number of different health fields participating of the proposal or a
more elaborated score to account for different levels of multidisciplinarity.
Multidisciplinarity score
In this case, multidisciplinarity score of proposal i (MDi) is a normalized value of the number of disciplines
participating of the proposal. For illustration purposes, let us consider that the integration of three or more
disciplines is considered to constitute a fairly multidisciplinary team. Thus, it can be formulated as follows:
𝑀𝐷𝑖 = 𝑚𝑖𝑛 {(𝑁𝑈𝑀𝑚𝑑_𝑖 − 3
3) , 0} + 1 Eq. 512
where:
NUMmd_i is the number of disciplines participating of proposal i.
Goal Weights
In order to account for the relative importance of each one of the goals incorporated in the model, a
weighting method must be used. In this case, a rating method is used in which the decision maker is asked
to rate the importance of each goal using a 1 – 9 scale. Table 5-1 can be used to guide the respondent.
Page 125
108
Table 5-1. Rating method to obtain goal weights
Rate Importance definition
1 This goal is not significant for the success of the CTSI
2 This goal has a low impact on the success of the CTSI
3 This goal is slightly important for the success of the CTSI
4 This goal is somewhat important for the success of the CTSI
5 This goal is neutrally important for the success of the CTSI
6 This goal is moderately important for the success of the CTSI
7 This goal is significantly important for the success of the CTSI
8 This goal is very important for the success of the CTSI
9 This goal is extremely important for the success of the CTSI
Let Wij be the rate assigned to goal i by decision maker j. Then the composite weight of the i-th goal is given
by:
𝑤𝑖 =∑ 𝑊𝑖𝑗
𝑚𝑗=1
∑ ∑ 𝑊𝑖𝑗𝑚𝑗=1
𝑛𝑖=1
, for 𝑖 = 1,… , 𝑛 and 𝑗 = 1,… , 𝑚 Eq. 513
Other more elaborated procedures to obtain the weights such as AHP could have been used.
5.2.2.4 Phase 4: Solving and validating
Goal programming models can be easily solved using linear programming software such as LINGO,
LINDO, and GAMS. The solution must be validated by the experts of the organization. This validation
process could include non-statistical and/or statistical validation techniques. Face validity is one of the
techniques in which experts’ opinion can be easily gathered. In such cases, the experts analyze whether the
obtained solution is in reality giving coherent results according to the different criteria previously defined.
In cases in which the solution is not seen as a good representation of the different goals and constraints,
Phases 1 and 2 must be reviewed for consistency. Additionally, some of the key pitfalls to avoid in goal
programming formulations could be checked as well. According to Jones and Tamiz (2010) some rules for
avoiding pitfalls are:
1. Always include both deviational variables in the formulation
2. Do not combine ideal target levels with lexicographic variant
3. Do not use an excessive number of priorities
Page 126
109
4. Regard the weights, priority schemes, and target levels as initial estimates and not as set in stone
values
5. Always use an appropriate normalization scheme with the weighted variant
6. Tchebysheff variant and priority levels within the lexicographic variant need normalizing too if
they are not commensurable
7. Always perform validation of each normalization constant in the context of the decision situation
8. Always check the solution for Pareto efficiency and use a restoration scheme if required
9. Only penalize unwanted deviations
10. Always make an informed choice of variant based on the nature of the problem
5.3 Case Study: Proposal Selection in a CTSA Hub
In this section, a case study is presented to illustrate how the proposed approach can work in practice. The
coefficients representing the relative importance of the goals were obtained through a survey to the key
function leaders of the Pilot Projects key function area and some members of the CTSI’s executive
committee. On the other hand, the project’s information, including coefficients and scores presented here
are intended to illustrate the framework and do not necessarily reflect the proposals received by the CTSI
at PSU. A table with the list of proposals and its characteristics is shown in Appendix B.
5.3.1 Identifying goals and constraints
A list of four main goals were identified for the PSU CTSI.
1. Risk goal
2. Potential benefits goal
3. Training the new generation of researchers goal
4. Catalyze interdisciplinarity
Additionally, six hard constraints were identified
1. Budget constraint
2. Quality constraint
3. Mutually exclusiveness constrains
4. Fund at least a minimum number of proposals
5. Proportion of funded proposals constraints
6. Cross campus collaboration constraint
Page 127
110
5.3.2 Obtaining goal weights
After identifying the goals and hard constraints, a group of six experts participated of a survey to assign
scores to the different goals with respect to their importance. Thus, the weights (relative importance) of
these goals were calculated. The opinions of the six experts regarding the four goals considered are shown
in Table 5-2. The experts assigned a score to each goal according to their level of importance using a scale
from 1 to 9.
Table 5-2. Expert's scores and goal priorities
Goal
Experts’ Score ∑𝑊𝑖𝑗
𝑚
𝑗=1
𝑤𝑖 E1 E2 E3 E4 E5 E6
Risk 3 6 9 6 8 2 34 0.193
Potential benefits 7 7 9 9 9 6 47 0.267
Training 6 6 9 9 8 6 44 0.250
Multidisciplinarity 9 8 9 9 8 8 51 0.290
From this analysis, it can be said that the most important goal for the CTSI leaders is multidisciplinarity
with a relative importance of 0.290. The least important goal is risk with a relative importance of 0.193.
5.3.3 Formulating goal constraints
In this section, goal constraints are formulated. Additionally, normalization procedures are used as needed
to reduce the bias given by the magnitude of the coefficients used in the formulation.
Risk Goal
In order to be consistent with the PIexp score calculated, the target for this goal is 1. Then the following
equations are to be included as goal constraints. The years of experience and number of papers for PIs are
shown in Appendix B and ri scores are shown in Appendix C.
(𝑟𝑖 − 1)𝑥𝑖 + 𝑑𝑟𝑖+ − 𝑑𝑟𝑖
− = 0 ∀𝑖 Eq. 514
−0.513𝑥1+ 𝑑𝑟1+ − 𝑑𝑟1
− = 0
−0.575𝑥2+ 𝑑𝑟2+ − 𝑑𝑟2
− = 0
−0.250𝑥4+ 𝑑𝑟4+ − 𝑑𝑟4
− = 0
−0.638𝑥7+ 𝑑𝑟7+ − 𝑑𝑟7
− = 0
Page 128
111
−0.425𝑥13+ 𝑑𝑟13+ − 𝑑𝑟13
− = 0
−0.488𝑥14+ 𝑑𝑟14+ − 𝑑𝑟14
− = 0
−0.010𝑥17+ 𝑑𝑟17+ − 𝑑𝑟17
− = 0
The normalized contribution of this goal to the objective function is given by:
𝑤𝑟
⌈𝐵𝑈𝐷𝑚𝑎𝑥
𝐵𝑈𝐷𝑎𝑣𝑔|0.1⁄ ⌉∗ ∑ 𝑑𝑟𝑖
+𝑛
𝑖=1 Eq. 515
where:
𝐵𝑈𝐷𝑎𝑣𝑔|0.1 represents the average budget requested by all the proposals except the 10% lowest
and highest. In this case, as 20 proposals are being considered, this expression
calculates the average budget excluding the two proposals with the lowest
requested budgets (12 and 15), and two proposals with the highest requested
budgets (3 and 4).
⌈𝐵𝑈𝐷𝑚𝑎𝑥
𝐵𝑈𝐷𝑎𝑣𝑔|0.1⁄ ⌉ is used for normalizing the deviational variables to properly account for the goal
weight previously assigned. The resulting value could be explained as the expected
number of proposals to be funded assuming that the maximum budget allocated
for the program is used.
0.193
⌈600,00072,000⁄ ⌉
∗ ∑ 𝑑𝑟𝑖+
20
𝑖=1=
0.193
9∗ ∑ 𝑑𝑟𝑖
+20
𝑖=1
Potential Benefits Goal
Let us say that the center’s experts require a 40% achievement of this goal considering the consolidated
score. The scores are shown in Appendix C and were obtained from Appendix D. This score is based on
the PI’s experience, multidisciplinarity score, and quality of the proposal.
Then, this goal can be written as:
∑ 𝑃𝐵𝑖𝑥𝑖 + 𝑑𝑃𝐵+ − 𝑑𝑃𝐵
− = 𝑃𝐵𝑚𝑖𝑛
𝑛
𝑖=1 Eq. 516
Page 129
112
Let us say that as the number of proposals is not known in advance, then an estimate is used.
∑ 𝑃𝐵𝑖𝑥𝑖 + 𝑑𝑃𝐵+ − 𝑑𝑃𝐵
− = 0.4 ∗ ⌈𝐵𝑈𝐷𝑚𝑎𝑥
𝐵𝑈𝐷𝑎𝑣𝑔|0.1⁄ ⌉𝑛
𝑖=1
For this case study, the equation is:
0.300𝑥1 + 0.200𝑥2 + 0.675𝑥3 + 0.300𝑥4 + 0.7003𝑥5 + 0.455𝑥6 + 0.130𝑥7 + 0.800𝑥8 + 0.195𝑥9
+ 0.800𝑥10 + 0.700𝑥11 + 0.700𝑥12 + 0.450𝑥13 + 0.450𝑥14 + 0.525𝑥15 + 0.900𝑥16
+ 0.800𝑥17 + 0.900𝑥18 + 0.675𝑥19 + 0.900𝑥20 + 𝑑𝑃𝐵+ − 𝑑𝑃𝐵
− = 0.4 ∗ 9
The contribution of this goal to the objective function is given by:
𝑤𝑃𝐵
⌈600,00072,000⁄ ⌉
∗ 𝑑𝑃𝐵+ =
0.267
9∗ 𝑑𝑃𝐵
+ Eq. 517
Training the New Generation of Investigators Goal
One of the center’s goals is to fund proposals in which new investigators play an essential role. This will
allow the center to train the new generation of researchers and provide substantial sustainability for keeping
the interest of health professionals to focus on scientific research. For this case, the center aims to have a
total pool of new investigators of at least ten. This can be written as follows:
∑ 𝑁𝐼𝑖𝑥𝑖 + 𝑑𝑁𝐼+ − 𝑑𝑁𝐼
− = 𝑁𝐼𝑚𝑖𝑛 Eq. 518𝑛
𝑖=1
Where NIi is the number of new investigators in proposal i (Appendix B). Thus, the equation for this case
is:
1𝑥1 + 2𝑥2 + 1𝑥3 + 0𝑥4 + 3𝑥5 + 1𝑥6 + 0𝑥7 + 1𝑥8 + 1𝑥9 + 2𝑥10 + 2𝑥11 + 1𝑥12 + 2𝑥13 + 0𝑥14 + 1𝑥15
+ 2𝑥16 + 0𝑥17 + 1𝑥18 + 2𝑥19 + 2𝑥20 + 𝑑𝑁𝐼+ − 𝑑𝑁𝐼
− = 10
The contribution of this goal to the objective function is:
𝑤𝑁𝐼
𝑁𝐼𝑚𝑖𝑛∗ 𝑑𝑁𝐼
+ =0.250
10∗ 𝑑𝑁𝐼
+
Page 130
113
Catalyzing Multidisciplinarity Goal
The center is highly compromised with promoting scientific research that integrates different health fields.
In order to account for this goal, an interdisciplinarity score is proposed to evaluate how multidisciplinarity
the proposals are (Appendix C).
Thus, the goal constraints associated to multidisciplinarity are:
(𝑀𝐷𝑖 − 1)𝑥𝑖 + 𝑑𝑀𝐷𝑖+ − 𝑑𝑀𝐷𝑖
− = 0 ∀𝑖 Eq. 519
−0.333𝑥1+ 𝑑𝑀𝐷1+ − 𝑑𝑀𝐷1
− = 0
−0.333𝑥3+ 𝑑𝑀𝐷3+ − 𝑑𝑀𝐷3
− = 0
−0.333𝑥4+ 𝑑𝑀𝐷4+ − 𝑑𝑀𝐷4
− = 0
−0.667𝑥6+ 𝑑𝑀𝐷6+ − 𝑑𝑀𝐷6
− = 0
−0.667𝑥7+ 𝑑𝑀𝐷7+ − 𝑑𝑀𝐷7
− = 0
−0.667𝑥9+ 𝑑𝑀𝐷9+ − 𝑑𝑀𝐷9
− = 0
−0.333𝑥13+ 𝑑𝑀𝐷13+ − 𝑑𝑀𝐷13
− = 0
−0.333𝑥14+ 𝑑𝑀𝐷14+ − 𝑑𝑀𝐷14
− = 0
−0.333𝑥15+ 𝑑𝑀𝐷15+ − 𝑑𝑀𝐷15
− = 0
−0.333𝑥19+ 𝑑𝑀𝐷19+ − 𝑑𝑀𝐷19
− = 0
The contribution of this goal to the objective function is given by:
𝑤𝑀𝐷
⌈𝐵𝑈𝐷𝑚𝑎𝑥
𝐵𝑈𝐷𝑎𝑣𝑔|0.1⁄ ⌉∗ ∑ 𝑑𝑀𝐷𝑖
+𝑛
𝑖=1 Eq. 520
0.290
⌈600,00072,000⁄ ⌉
∗ ∑ 𝑑𝑀𝐷𝑖+
20
𝑖=1=
0.290
9∗ ∑ 𝑑𝑀𝐷𝑖
+20
𝑖=1
Page 131
114
5.3.4 Objective function
The objective function for this goal programming model is:
𝑀𝑖𝑛𝑖𝑚𝑖𝑧𝑒 𝑍 =0.193
⌈600,00072,000⁄ ⌉
∗ ∑ 𝑑𝑟𝑖+
20
𝑖=1+
0.267
⌈600,00072,000⁄ ⌉
∗ 𝑑𝑃𝐵+ +
0.250
10∗ 𝑑𝑁𝐼
+
+ 0.290
⌈600,00072,000⁄ ⌉
∗ ∑ 𝑑𝑀𝐷𝑖+
20
𝑖=1
5.3.5 Set of system constraints
Budget Constraint
The allocated budget cannot exceed the maximum available budget of 600,000.
75,000𝑥1 + 64,000𝑥2 + 120,000𝑥3 + 120,000𝑥4 + 94,000𝑥5 + 45,000𝑥6 + 59,000𝑥7 + 68,000𝑥8
+ 80,000𝑥9 + 92,000𝑥10 + 55,000𝑥11 + 39,000𝑥12 + 55,000𝑥13 + 46,000𝑥14
+ 39,000𝑥15 + 46,000𝑥16 + 78,000𝑥17 + 79,000𝑥18 + 101,000𝑥19 + 115,000𝑥20
≤ 600,000
Quality Constraints
(𝑄𝑖 − 𝑄min)𝑥𝑖 ≥ 0 for all 𝑖
Qi values are obtained using the current scoring sheet used to evaluate proposals (Appendix C). Let us also
assume that the minimum quality required is 65.
Mutually exclusive proposals
There are some projects that due to their similarity or other specific attributes, cannot be simultaneously
selected to be funded. In this case, for example, the center could limit the number of proposals that address
diabetes as their primary area of research. According to the list of proposals (Appendix B), there are three
of them whose main interest is diabetes. However, according to the center’s strategy, at most two proposals
on diabetes can be funded. The mathematical formulation of this is given as follows:
𝑥1 + 𝑥5 + 𝑥12 ≤ 2
Page 132
115
Similarly, the center limited the number of asthma proposals to be funded to 1. This constraint can be
written as:
𝑥3 + 𝑥8 ≤ 1
Additionally the center limited the number of liver related proposals to be funded to 1. This constraint can
be written as:
𝑥13 + 𝑥17 ≤ 1
Proportion of funded proposals
One of the strict constraints imposed by the leaders of the center is to consider a balance in the funding
given to the health departments. In this case, the amount of funding given to any department cannot exceed
three times its representativeness ratio. This ratio can be obtained from the graduate school enrollment data
by department or program. For example, PIs of proposals 2, 8, 19 and 20 are part of the same health
department (Medicine). Then, this constraint can be expressed as follows:
𝐵𝑈𝐷2𝑥2 + 𝐵𝑈𝐷8𝑥8 + 𝐵𝑈𝐷19𝑥19 + 𝐵𝑈𝐷20𝑥20
𝐵𝑈𝐷𝑚𝑎𝑥≤ 3 ∗
𝑁𝑈𝑀𝑠𝑡𝑢_𝑙
𝑇𝑂𝑇𝐴𝐿𝑠𝑡𝑢
where:
NUMstu_l is the number of students in department l
TOTALstu is the total number of students
According to the table shown in Appendix E, the following constrains must be considered:
Department of Biochemistry and Molecular Biology:
75,000𝑥1 + 120,000𝑥4
600,000≤ 3 ∗
30
264
Department of Cellular and Molecular Physiology:
59,000𝑥7
600,000≤ 3 ∗
9
264
Page 133
116
Department of Comparative Medicine:
94,000𝑥5
600,000≤ 3 ∗
7
264
Department of Humanities:
55,000𝑥11
600,000≤ 3 ∗
15
264
Department of Medicine:
64,000𝑥2 + 68,000𝑥8 + 101,000𝑥19 + 115,000𝑥20
600,000≤ 3 ∗
75
264
Department of Microbiology and Immunology:
120,000𝑥3 + 92,000𝑥10
600,000≤ 3 ∗
22
264
Department of Neural and Behavioral Sciences:
79,000𝑥18
600,000≤ 3 ∗
12
264
Department of Obstetrics and Gynecology:
39,000𝑥15
600,000≤ 3 ∗
8
264
Department of Pediatrics:
45,000𝑥6 + 55,000𝑥13
600,000≤ 3 ∗
16
264
Department of Psychiatry:
80,000𝑥9 + 46,000𝑥14
600,000≤ 3 ∗
12
264
Department of Public Health Sciences:
39,000𝑥12 + 46,000𝑥16
600,000≤ 3 ∗
45
264
Page 134
117
Department of Radiology:
78,000𝑥17
600,000≤ 3 ∗
13
264
Minimum number of funded proposals
At least nine proposals are expected to be funded by the center.
∑ 𝑥𝑖 ≥ 9 for 𝑖 = 1,… ,20𝑛
𝑖=1
Cross-campus required
In order to support cross-campus collaboration, the center is highly committed to have at least two proposals
that incorporate departments from different campuses.
𝑥1 + 𝑥5 + 𝑥7 + 𝑥8 + 𝑥13 + 𝑥16 + 𝑥17 + 𝑥19 + 𝑥20 ≥ 2
5.4 Results of Proposal Selection
The GP model was solved using the software LINDO 6.1 (See Appendix F for the formulation). The
solution was obtained after 235 iterations with an objective function of 0.26931E-01. The mix of proposals
that provides the maximum value (minimize deviations from the target goals) is composed of x2, x8, x10, x11,
x12, x15, x16, x18, and x20. All the remaining proposals were not selected as part of the optimal mix
(corresponding xi equals to zero). The solution includes three proposals from the departments of medicine,
two from the department of public health sciences, and one from the departments of microbiology and
immunology, humanities, obstetrics and gynecology, and neural and behavioral sciences. Additionally, the
selected mix of proposals is heterogeneous as it does not have duplicate categories (Heart failure, asthma,
allergy, Alzheimer, diabetes, endocrinology, dementia, drug addiction, and female infertility). The amount
of budget allocated is $597,000.
Two out of the four goals were completely satisfied. None of the undesirable deviational variables for the
goals of potential benefits and training the new generation of investigators were present. The potential
benefits were exceeded in total by 2.825, which represents 0.314 (2.825/9) over the minimum target of 0.4
required. The set of proposals selected includes fourteen new investigators, which is over the ten that was
Page 135
118
set as the minimum target. The remaining goals had a least one non-zero unwanted deviational variable.
For the risk goal, the deviational variables 𝑑2+ and 𝑑8
+ have values of 0.575 and 0.200 respectively. It means
that although proposals 2 and 8 were selected, they do not fully satisfy the target that was set for the risk
goal. For the goal of catalyzing multidisciplinarity, one deviational variable was non-zero. In this case,
𝑑𝑀𝐷15+ had a value of 0.333. It means that proposal 15 was selected although it does not fully satisfy the
target that was set for the catalyzing multidisciplinarity goal.
The data presented in this case study was simulated to illustrate the usability of the proposed framework.
However, the validation of the model was conducted using real data obtained from a call for proposals
issued by the Penn State CTSI in September 2014. Twenty-four projects were submitted in response to the
call for proposals, and nine were ultimately funded. The results obtained from the model matched seven
out of the nine selected proposals from the pool of 24, indicating that the model serves as an accurate
representation of the final proposal selection criteria.
From a practitioners’ perspective, the GP model is an effective way to quantify the proposals’ merit and
provides an additional source of information to guide the selection process based on their fit to the
organizational goals. The current CTSI proposal selection process involves an informal weighing of the
criteria listed in the GP model, but it lacks the model’s scientific rigor and preciseness. The GP model
provides a defensible, data-driven method to compare proposals and rank them based on specific criteria
related to the CTSI’s strategic mission. Another positive aspect of the GP model is its flexibility; as the
CTSI’s priorities evolve, the GP model can be altered by changing the criteria weighting, or by adding or
removing criteria. Finally, the GP model could be disseminated within the CTSA consortium and improved
based on different institutions’ selection criteria.
5.5 Discussion of Proposal Selection
The budget allocation problem is an essential component to support the strategic goals, and therefore, the
sustainability of the organizations. Accordingly, funding agencies, universities, research institutes and
others in charge of distributing resources to different proposals, should utilize methods to determine a mix
of projects that lead to a maximum value. These methods should be based on evidence generated in both
contexts internal and external.
The GP model presented in this section was found to be a suitable approach for selecting an optimal mix of
proposals based on goals and constraints of the center. As included in the framework, before providing the
Page 136
119
funding, these results should be validated with the organization’s experts. If the results are unreasonable,
the parameters used should be calibrated to properly model what the center is looking for. Under the current
assumptions, for instance, the department of comparative medicine has only seven graduate students, and
therefore, the proportionality ratio constraints in this case will make it infeasible for their proposals to be
selected. In case the experts’ board could model different exceptions to soften constraints for small
departments, or even make them stricter for large departments as a way of distributing resources more
heterogeneously.
In practical terms, one of the key challenges of this approach is to collect reliable data, especially those
metrics that uses past information to make inferences and formalize lessons learned. In this sense,
mechanisms to monitor funded proposals are needed to fully capture what factors have been successful and
replicate them in future proposal selection processes. In addition, a collaborative effort to share best
practices and relevant proposal’s outcome data between CTSA hubs could generate an important historical
baseline for formalizing best practices, and therefore, optimize the resources of the CTSA consortium. This
is relevant since collecting performance data from proposals is a slow process. Typically, capturing the
impact that a proposal or intervention can have, requires considerable delays. Therefore, it becomes
necessary to monitor the impact of those proposals even after their funded time frame is completed.
Supporting this latent need, a recent NIH request for application (RFA-TR-14-009) encourages tracking
subsequent activity data for at least 10 years as a way to capture interesting data, that could result in a better
allocation of resources in the future.
From the case study presented, it was interesting to observe the fairly robust agreement between the experts’
opinions. Most of the experts agreed that the goal of promoting multidisciplinarity was the relatively most
important. Additionally, the goal associated with the risk of the proposals was consistently scored as the
least important. In addition to revealing and quantifying the relative importance of the four goals under
consideration, in the future it would be relevant to include other goals that the experts consider as important
for the center’s success. In this case for example, according to the experts’ opinion it would be important
to fund proposals that consider a different range of translation efforts (i.e., incorporate basic science as well
as clinical practice and community engagement initiatives). Other goals such as the alignment of the
proposals with the current NCATS and CTSA priorities, potential to build on existing strengths, exploring
emerging research areas, utilization of current CTSI tools and resources, and innovative proposals were
also mentioned as important goals to be considered in the proposal selection process.
The proposed methodology is intended to complement the existing methods to evaluate proposals. The
main contribution of goal programming is the incorporation of strategic goals that support the vision and
Page 137
120
objectives of centers such as the PSU CTSI. Currently, most proposal evaluation methods do not consider
the fit that those proposals have on the high level objectives of the institutions. Even though proposals can
be evaluated with respect to their research quality, there is still a need for methodologies that connect impact
measures and fit into the institutional strategy.
5.6 Methodology: A Rapid Impact Estimation of Healthcare Interventions
One of the main challenges that researchers face when preparing and presenting a proposal, is to provide a
high-level estimation of the impact of the proposed interventions. Typically, researchers struggle to
properly identify what elements they should consider in order to estimate relevant impact metrics. These
metrics should be clear, coherent, and transparent in order for the evaluator to compare the impact of the
different proposals, and therefore, make informed decisions and resource allocation. To rapidly provide a
high-level estimation of impact, we propose a framework (Rapid high-level impact estimation, RHIE) that
guides the researchers through different relevant questions about the intervention, propose the collection of
relevant information, and recommend cost-effectiveness metrics to be reported. The framework is
composed of five phases; 1) baseline for comparison, 2) understanding impact, 3) QoL data collection, 4)
Intervention characteristics and costs, and 5) robustness and sensitivity. An illustration of the framework is
presented in
In order to properly use the framework, the type of intervention being assessed needs to be understood.
These interventions can be categorized as diagnosis, therapeutic, managing, informing, or/and preventing.
Diagnosis is the identification of the nature of a health disease through the examination of its symptoms.
There are various elements that should be considered in this type of intervention such as potential early
detection, recognizable latent or early symptomatic health states, whether there is an acceptable treatment
for the health disease, existence of other screening or diagnosis tools and their sensitivity and specificity,
determine if current diagnosis tools are acceptable for the population of interest, and costs of potential case
findings, among others.
Therapeutic interventions aim to relieve a health disorder. These treatments are typically associated to
psychological problems in which a patient receives counseling from a therapist.
Managing interventions include those interventions that seek to provide a cure, decrease the short-term
severity of an acute health event (acute management), decrease the severity of a chronic health condition
Page 138
121
(chronic management), full or partial restoration of physical, mental or social functioning, or reduce pain
and suffering from an incurable health condition (Jamison et al., 2006).
Informing can also be named as health teaching which is the communication of facts, ideas, and skills that
can have an impact on changing knowledge, attitudes, beliefs, behaviors, and practices of the individuals.
Some basic steps included in these interventions are the assessment of the population’s beliefs and
knowledge about a health disease and its risks; personalize risk based behavior; understand message,
channels of communication and training; clarify positive effects to be expected; identify and elicit barriers;
promote awareness and provide reminders; and evaluate progress, among others.
Preventing interventions seek to protect people from developing a disease, health condition, or
experiencing an injury. Typically, a preventing intervention involves regular education, legislation,
screening, and immunization. These interventions can be present at different levels, primary prevention,
secondary prevention, or case management (tertiary prevention).
Page 139
122
Figure 5-3. Rapid high-level impact estimation (RHIE) framework
Page 140
123
Baseline for comparison: This phase is necessary to understand and define what the different populations
and treatments under comparison are. For example, in the case of a diagnosis intervention, there are three
main relevant patient populations; those who have not been diagnosed yet, those who are receiving
treatment (typically the best known treatment), and general population. Other sub-categories of populations
could also be included such as best surgical treatment, best drug-based treatment, etc. At the end of this
phase, the patient populations to be compared are identified.
Understanding the impact: An intervention might have different types of impact on people’s health or cost
structure. The objective of this phase is to identify the different impacts that an intervention could
potentially have. The key questions that guide the understanding of the impact are: Is there any difference
in the HRQoL for the two patient populations being compared?, Is there any difference in the progression
of the disease between the two patient populations being compared?, and does the intervention have an
impact on the cost structure or intervention characteristics?. These three questions address the three main
components of cost-effectiveness analysis; mortality, morbidity, and costs. Considering the combination of
responses for the questions, different paths are possible. In cases in which the intervention does not have
an impact on any of the listed components, the intervention should not be considered for further evaluation
(unless there is another good reason to do so). The pathways will result on different sets of information that
should be collected for a high-level impact estimation analysis.
QoL data collection: For those interventions that will impact mortality or morbidity, different sets of
parameters should be collected with the final aim of calculating total QALYs and QALYs gained. There
are two main groups of parameters that can be collected or estimated; those related to the progression of
the disease, and those related to the quality of life. The first group could include parameters such as
mortality, stages of the disease, duration of the stages, progression rate, life expectancy, onset, and other
significant levels of granularity such as age, gender, ethnicity, etc. The second group includes relevant
parameters to obtain the HRQoL. In order to estimate this information, tools such as EQ-5D, SF-36, and
SF-6D could be used (See section 2.5.3). Sources of input to use the HRQoL valuation methods are
literature, small sample size (for rapid estimation), or expert’s opinion. Additionally, a hybrid source can
be used for a more accurate and calibrated estimation. Furthermore, in this section, the evaluator could
decide the time horizon of evaluation as well as the discount rate as required. Typically, most interventions
are estimated using a period of 10 years and a discount rate within the range of 3 – 5%.
Intervention characteristics and costs: In this phase, different cost-effectiveness metrics such as
cost/QALY, ICER, and total QALYs gained by the society, are estimated. Three main groups of parameters
Page 141
124
are needed to be either collected or estimated. The first group includes information about the population
target. Some of the metrics that could be relevant are: population size under target, percentage of the
population suffering from a disease under different levels of granularity (phase, age, gender, ethnicity, etc.).
The second group includes metrics which are relevant to describe the intervention. For example, a
diagnosis-related intervention could include the coverage intended, access to the diagnosis mechanism,
accuracy of detection of disease, specificity, and sensitivity, among others. The third group of metrics serves
to identify the cost structure behind the health intervention. Based on this information, different cost-
effectiveness metrics can be calculated.
Robustness and sensitivity: This approach is intended to provide a rapid high-level estimation of impact of
a certain health intervention. Naturally, some of the parameters used will present a considerable amount of
uncertainty. In order to provide insights about the robustness of the estimation, sensitivity analyses on those
parameters are recommended. These analyses could be conducted to understand the different behavior of
costs or QALYs under different values of critical parameters. In addition, extreme values for those
parameters could be tested to see how they impact the cost-effectiveness metrics.
Before using this framework it must be noticed that its intention is to provide a quick guidance for high-
level estimation. However, deeper levels of granularity could be explored based on a similar logic. Some
of the most used comparisons between populations, intervention characteristics and costs of interventions
are shown in Table 5-3.
5.7 Case Study: Impact Estimation for Early Detection of Parkinson’s
Disease
In this section, a case study is presented to illustrate how QALYs can be calculated to guide cost-
effectiveness analysis that could later on be incorporated into the GP proposal selection problem as a goal.
The case study used in this section is based on a proposal that seek to use a non-invasive sensor device for
predicting early stage neurological disease progression.
5.7.1 Case study overview
The main hypothesis being tested in the proposal is that patient gait and movement data can inform
prediction models for an early stage detection of neurological anomalies in patients’ wellness. The
investigators propose the use of a non-invasive sensor to capture patients’ gait and movement. The proposed
prediction models are based on data mining techniques. Unsupervised and supervised machine learning
Page 142
125
algorithms will be used to uncover hidden patterns. In order to study the impact of the intervention presented
in the proposal, we focus only on patients suffering from the Parkinson’s disease.
Table 5-3. Baseline for comparison and relevant parameters by type of intervention
Type of
intervention
Baseline for
Comparison
Intervention characteristics Cost structure
Diagnostic Undiagnosed
population
General population
Population with
existing treatment
Access and coverage
Accuracy of diagnosis
Sensitivity and specificity
Cost per diagnosis
tool
Specialist costs
Maintenance cost
Informing General population
Population at risk
Population with
existing treatment
Access to information and
education sources
Coverage of information and
education sources
Persuasiveness rate
Adoption and maintenance of
recommended habits
Cost of information
and education
mechanism
Reinforcement costs
Incentive for
adoption costs
Preventing General population
Population at risk
Untreated population
Access to preventing and
education programs
Coverage of preventing and
education sources
Adherence rates
Adoption and maintenance of
recommended habits
Cost of informing,
preventing, and
educating
Reinforcement costs
Incentive for
adoption costs
Therapist Untreated population
Population with the
disease or health
condition
Successful rates of the
therapy
Access to therapy
Coverage of therapy
Adherence rates
Maintenance recommended
habits
Cost of therapy
Reinforcement costs
Managing Untreated population
(when no treatment
exists)
Population with
existing treatment
Population with
proposed treatment
Medical/Surgical/Alternative
treatment successful rates
Access to case management
intervention
Eligibility for the treatment
Successful and adherence
rates
Cost of treatment
(medicine, surgical,
others)
Follow-up and
monitoring costs
Page 143
126
5.7.2 Parkinson’s disease background
Parkinson’s disease is a progressive neurodegenerative disorder that typically affects the elderly population.
Only in the U.S., nearly one million people live with PD. Additionally, each year between 50,000 to 60,000
new cases are diagnosed (Parkinson's Disease Foundation, 2015). According to the National Parkinson
Foundation, about 6,400 people with PD die each year due to poor care (National Parkinson Foundation,
2014). This is also supported by studies that have shown that about 60% of individuals suffering from PD
do not get the expert care that they need (Landro, 2014). Some of the key characteristics of PD patients are
tremor, rigidity, bradykinesia, gait disturbances, and postural instability (Bakheit, 1995, Gelb et al., 1999).
As argued in the literature, using standardized screening procedures with acquisition of early motor
symptoms could help detecting individuals with high risk of PD (Gaenslen and Berg, 2010). A recent study
with a sample of 115 PD patients showed that about 99% of the patients consulted a physician because of
motor symptoms. In the pre-diagnosis phase (≤ 2 years) mild motor signs including asymmetric
bradykinesia and rest tremor were significant by the PD patients (Walter et al., 2013). Moreover, motor
signs such as asymmetry have been found to have a high sensitivity (88%), specificity (54%), and positive
predictive values (85%) for the diagnosis of PD (Busse et al., 2012).
Studies have estimated that when PD is diagnosed according to clinical criteria, more than 50% of the
dopaminergic cells have been degenerated (Fearnley and Lees, 1991). Unfortunately, the early detection of
PD is usually difficult (Bakheit, 1995). In addition, the accuracy of the diagnosis of PD has remained limited
(Gaenslen and Berg, 2010). According to Schrag et al. (2002) about 15% of patients that are diagnosed with
PD do not fulfil the clinical criteria for this disease. Moreover, about 20% of patients with PD that have
already visited medical attention have not been diagnosed.
Stages of Parkinson’s disease
There are different rating scale tools to determine the stage of PD. Most of these tools combine the severity
of movement symptoms and the impact of the disease on the individual’s daily activities. The two most
commonly used scales are the Hoehn and Yahr (Hoehn and Yahr, 1998) and the United Parkinson’s disease
rating scale (UPDRS). The Hoehn and Yahr scale has been widely used to classify PD patients into five
different stages depending on the severity of the effects of the PD on the patient. The UPDRS is a
questionnaire composed of 42 multiple-option questions categorized into four groups; mentation, behavior
and mood; activities of daily living; motor examination; and complications of therapy (Movement Disorder
Society Task Force on Rating Scales for Parkinson's Disease, 2003). Some of the main characteristics of
the Hoehn and Yahr stages are presented in Table 5-4.
Page 144
127
Onset and Mortality
The average onset age for individuals suffering from PD is around 65 years, however some patients suffer
from a much earlier onset (Ishihara et al., 2007, Forsaa et al., 2010). In terms of mortality, studies have
shown that PD is associated to increased mortality compared to the general population (Bennett et al., 1996).
There are some estimations that patients with PD have a 2-fold to 5-fold more risk of mortality compared
to non-demented elderly people (Louis et al., 1997). An early detection and prevention of motor progression
is expected to be a promising strategy to increase life expectancy of patients with PD (Forsaa et al., 2010),
however, studies have not been able to demonstrate this.
According to Ishihara et al. (2007), the life expectancy of PD patients whose onset is between 25 and 39
years old, is 38 years. This is low if compared with the general population for which life expectancy is 49.
For onset between 40 and 64 years old the life expectancy of a PD patient is 21. On the other hand, the life
expectancy of the general population is 31. Similar conclusions were also provided for the age at time of
death. Life expectancy and age at the time of death were significantly worse for patients suffering from PD.
However, others have argued that given the pharmacological advances, most PD patients are not associated
to shortened life expectancy if managed well by specialists (Greener, 2009).
Table 5-4. Hoehn and Yahr stages and characteristics
Hoehn and
Yahr stage
Characteristics
Stage 1 1. Mild movement symptoms on one side of the body
2. Symptoms may be inconvenient but they do not affect the individual’s daily activities
3. Usually presents with tremor of one limb
4. Friends and relatives may notice changes in the individual’s posture, walking, or facial
expressions
Stage 2 1. Symptoms begin to affect both sides of the body
2. Minimal disability
3. Posture and gait affected
Stage 3 1. Body movements are slower
2. Problems with balancing and coordination may develop
3. Freezing episodes of some parts of the body may occur
4. Generalized moderately severe dysfunction
Stage 4 1. Severe symptoms
2. Walking is very limited
3. Inability to live alone
4. Tremor may be less than earlier stages
5. Rigidity and bradykinesia
Stage 5 1. Most of the time confined to bed or wheelchair
2. Inability to stand or walk
3. Cognitive problems may appear. They include hallucinations and delusions
4. Invalidism complete
Page 145
128
Existing treatments and their cost-effectiveness
Although there is no cure for PD, treatments can decrease its symptoms. For example the use of carbidopa
and levodopa are found to significantly reduce the symptoms for one to five years in 25% of the patients.
In addition to carbidopa and levodopa, several other drug treatments have been developed in the past two
decades (Dams et al., 2011). Furthermore, surgical interventions have also been used for treating PD. The
deep brain stimulation (DBS) surgery has been found to be very promising. Studies estimated that DBS
provides additional 0.72 QALYs at an additional cost of $35,000 compared with the best medical
management known. Therefore, the ICER is $49,000 (Tomaszewski and Holloway, 2001). A detailed
review of cost-effectiveness analysis of treatments for Parkinson’s disease can be found in Dams et al.
(2011). This review includes evaluations of drug treatments, surgical options, and diagnosis.
5.8 Results of Rapid Impact Estimation
After understanding the characteristics of the disease, the RHIE framework can be used to estimate the
impact of the proposed intervention. According to the characteristics of this disease, there are treatments
that can have an impact on the quality of life of treated patients with respect to untreated/undiagnosed
individuals. However, the existing treatments do not have an impact on the progression of the disease.
Therefore, according to the RHIE framework, data is needed with respect to the quality of life of
undiagnosed/untreated patient and diagnosed/treated patients according to the required level of granularity.
In this case, the best grouping or level of granularity identified was to categorize PD patients according to
their HY stage. However, other more detailed categories or levels such as age, gender, and ethnicity could
have been used. Nevertheless, for a rapid estimation this data was not easily available.
5.8.1 Potential QALYs gained
Zhao et al. (2010) estimate the progression of PD by analyzing the transit time from one stage to another
using the HY scale. Their results indicate that the median time to transit from stage 1 to 2, from 2 to 2.5,
and from 2.5 to 3 are 20, 62, and 25 months respectively. Additionally, the transit times in more advanced
stages were 24 and 26 months to move from stage 3 to 4 and 4 to 5 respectively. Therefore, the overall
mean time from disease onset to phase 5 is about 13 years. This value is aligned to what has been found by
other studies. According to Hoehn and Yahr (1998) the median delays before reaching stage 4 and stage 5
are 9 and 14 years respectively. However, there is a high heterogeneity among patients. For example, about
one third of the patients with disease duration over 10 years are still in phases 1 and 2. In addition, it must
Page 146
129
be noticed that, typically, treatments are not offered in stage 1. In order to estimate the HRQoL for each
stage, a literature review approach was used (Table 5-5). As also recommended in this framework, this
information could have been obtained from experts’ opinion or estimated from a small population sample.
Table 5-5. HRQoL of treated vs untreated PD patients by HY stage
Hoehn and
Yahr stage
Median
duration1
Cumulative
duration
Treated EQ-
5D SI2
Untreated EQ-
5D SI5
Stage 1 24 24 0.9 0.9
Stage 2 62 86 0.753 0.6
Stage 2.5 25 111 0.6 0.4
Stage 3 24 135 0.3 0.25
Stage 4 25 160 0.2 0.2
Stage 5 86 168 04 0 1 Zhao et al. (2010) 2 (Schrag et al., 2000) 3 Estimated 4 at the end of the stage 5 Estimated based on
symptoms 6 Estimated based on life expectancy of 79 years and onset at age 64.9.
From the data it can be said that on average, patients that were diagnosed in phase 2 could have received
treatment to increase their quality of life during 43.5 months. Additionally, those patients diagnosed in
phase 3, were untreated during all phase 2 (87 months) plus 12 months in phase 3. The potential QALYs
gained by individuals suffering from PD that are detected in stages 2 and 3 are shown in Figure 5-4.
Figure 5-4. QALYs gained by currently undiagnosed individuals
Page 147
130
From the analysis, patients that were diagnosed in stages 2 and 3 lost 0.18125 (2.175months) and 0.8875
(10.65 months) QALYs respectively. An early detection of those patients can therefore add QALYs into
the society. It must be noted that this estimations did not include a discount rate to estimate QALYs in
present value.
5.8.2 Cost per QALY
The cost of this diagnosis intervention will mostly depend on the promotion mechanism to make the
diagnosis available for the population. For instance, at the most granular level, this device could be available
at the household level, in which the average household size in the U.S. is 2.58 (Census, 2010). However,
most families do not have access to this device (multi-sensor). Another, more realistic implementation
setting might be to install devices in places that reach fairly large groups of people (hospitals, commercial
centers, schools, universities, etc.). In such cases, the number of devices needed to reach potential PD
patients decreases substantially.
For the base case, it was estimated that the cost to detect one case is USD 10,000. In addition, the cost per
installed device was estimated to be USD 300. Accordingly, 33 devices are needed to cover a group of 82
individuals each to detect one case of PD in stages 2 or above. In other words, the number of screened
individuals to detect a PD individual in stages 2 or above is 2,722. These estimates include the assumptions
of sensitivity (90%), coverage (20%), undiagnosed population in stages 2 and 3 (65.2%). These estimates
lead to a cost-effectiveness of the intervention of 29,370 USD/QALY. Under these parameters and typically
used cost-effectiveness thresholds, this intervention is said to be cost-effective.
5.8.3 Overall impact on society
In order to estimate the overall impact on population of this health intervention, data with respect to the
target population, diagnosis parameters, and stages in which the disease is currently being diagnosed are
needed. This data is presented in Table 5-6. It must be noted that the estimation will include only the PD
population which is currently undiagnosed and not the new cases. In order to include the yearly new cases,
a time horizon of ten years would be recommended.
In the U.S. it has been estimated that approximately 200,000 individuals suffering from PD have not been
diagnosed (Huse et al., 2005). From the information presented in Table 5-6, it can be estimated that about
101,000 out of the 200,000 undiagnosed PDs are in stage 2. On the other hand, approximately 29,400
undiagnosed PDs are in stage 3. The diagnosis intervention presented in the proposal intends to target 20%
of the entire population and have an accuracy of detection of 90%. Therefore, it is estimated that the
potential new PD cases diagnosed in stages 2 and 3 are 18,180 and 5,292 respectively. In terms of QALYs,
Page 148
131
undiagnosed PDs in stage 2 could gain 0.18125 QALYs. In other words 3,295 QALYs in total. For
undiagnosed PDs in stage 3, the society could gain 4,697 QALYs in total (0.8875 QALYs/patient). In
conclusion, 7,992 QALYs can be added into the society.
Table 5-6. Data for estimating overall impact on society
Population
Parameter Value Reference
Total U.S. population 319,436,548
inhabitants
http://www.census.gov/popclock/
Total undiagnosed PD 200,000 inhabitants Huse et al. (2005)
Annual PD diagnoses 60,000 (Parkinson's Disease Foundation,
2015)
% PD diagnosed in stage 2 50.5%1 Muslimović et al. (2007)
% PD diagnosed in stage 3 14.7% Muslimović et al. (2007)
Diagnosis mechanism parameters
Percentage of population to target with
the diagnosis tool
20%
Accuracy - Sensitivity 90% Previous analysis
Relevant calculated parameters (population scope)
Undiagnosed PD in stage 2 101,000
Undiagnosed PD in stage 3 29,400
Potential new cases diagnosed in stage 2 18,180
Potential new cases diagnosed in stage 3 5,292
Shifted population to new diagnosis
mechanism
12,000
1 Include patients in Stages 2 and 2.5
5.8.4 Sensitivity analysis
One of the main drawbacks of using high-level estimations is that some of the parameters used are subject
to significant uncertainty. In this regard, sensitivity analysis on those parameters provides a clear vision of
how robust the results in terms of cost-effectiveness are. While economic models are useful to approximate
the estimation of impact under given conditions, uncertainty cannot be removed. One-way sensitivity
analyses are intended to provide an assessment of the impact of changes in the parameters and how those
Page 149
132
changes can have an impact on the model’s conclusions. Additionally, sensitivity analysis can help the
researcher to identify what are the key drivers of the model’s results.
One-way sensitivity
According to the estimations, undiagnosed individuals in stages 2 and 3, could gain 0.1813 and 0.8875
QALYs respectively. In order to facilitate the interpretation of the sensitivity analysis, a weighted average
of QALYs gain will be used. Therefore, on average an undiagnosed PD individual could gain 0.3405
QALYs if properly treated. A sensitivity analysis was conducted to account for the uncertainty that could
be present when estimating QALYs (Figure 5-5). The base case considers a cost per case of USD 10,000,
which under the current estimations is translated to USD 29,370 per QALY. This value is just over the
threshold for interventions considered to be very cost-effective (USD 25,000). It can be said that an
intervention with a cost per case of USD 10,000 is very cost-effective for values of QALYs gained of 0.4
and above, reaches the typical cost-effectiveness for ranges of QALYS gained between 0.2 and 0.4, and
becomes ineffective for values of QALYS gained of 0.1 or below. From these results, it can be said that the
intervention is robustly cost-effective under the uncertainty or errors of estimation of QALYs gained. The
same figure includes the sensitivity for three levels of cost per case. If the cost per case were double the
initial estimate (i.e., USD 20,000 per case), then in order for the intervention to be very cost-effective, the
QALYs gained must be 0.8 or above, to be cost-effective under the typical threshold the QALYs gained
must be between 0.4 and 0.8, and finally, the intervention is ineffective if the QALYs gained are 0.2 or
below. Finally, for an extreme cost per case of USD 30,000, the intervention will be very cost-effective if
the QALYs gained are 1.2 or above, typically cost effective for a range of QALYs gained between 0.6 and
1.2, and ineffective for values of QALYs gained below 0.3. These results also show that the intervention is
robust in terms of cost-effectiveness. Even though the cost per case is three times the initial estimate, the
intervention will still be cost-effective under the base case estimate of QALYs gained (0.34048). Under the
estimates for the QALYs gained, the cost per case could be increase up to USD 34,048 to maintain the cost
per QALY above the maximum cost-effectiveness threshold of 100,000 USD/QALY.
Page 150
133
Figure 5-5. Cost-effectiveness sensitivity for QALYs gained and cost per diagnosed case
A tornado chart is presented in Figure 5-6 to show how sensitive the cost-effectiveness of the intervention
is given a ± 20% change on various relevant parameters including cost per case, cost per installed device,
device coverage, QALYs gained, accuracy, and sensitivity of the diagnosis tool. Out of these list, the last
two parameters have the same impact on the cost-effectiveness of the intervention. If one of these
parameters decreases by 20% (from 0.90 to 0.72), the cost per QALY increases to 45,891, which represents
an increment of 56%. On the other hand if one of these parameters increases up to 1 (approximately 11%),
the cost per QALY decreases to 22,028. A sensitivity for the QALYs gained parameter showed that if it
increases 20% (0.409), the cost-effectiveness becomes 24,475 USD/QALY. Additionally, if the QALYs
gained is decreased by 20% (0.272), the cost-effectiveness becomes 36,713 USD/QALY. Finally, the
parameters cost per case, cost per installed device, and coverage of the diagnosis device have the same
impact. If one of these parameters decreases by 20%, the cost per QALY decreases to 23,496. On the other
hand if one of these parameters increases by 20%, the cost per QALY increases to 35,244. From these
analysis, it can also be said that the intervention is fairly robust. Under a ± 20% one-way sensitivity for the
parameters shown, the intervention remains cost effective (< 50,000 USD/QALY).
Page 151
134
Figure 5-6. Cost-effectiveness tornado sensitivity for relevant parameters
The selection of the implementation design plays an important role on the cost-effectiveness of this
diagnosis intervention. The base case assumed a medium reachability for each device (82 individuals per
device), however, other designs such as household level, in which the reachability per device is on average
2.58 individuals, are non-cost-effective. In this scenario, the cost per case becomes USD 319,691, which
lead to a cost of USD 938,940 per QALY. On the other hand, if the implementation design is capable of
reaching large groups per device (e.g., hospitals, supermarkets, drug stores, etc.), the intervention becomes
very cost-effective. For example, if the reachability per device can be increased to 200 individuals, the cost
per case decreases to USD 4,140, which is equivalent to a cost of 12,112 USD/QALY.
5.9 Discussion of Rapid Impact Estimation
The RHIE Framework for cost-effectiveness estimation of healthcare interventions was used to rapidly
estimate the potential impact of the proposal presented. One of the main challenges of the proposals is to
quantify their impact on people’s health. In this sense, cost-effectiveness analysis encourages researchers
to think about their proposed interventions in terms of the value that can be added into the society. It is
important, however, that the estimations isolate the impact of the proposed intervention to avoid double
counting the benefits of other existing factors. For example, the case study proposed a diagnosis
intervention, and therefore, only the benefits given by this intervention should be counted towards the
estimation of its impact and not the benefits of existing interventions to treat newly diagnosed patients.
Page 152
135
It is also important to understand that some interventions might be highly benefited from other
interventions. For instance, a diagnosis intervention could potentially increase its benefits if a promoting or
informing intervention is also put in place. In such cases, synergies might also be estimated using a cost-
effectiveness analysis approach to demonstrate the value of investing in complementary interventions
instead of on a particular effort. In this regard, one of the main challenges of the rapid high-level impact
estimation was to properly estimate the coverage of each installed diagnosis device.
Although in the case study presented, the most representative level of granularity was the stage of the
disease, other levels such as age, gender, and ethnicity might be more relevant in other health diseases.
Therefore, it is encouraged to identify a level of granularity that provides reliable results for a high-level
estimation. It should also be noticed that the main aim of the rapid estimation framework was to guide the
estimation of impact with an emphasis on initial phases of investigation such as research proposals.
Nevertheless, the framework can be easily adjusted to incorporate a deeper level of detail and accuracy in
the estimation of impact.
Sensitivity analysis on relevant parameters and different scenarios is highly encouraged. Adding sensitivity
analysis to cost-effectiveness analyses are useful to evaluate the robustness of the estimations presented
and key drivers of cost-effectiveness of interventions. Additionally, it adds credibility in terms of providing
the range of conditions under which an intervention will still be justifiable from a cost versus value
perspective. Testing scenarios is also encouraged as a way to anticipate potential changes in the future. For
instance, promising drugs that shift the progression curve of PD are being tested. Therefore, having a
diagnosis mechanism such as the presented in the case study incorporates preparedness and could have a
larger impact in an scenario in which a treatment to impact PD progression is developed.
From a practitioner’s perspective, the proposed RHIE framework is expected to formalize and demonstrate
some unproven believes in health sciences. For instance, it is believed that the specialists in neurological
disorders might provide a more accurate treatment for PD patients than general practitioners. However,
proving this statement is typically difficult for practitioners. In response, the RHIE could provide a fair
quantification of the differences of impact between the treatments proposed by each group of physicians.
Therefore, such analysis could justify or not, the efforts to increase the capacity of specialists on certain
diseases. Another practical instance of the potential benefits of using the RHIE framework is to evaluate
the impact of complementary interventions or treatments. According to Dr. Xuemei Huang, (Director of
the Hershey Brain Analysis Research Laboratory for Neurodegenerative Disorders at the Penn State
Hershey Medical Center) it would be very interesting to evaluate the complementary benefits of multiple
Page 153
136
treatments for PD patients such as physical therapy in addition to a drug-based treatments. The RHIE tool
provides a suitable framework for such evaluations.
5.10 Incorporating Economic Evaluation into the Proposal Selection Problem
As previously argued, CEA is especially useful when comparing interventions that address different types
of health diseases or risks (Jamison et al., 2006). Consequently, scarce resources can be allocated in such a
way that if they are distributed using cost-effectiveness principles, more health improvements are generated.
Incorporating strategic, health, and financial metrics in the proposal selection provides a robust mechanisms
to select a mix of interventions that is balanced around the different goals of an organization. In this regard,
cost-effectiveness metrics can be incorporated as an additional goal into the GP model previously
formulated and discussed.
For instance, the organization can have as a goal to select interventions that meet the typical cost-
effectiveness thresholds. This can be formulated as:
𝐶𝐸𝑖𝑥𝑖 + 𝑑𝐶𝐸𝑖+ − 𝑑𝐶𝐸𝑖
− = 𝐶𝐸𝑡ℎ𝑟𝑒𝑠ℎ𝑜𝑙𝑑 ∀𝑖 Eq. 521
where:
CEi Cost-effectiveness (USD/QAL) associated to project i
CEthreshold Threshold used in CEA. Typically 50,000 USD/QALY
𝑑𝐶𝐸𝑖− Negative deviational variable associated to cost-effectiveness of proposal i
𝑑𝐶𝐸𝑖+ Positive deviational variable associated to cost-effectiveness of proposal i
In this case, contribution of this goal could be expressed as:
𝑤𝐶𝐸
⌈𝐵𝑈𝐷𝑚𝑎𝑥
𝐵𝑈𝐷𝑎𝑣𝑔|0.1⁄ ⌉𝐶𝐸𝑡ℎ𝑟𝑒𝑠ℎ𝑜𝑙𝑑
∗ ∑ 𝑑𝐶𝐸𝑖− Eq. 522
𝑛
𝑖=1
where:
wCE weight of cost-effectiveness goal
Page 154
137
Some other alternatives to incorporate cost-effectiveness as a goal could be, for instance: 1) Limiting the
number of proposals that are over the threshold, 2) Targeting for the average cost-effectiveness of the mix
selected, and 3) Selecting interventions that are very cost-effective, among others. These alternatives can
be formulated as:
1) Limiting the number of proposals that are over the threshold
𝑥𝑖 + 𝑑𝐶𝐸+ − 𝑑𝐶𝐸
− = 𝑁𝐶𝐸𝑚𝑎𝑥 ∀𝑖 𝑖𝑛 𝑤ℎ𝑖𝑐ℎ 𝐶𝐸𝑖 > 𝐶𝐸𝑡ℎ𝑟𝑒𝑠ℎ𝑜𝑙𝑑 Eq. 523
where:
𝑁𝐶𝐸𝑚𝑎𝑥 Maximum number of proposals that are allowed to be over the cost-effectiveness threshold
𝑑𝐶𝐸− Negative deviational variable associated to the cost-effectiveness goal
𝑑𝐶𝐸+ Positive deviational variable associated to the cost-effectiveness goal
2) Targeting for the average cost-effectiveness of the mix selected
∑ 𝐶𝐸𝑖𝑛𝑖=1 𝑥𝑖
⌈𝐵𝑈𝐷𝑚𝑎𝑥
𝐵𝑈𝐷𝑎𝑣𝑔|0.1⁄ ⌉+ 𝑑𝐶𝐸
+ − 𝑑𝐶𝐸− = 𝐶𝐸𝑡ℎ𝑟𝑒𝑠ℎ𝑜𝑙𝑑 ∀𝑖 Eq. 524
3) Selecting interventions that are very cost-effective
𝑥𝑖 + 𝑑𝐶𝐸+ − 𝑑𝐶𝐸
− = 𝑁𝐶𝐸𝑣𝑒𝑟𝑦𝐶𝐸 ∀𝑖 𝑖𝑛 𝑤ℎ𝑖𝑐ℎ 𝐶𝐸𝑖 < 𝐶𝐸𝑚𝑖𝑛𝑡ℎ𝑟𝑒𝑠ℎ𝑜𝑙𝑑 Eq. 525
𝑁𝐶𝐸𝑣𝑒𝑟𝑦𝐶𝐸 Minimum number of proposals that are considered to be very cost-effectiveness.
5.11 Conclusions
The models proposed in this chapter seek to provide guidance to decision makers and researchers in
healthcare fields. Healthcare decision makers in charge of the resource allocation process face various
challenges regarding the trade-offs between conflicting objectives. In order to overcome some of these
challenges, a GP formulation is offered as a guidance to incorporate the different goals into a single model.
Additionally, the model is able to incorporate the strategy of the organization as a way of selecting the best
courses of action to aim the achievement of long-term goals. In particular, the GP model can be used in the
Page 155
138
proposal selection problem to select the best mix of healthcare interventions. On the other hand, this chapter
offers a framework that can be used by researchers to rapidly estimate the impact of healthcare interventions
under a cost-effectiveness analysis umbrella. As argued by the NIH and the WHO, cost-effectiveness
analysis are useful to provide a coherent baseline for comparison among different interventions that seek to
improve people’s health. Accordingly, the provision of structured information to quantify the potential
impact of an intervention is highly needed to justify its implementation. Hence, cost-effectiveness metrics
are helpful for healthcare decision makers to evaluate and prioritize funding effectively.
The models and frameworks that were presented relay on data-driven information. Consequently,
organizations are encouraged to monitor and track data that can be used as a way to formalize and
operationalize lessons learned. For instance, the CTSA program has encouraged its CTSA hubs to track
information for at least 10 years. Additionally, sharing information of lessons learned among CTSA hubs
is a key priority to guide the use of the resources in a wiser manner. This aims to generate a better capacity
of impacting people’s health. Future work along these lines include the use of more sophisticated techniques
such as big data and machine learning to extract information from big data sources.
Page 156
139
Chapter 6
CONTRIBUTIONS AND FUTURE WORK
This chapter summarizes the main contributions of this dissertation as well as future research lines that can
be based upon the work that was presented to expand the quality improvement research approaches. The
areas of contribution were categorized into four groups: 1) identifying key drivers and prioritizing efforts;
2) closing existing gaps; 3) engaging the participation of health professionals; and 4) guiding the strategy
of healthcare organizations.
It has been extensively reported that data-driven decision tools are needed for assuring the efficiency and
effectiveness of the decision making process. This is especially important for healthcare organizations
which are typically characterized by their fragmentation, dynamism, and complexity (Reid et al., 2005). In
order to face these challenges, this dissertation explores the potential contribution of traditional and non-
traditional quality improvement tools to support the understanding and analysis of complexity of healthcare
systems, in particular, the translational research process. Consequently, a more comprehensive and
inclusive research-oriented quality improvement approach can be developed.
One of the commonalities of the different methods that were explored in this dissertation is that all of them
are data-driven and can guide the allocation of efforts. This supports the aims of the NIH, IOM, and NAE
that seek to promote and enhance the use of data-driven approaches to optimize the use of scarce healthcare
resources. Consequently, healthcare decision makers have access to more robust tools and guidance for an
effective allocation of efforts and resources.
Page 157
140
6.1 Identifying Key Drivers and Prioritizing Efforts
Generating frameworks to identify key drivers of improvement and prioritize efforts is one of the key
contributions of this dissertation. Quality improvement research frameworks were provided to be used by
decision makers and researchers at various levels in a healthcare organization. Given the relatively scarce
resources in healthcare fields, in order to maximize value, efforts must be prioritized according to their
contribution (Ockene et al., 2007). In Chapter 3, the combined QFD-AHP approaches served to identify the
key drivers in translational research as well as quantifying the importance of each operational step along
this process. From a health policy perspective, the results provide guidance for decision makers to
understand the dynamic of translational research and how different technical requirements are needed to be
prioritized depending on the translational phase. From these results, multi-disciplinary collaboration was
found to be one of the most important requirements for translational research efforts to succeed. In response,
Chapter 4 provided a comprehensive tool for evaluating collaboration. The insights obtained from this
chapter inform decision makers about the current status of collaboration and help understanding its gaps.
Additionally, depending on the type of network intervention, the SNA results aid to identify how to impact
the network efficiently. For instance, dissemination of knowledge can be conducted through the leaders or
influencers to accelerate the rate of information flow. Hence, this chapter provided another clear example
of how to prioritize efforts. Finally, in Chapter 5 a multiple criteria model was presented for the proposal
selection problem. This model aimed to select the best mix of proposals that maximize the whole value
while meeting strategic objectives of the organization. Moreover, the cost-effectiveness analysis presented
is helpful for guiding the resource allocation in a more effective manner. All three chapters provided tools
to prioritize efforts that result in a wiser distribution of resources.
6.2 Closing Existing Gaps
This dissertation contributed to the identification of current gaps and understanding courses of action that
could close them. Additionally, this dissertation expanded the literature that seek to build a partnership
between engineering and healthcare enterprises through an expanded quality improvement research toolkit.
These efforts respond to the three main aims expressed by the NAE and IOM (Reid et al., 2005):
“1) identify engineering applications that could contribute significantly to improvements in
healthcare delivery in the short, medium, and long terms; 2) assess factors that would facilitate or
impede the deployment of these applications; and 3) identify areas of research in engineering and
other fields that could contribute to rapid improvements in performance.”
Page 158
141
Chapter 3 provided a robust framework for identifying and quantifying the importance of the different
operational steps and technical requirements needed. Having a clear mapping of the translational research
process will, certainly, help to build a stronger coordination between the different translational phases.
Consequently, the agreements generated can build a strong capacity to accelerate the pace at which new
discoveries become clinical practice, which is one of the main gaps in translational research. The framework
provided in Chapter 4 contributed to a better identification of current collaboration gaps. The visual and
mathematical-based metrics are highly valuable for designing actions to close those gaps. Finally, in
Chapter 5, mechanisms to close the gaps related to the understating of impact of healthcare interventions
and quantifying organizational strategic goals are provided with the ultimate aim of a better allocation of
resources.
These topics covered are aligned to the NAE-IOM collaboration effort that attempts to bridge the
knowledge and awareness that divides healthcare professionals from potential partners in systems
engineering. Moreover, the contributions made in this dissertation are aligned to what has been requested
by the CTSA to each one of the CTSA hubs in terms of a better coordination, collaboration, and use of
data-driven techniques. Those challenges are considered to be main gaps in translational research.
6.3 Engaging the Participation of Health Professionals
It has been widely studied that one of the main elements contributing to the inefficiency in healthcare
systems is the lack of a proper implementation phase. One of the main barriers concerning implementation
is the practically null collaboration between health professionals, health managers, and engineers. In
response to this, all three body chapters of this dissertation include the participation of health professionals.
This participation encompassed mechanisms for capturing the “voice” of different healthcare stakeholders,
quantifying opinions, and engaging them to use the frameworks presented in this dissertation. These points
are critical for the development of trust, shared understanding, and the generation of short and long-term
partnerships between engineering and healthcare. In Chapter 3, for instance, healthcare stakeholder’s
opinion was incorporated to identify key elements in translational research and quantify their importance.
In Chapter 4, healthcare stakeholders were integrated to provide meaning to the collaboration network
developed. Finally, in Chapter 5, healthcare managers’ opinions were used for developing the multiple-
criteria decision making model based on the current goals of the organization that were used as case study.
Moreover, the RHIE framework was presented to health specialists to develop a shared understanding of
the impact of healthcare interventions, and also, to encourage this approach for future quantifications of
impact.
Page 159
142
6.4 Guiding the Strategy of Healthcare Organizations
Currently, most of the engineering tools that have been used in healthcare fields seek to solve problems at
the tactical or operational level. However, incorporating tools to guide the strategy should also be
considered as critical as they provide guidance for actions and policy to achieve a major goal. In order to
respond to this gap, all three main chapters of this dissertation provide quality improvement research
frameworks that can be used for informing healthcare managers and policy makers at the strategic level.
The framework provided in Chapter 3 could be used for a better coordination and translation between the
translational research phases. The overall roadmap for translation was included to guide a strategic
allocation of resources. In Chapter 4, strategic goals with respect to multi-disciplinary collaboration can be
achieved by having a better understanding of the network structures. Finally, in Chapter 5, the proposal
selection method provided seek to incorporate the organizational vision into the resource allocation problem
of the healthcare organization.
All the contributions are aligned with the objective of moving basic research to clinical practice in a more
effective and efficient manner. And thus, materialize promising innovative developments made in early
research phases.
6.5 Future Work
Opportunities for system and quality engineering researchers are wide in supporting translational research.
From this dissertation, several branches of future work in expanding quality improvement research can be
envisioned.
Future research lines based upon the work presented in Chapter 3 include: 1) Identification of translational
research benchmarks, 2) Generation of agreement about process markers and technical requirements, 3)
Identification of similar translational research efforts in which lessons of translation can be implemented,
and 4) Investigation and understanding of barriers in translational research. The QFD-AHP framework
provides a robust structure to quantify the importance of processes markers along the translational research
processes. Future work could include the operationalization of those process markers by identifying key
metric that could be then used to identify benchmarks between different translational research initiatives.
Moreover, the QFD-AHP framework could be extended and used as a mechanism to quantify the
importance of the different process markers and technical requirements in different translational research
Page 160
143
efforts. This can serve to set the baseline and agreement in terms of where the focus should be when
translating knowledge from basic to practice. Similarly, the proposed framework could be extended to
evaluate similarities among different translational research projects. Hence, best practices and lessons
learned can be shared between and within translational research areas. Finally, the quantification of the
relative importance of the technical requirements in translational research could be used as a roadmap for
a more in depth analysis of barriers along the translational research process. Thus, other quality
improvement tools such as RCA and FMEA can provide support to elicit those barriers. Consequently, a
less fragmented journey from basic research to clinical practice can be achieved.
From Chapter 4, some of the future research lines envisioned are: 1) Understanding of “optimal”
collaboration networks, 2) Evaluation of program effectiveness, and 3) Evaluation of multi-disciplinary and
its evolution. SNA provides rich structure in terms of visualization and mathematical background to identify
and understand patterns of collaboration within a network. Future research envisions the use of SNA to
support the design of collaborative structures as a way to find and shape “optimal” networks. This concept
of optimal network will depend on the objective of the collaboration, it can be related to the acceleration of
the transmission of knowledge within the network, stronger clustering structures, stronger cohesion,
stronger multidisciplinarity, etc. In this sense, network modeling techniques, such as dynamic network
modeling, could be used to test the impact that different interventions can have on the network. In addition,
SNA can be used as a monitoring tool for program evaluation. This line of research becomes relevant to
address the key collaboration objectives aimed by the CTSA. In alignment to this, SNA could also be used
to evaluate how health research has become a multidisciplinary field and what aspects of the curriculum
should be modified to respond to the current needs. As it has been emphasized, multidisciplinarity plays a
key role in the understanding and acceleration of translational research.
Future work concerning the topics covered in Chapter 5 include: 1) Define a standardized structure to share
proposals’ outcomes and best practices, 2) Investigate mechanisms to formalize data capturing and
extraction of information, and 3) Use the RHIE framework in practical comparisons between healthcare
interventions. The CTSA called for a stronger collaboration and data sharing across the CTSA hubs. This
becomes relevant for the generation of data-driven approaches that seek to inform healthcare management.
The GP framework could help incorporating standardized proposals’ information with the aim of improving
resource allocation practices. Aligned to this idea, formal mechanisms for information extraction need to
be investigated. In this sense, data mining approaches could be appropriate for identifying patterns that
drive the success or failure of a healthcare intervention. Finally, in the short-term, the RHIE can be used
for rapid comparison between different healthcare interventions. In particular, the case of PD presented in
this dissertation will be extended to evaluate different treatments for PD patients. The main aim of this
Page 161
144
future research is to evaluate whether there is a significant difference in terms of cost-effectiveness and
quality of life of patients receiving the treatment recommended by general practitioners, drug-based
treatment recommended by a specialist, and complementary alternative treatment recommended by a
specialist.
All the above mentioned future work lines aim to integrate systems engineering and quality improvement
research to support data-driven mechanisms and inform health decision making processes. And thus,
helping to close the current gaps in translational research.
Page 162
145
REFERENCES
ABBASI, A., HOSSAIN, L. & LEYDESDORFF, L. 2012. Betweenness centrality as a driver of preferential attachment in the evolution of research collaboration networks. Journal of Informetrics, 6, 403-412.
ABRAHAM, A., HASSANIEN, A.-E. & SNÁŠEL, V. 2009. Computational social network analysis: Trends, tools and research advances, Springer Science & Business Media.
AKAO, Y. 1972. New product development and quality assurance–quality deployment system. Standardization and Quality Control, 25, 7-14.
AKAO, Y., MAZUR, G. H. & KING, B. 1990. Quality function deployment: integrating customer requirements into product design, Productivity Press Cambridge, MA.
ANTES, G., GALANDI, D. & BOUILLON, B. 1999. What is evidence-based medicine? Langenbeck's Archives of Surgery, 384, 409-416.
ARTHUR, J. L. & RAVINDRAN, A. 1981. A multiple objective nurse scheduling model. AIIE transactions, 13, 55-60.
AUBKE, F., WÖBER, K., SCOTT, N. & BAGGIO, R. 2014. Knowledge sharing in revenue management teams: Antecedents and consequences of group cohesion. International Journal of Hospitality Management, 41, 149-157.
AZAIEZ, M. N. & AL SHARIF, S. 2005. A 0-1 goal programming model for nurse scheduling. Computers & Operations Research, 32, 491-507.
BAKHEIT, A. 1995. Early diagnosis of Parkinson's disease. Postgraduate medical journal, 71, 151-152. BALDWIN, L.-M., KEPPEL, G. A., DAVIS, A., GUIRGUIS-BLAKE, J., FORCE, R. W. & BERG, A. O. 2012.
Developing a Practice-Based Research Network by Integrating Quality Improvement: Challenges and Ingredients for Success. Clinical and Translational Science, 5, 351-355.
BANKS, J., CARSON, J. & NELSON, B. 2000. DM Nicol, Discrete-Event System Simulation, Prentice hall Englewood Cliffs, NJ, USA.
BARRETT, J. S., FOSSLER, M. J., CADIEU, K. D. & GASTONGUAY, M. R. 2008. Pharmacometrics: a multidisciplinary field to facilitate critical thinking in drug development and translational research settings. The Journal of Clinical Pharmacology, 48, 632-649.
BARTON, G. R., SACH, T. H., AVERY, A. J., JENKINSON, C., DOHERTY, M., WHYNES, D. K. & MUIR, K. R. 2008. A comparison of the performance of the EQ‐5D and SF‐6D for individuals aged≥ 45 years. Health economics, 17, 815-832.
BATALDEN, P. B. & DAVIDOFF, F. 2007. What is “quality improvement” and how can it transform healthcare? Quality and Safety in Health Care, 16, 2-3.
BENNETT, D. A., BECKETT, L. A., MURRAY, A. M., SHANNON, K. M., GOETZ, C. G., PILGRIM, D. M. & EVANS, D. A. 1996. Prevalence of parkinsonian signs and associated mortality in a community population of older people. New England Journal of Medicine, 334, 71-76.
BENNETT, L. M., GADLIN, H. & LEVINE-FINLEY, S. 2010. Collaboration \& Team Science: A Field Guide, NIH Office of the Ombudsman, Center for Cooperative Resolution.
BENSOUSSAN, A., CHANG, S., MENZIES, R. & TALLEY, N. 2001. Application of the general health status questionnaire SF36 to patients with gastrointestinal dysfunction: initial validation and validation as a measure of change. Australian and New Zealand journal of public health, 25, 71-77.
BENTON, D. C. & FERNÁNDEZ, M. P. F. 2014. Social network analysis: A tool for the identification of next generation trainers. Collegian, 21, 311-318.
BERWICK, D. M. 2003. Disseminating innovations in health care. JAMA: the journal of the American Medical Association, 289, 1969--1975.
Page 163
146
BEST, A., STOKOLS, D., GREEN, L. W., LEISCHOW, S., HOLMES, B. & BUCHHOLZ, K. 2003. An integrative framework for community partnering to translate theory into effective health promotion strategy. American Journal of Health Promotion, 18, 168-176.
BHARMAL, M. & THOMAS, J. 2006. Comparing the EQ‐5D and the SF‐6D Descriptive Systems to Assess Their Ceiling Effects in the US General Population. Value in Health, 9, 262-271.
BIAN, J., XIE, M., TOPALOGLU, U., HUDSON, T., ESWARAN, H. & HOGAN, W. 2014. Social network analysis of biomedical research collaboration networks in a CTSA institution. Journal of biomedical informatics, 52, 130-140.
BLACK, D. 1976. Partial justification of the Borda count. Public Choice, 28, 1-15. BLAKE, J. T. & CARTER, M. W. 2002. A goal programming approach to strategic resource allocation in acute
care hospitals. European Journal of Operational Research, 140, 541-561. BORGATTI, S. P. & EVERETT, M. G. 2006. A graph-theoretic perspective on centrality. Social networks, 28,
466-484. BORGATTI, S. P. & FOSTER, P. C. 2003. The network paradigm in organizational research: A review and
typology. Journal of management, 29, 991-1013. BORGATTI, S. P., MEHRA, A., BRASS, D. J. & LABIANCA, G. 2009. Network analysis in the social sciences.
science, 323, 892-895. BORNMANN, L. & LEYDESDORFF, L. 2015. Topical connections between the institutions within an
organisation (institutional co-authorships, direct citation links and co-citations). Scientometrics, 102, 455-463.
BOUSQUET, J., KNANI, J., DHIVERT, H., RICHARD, A., CHICOYE, A., WARE JR, J. E. & MICHEL, F. 1994. Quality of life in asthma. I. Internal consistency and validity of the SF-36 questionnaire. American journal of respiratory and critical care medicine, 149, 371-375.
BOWER, J. E., GANZ, P. A., DESMOND, K. A., ROWLAND, J. H., MEYEROWITZ, B. E. & BELIN, T. R. 2000. Fatigue in breast cancer survivors: occurrence, correlates, and impact on quality of life. Journal of Clinical Oncology, 18, 743-743.
BOZEMAN, B., FAY, D. & SLADE, C. P. 2013. Research collaboration in universities and academic entrepreneurship: the-state-of-the-art. The Journal of Technology Transfer, 38, 1-67.
BRASS, D. J. 1995. A social network perspective on human resources management. Research in personnel and human resources management, 13, 39-79.
BRAVO VERGEL, Y. & SCULPHER, M. 2008. Quality-adjusted life years. Practical neurology, 8, 175-182. BRAZIER, J., ROBERTS, J. & DEVERILL, M. 2002. The estimation of a preference-based measure of health
from the SF-36. Journal of health economics, 21, 271-292. BRAZIER, J., ROBERTS, J., TSUCHIYA, A. & BUSSCHBACH, J. 2004. A comparison of the EQ‐5D and SF‐6D
across seven patient groups. Health economics, 13, 873-884. BRETTHAUER, K. M. & CǑTÉ, M. J. 1998. A model for planning resource requirements in health care
organizations. Decision Sciences, 29, 243-270. BREYFOGLE III, F. W. 2003. Implementing six sigma: smarter solutions using statistical methods, John Wiley
& Sons. BROUWER, W., VAN HOUT, B. & RUTTEN, F. 2000. A fair representation of future effects: taking a societal
perspective. Journal of Health Services Research and Policy, 5, 1-5. BROWNSON, R. C., COLDITZ, G. A. & PROCTOR, E. K. 2012. Dissemination and implementation research in
health: translating science to practice, Oxford University Press. BURSTEIN, F. & HOLSAPPLE, C. 2008. Handbook on decision support systems 1, New York, Springer-Verlag. BUSSE, K., HEILMANN, R., KLEINSCHMIDT, S., ABU-MUGHEISIB, M., HÖPPNER, J., WUNDERLICH, C.,
GEMENDE, I., KAULITZ, L., WOLTERS, A. & BENECKE, R. 2012. Value of combined midbrain sonography, olfactory and motor function assessment in the differential diagnosis of early Parkinson's disease. Journal of Neurology, Neurosurgery & Psychiatry.
Page 164
147
BUTLER, D. 2008. Translational research: crossing the valley of death. Nature News, 453, 840-842. CALHOUN, W. J., WOOTEN, K., BHAVNANI, S., ANDERSON, K. E., FREEMAN, J. & BRASIER, A. R. 2012. The
CTSA as an Exemplar Framework for Developing Multidisciplinary Translational Teams. Clinical and translational science.
CAMERON, D., ALEMAN-MEZA, B., ARPINAR, I. B., DECKER, S. L. & SHETH, A. P. A Taxonomy-based model for expertise extrapolation. Semantic Computing (ICSC), 2010 IEEE Fourth International Conference on, 2010. 333-340.
CAMERON, D. H. L., ALEMAN-MEZA, B., DECKER, S. & ARPINAR, I. B. 2007. SEMEF: A Taxonomy-Based Discovery of Experts, Expertise and Collaboration Networks. Citeseer.
CAREY, T. S., HOWARD, D. L., GOLDMON, M., ROBERSON, J. T., GODLEY, P. A. & AMMERMAN, A. 2005. Developing effective interuniversity partnerships and community-based research to address health disparities. Academic medicine: journal of the Association of American Medical Colleges, 80, 1039.
CHAERUL, M., TANAKA, M. & SHEKDAR, A. V. 2008. Resolving complexities in healthcare waste management: a goal programming approach. Waste Management & Research, 26, 217-232.
CHAMBERS, D., WILSON, P., THOMPSON, C. & HARDEN, M. 2012. Social network analysis in healthcare settings: a systematic scoping review. PLoS One, 7, e41911.
CHAN, L.-K. & WU, M.-L. 2002. Quality function deployment: A literature review. European Journal of Operational Research, 143, 463-497.
CHANG, C.-L. 2006. Application of quality function deployment launches to enhancing nursing home service quality. Total Quality Management & Business Excellence, 17, 287-302.
CHAPLIN, E. & AKAO, Y. 2003. Translate know-what into know-how. Quality progress, 36, 56-61. CHARNES, A. & COOPER, W. 1961. Management Models and Industrial Applications of Linear
Programming, Vol. I. Wiley, New York. CHARNES, A., COOPER, W. W. & FERGUSON, R. O. 1955. Optimal estimation of executive compensation
by linear programming. Management science, 1, 138-151. CHEEVER, M. A., ALLISON, J. P., FERRIS, A. S., FINN, O. J., HASTINGS, B. M., HECHT, T. T., MELLMAN, I.,
PRINDIVILLE, S. A., VINER, J. L. & WEINER, L. M. 2009. The prioritization of cancer antigens: a national cancer institute pilot project for the acceleration of translational research. Clinical Cancer Research, 15, 5323-5337.
CHOI, B. & PAK, A. 2006. Multidisciplinarity, interdisciplinarity and transdisciplinarity in health research, services, education and policy: 1. Definitions, objectives, and evidence of effectiveness. Clinical and investigative medicine. Medecine clinique et experimentale, 29, 351-364.
CHOMUTARE, T., XU, A. & IYENGAR, M. S. Social Network Analysis to Delineate Interaction Patterns That Predict Weight Loss Performance. Computer-Based Medical Systems (CBMS), 2014 IEEE 27th International Symposium on, 2014. IEEE, 271-276.
CHRISTAKIS, N. A. & FOWLER, J. H. 2007. The spread of obesity in a large social network over 32 years. New England journal of medicine, 357, 370-379.
CHRISTAKIS, N. A. & FOWLER, J. H. 2008. The collective dynamics of smoking in a large social network. New England journal of medicine, 358, 2249-2258.
CHU, S. C. & CHU, L. 2000. A modeling framework for hospital location and service allocation. International transactions in operational research, 7, 539-568.
CLARKE, P., GRAY, A. & HOLMAN, R. 2002. Estimating utility values for health states of type 2 diabetic patients using the EQ-5D (UKPDS 62). Medical Decision Making, 22, 340-349.
COELLI, T. J., PRASADA RAO, D., O’DONNELL, C. J. & BATTESE, G. E. 2005. Data Envelopment Analysis. An Introduction to Efficiency and Productivity Analysis, 161-181.
COLE, S. & SIMON, G. A. 1981. Chance and consensus in peer review. Science, 214, 881-886.
Page 165
148
COOPER, W. W., SEIFORD, L. M. & TONE, K. 2007. Data envelopment analysis: a comprehensive text with models, applications, references and DEA-solver software, Springer Science & Business Media.
CROOKS, A., MASAD, D., CROITORU, A., COTNOIR, A., STEFANIDIS, A. & RADZIKOWSKI, J. 2014. International Relations State-Driven and Citizen-Driven Networks. Social Science Computer Review, 32, 205-220.
CROSS, R., BORGATTI, S. P. & PARKER, A. 2002. Making invisible work visible: Using social network analysis to support strategic collaboration. California management review, 44, 25-46.
DAMS, J., BORNSCHEIN, B., REESE, J. P., CONRADS-FRANK, A., OERTEL, W. H., SIEBERT, U. & DODEL, R. 2011. Modelling the Cost Effectiveness of Treatments for Parkinson’s Disease. Pharmacoeconomics, 29, 1025-1049.
DANNER, M., HUMMEL, J. M., VOLZ, F., VAN MANEN, J. G., WIEGARD, B., DINTSIOS, C.-M., BASTIAN, H., GERBER, A. & IJZERMAN, M. J. 2011. Integrating patients' views into health technology assessment: Analytic hierarchy process (AHP) as a method to elicit patient preferences. International journal of technology assessment in health care, 27, 369-375.
DAVIES, P., WALKER, A. E. & GRIMSHAW, J. M. 2010. A systematic review of the use of theory in the design of guideline dissemination and implementation strategies and interpretation of the results of rigorous evaluations. Implement Sci, 5, 14.
DEVLIN, N. & PARKIN, D. 2004. Does NICE have a cost‐effectiveness threshold and what other factors influence its decisions? A binary choice analysis. Health economics, 13, 437-452.
DIJKSTRA, L. & VAN DER BIJ, H. 2002. Quality function deployment in healthcare: Methods for meeting customer requirements in redesign and renewal. International Journal of Quality & Reliability Management, 19, 67-89.
DIXON, N. & PEARCE, M. 2011. Guide to Using Quality Improvement Tools to Drive Clinical Audits. DOLAN, P. 2008. Developing methods that really do value the ‘Q’in the QALY. Health economics, policy
and law, 3, 69-77. DOLAN, P., GUDEX, C., KIND, P. & WILLIAMS, A. 1995. A social tariff for EuroQol: results from a UK general
population survey, Centre for Health Economics University of York, UK. DOUGHERTY, D. & CONWAY, P. H. 2008. The “3T’s” road map to transform US health care: the “how” of
high-quality care. Jama, 299, 2319-2321. DROLET, B. C. & LORENZI, N. M. 2011. Translational research: understanding the continuum from bench
to bedside. Translational Research, 157, 1-5. DUIJN, P. A., KASHIRIN, V. & SLOOT, P. M. 2014. The relative ineffectiveness of criminal network
disruption. Scientific reports, 4. EICHLER, H. G., KONG, S. X., GERTH, W. C., MAVROS, P. & JÖNSSON, B. 2004. Use of Cost‐Effectiveness
Analysis in Health‐Care Resource Allocation Decision‐Making: How Are Cost‐Effectiveness Thresholds Expected to Emerge? Value in health, 7, 518-528.
EINSPRUCH, E. M. 1996. Quality function deployment (QFD): application to rehabilitation services. International Journal of Health Care Quality Assurance, 9, 41-46.
ERICSSON, K. A., WHYTE IV, J. & WARD, P. 2007. Expert performance in nursing: Reviewing research on expertise in nursing within the framework of the expert-performance approach. Advances in Nursing Science, 30, E58-E71.
ERMER, D. S. & KNIPER, M. K. 1998. Delighting the customer: Quality function deployment for quality service design. Total Quality Management, 9, 86-91.
ESTRADA, E. & RODRIGUEZ-VELAZQUEZ, J. A. 2005. Subgraph centrality in complex networks. Physical Review E, 71, 056103.
FALK‐KRZESINSKI, H. J., BÖRNER, K., CONTRACTOR, N., FIORE, S. M., HALL, K. L., KEYTON, J., SPRING, B., STOKOLS, D., TROCHIM, W. & UZZI, B. 2010. Advancing the science of team science. Clinical and translational science, 3, 263-266.
Page 166
149
FEARNLEY, J. M. & LEES, A. J. 1991. Ageing and Parkinson's disease: substantia nigra regional selectivity. Brain, 114, 2283-2301.
FELDSTEIN, A. C. & GLASGOW, R. E. 2008. A practical, robust implementation and sustainability model (PRISM). Joint Commission Journal on Quality and Patient Safety, 34, 228-243.
FERNANDEZ, L. E., GABRI, M. R., GUTHMANN, M. D., GOMEZ, R. E., GOLD, S., FAINBOIM, L., GOMEZ, D. E. & ALONSO, D. F. 2010. NGcGM3 ganglioside: a privileged target for cancer vaccines. Clinical and Developmental Immunology, 2010.
FIELDING, J. E. & TEUTSCH, S. M. 2013. So what? A framework for assessing the potential impact of intervention research. Preventing chronic disease, 10.
FISHER, R. A. 1935. The design of experiments, Edinburgh, UK, Oliver and Boyd. FISHER, R. A. 1992. The arrangement of field experiments. Breakthroughs in Statistics. Springer. FORSAA, E., LARSEN, J., WENTZEL-LARSEN, T. & ALVES, G. 2010. What predicts mortality in Parkinson
disease? A prospective population-based long-term study. Neurology, 75, 1270-1276. FREEMAN, L. C. 1979. Centrality in social networks conceptual clarification. Social networks, 1, 215-239. GAENSLEN, A. & BERG, D. 2010. Early diagnosis of Parkinson’s disease. International review of
neurobiology, 90, 81-92. GANDEK, B., WARE, J. E., AARONSON, N. K., APOLONE, G., BJORNER, J. B., BRAZIER, J. E., BULLINGER, M.,
KAASA, S., LEPLEGE, A. & PRIETO, L. 1998. Cross-validation of item selection and scoring for the SF-12 Health Survey in nine countries: results from the IQOLA Project. Journal of clinical epidemiology, 51, 1171-1178.
GARDY, J. L., JOHNSTON, J. C., SUI, S. J. H., COOK, V. J., SHAH, L., BRODKIN, E., REMPEL, S., MOORE, R., ZHAO, Y., HOLT, R. & OTHERS 2011. Whole-genome sequencing and social-network analysis of a tuberculosis outbreak. New England Journal of Medicine, 364, 730-739.
GARRISON JR, L. P. 2009. Editorial: on the benefits of modeling using QALYs for societal resource allocation: the model is the message. Value in Health, 12, S36-S37.
GAUJOUX-VIALA, C., RAT, A.-C., GUILLEMIN, F., FLIPO, R.-M., FARDELLONE, P., BOURGEOIS, P. & FAUTREL, B. 2011. Comparison of the EQ-5D and the SF-6D utility measures in 813 patients with early arthritis: results from the ESPOIR cohort. The Journal of rheumatology, 38, 1576-1584.
GELB, D. J., OLIVER, E. & GILMAN, S. 1999. Diagnostic criteria for Parkinson disease. Archives of neurology, 56, 33-39.
GEWIN, V. 2010. Collaboration: Social networking seeks critical mass. Nature, 468, 993-994. GLASGOW, R. E., BROWNSON, R. C. & KESSLER, R. S. 2013. Thinking about Health-Related Outcomes: What
Do We Need Evidence about? Clinical and translational science, 6, 286-291. GLASGOW, R. E., VINSON, C., CHAMBERS, D., KHOURY, M. J., KAPLAN, R. M. & HUNTER, C. 2012. National
Institutes of Health approaches to dissemination and implementation science: current and future directions. American Journal of Public Health, 102, 1274-1281.
GOFFIN, K., VARNES, C. J., VAN DER HOVEN, C. & KONERS, U. 2012. Beyond the voice of the customer: Ethnographic market research. Research-Technology Management, 55, 45-54.
GOLD, M. R. 1996. Cost-Effectiveness in Health and Medicine, Oxford University Press. GOLDRATT, E. M. 1990. Theory of constraints, North River Croton-on-Hudson, NY. GOVERS, C. P. 1996. What and how about quality function deployment (QFD). International journal of
production economics, 46, 575-585. GRALNEK, I. M., HAYS, R. D., KILBOURNE, A., NALIBOFF, B. & MAYER, E. A. 2000. The impact of irritable
bowel syndrome on health-related quality of life. Gastroenterology, 119, 654-660. GREEN, L. W., OTTOSON, J., GARCÍA, C. & ROBERT, H. 2009. Diffusion theory and knowledge dissemination,
utilization, and integration in public health. Annual review of public health, 30, 151. GREENER, M. 2009. Does Parkinson's disease increase mortality? Progress in Neurology and Psychiatry,
13, 6-8.
Page 167
150
GREMYR, I. & RAHARJO, H. 2013. Quality function deployment in healthcare: a literature review and case study. International journal of health care quality assurance, 26, 135-146.
GRIEVE, R., GRISHCHENKO, M. & CAIRNS, J. 2009. SF-6D versus EQ-5D: reasons for differences in utility scores and impact on reported cost-utility. The European Journal of Health Economics, 10, 15-23.
GRIMSHAW, J., THOMAS, R., MACLENNAN, G., FRASER, C., RAMSAY, C., VALE, L., WHITTY, P., ECCLES, M., MATOWE, L., SHIRRAN, L. & OTHERS 2004. Effectiveness and efficiency of guideline dissemination and implementation strategies.
GRIMSHAW, J. M., ECCLES, M. P., LAVIS, J. N., HILL, S. J., SQUIRES, J. E. & OTHERS 2012a. Knowledge translation of research findings. Implement Sci, 7, 50.
GRIMSHAW, J. M., SCHÜNEMANN, H. J., BURGERS, J., CRUZ, A. A., HEFFNER, J., METERSKY, M. & COOK, D. Disseminating and Implementing Guidelines. Proceedings of the American Thoracic Society, Vol. 9, No. 5, 2012b. 298-303.
GRIMSHAW, J. M., SHIRRAN, L., THOMAS, R., MOWATT, G., FRASER, C., BERO, L., GRILLI, R., HARVEY, E., OXMAN, A. & O'BRIEN, M. A. 2001. Changing provider behavior: an overview of systematic reviews of interventions. Medical care, II2--II45.
GROL, R. & GRIMSHAW, J. 2003. From best evidence to best practice: effective implementation of change in patients' care. The lancet, 362, 1225-1230.
GROSSMAN, J. H. 2008. Disruptive innovation in health care: Challenges for engineering. BRIDGE-WASHINGTON-NATIONAL ACADEMY OF ENGINEERING-, 38, 10.
GUINDO, L. A., WAGNER, M., BALTUSSEN, R., RINDRESS, D., VAN TIL, J., KIND, P. & GOETGHEBEUR, M. M. 2012. From efficacy to equity: Literature review of decision criteria for resource allocation and healthcare decisionmaking. Cost Eff Resour Alloc, 10.
GÜNDÜZ-ÖĞÜDÜCÜ, Ş. & ETANER-UYAR, A. Ş. 2014. Social Networks: Analysis and Case Studies, Springer. HAHN, B. A., YAN, S. & STRASSELS, S. 1999. Impact of irritable bowel syndrome on quality of life and
resource use in the United States and United Kingdom. Digestion, 60, 77-81. HALL, K. L., FENG, A. X., MOSER, R. P., STOKOLS, D. & TAYLOR, B. K. 2008. Moving the science of team
science forward: collaboration and creativity. American journal of preventive medicine, 35, S243--S249.
HANCOCK, P. & RAESIDE, R. 2010. Analysing communication in a complex service process: an application of social network analysis in the Scottish Prison Service. Journal of the Operational Research Society, 61, 265-274.
HANS, E. W., VAN HOUDENHOVEN, M. & HULSHOF, P. J. 2012. A framework for healthcare planning and control. Handbook of healthcare system scheduling. Springer.
HANSEN, D., SHNEIDERMAN, B. & SMITH, M. A. 2010. Analyzing social media networks with NodeXL: Insights from a connected world, Morgan Kaufmann.
HAREL, D. & KOREN, Y. A fast multi-scale method for drawing large graphs. Graph drawing, 2001. Springer, 183-196.
HATALA, J.-P. 2006. Social network analysis in human resource development: A new methodology. Human Resource Development Review, 5, 45-71.
HATOUM, H. T., BRAZIER, J. E. & AKHRAS, K. S. 2004. Comparison of the HUI3 with the SF‐36 Preference Based SF‐6D in a Clinical Trial Setting. Value in Health, 7, 602-609.
HAUSER, J. R. & CLAUSING, D. 1988. The house of quality. Harvard Business Review, 66, 63-73. HO, W. 2008. Integrated analytic hierarchy process and its applications–A literature review. European
Journal of operational research, 186, 211-228. HOEHN, M. M. & YAHR, M. D. 1998. Parkinsonism: onset, progression, and mortality. Neurology, 50, 318-
318. HSIUNG, P.-C., FANG, C.-T., CHANG, Y.-Y., CHEN, M.-Y. & WANG, J.-D. 2005. Comparison of WHOQOL-BREF
and SF-36 in patients with HIV infection. Quality of Life Research, 14, 141-150.
Page 168
151
HSU, T.-H. & PAN, F. F. 2009. Application of Monte Carlo AHP in ranking dental quality attributes. Expert Systems with Applications, 36, 2310-2316.
HUANG, G. Q. 1996. Design for X: concurrent engineering imperatives, Springer Science & Business Media. HUNG, C.-I., LIU, C.-Y. & WANG, S.-J. 2013. Migraine predicts physical and pain symptoms among
psychiatric outpatients. The journal of headache and pain, 14, 1-8. HUNT, J. D., WHIPPLE, E. C. & MCGOWAN, J. J. 2012. Use of social network analysis tools to validate a
resources infrastructure for interinstitutional translational research: a case study. Journal of the Medical Library Association: JMLA, 100, 48.
HURST, N., KIND, P., RUTA, D., HUNTER, M. & STUBBINGS, A. 1997. Measuring health-related quality of life in rheumatoid arthritis: validity, responsiveness and reliability of EuroQol (EQ-5D). Rheumatology, 36, 551-559.
HUSE, D. M., SCHULMAN, K., ORSINI, L., CASTELLI‐HALEY, J., KENNEDY, S. & LENHART, G. 2005. Burden of illness in Parkinson's disease. Movement disorders, 20, 1449-1454.
IGNIZIO, J. P. 1976. Goal programming and extensions, Lexington Books Lexington, MA. IJIRI, Y. 1965. Management goals and accounting for control, North Holland Pub. Co. IOM 2001. Crossing the quality chasm: A new health system for the 21st century, Institute of Medicine,
National Academies Press. ISHIHARA, L. S., CHEESBROUGH, A., BRAYNE, C. & SCHRAG, A. 2007. Estimated life expectancy of
Parkinson’s patients compared with the UK population. Journal of Neurology, Neurosurgery & Psychiatry, 78, 1304-1309.
JACQUES, M., BACCARANI, C., ANDRONIKIDIS, A., GEORGIOU, A. C., GOTZAMANI, K. & KAMVYSI, K. 2009. The application of quality function deployment in service quality management. The TQM journal, 21, 319-333.
JAMISON, D. T., BREMAN, J. G., MEASHAM, A. R., ALLEYNE, G., CLAESON, M., EVANS, D. B., JHA, P., MILLS, A. & MUSGROVE, P. 2006. Disease control priorities in developing countries, World Bank Publications.
JAMTVEDT, G., YOUNG, J., KRISTOFFERSEN, D., O'BRIEN, M. & OXMAN, A. 2006. Audit and feedback: effects on professional practice and health care outcomes. Cochrane Database Syst Rev, 2.
JEONG, M. & OH, H. 1998. Quality function deployment: An extended framework for service quality and customer satisfaction in the hospitality industry. International Journal of Hospitality Management, 17, 375-390.
JOLLIFFE, I. 2002. Principal component analysis, Wiley Online Library. JONES, D. & TAMIZ, M. 2010. Practical goal programming, Springer. KAPLAN, R. M., ANDERSON, J. P. & GANIATS, T. G. 1993. The quality of well-being scale: rationale for a
single quality of life index. Quality of life assessment: key issues in the 1990s. Springer. KAPLAN, R. M., BUSH, J. W. & BERRY, C. C. 1976. Health status: types of validity and the index of well-
being. Health services research, 11, 478. KAPLAN, S. & GARRICK, B. J. 1981. On the quantitative definition of risk. Risk analysis, 1, 11-27. KARSAK, E. E., SOZER, S. & ALPTEKIN, S. E. 2003. Product planning in quality function deployment using a
combined analytic network process and goal programming approach. Computers & industrial engineering, 44, 171-190.
KAYE, A. D., OKANLAWON, O. J. & URMAN, R. D. 2014. Clinical performance feedback and quality improvement opportunities for perioperative physicians. Advances in medical education and practice, 5, 115.
KHAN, G. F., YOON, H. Y. & PARK, H. W. 2014. Social media communication strategies of government agencies: Twitter use in Korea and the USA. Asian Journal of Communication, 24, 60-78.
KHOURY, M. J., GWINN, M., YOON, P. W., DOWLING, N., MOORE, C. A. & BRADLEY, L. 2007. The continuum of translation research in genomic medicine: how can we accelerate the appropriate integration
Page 169
152
of human genome discoveries into health care and disease prevention? Genetics in Medicine, 9, 665-674.
KIRKWOOD, C. W. 1997. Strategic decision making. Multi-objective Decision Analysis with Spreadsheets, Wadsworth.
KNOBEN, J. & OERLEMANS, L. A. 2006. Proximity and inter-organizational collaboration: A literature review. International Journal of Management Reviews, 8, 71-89.
KON, A. A. 2008. The Clinical and Translational Science Award (CTSA) Consortium and the translational research model. The American Journal of Bioethics, 8, 58-60.
KONTODIMOPOULOS, N., PAPPA, E., CHADJIAPOSTOLOU, Z., ARVANITAKI, E., PAPADOPOULOS, A. A. & NIAKAS, D. 2012. Comparing the sensitivity of EQ-5D, SF-6D and 15D utilities to the specific effect of diabetic complications. The European Journal of Health Economics, 13, 111-120.
KUEHL, R. O. & KUEHL, R. 2000. Design of experiments: statistical principles of research design and analysis, Duxbury/Thomson Learning Pacific Grove, CA:.
KWAK, N. & LEE, C. 1997. A linear goal programming model for human resource allocation in a health-care organization. Journal of Medical Systems, 21, 129-140.
KWAK, N. & LEE, C. W. 2002. Business process reengineering for health-care system using multicriteria mathematical programming. European Journal of Operational Research, 140, 447-458.
KWONG, C. & BAI, H. 2002. A fuzzy AHP approach to the determination of importance weights of customer requirements in quality function deployment. Journal of intelligent manufacturing, 13, 367-377.
KWONG, C. & BAI, H. 2003. Determining the importance weights for the customer requirements in QFD using a fuzzy AHP with an extent analysis approach. Iie Transactions, 35, 619-626.
LACSON, E., XU, J., LIN, S.-F., DEAN, S. G., LAZARUS, J. M. & HAKIM, R. M. 2010. A comparison of SF-36 and SF-12 composite scores and subsequent hospitalization and mortality risks in long-term dialysis patients. Clinical Journal of the American Society of Nephrology, 5, 252-260.
LAI, H. F. Applying fuzzy AHP to evaluate the sustainability of knowledge-based virtual communities in healthcare industry. Service Systems and Service Management (ICSSSM), 2010 7th International Conference on, 2010. IEEE, 1-6.
LAMERS, L., BOUWMANS, C., VAN STRATEN, A., DONKER, M. & HAKKAART, L. 2006. Comparison of EQ‐5D and SF‐6D utilities in mental health patients. Health economics, 15, 1229-1236.
LAMONT, M. 2009. How Professors Think: Inside the Curious World of Academic Judgment, Harvard University Press.
LANDRO, L. 2014. Specialized Care Urged for Treating Parkinson's Disease [Online]. http://www.wsj.com/articles/SB10001424052702304479704579580020917565860: The Wall Street Journal. [Accessed January 27, 2015 2015].
LANG, J. M., ANDREI, A.-C. & MCNEEL, D. G. 2009. Prioritization of cancer antigens: keeping the target in sight.
LEE, C. & KWAK, N. 1999. Information resource planning for a health-care system using an AHP-based goal programming method. Journal of the operational research society, 50, 1191-1198.
LEE, C., KWAK, N. & OTHERS 1999. Information resource planning for a health-care system using an AHP-based goal programming method. Journal of the operational research society, 50, 1191-1198.
LEE, S. M. 1972. Goal programming for decision analysis, Auerbach Philadelphia. LEHTO, M. R. & LANDRY, S. J. 2012. Introduction to human factors and ergonomics for engineers, Crc Press. LEIFELD, P. 2013. Reconceptualizing major policy change in the advocacy coalition framework: A discourse
network analysis of German Pension politics. Policy Studies Journal, 41, 169-198. LI, E. Y., LIAO, C. H. & YEN, H. R. 2013. Co-authorship networks and research impact: A social capital
perspective. Research Policy, 42, 1515-1530. LIAO, P.-C., LEI, G., FANG, D. & LIU, W. 2014. The relationship between communication and construction
safety climate in China. KSCE Journal of Civil Engineering, 18, 887-897.
Page 170
153
LIBERATORE, M. J. & NYDICK, R. L. 2008. The analytic hierarchy process in medical and health care decision making: A literature review. European Journal of Operational Research, 189, 194-207.
LIBERATORE, M. J. & STYLIANOU, A. C. 1995. Expert support systems for new product development decision making: a modeling framework and applications. Management science, 41, 1296-1316.
LONG, J. C., CUNNINGHAM, F. C. & BRAITHWAITE, J. 2012. Network structure and the role of key players in a translational cancer research network: a study protocol. BMJ open, 2.
LONG, J. C., CUNNINGHAM, F. C., CARSWELL, P. & BRAITHWAITE, J. 2014. Patterns of collaboration in complex networks: the example of a translational research network. BMC Health Services Research, 14, 225.
LONGWORTH, L. & BRYAN, S. 2003. An empirical comparison of EQ‐5D and SF‐6D in liver transplant patients. Health economics, 12, 1061-1067.
LOUIS, E. D., MARDER, K., COTE, L., TANG, M. & MAYEUX, R. 1997. Mortality from Parkinson disease. Archives of neurology, 54, 260-264.
LOWE, P. & PHILLIPSON, J. 2006. Reflexive interdisciplinary research: the making of a research programme on the rural economy and land use. Journal of Agricultural Economics, 57, 165-184.
LU, Y., POLGAR, M., LUO, X. & CAO, Y. 2010. Social network analysis of a criminal hacker community. Journal of Computer Information Systems, 51, 31-41.
LUBOWITZ, J. H. & APPLEBY, D. 2011. Cost-effectiveness analysis of the most common orthopaedic surgery procedures: knee arthroscopy and knee anterior cruciate ligament reconstruction. Arthroscopy: The Journal of Arthroscopic & Related Surgery, 27, 1317-1322.
LUNDBERG, L., JOHANNESSON, M., ISACSON, D. G. & BORGQUIST, L. 1999. The relationship between health-state utilities and the SF-12 in a general population. Medical Decision Making, 19, 128-140.
LUO, Q. & ZHONG, D. 2015. Using social network analysis to explain communication characteristics of travel-related electronic word-of-mouth on social networking sites. Tourism Management, 46, 274-282.
LURIE, S., FOGG, T. & DOZIER, A. 2009. Social network analysis as a method of assessing medical-center culture; three case studies. Academic medicine: journal of the Association of American Medical Colleges, 84, 1029.
MA, F., LI, Y. & CHEN, B. 2014. Study of the collaboration in the field of the Chinese humanities and social sciences. Scientometrics, 100, 439-458.
MALM, A. & BICHLER, G. 2011. Networks of collaborating criminals: Assessing the structural vulnerability of drug markets. Journal of Research in Crime and Delinquency, 48, 271-297.
MARINCOLA, F. M. 2003. Translational medicine: a two-way road. J Transl Med, 1, 1. MARRA, C. A., WOOLCOTT, J. C., KOPEC, J. A., SHOJANIA, K., OFFER, R., BRAZIER, J. E., ESDAILE, J. M. &
ANIS, A. H. 2005. A comparison of generic, indirect utility measures (the HUI2, HUI3, SF-6D, and the EQ-5D) and disease-specific instruments (the RAQoL and the HAQ) in rheumatoid arthritis. Social science & medicine, 60, 1571-1582.
MASUD, A. S. & RAVINDRAN, A. 2008. Multiple criteria decision making. In: RAVINDRAN, A. (ed.) Operations Research and Management Science Handbook. Taylor & Francis Group, LLC.
MATTI, S. & SANDSTRÖM, A. 2013. The defining elements of advocacy coalitions: Continuing the search for explanations for coordination and coalition structures. Review of Policy Research, 30, 240-257.
MCCABE, C., CLAXTON, K. & CULYER, A. J. 2008. The NICE cost-effectiveness threshold. Pharmacoeconomics, 26, 733-744.
MCDONOUGH, J., SOLOMON, R. & PETOSA, L. 2004. Quality improvement and proactive hazard analysis models: deciphering a new Tower of Babel. Aspden P, Corrigan JM, Wolcott J et al, 471-508.
MCENRUE, M. P. 1988. Length of experience and the performance of managers in the establishment phase of their careers. Academy of Management Journal, 31, 175-185.
Page 171
154
MCGLYNN, E. A., ASCH, S. M., ADAMS, J., KEESEY, J., HICKS, J., DECRISTOFARO, A. & KERR, E. A. 2003. The quality of health care delivered to adults in the United States. New England journal of medicine, 348, 2635-2645.
MCHUGH, M. D. & LAKE, E. T. 2010. Understanding clinical expertise: nurse education, experience, and the hospital context. Research in nursing & health, 33, 276-287.
MCHUGH, R. K. & BARLOW, D. H. 2010. The dissemination and implementation of evidence-based psychological treatments: a review of current efforts. American Psychologist, 65, 73.
MILLER, G. A. 1956. The magical number seven, plus or minus two: some limits on our capacity for processing information. Psychological review, 63, 81.
MONZON, M. & LAINEZ, M. 1998. Quality of life in migraine and chronic daily headache patients. Cephalalgia, 18, 638-643.
MOOCK, J. & KOHLMANN, T. 2008. Comparing preference-based quality-of-life measures: results from rehabilitation patients with musculoskeletal, cardiovascular, or psychosomatic disorders. Quality of Life Research, 17, 485-495.
MOORES, B. 2006. Radiation safety management in health care–The application of Quality Function Deployment. Radiography, 12, 291-304.
MOSCONI, P., APOLONE, G., BARNI, S., SECONDINO, S., SBANOTTO, A. & FILIBERTI, A. 2001. Quality of life in breast and colon cancer long-term survivors: an assessment with the EORTC QLQ-C30 and SF-36 questionnaires. Tumori, 88, 110-116.
MOSES, H., DORSEY, E. R., MATHESON, D. H. & THIER, S. O. 2005. Financial anatomy of biomedical research. Jama, 294, 1333-1342.
MOVEMENT DISORDER SOCIETY TASK FORCE ON RATING SCALES FOR PARKINSON'S DISEASE 2003. The Unified Parkinson's Disease Rating Scale (UPDRS): status and recommendations. Movement disorders: official journal of the Movement Disorder Society, 18, 738.
MOZ, M. & PATO, M. A bi-objective network flow approach for nurse rerostering. Proceedings of the INOC, 2005. 817-824.
MUSA, A. & SAXENA, U. 1984. Scheduling nurses using goal-programming techniques. IIE transactions, 16, 216-221.
MUSLIMOVIĆ, D., POST, B., SPEELMAN, J. & SCHMAND, B. 2007. Motor procedural learning in Parkinson's disease. Brain, 130, 2887-2897.
MUTEBI, A., BRAZIER, J. E. & WALTERS, S. J. 2011. A comparison of the discriminative and evaluative properties of the SF-36 and the SF-6D index. Quality of Life Research, 20, 1477-1486.
NASH, R., BOUCHARD, M. & MALM, A. 2013. Investing in people: The role of social networks in the diffusion of a large-scale fraud. Social Networks, 35, 686-698.
NATHAN, D. G. 2002. Careers in translational clinical research—historical perspectives, future challenges. JAMA: the journal of the American Medical Association, 287, 2424-2427.
NATIONAL PARKINSON FOUNDATION. 2014. Do You Have Early Warning Signs of Parkinson’s Disease? [Online]. http://www.parkinson.org/About-Us/Press-Room/NPF-In-The-News/2014/June/Do-You-Have-Early-Warning-Signs-of-Parkinsons-Dis. [Accessed January 27, 2015 2015].
NEUMANN, P. J., ROSEN, A. B. & WEINSTEIN, M. C. 2005. Medicare and cost-effectiveness analysis. New England Journal of Medicine, 353, 1516.
NIH, N. I. O. H. 2007. Building the Science of Dissemination and Implementation in the Service of Public Health. Available: http://www.obssr.od.nih.gov/di2007/about.html.
NORD, E., DANIELS, N. & KAMLET, M. 2009. QALYs: some challenges. Value in Health, 12, S10-S15. OCKENE, J. K., EDGERTON, E. A., TEUTSCH, S. M., MARION, L. N., MILLER, T., GENEVRO, J. L., LOVELAND-
CHERRY, C. J., FIELDING, J. E. & BRISS, P. A. 2007. Integrating evidence-based clinical and community strategies to improve health. American journal of preventive medicine, 32, 244-252.
Page 172
155
ODDOYE, J. P., JONES, D. F., TAMIZ, M. & SCHMIDT, P. 2009. Combining simulation and goal programming for healthcare planning in a medical assessment unit. European Journal of Operational Research, 193, 250-261.
OSBORN, A. F. 1963. Applied Imagination; Principles and Procedures of Creative Problem-solving: Principles and Procedures of Creative Problem-solving, Scribner.
OSTERHAUS, J. T., TOWNSEND, R. J., GANDEK, B. & WARE, J. E. 1994. Measuring the functional status and well‐being of patients with migraine headache. Headache: The Journal of Head and Face Pain, 34, 337-343.
OWENS, D. K., QASEEM, A., CHOU, R. & SHEKELLE, P. 2011. High-value, cost-conscious health care: concepts for clinicians to evaluate the benefits, harms, and costs of medical interventions. Annals of internal medicine, 154, 174-180.
OZKARAHAN, I. 1991. A disaggregation model of a flexible nurse scheduling support system. Socio-economic planning sciences, 25, 9-26.
OZKARAHAN, I. 2000. Allocation of surgeries to operating rooms by goal programing. Journal of Medical Systems, 24, 339-378.
OZKARAHAN, I. & BAILEY, J. E. 1988. Goal programming model subsystem of a flexible nurse scheduling support system. IIE transactions, 20, 306-316.
PARKINSON'S DISEASE FOUNDATION. 2015. Statistics on Parkinson's [Online]. http://www.pdf.org/en/parkinson_statistics. [Accessed January 27, 2015 2015].
PATRICK, D. L. & ERICKSON, P. 1993. Health status and health policy. Quality of life in health care evaluation and resource.
PECCHIA, L., BATH, P., PENDLETON, N. & BRACALE, M. 2011. Analytic hierarchy process (AHP) for examining healthcare professionals’ assessments of risk factors. Methods Inf Med, 50, 435-444.
PETROU, S. & HOCKLEY, C. 2005. An investigation into the empirical validity of the EQ‐5D and SF‐6D based on hypothetical preferences in a general population. Health economics, 14, 1169-1189.
PLISKIN, J. S., SHEPARD, D. S. & WEINSTEIN, M. C. 1980. Utility functions for life years and health status. Operations research, 28, 206-224.
PRASAD, B. 1996. Concurrent engineering fundamentals, Prentice Hall Englewood Cliffs, NJ. PRIETO, L. & SACRISTÁN, J. A. 2003. Problems and solutions in calculating quality-adjusted life years
(QALYs). Health and quality of life outcomes, 1, 1-8. RABIN, R. & DE CHARRO, F. 2001. EQ-SD: a measure of health status from the EuroQol Group. Annals of
medicine, 33, 337-343. RADHARAMANAN, R. & GODOY, L. P. 1996. Quality function deployment as applied to a health care
system. Computers & industrial engineering, 31, 443-446. RAVINDRAN, A. R. 2007. Operations research and management science handbook, Crc Press. REID, P. P., COMPTON, W. D., GROSSMAN, J. H. & FANJIANG, G. 2005. Building a Better Delivery System:
A New Engineering/Health Care Partnership, National Academies Press. RICHARDSON, G. & MANCA, A. 2004. Calculation of quality adjusted life years in the published literature:
a review of methodology and transparency. Health economics, 13, 1203-1210. RILEY, E., BANGSBERG, D., PERRY, S., CLARK, R., MOSS, A. & WU, A. 2003. Reliability and validity of the SF-
36 in HIV-infected homeless and marginally housed individuals. Quality of Life Research, 12, 1051-1058.
RUBINSTEIN, R. Y. & KROESE, D. P. 2011. Simulation and the Monte Carlo method, John Wiley & Sons. RUBIO, D. M., SCHOENBAUM, E. E., LEE, L. S., SCHTEINGART, D. E., MARANTZ, P. R., ANDERSON, K. E.,
PLATT, L. D., BAEZ, A. & ESPOSITO, K. 2010. Defining translational research: implications for training. Academic medicine: journal of the Association of American Medical Colleges, 85, 470.
Page 173
156
RYYNÄNEN, O.-P., MYLLYKANGAS, M., KINNUNEN, J. & TAKALA, J. 1999. Attitudes to health care prioritisation methods and criteria among nurses, doctors, politicians and the general public. Social science \& medicine, 49, 1529-1539.
SAATY, T. L. 1977. A scaling method for priorities in hierarchical structures. Journal of mathematical psychology, 15, 234-281.
SAATY, T. L. 1980. The analytical hierarchical process. J Wiley, New York. SAATY, T. L. 2001. Deriving the AHP 1-9 scale from first principles. ISAHP 2001 proceedings, Bern,
Switzerland. SAATY, T. L. & OZDEMIR, M. S. 2003. Why the magic number seven plus or minus two. Mathematical and
Computer Modelling, 38, 233-244. SACH, T., BARTON, G., DOHERTY, M., MUIR, K., JENKINSON, C. & AVERY, A. 2006. The relationship between
body mass index and health-related quality of life: comparing the EQ-5D, EuroQol VAS and SF-6D. International Journal of Obesity, 31, 189-196.
SACKETT, D. L., ROSENBERG, W. M., GRAY, J., HAYNES, R. B. & RICHARDSON, W. S. 1996. Evidence based medicine: what it is and what it isn't. BMJ: British Medical Journal, 312, 71.
SANDERS, M. S. & MCCORMICK, E. J. 1987. Human factors in engineering and design, McGRAW-HILL book company.
SANDSTRÖM, U. & HÄLLSTEN, M. 2008. Persistent nepotism in peer-review. Scientometrics, 74, 175-189. SASSI, F. 2006. Calculating QALYs, comparing QALY and DALY calculations. Health Policy and Planning, 21,
402-408. SCHMITTDIEL, J. A., GRUMBACH, K. & SELBY, J. V. 2010. System-based participatory research in health
care: an approach for sustainable translational research and quality improvement. The Annals of Family Medicine, 8, 256-259.
SCHRAG, A., BEN-SHLOMO, Y. & QUINN, N. 2002. How valid is the clinical diagnosis of Parkinson's disease in the community? Journal of Neurology, Neurosurgery & Psychiatry, 73, 529-534.
SCHRAG, A., SELAI, C., JAHANSHAHI, M. & QUINN, N. P. 2000. The EQ-5D—a generic quality of life measure—is a useful instrument to measure quality of life in patients with Parkinson's disease. Journal of Neurology, Neurosurgery & Psychiatry, 69, 67-73.
SCHWAPPACH, D. L. 2002. Resource allocation, social values and the QALY: a review of the debate and empirical evidence. Health Expectations, 5, 210-222.
SCHWEIKHART, S. A. & DEMBE, A. E. 2009. The applicability of Lean and Six Sigma techniques to clinical and translational research. Journal of investigative medicine: the official publication of the American Federation for Clinical Research, 57, 748.
SCOTT, J. 2012. Social network analysis, Sage. SCOTT, J. & CARRINGTON, P. J. 2011. The SAGE handbook of social network analysis, SAGE publications. SEIBER, W. J., GROESSL, E. J., DAVID, K. M., GANIATS, T. G. & KAPLAN, R. M. 2008. Quality of well being
self-administered (QWB-SA) scale. San Diego: Health Services Research Center, University of California.
SELKER, H., GROSSMAN, C., ADAMS, A., GOLDMANN, D., DEZII, C., MEYER, G., ROGER, V., SAVITZ, L. & PLATT, R. 2011. The common rule and continuous improvement in health care: A learning health system perspective. Institute of Medicine Discussion Paper, October, 1.
SHAHRIAR, J., DELATE, T., HAYS, R. D. & COONS, S. J. 2003. Commentary on using the SF-36 or MOS-HIV in studies of persons with HIV disease. Health Qual Life Outcomes, 1, 25.
SHAW, J. W., JOHNSON, J. A. & COONS, S. J. 2005. US valuation of the EQ-5D health states: development and testing of the D1 valuation model. Medical care, 43, 203-220.
SHIROIWA, T., SUNG, Y.-K., FUKUDA, T., LANG, H.-C., BAE, S.-C. & TSUTANI, K. 2010. International survey on willingness-to-pay (WTP) for one additional QALY gained: what is the threshold of cost effectiveness? Health economics, 19, 422-437.
Page 174
157
SHOJANIA, K. G., MCDONALD, K. M., WACHTER, R. & OWENS, D. K. 2004. Closing the quality gap: a critical analysis of quality improvement strategies, Agency for Healthcare Research and Quality Rockville, MD:.
SOLOMON, G. D., SKOBIERANDA, F. G. & GENZEN, J. R. 1995. Quality of life assessment among migraine patients treated with sumatriptan. Headache: The Journal of Head and Face Pain, 35, 449-454.
SPARROW, M. K. 1991. The application of network analysis to criminal intelligence: An assessment of the prospects. Social networks, 13, 251-274.
STAMATIS, D. H. 2003. Failure mode and effect analysis: FMEA from theory to execution, ASQ Quality Press.
STAVEM, K., FRØLAND, S. S. & HELLUM, K. B. 2005. Comparison of preference-based utilities of the 15D, EQ-5D and SF-6D in patients with HIV/AIDS. Quality of Life Research, 14, 971-980.
SUNG, N. S., CROWLEY JR, W. F., GENEL, M., SALBER, P., SANDY, L., SHERWOOD, L. M., JOHNSON, S. B., CATANESE, V., TILSON, H. & GETZ, K. 2003. Central challenges facing the national clinical research enterprise. Jama, 289, 1278-1287.
SZENDE, A., OPPE, M. & DEVLIN, N. J. 2007. EQ-5D value sets: inventory, comparative review and user guide.
TAN, P.-N., STEINBACH, M. & KUMAR, V. 2006. Introduction to data mining, Pearson Addison Wesley Boston.
TIAN, Q., MA, J., LIANG, J., KWOK, R. C. & LIU, O. 2005. An organizational decision support system for effective R&D project selection. Decision Support Systems, 39, 403-413.
TICHY, N. M., TUSHMAN, M. L. & FOMBRUN, C. 1979. Social network analysis for organizations. Academy of management review, 4, 507-519.
TING, H. H., SHOJANIA, K. G., MONTORI, V. M. & BRADLEY, E. H. 2009. Quality improvement science and action. Circulation, 119, 1962-1974.
TING, S. & TSANG, A. H. 2014. Using social network analysis to combat counterfeiting. International Journal of Production Research, 52, 4456-4468.
TINGLEY, K. M. & LIEBMAN, J. S. 1984. A goal programming example in public health resource allocation. Management Science, 30, 279-289.
TODD, M. K. 2012. Physician Integration & Alignment: IPA, PHO, ACOs, and Beyond, CRC Press. TOMASZEWSKI, K. J. & HOLLOWAY, R. G. 2001. Deep brain stimulation in the treatment of Parkinson’s
disease a cost-effectiveness analysis. Neurology, 57, 663-671. TORRANCE, G. W., SIEGEL, J., LUCE, B., GOLD, M., RUSSELL, L. & WEINSTEIN, M. 1996. Framing and
designing the cost-effectiveness analysis. Cost-effectiveness in Health and Medicine, 54-81. TRAPPEY, C. V., TRAPPEY, A. J. & HWANG, S.-J. 1996. A computerized quality function deployment
approach for retail services. Computers & Industrial Engineering, 30, 611-622. TROCHIM, W., KANE, C., GRAHAM, M. J. & PINCUS, H. A. 2011. Evaluating translational research: a process
marker model. Clinical and translational science, 4, 153-162. TSAI, W. & GHOSHAL, S. 1998. Social capital and value creation: The role of intrafirm networks. Academy
of management Journal, 41, 464-476. TSUCHIYA, A., BRAZIER, J. & ROBERTS, J. 2006. Comparison of valuation methods used to generate the
EQ-5D and the SF-6D value sets. Journal of health economics, 25, 334-346. UDDIN, S., HOSSAIN, L., HAMRA, J. & ALAM, A. 2013. A study of physician collaborations through social
network and exponential random graph. BMC health services research, 13, 234. VAIDYA, O. S. & KUMAR, S. 2006. Analytic hierarchy process: An overview of applications. European
Journal of operational research, 169, 1-29. VAN ARENSBERGEN, P. & VAN DEN BESSELAAR, P. 2012. The selection of scientific talent in the allocation
of research grants. Higher Education Policy, 25, 381-405.
Page 175
158
VAN STEL, H. F. & BUSKENS, E. 2006. Comparison of the SF-6D and the EQ-5D in patients with coronary heart disease. Health and Quality of Life Outcomes, 4, 20.
VASQUEZ, J. A., DIEHL, P. F., FLINT, C., SCHEFFRAN, J., CHI, S. H. & RIDER, T. J. 2011. The ConflictSpace of cataclysm: The international system and the spread of war 1914–1917. Foreign Policy Analysis, 7, 143-168.
VELAZQUEZ, M. A., CLAUDIO, D. & RAVINDRAN, A. R. 2010. Experiments in multiple criteria selection problems with multiple decision makers. International Journal of Operational Research, 7, 413-428.
VENKATRAMAN, N. 1989. Strategic orientation of business enterprises: the construct, dimensionality, and measurement. Management science, 35, 942-962.
WACHT, R. F. & WHITFORD, D. T. 1976. A goal programming model for capital investment analysis in nonprofit hospitals. Financial Management, 37-47.
WALTER, U., KLEINSCHMIDT, S., RIMMELE, F., WUNDERLICH, C., GEMENDE, I., BENECKE, R. & BUSSE, K. 2013. Potential impact of self-perceived prodromal symptoms on the early diagnosis of Parkinson’s disease. Journal of neurology, 260, 3077-3085.
WALTERS, S. J. & BRAZIER, J. E. 2005. Comparison of the minimally important difference for two health state utility measures: EQ-5D and SF-6D. Quality of Life Research, 14, 1523-1532.
WANG, G.-X. 2012. A network approach for researching political feasibility of healthcare reform: The case of universal healthcare system in Taiwan. Social Science \& Medicine.
WANG, T., ZHANG, Q., LIU, Z., LIU, W. & WEN, D. 2012. On social computing research collaboration patterns: a social network perspective. Frontiers of Computer Science, 6, 122-130.
WARE, J. E. & SHERBOURNE, C. D. 1992. The MOS 36-item short-form health survey (SF-36): I. Conceptual framework and item selection. Medical care, 473-483.
WEINSTEIN, M. C., SIEGEL, J. E., GOLD, M. R., KAMLET, M. S. & RUSSELL, L. B. 1996. Recommendations of the Panel on Cost-effectiveness in Health and Medicine. Jama, 276, 1253-1258.
WEINSTEIN, M. C., TORRANCE, G. & MCGUIRE, A. 2009. QALYs: the basics. Value in health, 12, S5-S9. WENG, C., GALLAGHER, D., BALES, M. E., BAKKEN, S. & GINSBERG, H. N. Understanding interdisciplinary
health sciences collaborations: a campus-wide survey of obesity experts. AMIA Annual Symposium Proceedings, 2008. 798.
WEST, E., BARRON, D. N., DOWSETT, J. & NEWTON, J. N. 1999. Hierarchies and cliques in the social networks of health care professionals: implications for the design of dissemination strategies. Social science \& medicine, 48, 633-646.
WESTFALL, J. M., MOLD, J. & FAGNAN, L. 2007. Practice-based research—“Blue Highways” on the NIH roadmap. Jama, 297, 403-406.
WHITEHEAD, W. E., BURNETT, C. K., COOK III, E. W. & TAUB, E. 1996. Impact of irritable bowel syndrome on quality of life. Digestive diseases and sciences, 41, 2248-2253.
WILLIAMS, A. 1995. The role of the EuroQol instrument in QALY calculations, Publication Secretary, Centre for Health Economics, University of York.
WILSON, P. F. 1993. Root cause analysis: A tool for total quality management, ASQ Quality Press. WINSLOW, C. A. 1951. The cost of sickness and the price of health. . Bulletin of the World Health
Organization, 84, 153. WISLØFF, T., HAGEN, G., HAMIDI, V., MOVIK, E., KLEMP, M. & OLSEN, J. A. 2014. Estimating QALY gains in
applied studies: a review of cost-utility analyses published in 2010. PharmacoEconomics, 32, 367-375.
WOLF, S. 1974. Editorial: The real gap between bench and bedside. The New England journal of medicine, 290, 802.
Page 176
159
WONODI, C., PRIVOR-DUMM, L., AINA, M., PATE, A., REIS, R., GADHOKE, P. & LEVINE, O. 2012. Using social network analysis to examine the decision-making process on new vaccine introduction in Nigeria. Health policy and planning, 27, ii27--ii38.
WOOLDRIDGE, J. 2012. Introductory econometrics: A modern approach, Cengage Learning. WOOLF, S. H. 2007. Potential health and economic consequences of misplaced priorities. JAMA: the
journal of the American Medical Association, 297, 523-526. WOOLF, S. H. 2008. The meaning of translational research and why it matters. JAMA: the journal of the
American Medical Association, 299, 211-213. WORLD HEALTH ORGANIZATION 2009. WHO guide to identifying the economic consequences of disease
and injury. WORLD HEALTH ORGANIZATION 2013. WHO methods and data sources for global burden of disease
estimates 2000-2011. Global Health Estimates Technical Paper WHO/HIS/HSI/GHE. YAGER, R. R. 1993. Non-numeric multi-criteria multi-person decision making. Group Decision and
Negotiation, 2, 81-93. YANG, K. & EL-HAIK, B. S. 2003. Design for six sigma, McGraw-Hill New York. ZARE-FARASHBANDI, F., GERAEI, E. & SIAMAKI, S. 2014. Study of co-authorship network of papers in the
Journal of Research in Medical Sciences using social network analysis. Journal of research in medical sciences: the official journal of Isfahan University of Medical Sciences, 19, 41.
ZARE MEHRJERDI, Y. 2010. Quality function deployment and its extensions. International Journal of Quality & Reliability Management, 27, 616-640.
ZECKHAUSER, R. & SHEPARD, D. 1976. Where now for saving lives? Law and contemporary problems, 5-45.
ZERHOUNI, E. 2003. The NIH roadmap. Science, 302, 63-72. ZERHOUNI, E. A. & ALVING, B. 2006. Clinical and translational science awards: a framework for a national
research agenda. Translational Research, 148, 4-5. ZHAI, L., YAN, X., SHIBCHURN, J. & SONG, X. 2014. Evolutionary analysis of international collaboration
network of Chinese scholars in management research. Scientometrics, 98, 1435-1454. ZHANG, C., YU, Q., FAN, Q. & DUAN, Z. 2013. Research collaboration in health management research
communities. BMC medical informatics and decision making, 13, 52. ZHAO, G.-H., ZHANG, D.-W., CHENG, Y. & LI, W. 2014. A Study on the Job Satisfaction of Employees based
on Social Network Analysis. ZHAO, Y. J., WEE, H. L., CHAN, Y. H., SEAH, S. H., AU, W. L., LAU, P. N., PICA, E. C., LI, S. C., LUO, N. & TAN,
L. 2010. Progression of Parkinson's disease as evaluated by Hoehn and Yahr stage transition times. Movement Disorders, 25, 710-716.
ZUCKER, D. M. 2009. How to do case study research. School of Nursing Faculty Publication Series. Amherst, MA: University of Massachusetts - Amherst.
ZWART-VAN RIJKOM, J. E., LEUFKENS, H. G., BUSSCHBACH, J. J., BROEKMANS, A. W. & RUTTEN, F. F. 2000. Differences in attitudes, knowledge and use of economic evaluations in decision-making in the Netherlands. Pharmacoeconomics, 18, 149-160.
Page 177
160
Appendix A. House of Quality
Page 178
161
Appendix B. List of Proposals and Characteristics
Proposal
Proposal Classification Proposal and Team Characteristics PI expertise
Department Categories Disciplines
involved
Cross-
campus?
(1. Yes / 0
No)
NI
(number)
Team
Size
Fund req
(BUDi)
PI
experience
#
papers
Proposal 1 Biochemistry and Molecular
Biology Diabetes 2 1 1 4 75,000 3 3
Proposal 2 Medicine Heart failure 3 0 2 5 64,000 2 3
Proposal 3 Microbiology and Immunology Asthma 2 0 1 3 120,000 14 8
Proposal 4 Biochemistry and Molecular
Biology Breast Cancer 2 0 0 5 120,000 4 5
Proposal 5 Comparative Medicine Diabetes 4 1 3 7 94,000 10 13
Proposal 6 Pediatrics Acne 1 0 1 4 45,000 19 9
Proposal 7 Cellular and Molecular
Physiology Kidney disease 1 1 0 2 59,000 1 3
Proposal 8 Medicine Asthma 3 1 1 5 68,000 9 3
Proposal 9 Psychiatry Amnesia 1 0 1 3 80,000 3 2
Proposal 10 Microbiology and Immunology Allergy 4 0 2 7 92,000 9 7
Proposal 11 Humanities Alzheimer 3 0 2 6 55,000 10 12
Proposal 12 Public Health Sciences Diabetes 3 0 1 5 39,000 12 7
Proposal 13 Pediatrics Liver disease 2 1 2 7 55,000 6 2
Proposal 14 Psychiatry Sleep disorders 2 0 0 3 46,000 5 2
Proposal 15 Obstetrics and Gynecology Endocrinology 2 0 1 4 39,000 14 8
Proposal 16 Public Health Sciences Dementia 4 1 2 8 46,000 18 6
Proposal 17 Radiology Liver disorders 3 1 0 9 78,000 10 4
Proposal 18 Neural and behavioral Sciences Drug addiction 3 0 1 5 79,000 12 10
Proposal 19 Medicine Hepatic Failure 2 1 2 7 101,000 16 13
Proposal 20 Medicine Female infertility 4 1 2 7 115,000 19 15
Page 179
162
Appendix C. Proposals’ coefficients
Proposal Proporti
on of YI PIexpi MDi Qi PBi
Proposal 1 0.250 0.488 0.667 88 0.300
Proposal 2 0.400 0.425 1.000 98 0.200
Proposal 3 0.333 1.000 0.667 97 0.675
Proposal 4 0.000 0.750 0.667 80 0.300
Proposal 5 0.429 1.000 1.000 61 0.700
Proposal 6 0.250 1.000 0.333 59 0.455
Proposal 7 0.000 0.363 0.333 78 0.130
Proposal 8 0.200 0.800 1.000 87 0.800
Proposal 9 0.333 0.388 0.333 66 0.195
Proposal 10 0.286 1.000 1.000 81 0.800
Proposal 11 0.333 1.000 1.000 66 0.700
Proposal 12 0.200 1.000 1.000 67 0.700
Proposal 13 0.286 0.575 0.667 80 0.450
Proposal 14 0.000 0.513 0.667 88 0.450
Proposal 15 0.250 1.000 0.667 67 0.525
Proposal 16 0.250 1.000 1.000 82 0.900
Proposal 17 0.000 0.900 1.000 87 0.800
Proposal 18 0.200 1.000 1.000 99 0.900
Proposal 19 0.286 1.000 0.667 77 0.675
Proposal 20 0.286 1.000 1.000 95 0.900
Appendix D. PBi coefficients
PI Experience
(Years)
Multidisciplinarity Score (MD)
0 - 0.25 0.25 - 0.50 0.50 - 0.75 0.75 - 1.00
Quality of the Proposal (Q)
0 - 25 25 - 50
50 - 75
75 - 100
0 - 25
25 - 50
50 - 75
75 - 100
0 - 25
25 - 50
50 - 75
75 - 100
0 - 25
25 - 50
50 - 75
75 - 100
0 - 2 0.00 0.00 0.05 0.10 0.00 0.00 0.07 0.13 0.00 0.00 0.08 0.15 0.00 0.00 0.10 0.20
2 - 4 0.00 0.05 0.15 0.20 0.00 0.07 0.20 0.26 0.00 0.08 0.23 0.30 0.00 0.10 0.30 0.40
4 - 6 0.05 0.10 0.20 0.30 0.07 0.13 0.26 0.39 0.08 0.15 0.30 0.45 0.10 0.20 0.40 0.60
6 - 8 0.05 0.15 0.35 0.40 0.07 0.20 0.46 0.52 0.08 0.23 0.53 0.60 0.10 0.30 0.70 0.80
More than 8 0.05 0.15 0.35 0.45 0.07 0.20 0.46 0.59 0.08 0.23 0.53 0.68 0.10 0.30 0.70 0.90
Page 180
163
Appendix E. Distribution of enrollment in graduate school (For illustration purposes only)
Department Enrollment
Biochemistry and Molecular Biology 30
Cellular and Molecular Physiology 9
Comparative Medicine 7
Humanities 15
Medicine 75
Microbiology and Immunology 22
Neural and behavioral Sciences 12
Obstetrics and Gynecology 8
Pediatrics 16
Psychiatry 12
Public Health Sciences 45
Radiology 13
Total 264
Appendix F. LINDO Code
!OBJECTIVE
Min
0.021dR1P+0.021dR2P+0.021dR4P+0.021dR7P+0.021dR8P+0.021dR9P+0.021dR13P+0.021dR14P+0.021dR17P
+0.030dPBP+0.025dNIP+0.032dMD1P+0.032dMD3P+0.032dMD4P+0.032dMD6P+0.032dMD7P+0.032dMD9P+
0.032dMD13P+0.032dMD14P+0.032dMD15P+0.032dMD19P
Subject to
!GOAL CONSTRAINTS
!Risk Goals
-0.513x1 + dR1P - dR1N = 0
-0.575x2 + dR2P - dR2N = 0
-0.250x4 + dR4P - dR4N = 0
-0.638x7 + dR7P - dR7N = 0
-0.200x8 + dR8P - dR8N = 0
-0.613x9 + dR9P - dR9N = 0
-0.425x13 + dR13P - dR13N = 0
-0.488x14 + dR14P - dR14N = 0
-0.100x17 + dR17P - dR17N = 0
Page 181
164
!Potential Benefits
0.300x1+0.200x2+0.675x3+0.300x4+0.700x5+0.455x6+0.130x7+0.800x8+0.195x9+0.800x10+0.700x11+0.700x12
+0.450x13+0.450x14+0.525x15+0.900x16+0.800x17+0.900x18+0.675x19+0.900x20+dPBP-dPBN=3.6
!Training New Generation
x1+2x2+x3+3x5+x6+x8+x9+2x10+2x11+x12+2x13+x15+2x16+x18+2x19+2x20+dNIP-dNIN=10
!Catalyzing multidisciplinary
-0.333x1 + dMD1P - dMD1N=0
-0.333x3 + dMD3P - dMD3N=0
-0.333x4 + dMD4P - dMD4N=0
-0.667x6 + dMD6P - dMD6N=0
-0.667x7 + dMD7P - dMD7N=0
-0.667x9 + dMD9P - dMD9N=0
-0.333x13 + dMD13P - dMD13N=0
-0.333x14 + dMD14P - dMD14N=0
-0.333x15 + dMD15P - dMD15N=0
-0.333x19 + dMD19P - dMD19N=0
!SYSTEM CONSTRAINTS
!Budget
75000x1+64000x2+120000x3+120000x4+94000x5+45000x6+59000x7+68000x8+80000x9+92000x10+55000x11+
39000x12+55000x13+46000x14+39000x15+46000x16+78000x17+79000x18+101000x19+115000x20 <= 600000
!Mutually Exclusiveness
x1+x5+x12 <=2
x3+x8 <=1
x13+x17 <=1
!Proportion
75000x1+120000x4<=204545
59000x7 <=61364
94000x5 <=47727
55000x11 <=102273
64000x2+68000x8+101000x19+115000x20 <=511364
120000x3+92000x10 <=150000
79000x18 <=81818
39000x15 <=54545
45000x6+55000x13 <=109091
80000x9+46000x14 <=81818
39000x12+46000x16 <=306818
78000x17 <=88636
!Minimum number of proposals
x1+x2+x3+x4+x5+x6+x7+x8+x9+x10+x11+x12+x13+x14+x15+x16+x17+x18+x19+x20 >=9
!Cross campus
x1+x5+x7+x8+x13+x16+x17+x19+x20 >= 2
!Non-negativity
dR1P >=0
dR2P >=0
Page 182
165
dR4P >=0
dR7P >=0
dR13P >=0
dR14P >=0
dR17P >=0
dR1N >=0
dR2N >=0
dR4N >=0
dR7N >=0
dR13N >=0
dR14N >=0
dR17N >=0
dPBP >=0
dPBN >=0
dNIP >=0
dNIN >=0
dMD1P >=0
dMD1N >=0
dMD3P >=0
dMD3N >=0
dMD4P >=0
dMD4N >=0
dMD6P >=0
dMD6N >=0
dMD7P >=0
dMD7N >=0
dMD9P >=0
dMD9N >=0
dMD13P >=0
dMD13N >=0
dMD14P >=0
dMD14N >=0
dMD15P >=0
dMD15N >=0
dMD19P >=0
dMD19N >=0
END
int x1
int x2
int x3
int x4
int x5
int x6
int x7
int x8
int x9
int x10
Page 183
166
int x11
int x12
int x13
int x14
int x15
int x16
int x17
int x18
int x19
int x20
Appendix G. MOS SF-36 (RAND 36-Items version). Obtained from www.rand.org
[1] In general, would you say your health is:
Excellent (1), Very good (2), Good (3), Fair (4), Poor (5)
[2] Compared to one year ago, how would you rate your health in general now:
Much better now than one year ago (1)
Somewhat better now than one year ago (2)
About the same (3)
Somewhat worse now than one year ago (4)
Much worse now than one year ago (5)
The following items are about activities you might do during a typical day. Does your health now limit you in these
activities? If so, how much? (Circle one number on each line)
Yes, Limited a lot
Yes, Limited a little
No, Not limited at all
[3] Vigorous activities, such as running, lifting heavy objects, participating in strenuous sports
(1) (2) (3)
[4] Moderate activities, such as moving a table, pushing a vacuum cleaner, bowling, or playing golf
(1) (2) (3)
[5] Lifting or carrying groceries (1) (2) (3)
[6] Climbing several flights of stairs (1) (2) (3)
[7] Climbing one flight of stairs (1) (2) (3)
[8] Bending, kneeling, or stooping (1) (2) (3)
[9] Walking more than a mile (1) (2) (3)
[10] Walking several blocks (1) (2) (3)
[11] Walking one block (1) (2) (3)
[12] Bathing or dressing yourself (1) (2) (3)
Page 184
167
During the past 4 weeks, have you had any of the following problems with your work or other regular daily activities as
a result of your physical health? (Circle one number on each line)
Yes No
[13] Cut down the amount of time you spent on work or other activities (1) (2)
[14] Accomplished less than you would like (1) (2)
[15] Were limited in the kind of work or other activities (1) (2)
[16] Had difficulty performing the work or other activities (for example, it took extra effort) (1) (2)
During the past 4 weeks, have you had any of the following problems with your work or other regular daily activities as
a result of any emotional problems (such as feeling depressed or anxious)? (Circle one number on each line)
Yes No
[17] Cut down the amount of time you spent on work or other activities (1) (2)
[18] Accomplished less than you would like (1) (2)
[19] Didn't do work or other activities as carefully as usual (1) (2)
[20] During the past 4 weeks, to what extent has your physical health or emotional problems interfered with your normal
social activities with family, friends, neighbors, or groups? (Circle one number)
Not at all (1), Slightly (2), Moderately (3), Quite a bit (4), Extremely (5)
[21] How much bodily pain have you had during the past 4 weeks? (Circle one number)
None (1), Very mild (2), Mild (3), Moderate (4), Severe (5), Very severe (6)
[22] During the past 4 weeks, how much did pain interfere with your normal work (including both work outside the home
and housework)?
Not at all (1), A little bit (2), Moderately (3), Quite a bit (4), Extremely (5)
Page 185
168
These questions are about how you feel and how things have been with you during the past 4 weeks. For each question,
please give the one answer that comes closest to the way you have been feeling. How much of your time during the
past 4 weeks…
All of the Time
Most of the Time
A Good Bit of the Time
Some of the Time
A Little of the Time
None of the Time
[23] Did you feel full of pep? (1) (2) (3) (4) (5) (6)
[24] Have you been a very nervous person? (1) (2) (3) (4) (5) (6)
[25] Have you felt so down in the dumps that nothing could cheer you up?
(1) (2) (3) (4) (5) (6)
[26] Have you felt calm and peaceful? (1) (2) (3) (4) (5) (6)
[27] Did you have a lot of energy? (1) (2) (3) (4) (5) (6)
[28] Have you felt downhearted and blue? (1) (2) (3) (4) (5) (6)
[29] Did you feel worn out? (1) (2) (3) (4) (5) (6)
[30] Have you been a happy person? (1) (2) (3) (4) (5) (6)
[31] Did you feel tired? (1) (2) (3) (4) (5) (6)
[32] During the past 4 weeks, how much of the time has your physical health or emotional problems interfered with
your social activities (like visiting with friends, relatives, etc.)?
All of the time (1), Most of the time (2), Some of the time (3), A little of the time (4),
None of the time (5)
[33] How TRUE or FALSE is each of the following statements for you.
Definitely True
Mostly True
Don't Know
Mostly False
Definitely False
33. I seem to get sick a little easier than other people (1) (2) (3) (4) (5)
34. I am as healthy as anybody I know (1) (2) (3) (4) (5)
35. I expect my health to get worse (1) (2) (3) (4) (5)
36. My health is excellent (1) (2) (3) (4) (5)
Page 186
169
Appendix H. SF-12 Health Survey (http://www.sf-36.org/demos/SF-12.html)
[1] In general, would you say your health is:
Excellent (1), Very good (2), Good (3), Fair (4), Poor (5)
[2] The following questions are about activities you might do during a typical day. Does your health now limit you in
these activities? If so, how much?
Yes, Limited a lot
Yes, Limited a little
No, Not limited at all
[a] Moderate activities, such as moving a table, pushing a vacuum cleaner, bowling, or playing golf
(1) (2) (3)
[b] Climbing several flights of stairs (1) (2) (3)
[3] During the past 4 weeks, have you had any of the following problems with your work or other regular daily activities
as a result of your physical health?
Yes No
[a] Accomplished less than you would like (1) (2)
[b] Were limited in the kind of work or other activities (1) (2)
[4] During the past 4 weeks, have you had any of the following problems with your work or other regular daily
activities as a result of any emotional problems (such as feeling depressed or anxious)?
Yes No
[a] Accomplished less than you would like (1) (2)
[b] Did work or other activities less carefully than usual (1) (2)
[5] During the past 4 weeks, how much did pain interfere with your normal work (including both work outside the
home and housework)?
Not at all (1), A little bit (2), Moderately (3), Quite a bit (4), Extremely (5)
[6] These questions are about how you feel and how things have been with you during the past 4 weeks. For each
question, please give the one answer that comes closest to the way you have been feeling. How much of the time
during the past 4 weeks...
All of the Time
Most of the Time
A Good Bit of the Time
Some of the Time
A Little of the Time
None of the Time
[a] Have you felt calm and peaceful? (1) (2) (3) (4) (5) (6)
[b] Did you have a lot of energy? (1) (2) (3) (4) (5) (6)
[c] Have you felt downhearted and blue? (1) (2) (3) (4) (5) (6)
[7] During the past 4 weeks, how much of the time has your physical health or emotional problems interfered with your
social activities (like visiting friends, relatives, etc.)?
All of the time (1), Most of the time (2), Some of the time (3), A little of the time (4),
None of the time (5)
Page 187
Vita David A. Munoz
EDUCATION
Ph.D. Dual degree in Industrial Engineering and Operations Research Aug 15
Master of Engineering in Industrial Engineering Dec 13
Department of Industrial & Manufacturing Engineering GPA: 3.86
The Pennsylvania State University, University Park, United States
Industrial Engineering Professional Title May 09
Bachelor Degree in Engineering Sciences Sept 08
Department of Industrial Engineering
Universidad del Bío-Bío, Concepción, Chile
ACADEMIC EXPERIENCE
SCHOLAR (Global Engineering Leadership Program) Sep 14 – Aug 15
SCHOLAR (Center for Health Organization Transformation, CHOT, NSF) Aug 13 – Aug 15
SCHOLAR (Center for Integrated Healthcare Delivery Systems, CIHDS) Sep 11 – Aug 15
RESEARCH ASSISTANT (Clinical and Translational Science Institute, CTSI, NIH) Jan 13 – Aug 15
INSTRUCTOR - SIX SIGMA METHODOLOGY (IE436) Jan 14 – May 14
GRADER – STATISTICAL QUALITY CONTROL (IE434) Aug 12 – Dec 12
GRADUATE RESEARCHER (Supported by the Defense Advanced Research Project Agency, DARPA) Jan 12 – Dec 12
Department of Industrial & Manufacturing Engineering
The Pennsylvania State University, University Park, PA, USA
RESEARCHER (Thesis Research) Sep 08 – Apr 09
Modeling & Simulation Army Center, Chilean Army, Santiago, Chile
TEACHING ASSISTANT Mar 05 – Aug 08
Differential and Integral Calculus, Multivariable Calculus, Thermodynamics, Engineering Economy and Simulation.
Department of Industrial Engineering, Universidad del Bío-Bío, Concepción, Chile
PUBLICATIONS
Published papers
Munoz, D., Nembhard, H., and Kraschnewski, J., (2014). “Quantifying complexity in translational research: An integrated
approach.” International Journal of Health Care Quality Assurance, Vol. 27 Iss: 8
Munoz, D., Queupil, J., and Fraser, P., (Forthcoming). “Assessing Collaboration Networks in Educational Research: A Social
Network Analysis Approach.” International Journal of Educational Management
Munoz, D., and Bastian, N. (Forthcoming). “Estimating Cross-training Call Center Capacity through Simulation.” Journal of
Systems Science and Systems Engineering.
Munoz, D. (Forthcoming). “Assessing the research efficiency of higher education institutions in Chile –a data envelopment
analysis approach.” International Journal of Educational Management.
Papers under Journal Review
Munoz, D., Nembhard, H., and Kraschnewski, J., (Submitted). “Social Network Analysis to Evaluate Intra-Institutional
Collaboration Capacity – A Case Study on Obesity.”
Munoz, D., Bastian, N., and Ventura, M., (Submitted). “A Mixed-Methods Approach for Healthcare Process Improvement: A
Case Study.”
Munoz, D., and Tucker, C., (Submitted). “A Semantic Network for Modeling the Structure of Textually-Derived Information
and its Impact on Receivers' Response States.”
Conference Proceedings
Munoz, D., and Kang, H. (2015), “A Dynamic Network Analysis Approach for Evaluating Knowledge Dissemination in a Multi-
Disciplinary Collaboration Network in Obesity Research.” Winter Simulation Conference (WSC). Huntington Beach, CA, USA.
Munoz, D., and Tucker, C., (2014) “Assessing Students’ Emotional States: An Approach to Identify Lectures that Provide an
Enhanced Learning Experience.” In Proceedings of The International Design and Engineering Technical Conferences (ISERC).
Buffalo, New York, USA.
Munoz, D., Bastian, N., and Ventura, M., (2014) “A Workflow Assessment for a Pediatric Intensive Care Unit: A Mixed-
Methods Approach.” In Proceedings of The ISERC. Montreal, Canada. (Best Paper Award of the Healthcare Systems Track)
Munoz, D., Alonso, W., and Nembhard, H., (2014) “A Social Network Analysis-based Approach to Evaluate Workflow and
Quality in an Intensive Care Unit.” In Proceedings of The ISERC. Montreal, Canada.
Gillam, P., Nembhard, H., and Muñoz, D., (2014) “The Role of Quality Improvement Methods in Translational Research.” In
Proceedings of The ISERC. Montreal, Canada. 2014.
Munoz, D., and Brutus, M., (2013) “Understanding the Trade-offs in a Call Center.” In Proceedings of WSC. Washington D.C.