124
Quality in the Concrete Paving Process Module 2 Module 8 - 1 Quality in the Concrete Paving Process Workshop Introduction

Quality in the Concrete Paving Process
Module 2 Module 8 - 1
Quality in the Concrete Paving Process
Workshop Introduction

Quality in the Concrete Paving Process
Module 8- 2
Instructors
Dennis Dvorak
Jim Grove
Mike Praul
FHWA Resource Center
(708) 283-3542
ATI Inc. / FHWA
Office of Infrastructure, Washington D.C. (515) 294-5988
FHWA Maine Division
(207) 512-4917

Quality in the Concrete Paving Process
Module 8- 3
Agenda Workshop Introduction
Module 1: Quality Assurance Concepts
Module 2: Concrete Materials
Module 3: Concrete Properties and Testing
Module 4: QC and Agency Acceptance
Module 5: Pre-Paving and Mix Production
Module 6: Paving
Module 7: Utilizing Quality Concepts
Module 8: Quality in Field Practice

Quality in the Concrete Paving Process
Module 8- 4
What is this Workshop about?
Common Sense Tools

Quality in the Concrete Paving Process
Module 8- 5
Goal: Plant Seeds
What do you do today? What are you striving to accomplish? What should the agency test and inspect? What should the contractor test and inspect? How should we accept concrete pavement? What new tools and technologies can you use
to build better pavements?
Quality in the Concrete Paving Process
Module 8- 6
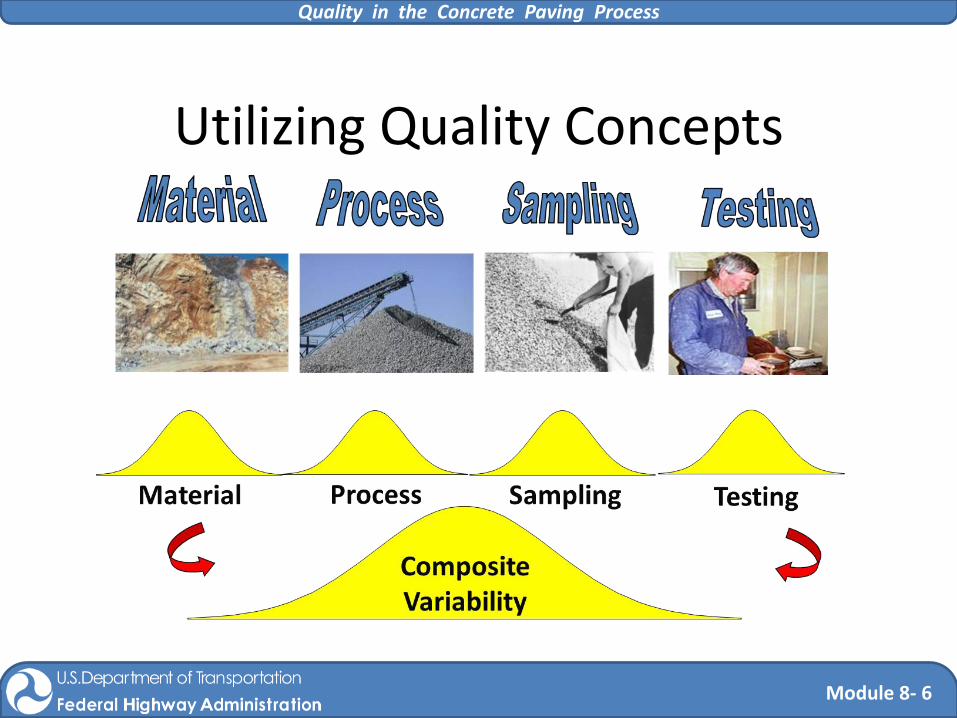
Utilizing Quality Concepts
Quality in the Concrete Paving Process
Module 8- 7
Learning Objectives
By the end of this session, you will be able to • Describe how PWL is used to assess quality
• Understand the impact of variability
• Understand the basics of control charts
• Understand the information provided by a heat signature plot
• Recognize the time savings by using the maturity for opening strength
Quality in the Concrete Paving Process
Module 8- 8
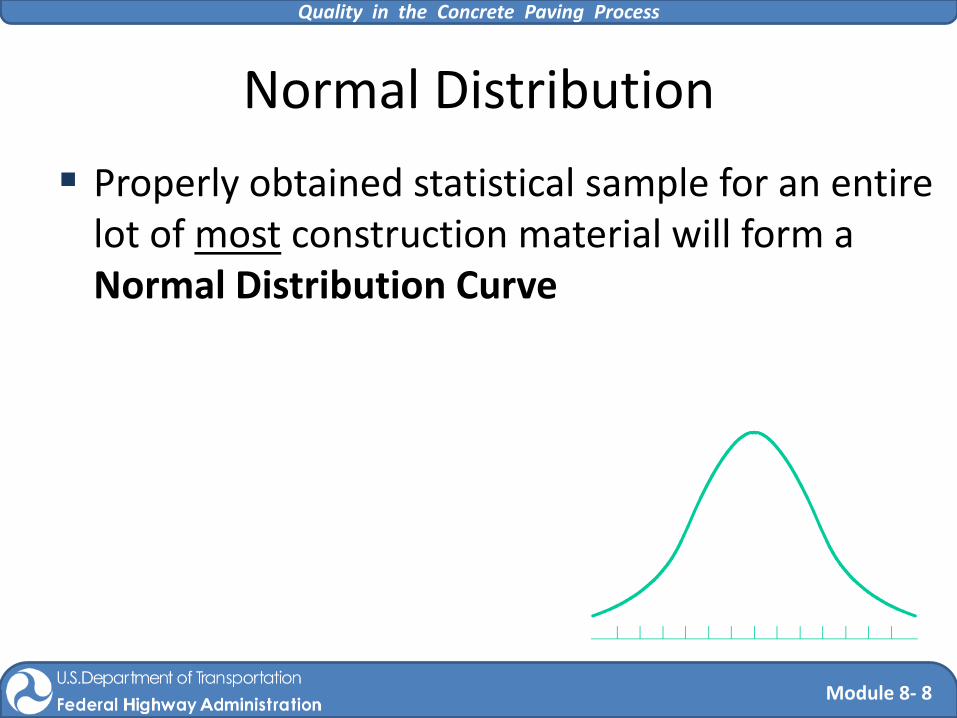
Normal Distribution
Properly obtained statistical sample for an entire lot of most construction material will form a Normal Distribution Curve

Quality in the Concrete Paving Process
Module 8- 9
68 – 95 – 99.7 Rule
This Empirical Rule states that: • 68% of all possible samples are clustered about
the mean within ± 1 standard deviation • 95.5% are within ± 2 standard deviations • 99.7% are within ± 3 standard
deviations
–1Sn 1S
n 2S
n –2S
n 3S
n –3Sn
68 95.5
99.7
x

Quality in the Concrete Paving Process
Module 8- 10
Testing Targets and Limits Based on Normal Distribution
Specifications normally identify targets and/or limits for individual quality characteristics
Specification limits should be based on the principle of normal distribution
6.5 5.5 7.0 5.0 8.0 7.5 6.0
Lower Spec Limit
Upper Spec Limit
Target
Air Content (%)
Quality in the Concrete Paving Process
Module 8- 11
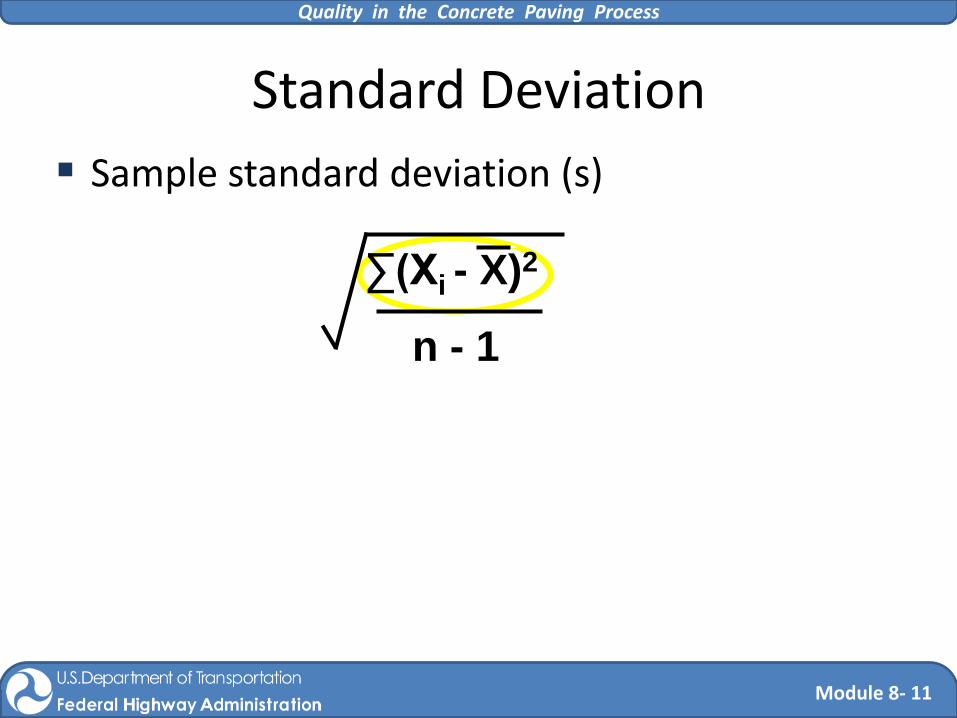
Standard Deviation
Sample standard deviation (s)
s =
∑(Xi - X)2
n - 1

Quality in the Concrete Paving Process
Module 8- 12
PWL
Using the sample data, with its mean and standard deviation, we can determine the quality level of the sample

Quality in the Concrete Paving Process
Module 8- 13
PWL
Estimates the percentage of material within specification limits • Assumes normal distribution • Area equals 1.0 or 100%
1.0
or 100%
Quality in the Concrete Paving Process
Module 8- 14
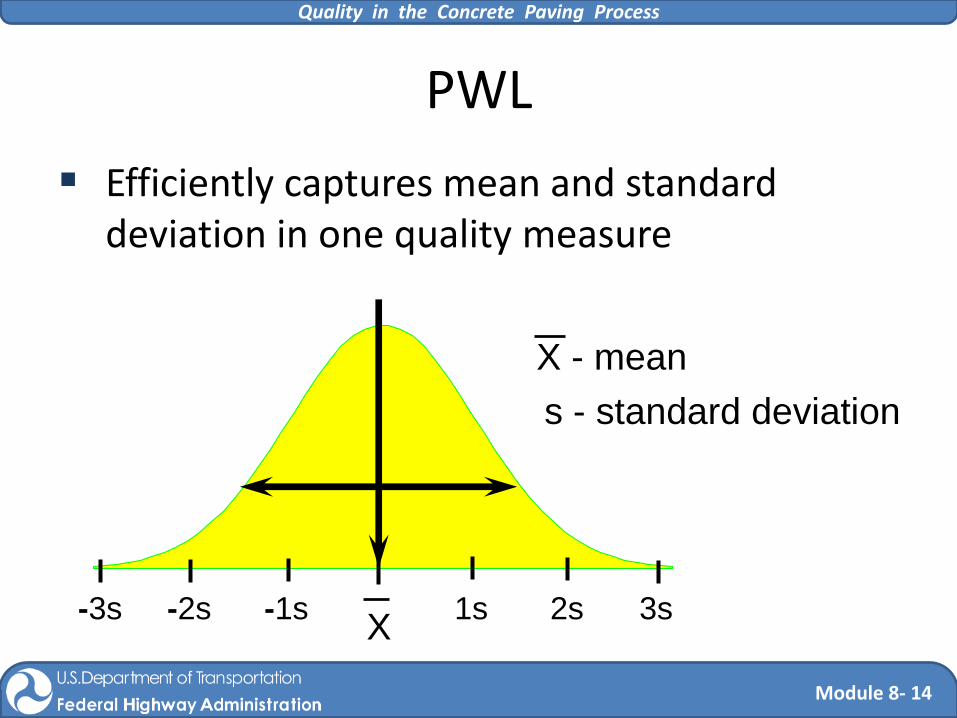
PWL
Efficiently captures mean and standard deviation in one quality measure
X 3s 2s 1s -3s -2s -1s
X - mean
s - standard deviation

Quality in the Concrete Paving Process
Module 8- 15
Single Specification PWL
LSL
PWLL
or X
USL
PWLU
X

Quality in the Concrete Paving Process
Module 8- 16
Double Specification PWL
- 100 = PWLL
LSL
USL
PWLU
X
USL
LSL
PWL
+
Quality in the Concrete Paving Process
Module 8- 17
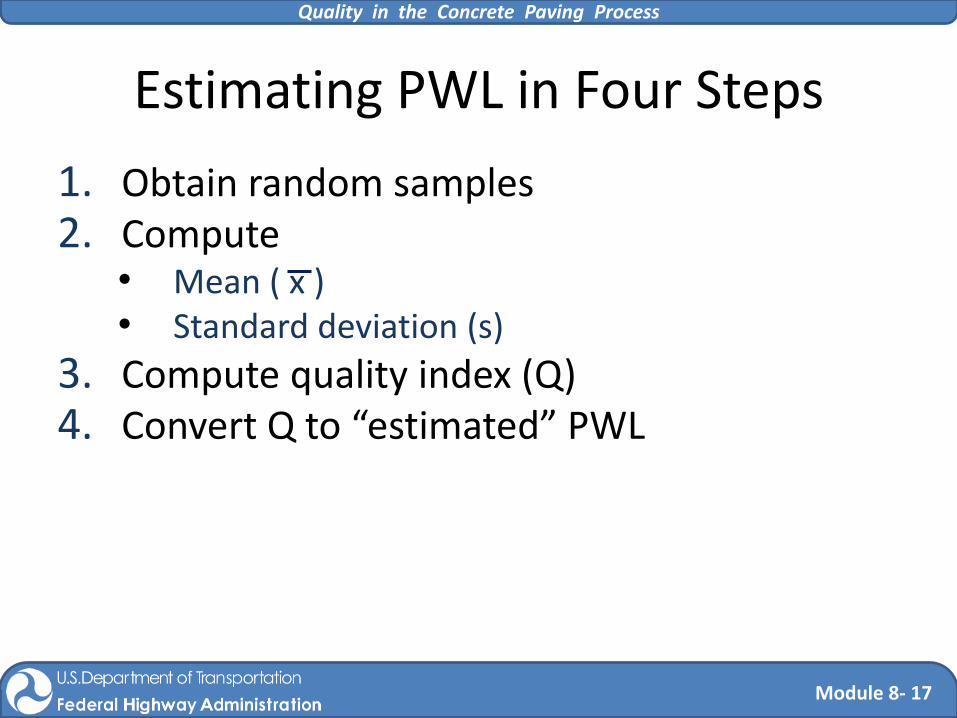
Estimating PWL in Four Steps
1. Obtain random samples 2. Compute
• Mean ( x ) • Standard deviation (s)
3. Compute quality index (Q) 4. Convert Q to “estimated” PWL

Quality in the Concrete Paving Process
Module 8- 18
3s 2s s -3s -2s -s
Compute Q
QL = X – LSL
s
USL - X
s QU =
LSL
USL
X
QL QU
Quality in the Concrete Paving Process
Module 8- 19
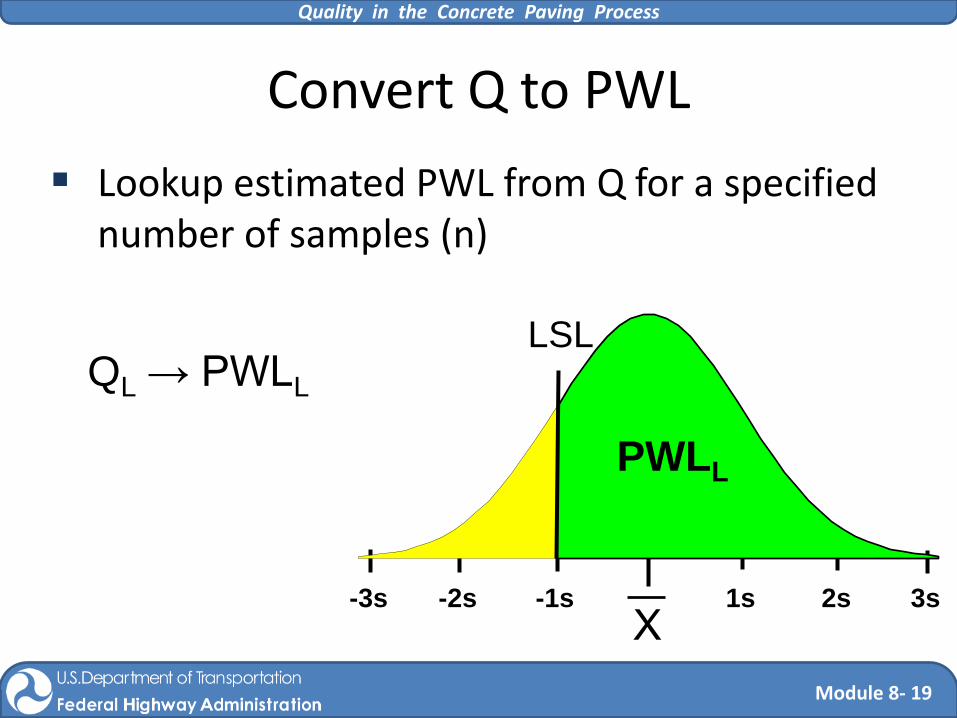
QL → PWLL
Convert Q to PWL
Lookup estimated PWL from Q for a specified number of samples (n)
X 3s 2s 1s -3s -2s -1s
PWLL
LSL

Quality in the Concrete Paving Process
Module 8- 20
Convert Q to PWL
Lookup estimated PWL from Q for a specified number of samples (n)
X 3s 2s 1s -3s -2s -1s
QU → PWLU PWLU USL
Quality in the Concrete Paving Process
Module 8- 21
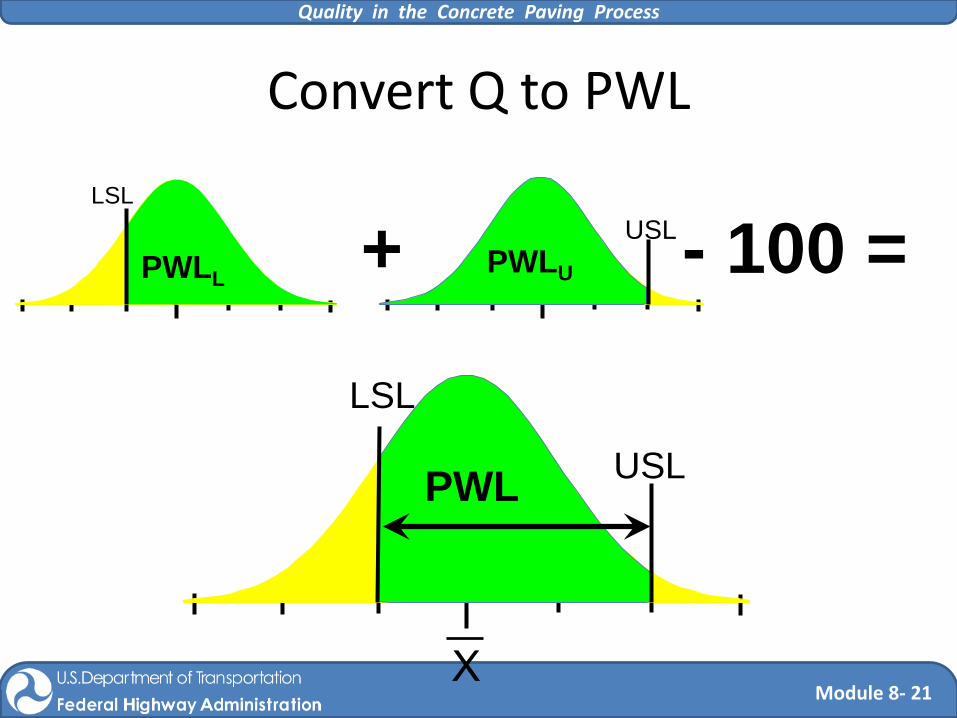
Convert Q to PWL
+ - 100 = PWLL
LSL
USL
PWLU
USL
X
LSL
PWL

Quality in the Concrete Paving Process
Module 8- 22
Approaches to Using Pay Factors
Quality Assurance specifications typically use a pay factor formula to determine pay factors
Under each approach, the pay factors are directly related to the PWL
Quality in the Concrete Paving Process
Module 8- 23
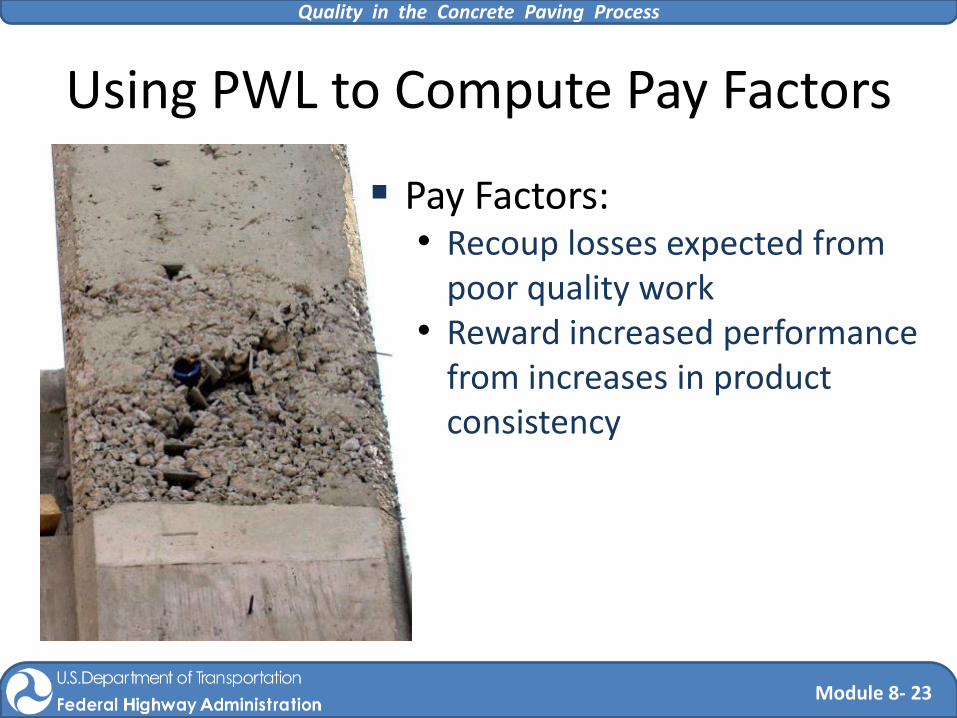
Using PWL to Compute Pay Factors
Pay Factors: • Recoup losses expected from
poor quality work • Reward increased performance
from increases in product consistency

Quality in the Concrete Paving Process
Module 8- 24
Pay Factor Formula
A pay factor formula presents a mathematical equation that typically derives a linear schedule of pay from the PWL
AASHTO provides a recommended equation:
Pay Factor (PF) = 0.55 + 0.5 (PWL) (PWL is expressed as a decimal value in this equation)
Quality in the Concrete Paving Process
Module 8- 25
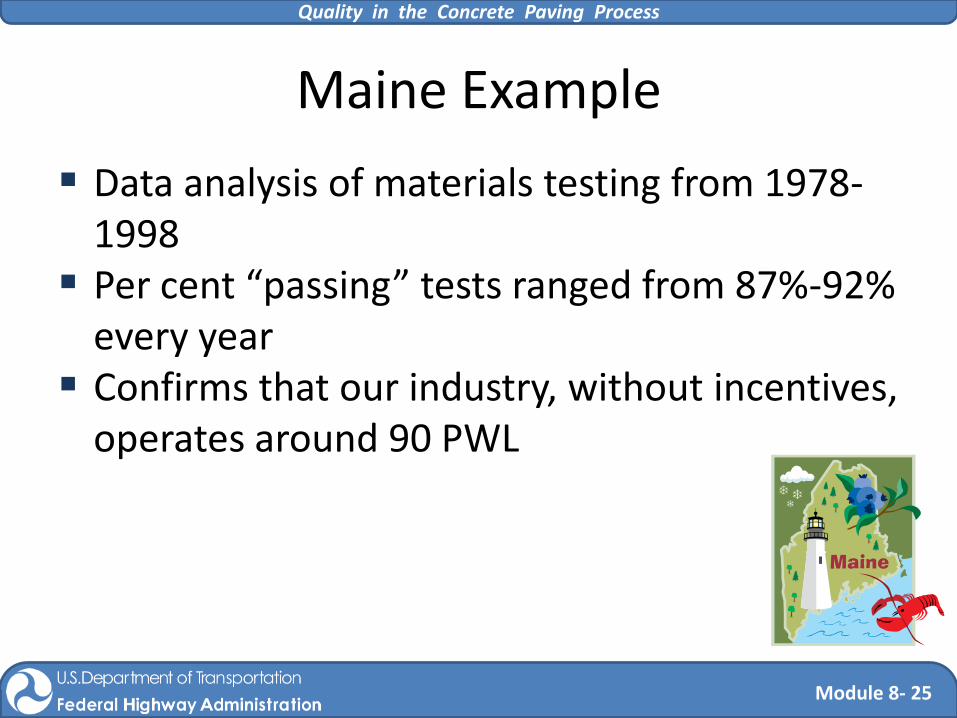
Maine Example
Data analysis of materials testing from 1978-1998
Per cent “passing” tests ranged from 87%-92% every year
Confirms that our industry, without incentives, operates around 90 PWL
Quality in the Concrete Paving Process
Module 8- 26
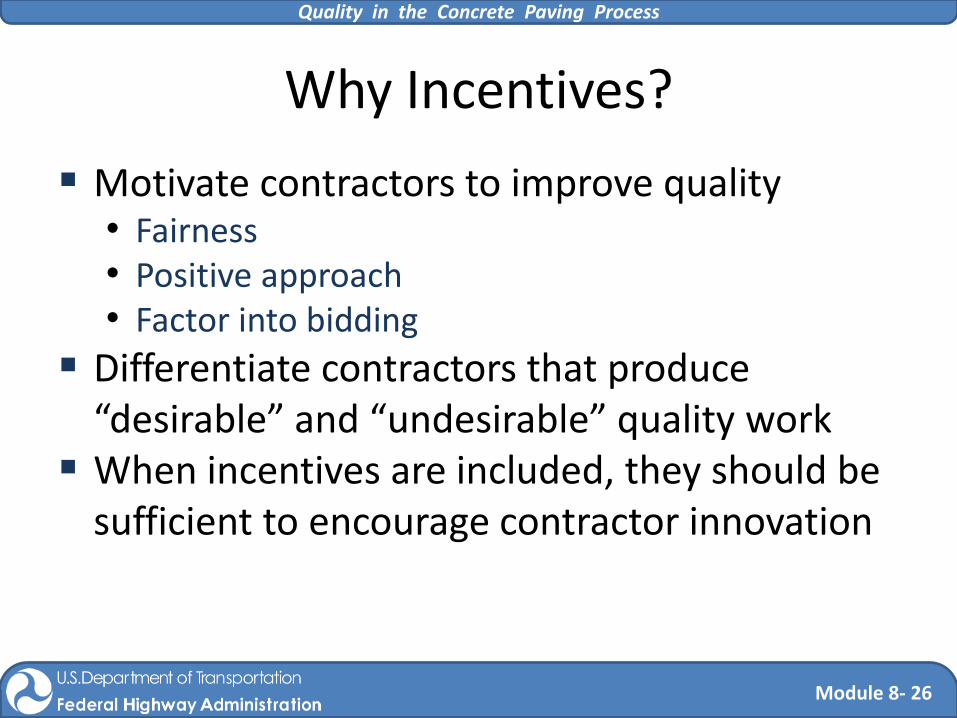
Why Incentives?
Motivate contractors to improve quality • Fairness • Positive approach • Factor into bidding
Differentiate contractors that produce “desirable” and “undesirable” quality work
When incentives are included, they should be sufficient to encourage contractor innovation

Quality in the Concrete Paving Process
Module 8- 27
Payment Plan with 5% Incentive
Estimated PWL
AQL PF=0.5PWL + 55 Pay F
acto
r (%
)
RQL
Payment Plan with 5% Incentive

Quality in the Concrete Paving Process
Module 8- 28
Pay
Incentive Pay
Disincentive
AQL=90
100 95 105
90 80 100
Pay factors
Estimated PWL
Payment Plan with Incentive

Quality in the Concrete Paving Process
Module 8- 29
AQL
Estimated PWL
AQL PF=0.5PWL + 55 Pay F
acto
r (%
)
PF=100
RQL
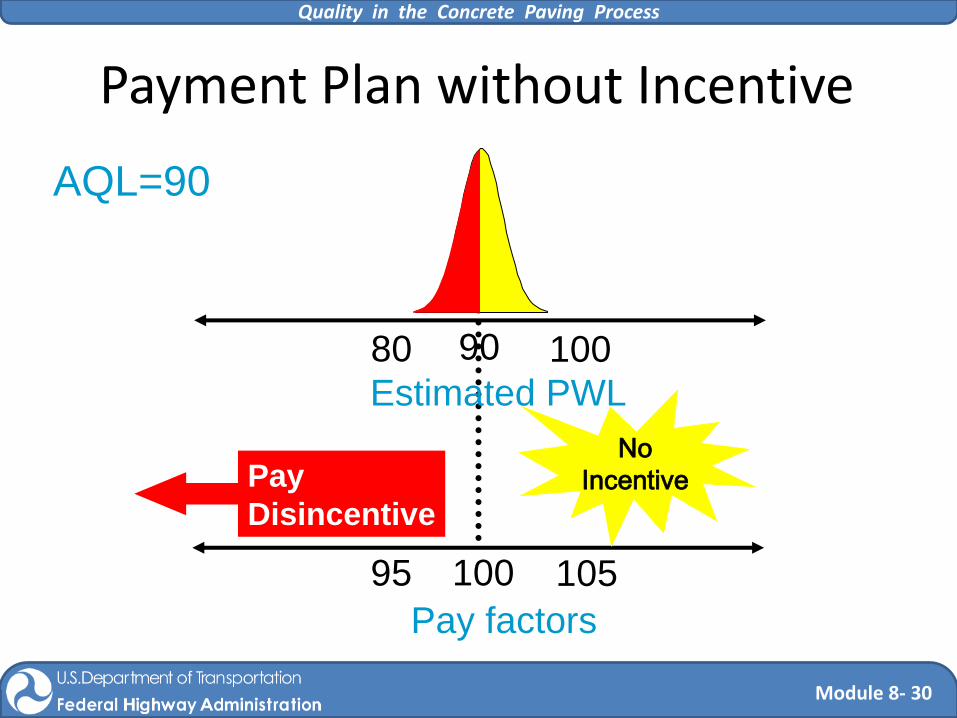
Payment Plan without Incentive
Quality in the Concrete Paving Process
Module 8- 30
Pay
Disincentive
AQL=90
90 80 100
100 95 105
Pay factors
No
Incentive
Estimated PWL
Payment Plan without Incentive

Quality in the Concrete Paving Process
Module 8- 31
Pay
Disincentive
AQL=90
90 80 100
100 95 105
Pay factors
98
Estimated PWL
Payment Plan without Incentive

Quality in the Concrete Paving Process
Module 8- 32
Sources of Variability

Quality in the Concrete Paving Process
Module 8- 33
Validity of Sampling Data
Required for Statistical analysis:
1. “Multiple” (n > 3) samples are used 2. All samples are “Randomly” obtained 3. Material is produced and samples are obtained
under “Controlled Conditions”

Quality in the Concrete Paving Process
Module 8- 34 II - 34
How well does this individual sample result
represent the probable air content for every
material sample from the entire lot of concrete?
A technician randomly obtains one sample of concrete from a 50 yard lot and determines the air content of this sample.

Quality in the Concrete Paving Process
Module 8- 35
Air Content (%)
6.5 5.5 7.0 5.0 8.0 7.5 6.0
Lower
Spec
Limit
Upper
Spec
Limit
Target
Quality in the Concrete Paving Process
Module 8- 36 II - 36
The same technician now randomly obtains two separate samples of n = 5 from the same 50 yard lot of concrete and determines the air content of each sample.
Which of the two samples is more
representative of the probable air content of
the entire lot of concrete??

Quality in the Concrete Paving Process
Module 8- 37
Air Content (%) Sample # 1
6.5 5.5 7.0 5.0 8.0 7.5 6.0
Lower
Spec
Limit
Upper
Spec
Limit
Target
Quality in the Concrete Paving Process
Module 8- 38
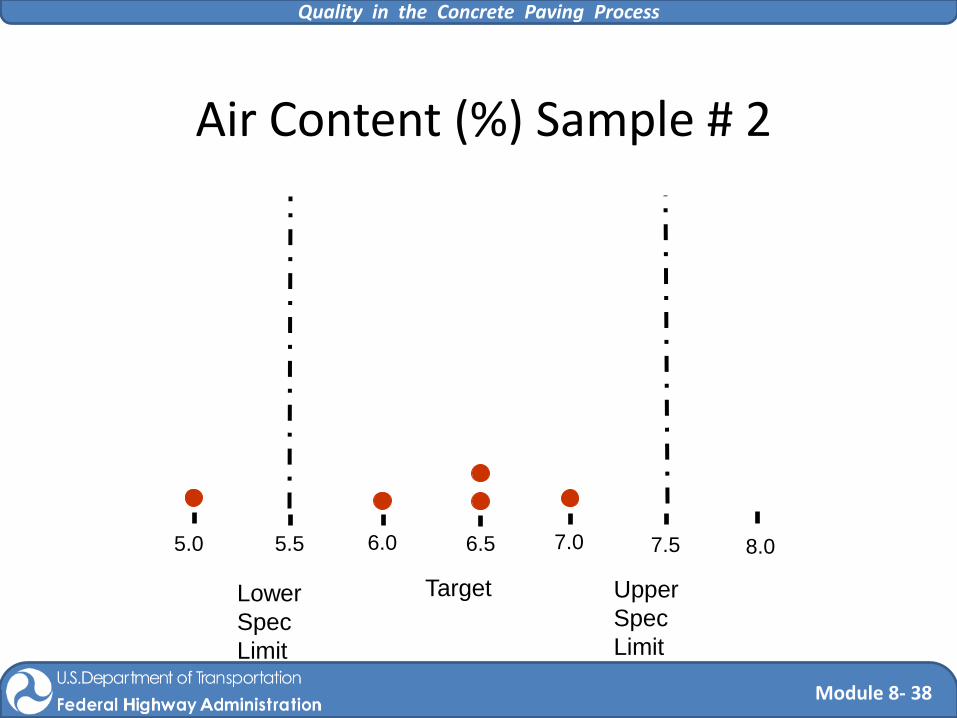
6.5 5.5 7.0 5.0 8.0 7.5 6.0
Lower
Spec
Limit
Upper
Spec
Limit
Target
Air Content (%) Sample # 2
Quality in the Concrete Paving Process
Module 8- 39 II - 39
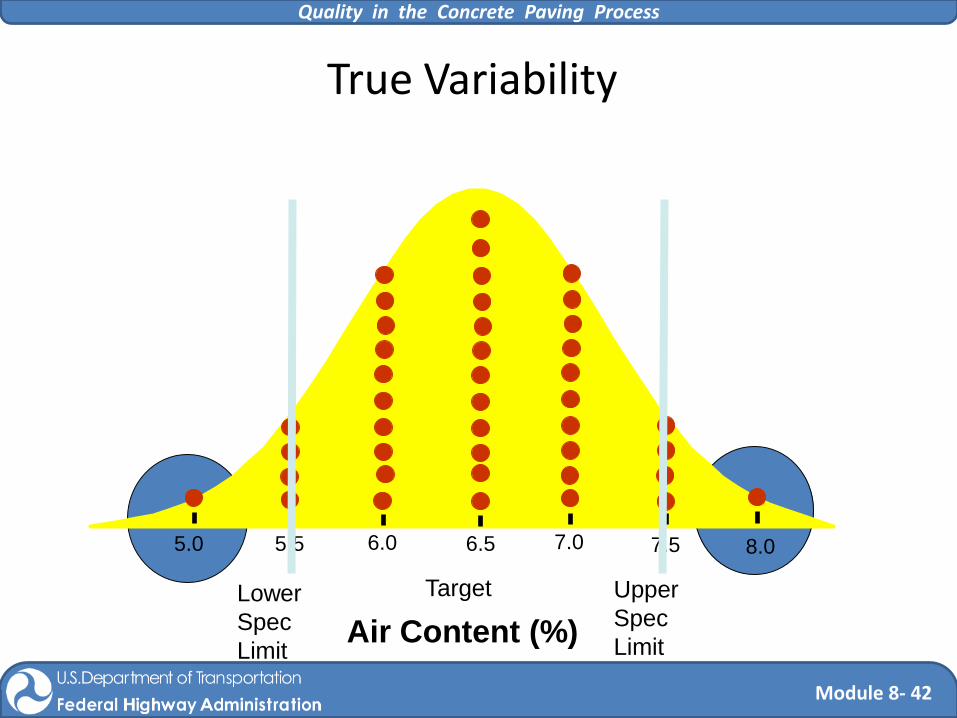
One way to obtain a more complete picture of the true variability of the air content of the 50 yard lot of concrete would be to test one sample from each of the 50 yards (creating 50 sublots)
Based upon the previous plots, what would you
project as the result of an n=50 sample size?
How does your projection compare with the actual
results?

Quality in the Concrete Paving Process
Module 8- 40
True Variability
6.5 5.5 7.0 5.0 8.0 7.5 6.0
Lower
Spec
Limit
Upper
Spec
Limit
Target
Air Content (%)
Quality in the Concrete Paving Process
Module 8- 41
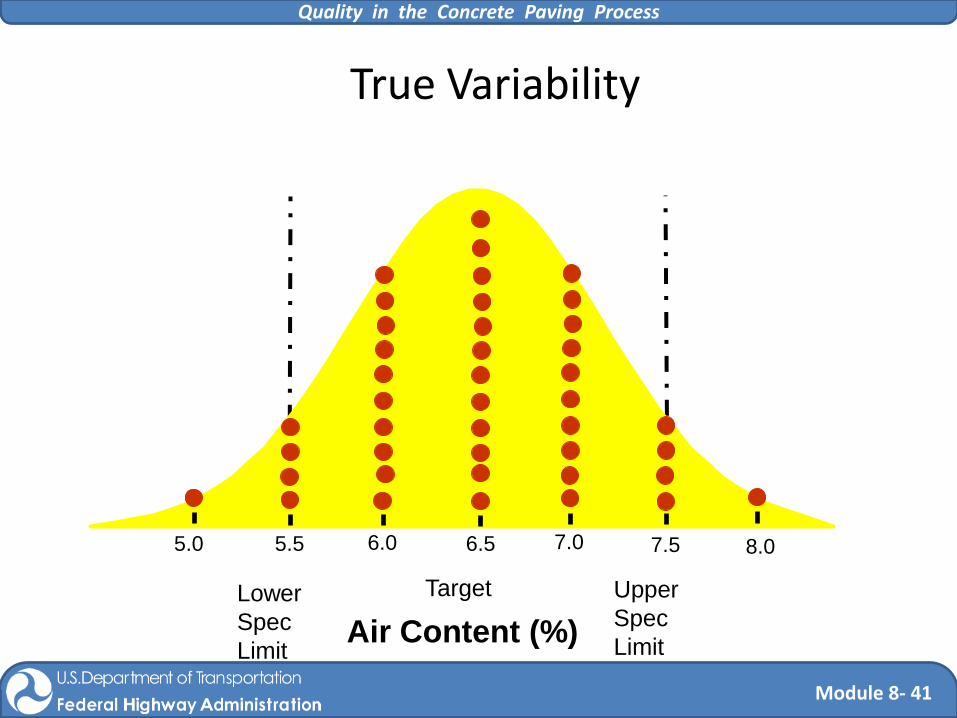
True Variability
6.5 5.5 7.0 5.0 8.0 7.5 6.0
Lower
Spec
Limit
Upper
Spec
Limit
Target
Air Content (%)
Quality in the Concrete Paving Process
Module 8- 42
True Variability
6.5 5.5 7.0 5.0 8.0 7.5 6.0
Lower
Spec
Limit
Upper
Spec
Limit
Target
Air Content (%)

Quality in the Concrete Paving Process
Module 8- 43
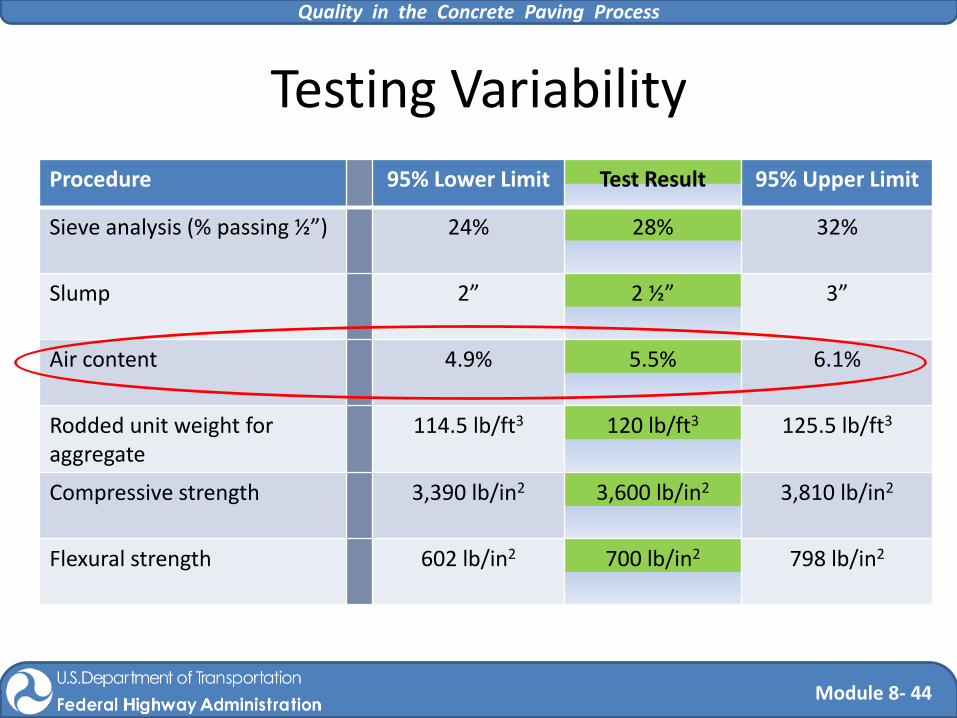
Testing Variability
Inherent in the procedures and apparatus
Influenced by the technicians
Quality in the Concrete Paving Process
Module 8- 44
Testing Variability
Procedure 95% Lower Limit Test Result 95% Upper Limit
Sieve analysis (% passing ½”) 24% 28% 32%
Slump 2” 2 ½” 3”
Air content 4.9% 5.5% 6.1%
Rodded unit weight for aggregate
114.5 lb/ft3 120 lb/ft3 125.5 lb/ft3
Compressive strength 3,390 lb/in2 3,600 lb/in2 3,810 lb/in2
Flexural strength 602 lb/in2 700 lb/in2 798 lb/in2

Quality in the Concrete Paving Process
Module 8- 45
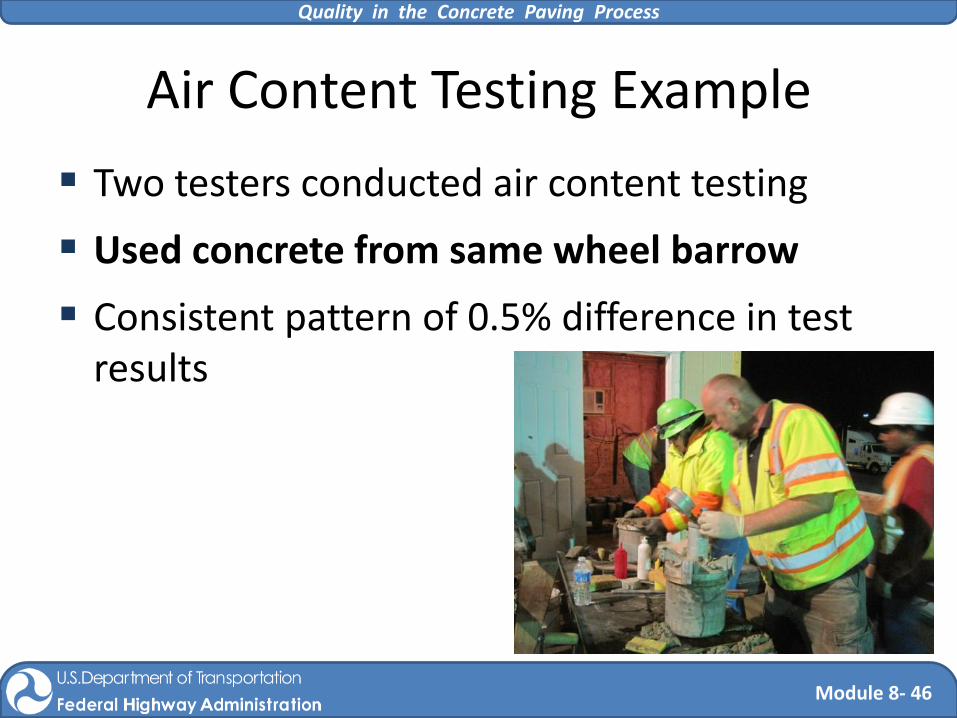
Air Content Testing Example
Specified air content – 5.0% to 6.5%
Two tests from the same wheelbarrow of concrete
• Contractor test result – 4.9%
• Agency test result – 5.5%
What is the air content?
What would happen if the
test results are reversed?
Quality in the Concrete Paving Process
Module 8- 46
Air Content Testing Example
Two testers conducted air content testing
Used concrete from same wheel barrow
Consistent pattern of 0.5% difference in test results

Quality in the Concrete Paving Process
Module 8- 47
Air Content Testing Example
Tester 1
Meter 1 => 4.5%
Meter 2 => 4.5%
Tester 2
Meter 2 => 5.0%
Meter 1 => 5.0%

Quality in the Concrete Paving Process
Module 8- 48
Air Content Testing Example
Tester 1
Plate =>5.2%
Bar => 5.9%
Tester 2
Plate => 5.1%
Bar => 6.1%

Quality in the Concrete Paving Process
Module 8- 49
Statistical Process Control (SPC) Monitor QC measurements and react
• Concentrate on identifying change
• Do not focus on specification limits
• Changes in materials and/or processes (unusual test results)
4.50
5.00
5.50
6.00
6.50
7.00
7.50
0 1 2 3 4 5 6 7 8 9 10 11 12 13 14 15 16 17 18 19 20 21
Air
Co
nte
nt (%
)
Test #
Air Content

Quality in the Concrete Paving Process
Module 8- 50
Chance Causes vs. Assignable Causes
Construction materials are subject to a certain degree of variability, stemming from two primary sources: Chance cause –
A source of variation that is inherent in any production process and which cannot be eliminated as it is due to random, expected causes.
Assignable cause – An identifiable, specific cause of variation in a given process or measurement. A cause of variation that is not random and does not occur by chance.

Quality in the Concrete Paving Process
Module 8- 51
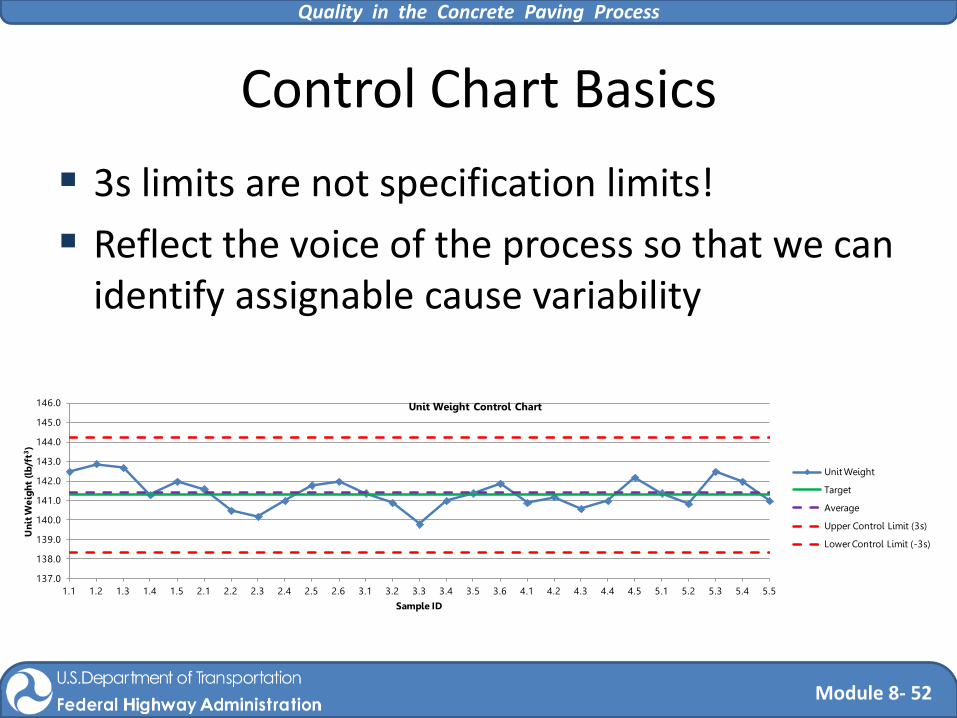
Control Chart Basics Control charts are process and contractor specific Average of test results plotted as the centerline Upper and lower control limits
• Usually plotted at 3 times the standard deviation (3s) of representative test data
• Define the limits of chance cause variability
137.0
138.0
139.0
140.0
141.0
142.0
143.0
144.0
145.0
146.0
1.1 1.2 1.3 1.4 1.5 2.1 2.2 2.3 2.4 2.5 2.6 3.1 3.2 3.3 3.4 3.5 3.6 4.1 4.2 4.3 4.4 4.5 5.1 5.2 5.3 5.4 5.5
Uni
t Wei
ght
(lb/
ft3)
Sample ID
Unit Weight Control Chart
Unit Weight
Target
Average
Upper Control Limit (3s)
Lower Control Limit (-3s)
Quality in the Concrete Paving Process
Module 8- 52
Control Chart Basics
3s limits are not specification limits!
Reflect the voice of the process so that we can identify assignable cause variability
137.0
138.0
139.0
140.0
141.0
142.0
143.0
144.0
145.0
146.0
1.1 1.2 1.3 1.4 1.5 2.1 2.2 2.3 2.4 2.5 2.6 3.1 3.2 3.3 3.4 3.5 3.6 4.1 4.2 4.3 4.4 4.5 5.1 5.2 5.3 5.4 5.5
Uni
t Wei
ght
(lb/
ft3)
Sample ID
Unit Weight Control Chart
Unit Weight
Target
Average
Upper Control Limit (3s)
Lower Control Limit (-3s)

Quality in the Concrete Paving Process
Module 8- 53
Control Chart Basics Revise 3s limits when process changes result in
changes to the chance cause variability • 3s limits that are too tight chasing phantom
assignable cause variability
• 3s limits that are too loose mask assignable cause variability
137.0
138.0
139.0
140.0
141.0
142.0
143.0
144.0
145.0
146.0
1.1 1.2 1.3 1.4 1.5 2.1 2.2 2.3 2.4 2.5 2.6 3.1 3.2 3.3 3.4 3.5 3.6 4.1 4.2 4.3 4.4 4.5 5.1 5.2 5.3 5.4 5.5
Uni
t Wei
ght
(lb/
ft3)
Sample ID
Unit Weight Control Chart
Unit Weight
Target
Average
Upper Control Limit (3s)
Lower Control Limit (-3s)

Quality in the Concrete Paving Process
Module 8- 54
Control Chart Basics
Recognizing assignable cause variability
A. One test result is outside of the 3s limits
140.0
141.0
142.0
143.0
144.0
145.0
146.0
147.0
148.0
149.0
150.0
1-1
1-2
1-3
1-4
1-5
1-6
2-1
2-2
2-3
2-4
2-5
2-6
3-1
3-2
3-3
3-4
3-5
3-6
4-1
4-2
4-3
4-4
4-5
4-6
5-1
5-2
5-3
5-4
Un
it W
eig
ht
(lb
/ft3
)
Sample ID
Example Control Chart
Unit Weight
Target
Average
Upper Control Limit (3s)
Lower Control Limit (-3s)

Quality in the Concrete Paving Process
Module 8- 55
Control Chart Basics
Recognizing assignable cause variability
B. Six consecutive test results are all increasing or decreasing
140.0
141.0
142.0
143.0
144.0
145.0
146.0
147.0
148.0
149.0
150.0
1-1
1-2
1-3
1-4
1-5
1-6
2-1
2-2
2-3
2-4
2-5
2-6
3-1
3-2
3-3
3-4
3-5
3-6
4-1
4-2
4-3
4-4
4-5
4-6
5-1
5-2
5-3
5-4
Un
it W
eig
ht
(lb
/ft3
)
Sample ID
Example Control Chart
Unit Weight
Target
Average
Upper Control Limit (3s)
Lower Control Limit (-3s)
Quality in the Concrete Paving Process
Module 8- 56
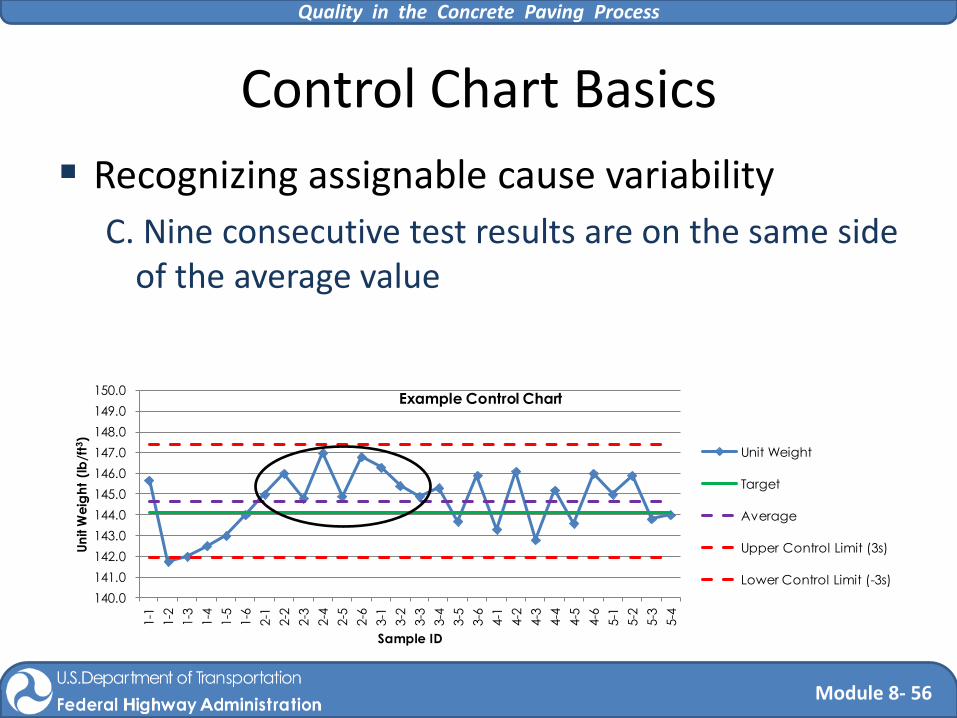
Control Chart Basics
Recognizing assignable cause variability
C. Nine consecutive test results are on the same side of the average value
140.0
141.0
142.0
143.0
144.0
145.0
146.0
147.0
148.0
149.0
150.0
1-1
1-2
1-3
1-4
1-5
1-6
2-1
2-2
2-3
2-4
2-5
2-6
3-1
3-2
3-3
3-4
3-5
3-6
4-1
4-2
4-3
4-4
4-5
4-6
5-1
5-2
5-3
5-4
Un
it W
eig
ht
(lb
/ft3
)
Sample ID
Example Control Chart
Unit Weight
Target
Average
Upper Control Limit (3s)
Lower Control Limit (-3s)

Quality in the Concrete Paving Process
Module 8- 57
Control Chart Basics
Recognizing assignable cause variability
D. Fourteen consecutive test results are alternating up and down
140.0
141.0
142.0
143.0
144.0
145.0
146.0
147.0
148.0
149.0
150.0
1-1
1-2
1-3
1-4
1-5
1-6
2-1
2-2
2-3
2-4
2-5
2-6
3-1
3-2
3-3
3-4
3-5
3-6
4-1
4-2
4-3
4-4
4-5
4-6
5-1
5-2
5-3
5-4
Un
it W
eig
ht
(lb
/ft3
)
Sample ID
Example Control Chart
Unit Weight
Target
Average
Upper Control Limit (3s)
Lower Control Limit (-3s)

Quality in the Concrete Paving Process
Module 8- 58
Control Charts
Control charts do not
• Eliminate variability
• Tell you where your problem lies
• Tell you how to correct the problem
Some control charts
• Help distinguish between the inherent chance causes of variability and assignable causes

Quality in the Concrete Paving Process
Module 8- 59
Limits
Air Content Ahead of the paver
Remove
Remove
Disincentive
Disincentive Specification Limit
Engineering Limit
Action Limit
Quality in the Concrete Paving Process
Module 8- 60
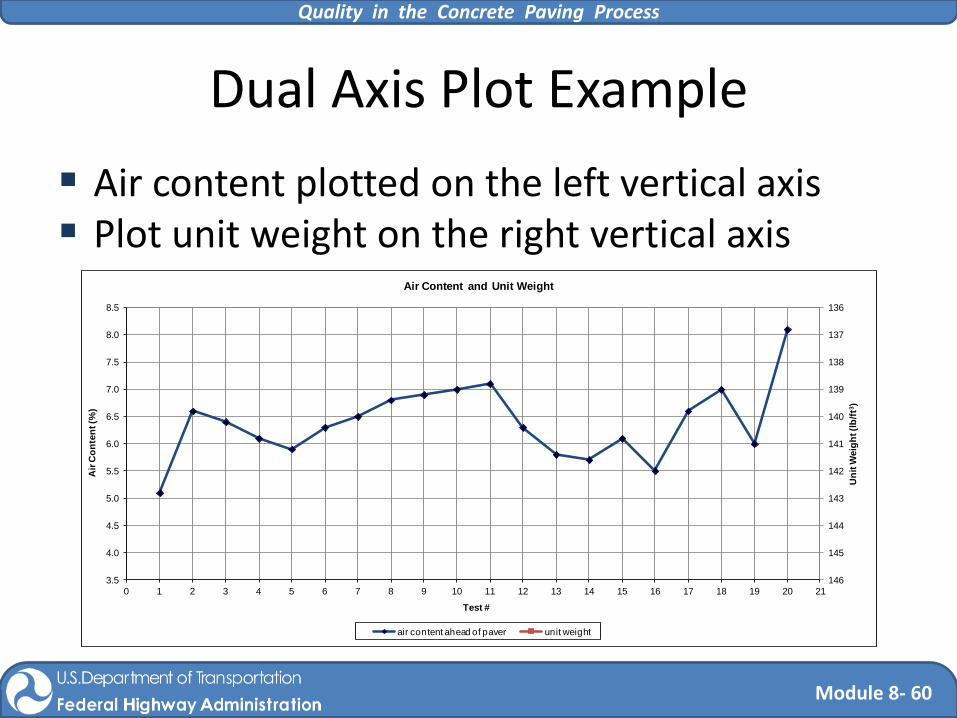
Dual Axis Plot Example
Air content plotted on the left vertical axis Plot unit weight on the right vertical axis
136
137
138
139
140
141
142
143
144
145
1463.5
4.0
4.5
5.0
5.5
6.0
6.5
7.0
7.5
8.0
8.5
0 1 2 3 4 5 6 7 8 9 10 11 12 13 14 15 16 17 18 19 20 21
Un
it W
eig
ht (l
b/f
t3)
Air
Co
nte
nt (%
)
Test #
Air Content and Unit Weight
air content ahead of paver unit weight
Quality in the Concrete Paving Process
Module 8- 61
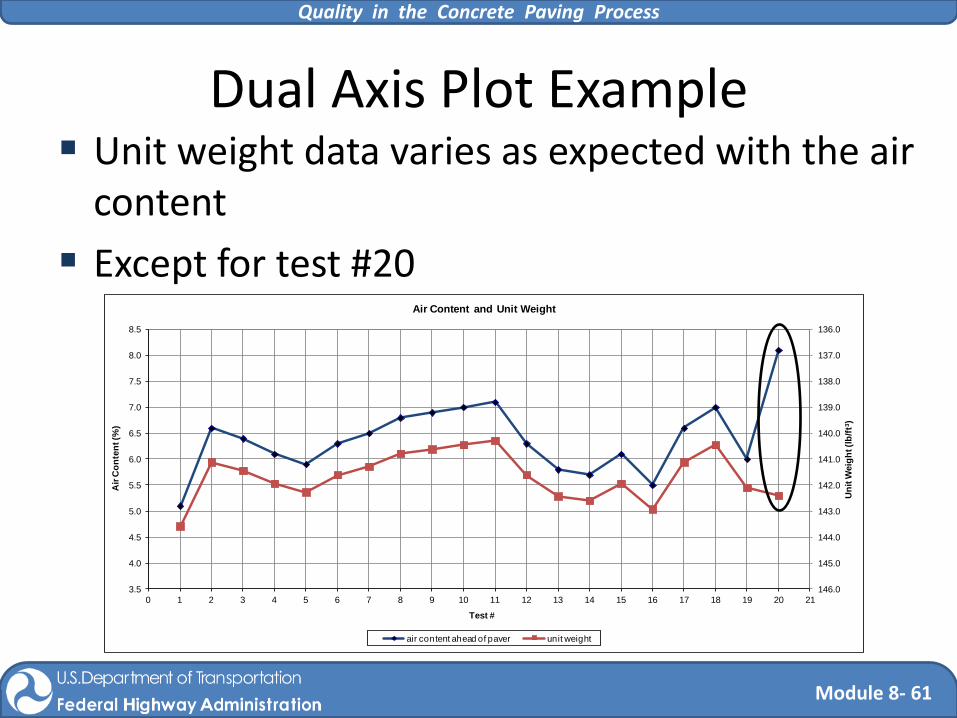
Dual Axis Plot Example Unit weight data varies as expected with the air
content
Except for test #20
136.0
137.0
138.0
139.0
140.0
141.0
142.0
143.0
144.0
145.0
146.03.5
4.0
4.5
5.0
5.5
6.0
6.5
7.0
7.5
8.0
8.5
0 1 2 3 4 5 6 7 8 9 10 11 12 13 14 15 16 17 18 19 20 21
Un
it W
eig
ht (l
b/f
t3)
Air
Co
nte
nt (%
)
Test #
Air Content and Unit Weight
air content ahead of paver unit weight
Quality in the Concrete Paving Process
Module 2 Module 8 - 62
Quality in Field Practice

Quality in the Concrete Paving Process
Module 8- 63
Data from Arizona DOT Project Mobile Concrete Lab
• Tested from paving on L303 section between Thomas to Camelback
• Testing from July 9 to July 19 • This Module presents test data • Review principles discussed yesterday and this
morning
Agency Acceptance Goal • Does the concrete match the mix design?
QC Goal • Has the concrete changed?

Quality in the Concrete Paving Process
Module 8- 64
Concrete Mixture Mixture Design
• Cement Type II (low alkali), Class F Fly Ash • Night time paving • High temperatures (chillers to cool concrete)
Total Cementitious Content: 564lbs
Fly Ash: 20%

Quality in the Concrete Paving Process
Module 8- 65
Data from an Example Project
Date Sample Day Sample IDs
9/24/2013 1 1-1, 1-2, 1-3, 1-4
9/25/2013 2 2-1, 2-2, 2-3, 2-4, 2-5
9/26/2013 3 3-1, 3-2, 3-3, 3-4, 3-5
9/27/2013 4 4-1, 4-2, 4-3, 4-4
9/28/2013 5 5-1, 5-2, 5-3

Quality in the Concrete Paving Process
Module 8- 66
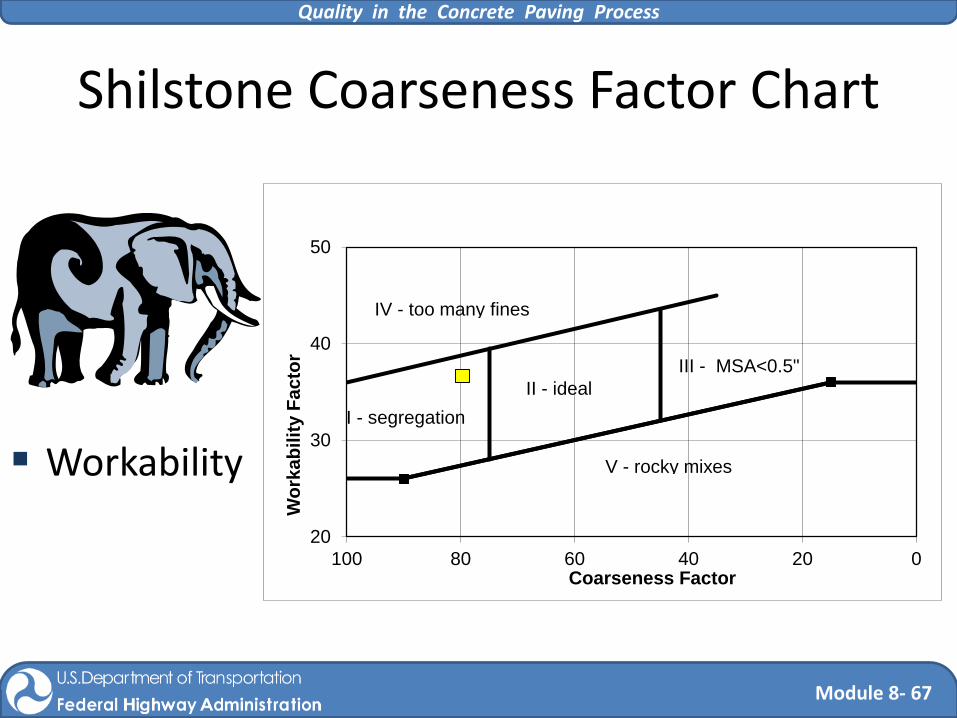
Gradation
Optimized combined gradation • Workability • Durability • Dimensional stability
Quality in the Concrete Paving Process
Module 8- 67
Shilstone Coarseness Factor Chart
20
30
40
50
020406080100
Wo
rkab
ilit
y F
acto
r
Coarseness Factor
I - segregation
II - ideal
V - rocky mixes
III - MSA<0.5"
IV - too many fines
Workability
Quality in the Concrete Paving Process
Module 8- 68
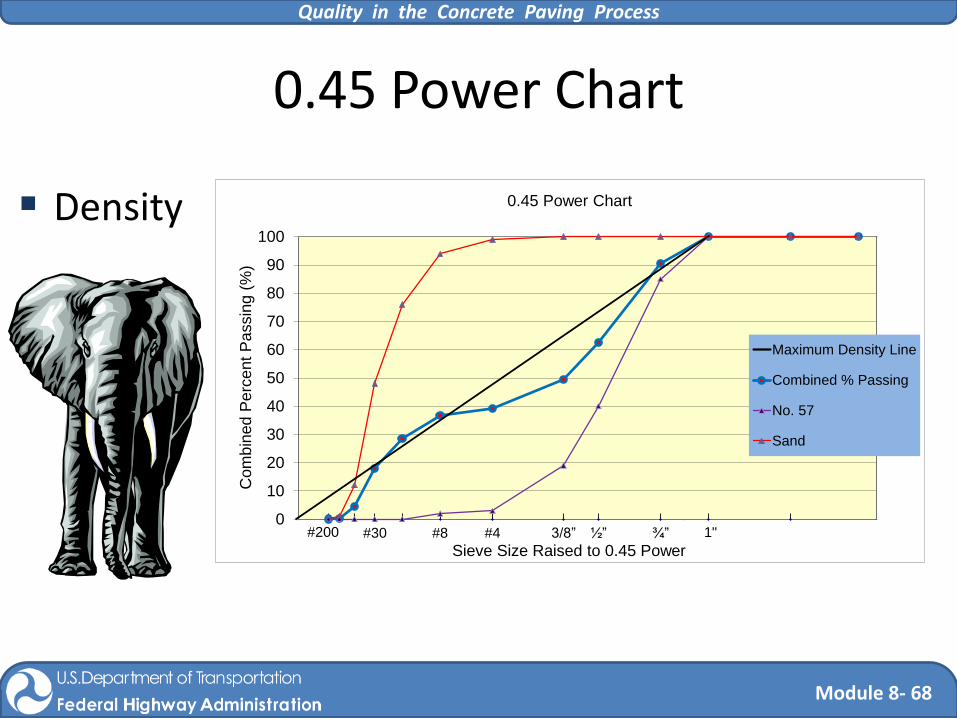
0.45 Power Chart
¾”½”3/8”#4#8#30 1"#200
0.0
1.0
0
10
20
30
40
50
60
70
80
90
100
0.0 4.0
Com
bin
ed P
erc
ent
Passin
g (
%)
Sieve Size Raised to 0.45 Power
0.45 Power Chart
Maximum Density Line
Combined % Passing
No. 57
Sand
Density

Quality in the Concrete Paving Process
Module 8- 69
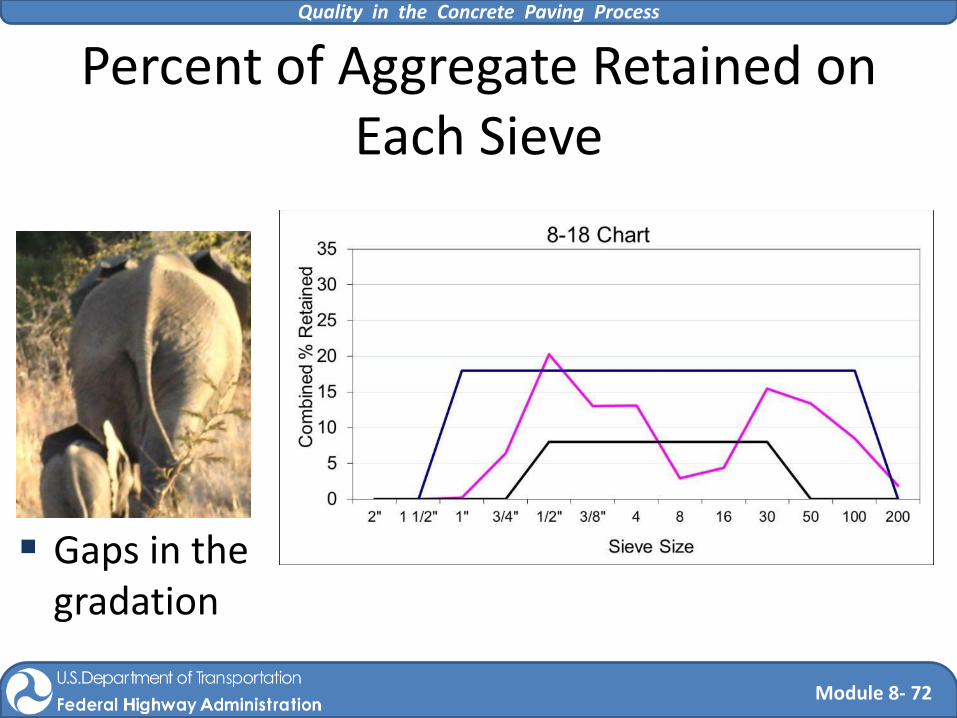
Percent of Aggregate Retained on Each Sieve
0
5
10
15
20
25
30
35
2" 1 1/2" 1" 3/4" 1/2" 3/8" 4 8 16 30 50 100 200
Co
mb
ined
% R
eta
ined
Sieve Size
8-18 Chart
Gaps in the gradation
Quality in the Concrete Paving Process
Module 8- 70
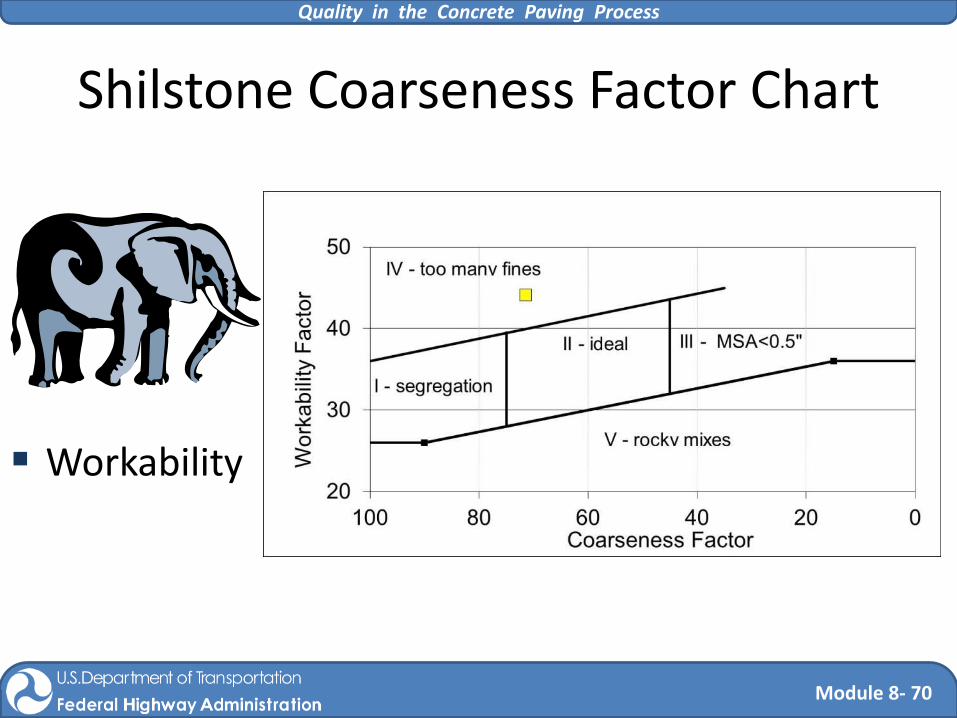
Shilstone Coarseness Factor Chart
Workability
Note: From one sample tested by FDOT

Quality in the Concrete Paving Process
Module 8- 71
0.45 Power Chart
Density
Quality in the Concrete Paving Process
Module 8- 72
Percent of Aggregate Retained on Each Sieve
Gaps in the gradation

Quality in the Concrete Paving Process
Module 8- 73
Shilstone Coarseness Factor Chart
Workability 20
30
40
50
020406080100
Work
abili
ty F
acto
r
Coarseness Factor
I - segregationII - ideal
V - rocky mixes
III - MSA<0.5"
IV - too many fines
Quality in the Concrete Paving Process
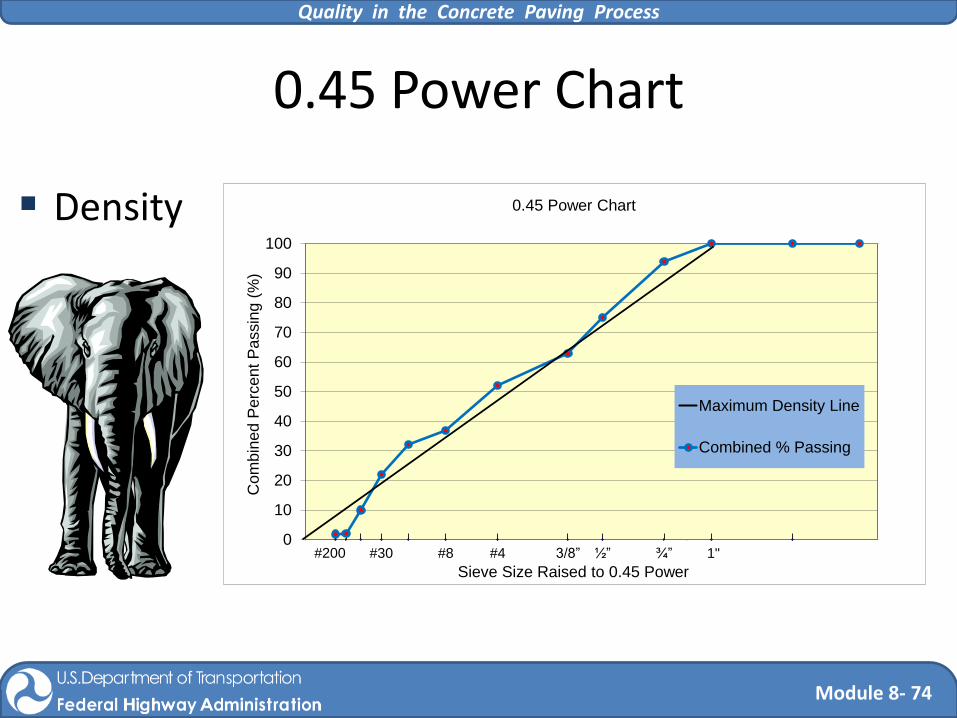
Module 8- 74
0.45 Power Chart
Density
¾”½”3/8”#4#8#30 1"#200
0.0
1.0
0
10
20
30
40
50
60
70
80
90
100
0.0 4.0
Com
bin
ed P
erc
ent
Passin
g (
%)
Sieve Size Raised to 0.45 Power
0.45 Power Chart
Maximum Density Line
Combined % Passing
Quality in the Concrete Paving Process
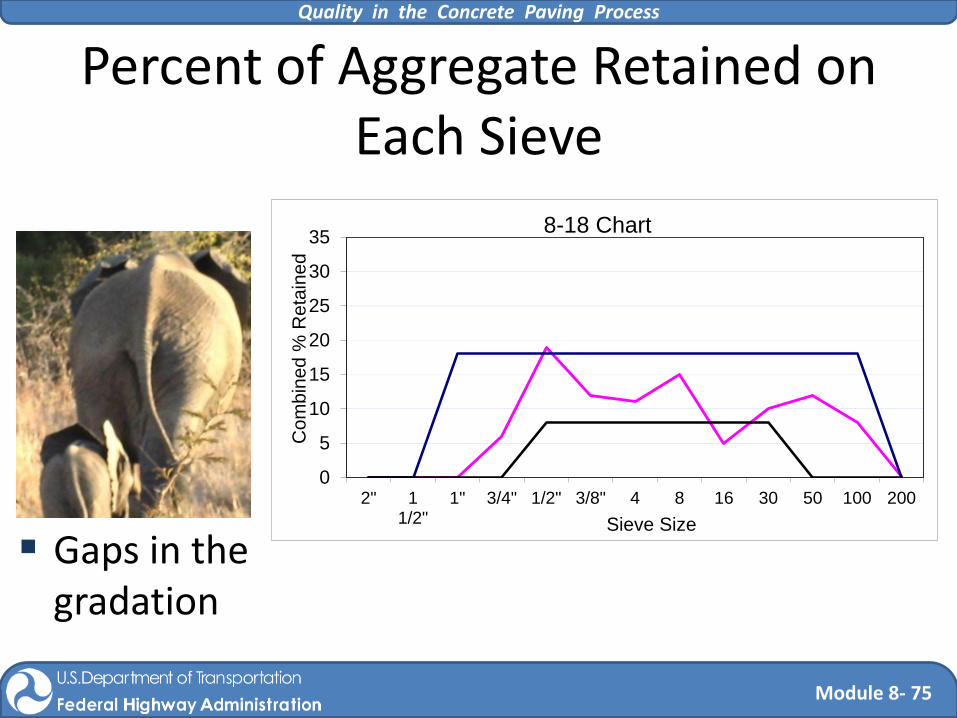
Module 8- 75
Percent of Aggregate Retained on Each Sieve
Gaps in the gradation
0
5
10
15
20
25
30
35
2" 11/2"
1" 3/4" 1/2" 3/8" 4 8 16 30 50 100 200
Co
mb
ine
d %
Re
tain
ed
Sieve Size
8-18 Chart
Quality in the Concrete Paving Process
Module 8- 76
Monitor Concrete Consistency
Look for changes Use different tests to help identify the source
of the change • Water • Air • Temperature • Cementitious
Establish limits of change
Quality in the Concrete Paving Process
Module 8- 77
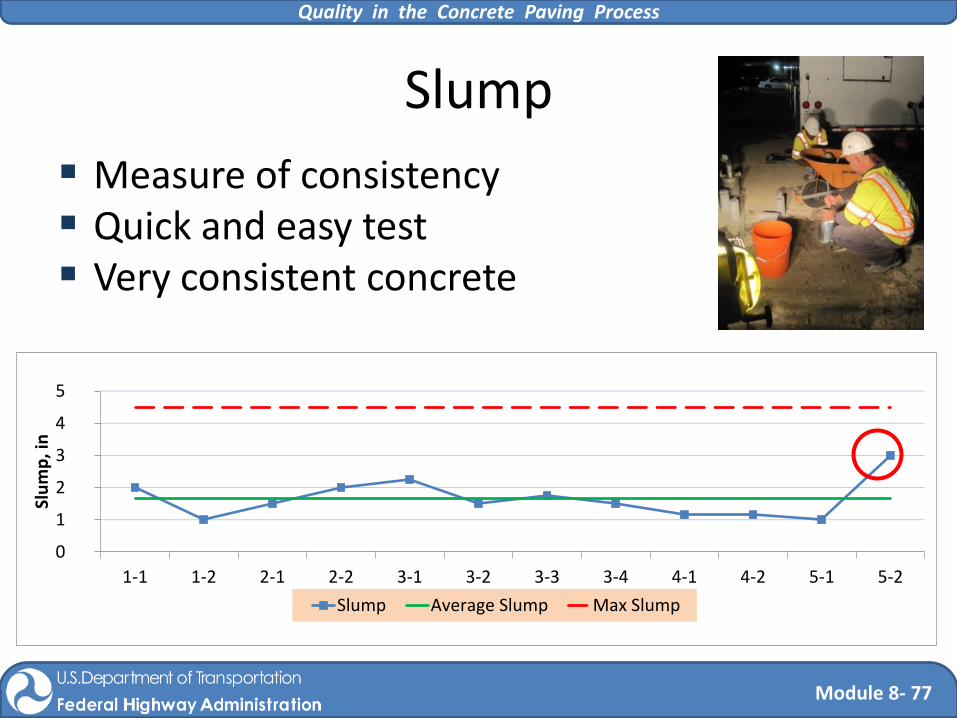
Slump
Measure of consistency Quick and easy test Very consistent concrete
0
1
2
3
4
5
1-1 1-2 2-1 2-2 3-1 3-2 3-3 3-4 4-1 4-2 5-1 5-2
Slu
mp
, in
Slump Average Slump Max Slump
Quality in the Concrete Paving Process
Module 8- 78
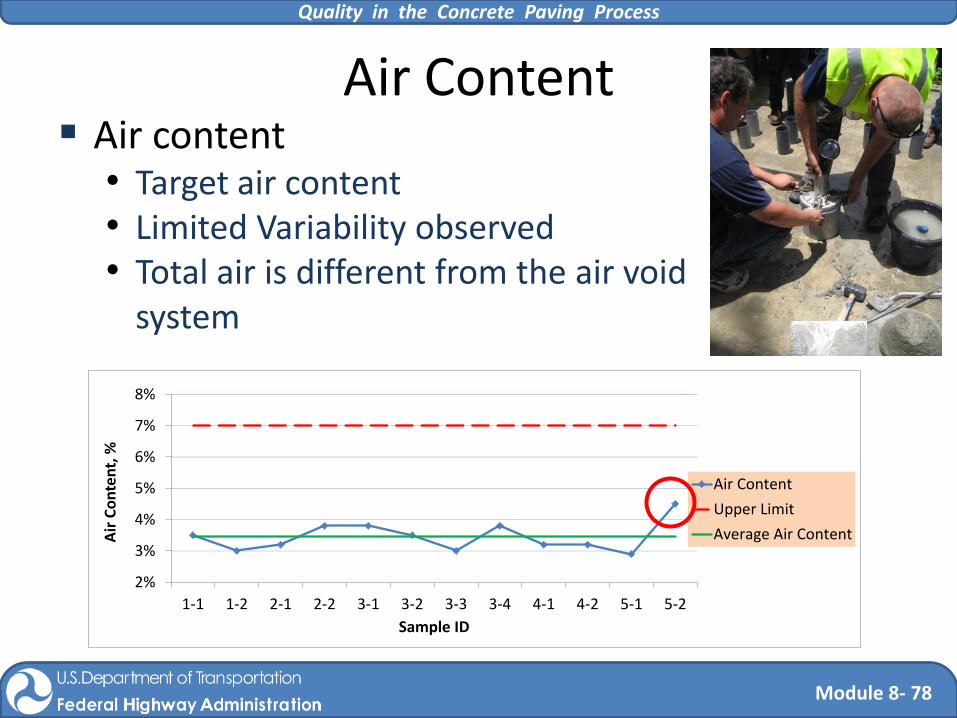
Air content • Target air content • Limited Variability observed • Total air is different from the air void
system
Air Content
2%
3%
4%
5%
6%
7%
8%
1-1 1-2 2-1 2-2 3-1 3-2 3-3 3-4 4-1 4-2 5-1 5-2
Air
Co
nte
nt,
%
Sample ID
Air Content
Upper Limit
Average Air Content

Quality in the Concrete Paving Process
Module 8- 79
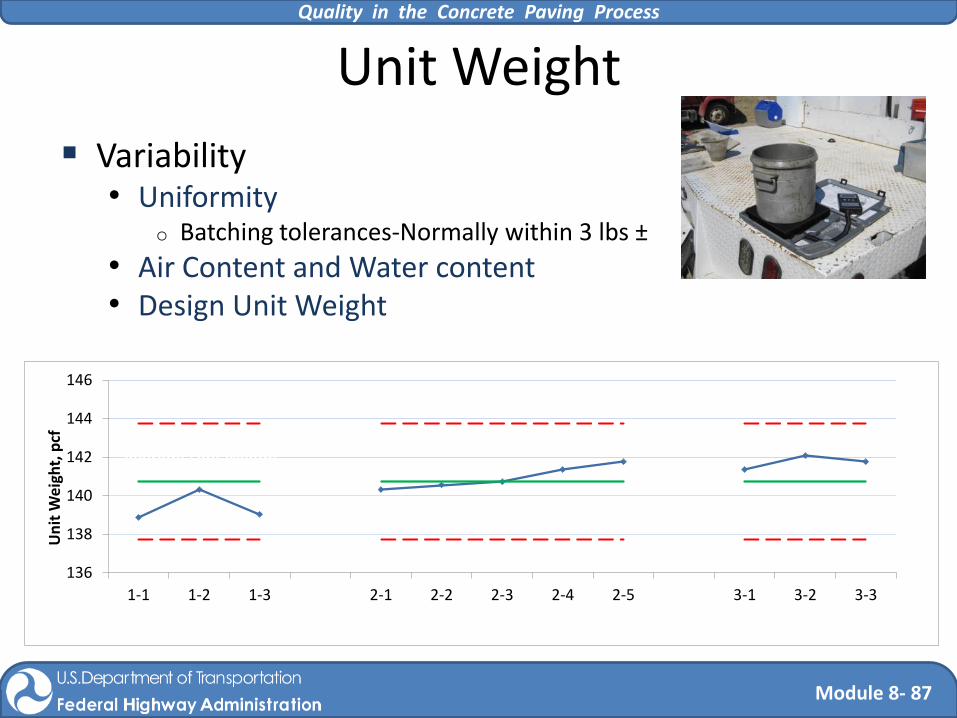
Unit Weight Variability
• Uniformity o Batching tolerances
• Air and water content • Simple and easy to run
143
144
145
146
147
148
149
150
151
1-1 1-2 2-1 2-2 3-1 3-2 3-3 3-4 4-1 4-2 5-2
Un
it W
eig
ht,
pcf
Unit Weight, pcf Average Lower Limit Upper Limit
Quality in the Concrete Paving Process
Module 8- 80
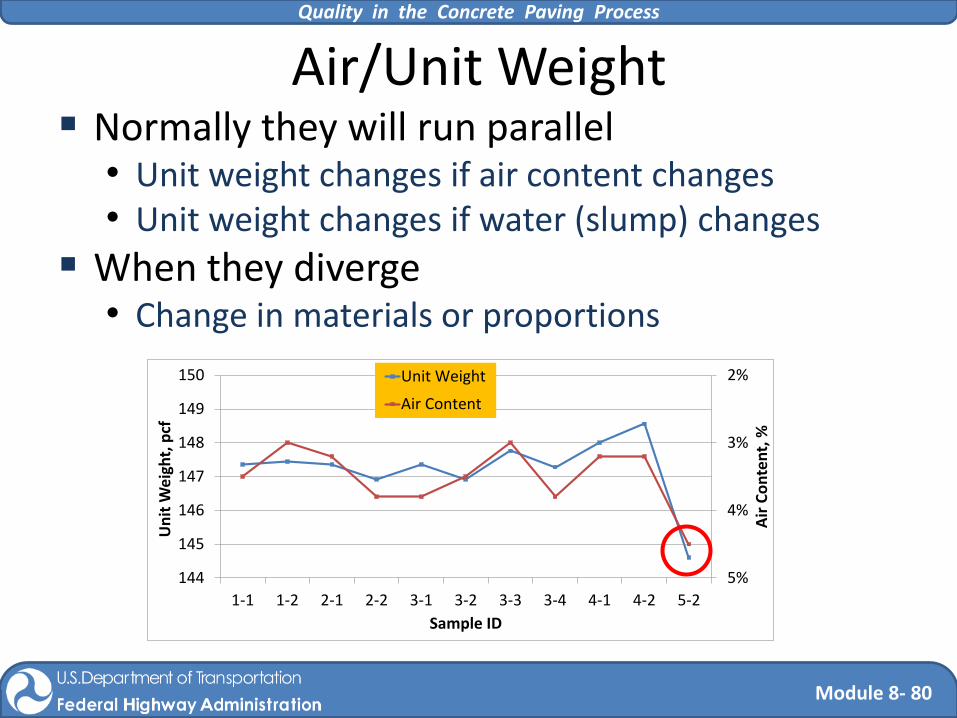
Air/Unit Weight Normally they will run parallel
• Unit weight changes if air content changes • Unit weight changes if water (slump) changes
When they diverge • Change in materials or proportions
2%
3%
4%
5%144
145
146
147
148
149
150
1-1 1-2 2-1 2-2 3-1 3-2 3-3 3-4 4-1 4-2 5-2
Air
Co
nte
nt,
%
Un
it W
eig
ht,
pcf
Sample ID
Unit Weight
Air Content

Quality in the Concrete Paving Process
Module 8- 81
MCL Observations
Air content • Variability observed
Section 1 Section 2

Quality in the Concrete Paving Process
Module 8- 82
MCL Observations
Unit weight • Variability observed
Section 2 Section 1

Quality in the Concrete Paving Process
Module 8- 83
MCL Observations
Air content and unit weight • Vary together • Unit weight changes appear to be from air content
only (likely changes in water)

Quality in the Concrete Paving Process
Module 8- 84
Slump
Measure of consistency Quick and easy Used for QC
Slump
Measurements at
the plant
0
1/2
1
1 1/2
2
2 1/2
0 7 16 24 34
Slu
mp
, In
che
s
Time, Minutes

Quality in the Concrete Paving Process
Module 8- 85
Slump Measure of consistency Quick and easy Used for QC
Slump
Measurements at
the plant
0
1/2
1
1 1/2
2
2 1/2
3
0 7 12 20 29 36
Slu
mp
, In
che
s
Time, Minutes

Quality in the Concrete Paving Process
Module 8- 86
3%
4%
5%
6%
7%
8%
1-1 1-2 1-3 2-1 2-2 2-3 2-4 2-5 3-1 3-2 3-3
Air
Co
nte
nt,
%
Sample ID
Air content • Target air content • Total air is different from the air void system
Air Content
Average
Air Content
Quality in the Concrete Paving Process
Module 8- 87
136
138
140
142
144
146
1-1 1-2 1-3 2-1 2-2 2-3 2-4 2-5 3-1 3-2 3-3
Un
it W
eig
ht,
pcf
Unit Weight
Variability • Uniformity
o Batching tolerances-Normally within 3 lbs ±
• Air Content and Water content • Design Unit Weight
Average Unit Weight

Quality in the Concrete Paving Process
Module 8- 88
Air/Unit Weight
Normally they will run parallel • Unit weight changes if air content changes • Unit weight changes if water (slump) changes
When they diverge • Change in materials or proportions
3%
4%
5%
6%
7%
8%
9%137
138
139
140
141
142
143
1-1 1-2 1-3 2-1 2-2 2-3 2-4 2-5 3-1 3-2 3-3
Air
Co
nte
nt,
%
Un
it W
eig
ht,
pcf
Sample ID
Unit Weight
Air Content

Quality in the Concrete Paving Process
Module 8- 89
Unit Weight vs. Air Content Before Paver
Contractor QC Data
Quality in the Concrete Paving Process
Module 2 Module 8 - 90
Quality in the Concrete Paving Process
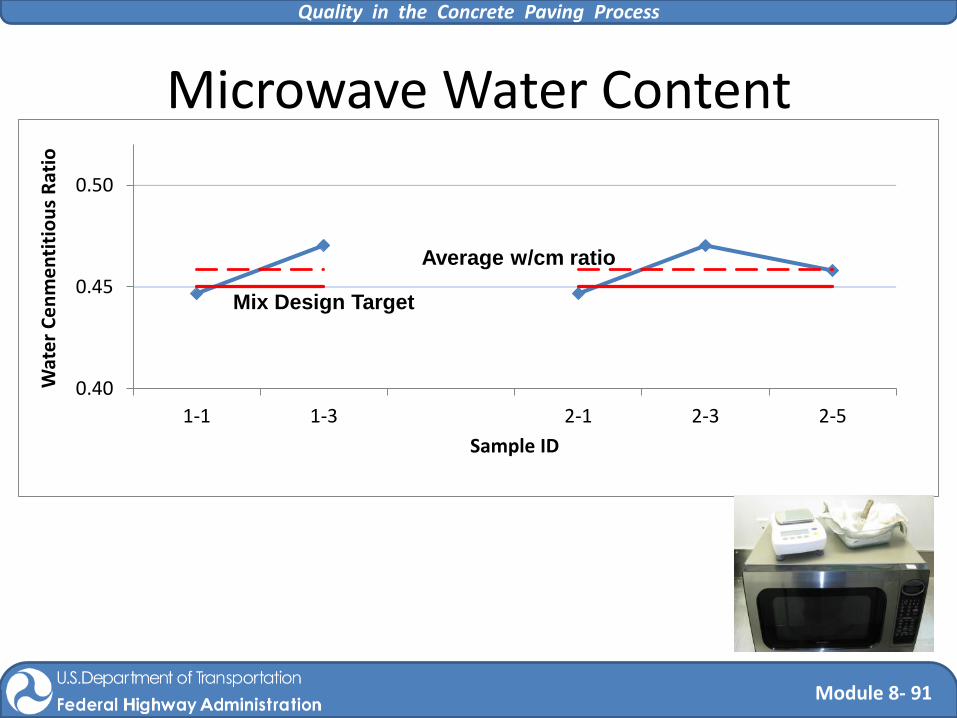
Module 8- 91
0.40
0.45
0.50
1-1 1-3 2-1 2-3 2-5
Wat
er
Ce
nm
en
titi
ou
s R
atio
Sample ID
Microwave Water Content
Mix Design Target
Average w/cm ratio
Quality in the Concrete Paving Process
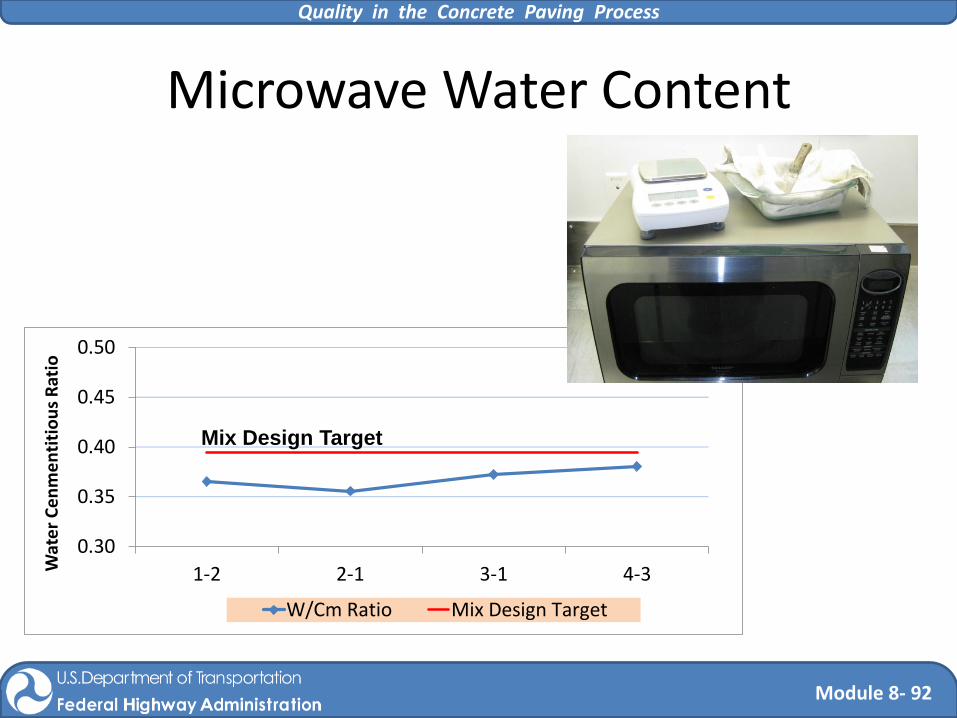
Module 8- 92
0.30
0.35
0.40
0.45
0.50
1-2 2-1 3-1 4-3Wat
er
Ce
nm
en
titi
ou
s R
atio
W/Cm Ratio Mix Design Target
Microwave Water Content
Mix Design Target
Quality in the Concrete Paving Process
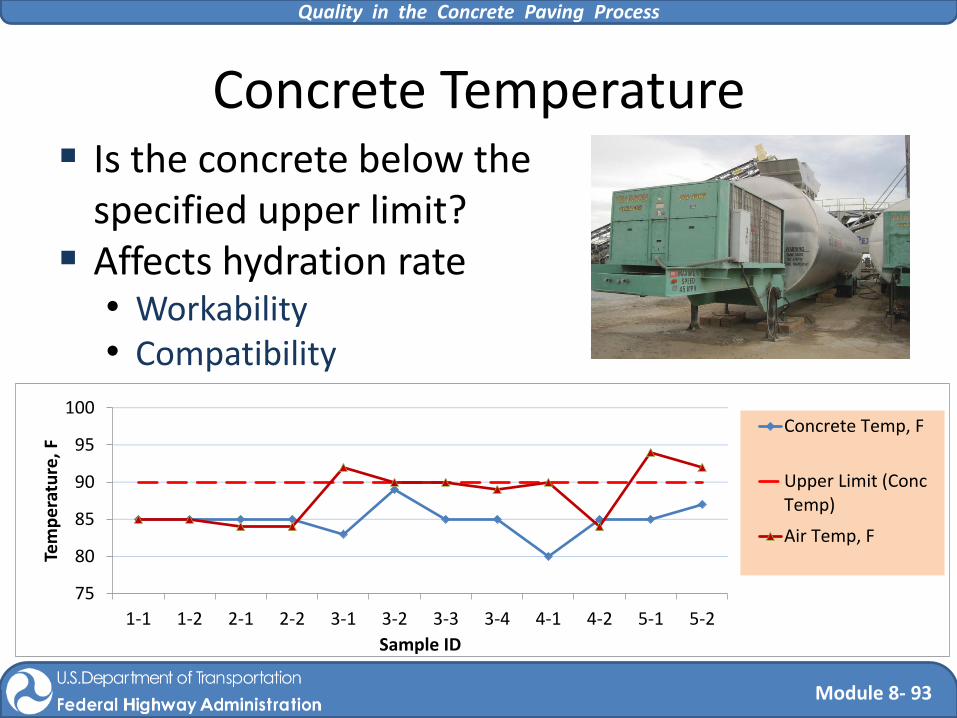
Module 8- 93
Concrete Temperature
75
80
85
90
95
100
1-1 1-2 2-1 2-2 3-1 3-2 3-3 3-4 4-1 4-2 5-1 5-2
Tem
pe
ratu
re,
F
Sample ID
Concrete Temp, F
Upper Limit (ConcTemp)
Air Temp, F
Is the concrete below the specified upper limit?
Affects hydration rate • Workability • Compatibility
Quality in the Concrete Paving Process
Module 8- 94
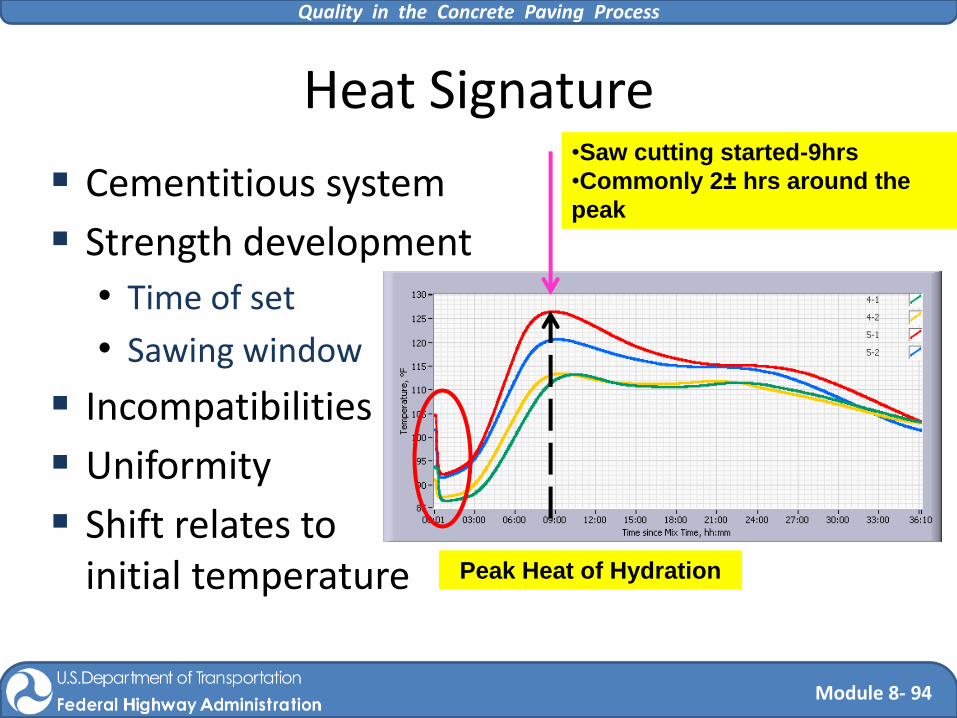
Heat Signature
Cementitious system
Strength development
• Time of set
• Sawing window
Incompatibilities
Uniformity
Shift relates to initial temperature
Peak Heat of Hydration
•Saw cutting started-9hrs
•Commonly 2± hrs around the
peak

Quality in the Concrete Paving Process
Module 8- 95
Heat Signature
Peak: About 13 hours

Quality in the Concrete Paving Process
Module 8- 96
Heat Signature Sample Day 1 & 4 Separated by Sample
Days
AM PM
Quality in the Concrete Paving Process
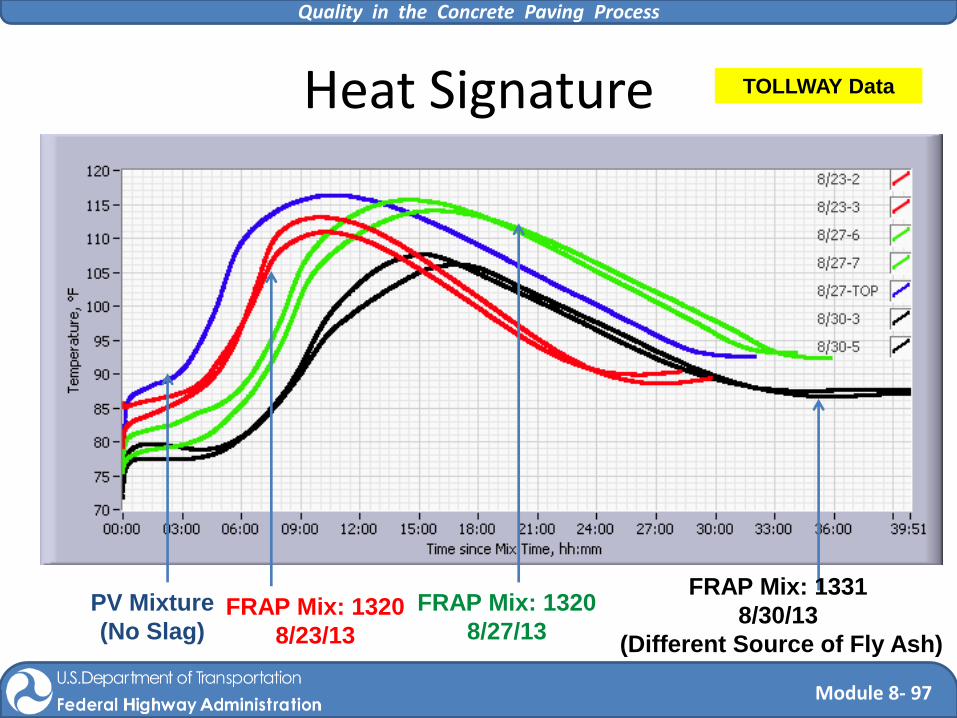
Module 8- 97
Heat Signature TOLLWAY Data
FRAP Mix: 1331
8/30/13
(Different Source of Fly Ash)
PV Mixture
(No Slag) FRAP Mix: 1320
8/23/13
FRAP Mix: 1320
8/27/13

Quality in the Concrete Paving Process
Module 8- 98
Hardened Concrete Properties
Strength • Not a QC test • Not real time
Permeability • Tremendous affect on the life of the pavement
CTE • Very important in the pavement design

Quality in the Concrete Paving Process
Module 8- 99
Compressive Strength Contractors Data Concrete or testing variability?
2500
3000
3500
4000
4500
5000
5500
6000
6500
7000
1 2 3 4 5 6 7 8 9 10111213141516171819202122232425
Co
mp
ress
ive
Str
en
gth
, P
SI
Sample ID
28 Day 28 Day Strength Requirement Average
143
144
145
146
147
148
149
150
151
1-1 1-2 2-1 2-2 3-1 3-2 3-3 3-4 4-1 4-2 5-2
Un
it W
eig
ht,
pcf
Unit Weight, pcf Average Lower Limit Upper Limit

Quality in the Concrete Paving Process
Module 8- 100
Compressive Strength
Does air content match strength changes?
2000
3000
4000
5000
6000
7000
8000
1-1(5/14/13)
2-1(5/15/13)
3-1(5/16/13)
4-1(5/20/13)
Co
mp
ress
ive
Str
en
gth
, P
SI
7 Day 28 Day 56 Day
28 Day StrengthRequirement
5.2% 5.1% 6.0% 5.0%
Air
Content
Quality in the Concrete Paving Process
Module 8- 101
2000
2500
3000
3500
4000
4500
5000
5500
6000
6500
7000
1-1 2-1 3-1
Co
mp
ress
ive
Str
en
gth
, P
SI
Sample ID
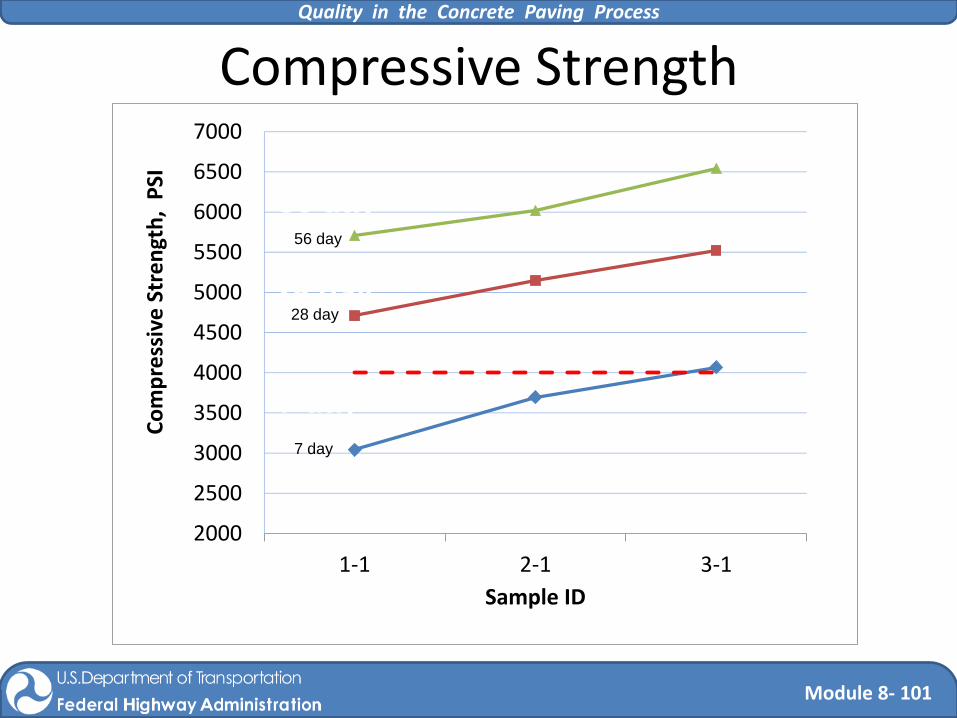
Compressive Strength
56 day
28 day
7 day
28-day Requirement
56 day
28 day
7 day
Quality in the Concrete Paving Process
Module 8- 102
2000
2500
3000
3500
4000
4500
5000
5500
6000
6500
7000
1-1 2-1 3-1 4-1
Co
mp
ress
ive
Str
en
gth
, P
SI
Sample ID
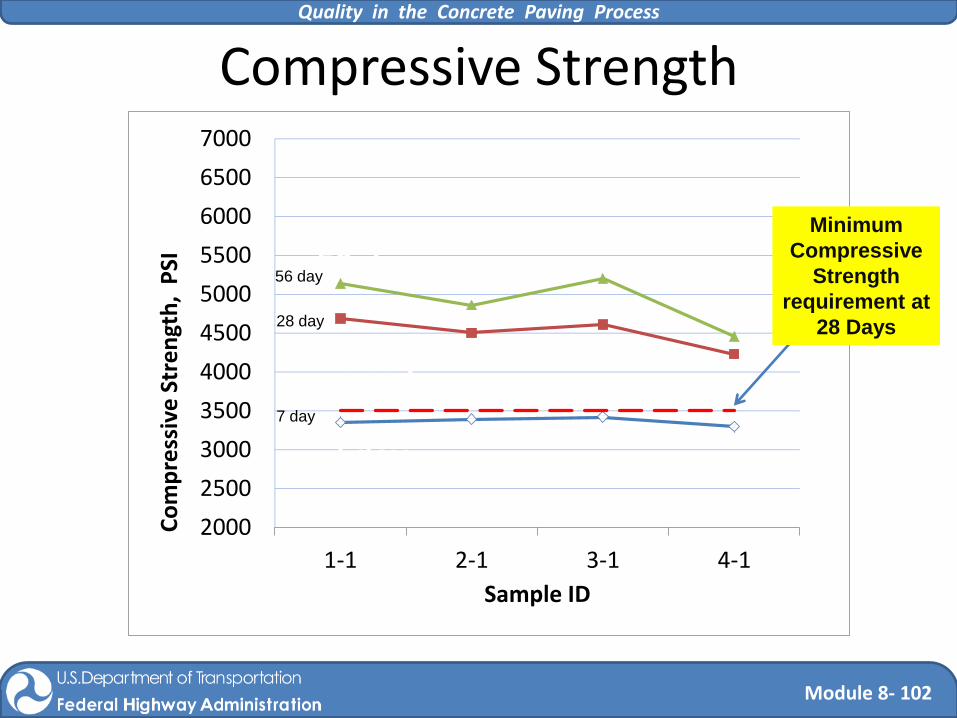
Compressive Strength
Minimum
Compressive
Strength
requirement at
28 Days
56 day
28 day
7 day
28 day
56 day
7 day

Quality in the Concrete Paving Process
Module 8- 103
Compressive Strength Would less strength actually be better?
0
1000
2000
3000
4000
5000
6000
7000
8000
0 7 Day 28 Day 56 Day
Co
mp
ress
ive
Str
en
gth
, P
SI
Sample Age
1-1 (5/14/13)
2-1 (5/15/13)
3-1 (5/16/13)
4-1 (5/20/13)
28 Day StrengthRequirement

Quality in the Concrete Paving Process
Module 8- 104
Compressive Strength
y = 0.0036x + 128.29R² = 0.7682
y = 0.003x + 127.97R² = 0.893
141142143144145146147148149
3500 4500 5500 6500 7500 8500
Un
it W
eig
ht,
pcf
Compressive Strength, psi
y = -1E-05x + 0.1142R² = 0.6272
y = -8E-06x + 0.1005R² = 0.4239
4.0%
4.5%
5.0%
5.5%
6.0%
6.5%
3500 4500 5500 6500 7500 8500
Air
Co
nte
nt,
%
Compressive Strength, psi
y = -0.0008x + 5.3563R² = 0.9474
y = -0.0006x + 4.9034R² = 0.8317
0.5
0.75
1
1.25
1.5
1.75
2
3500 4500 5500 6500 7500 8500
Slu
mp
, in
Compressive Strength, psi
7 Day Compressive Strengths
28 Day Compressive Strengths

Quality in the Concrete Paving Process
Module 8- 105
Permeability Surface resistivity Test
• Easy and quick test
Rapid Chloride Permeability Test • Takes more time and effort- old stand by
0.0
4.0
8.0
12.0
16.0
20.0
24.0
1-1-1 1-1-2 2-1-1 2-1-2 3-1-1 3-1-2 3-3-1 3-3-2 3-4-1 3-4-2
Surf
ace
Re
sist
ivit
y, K
Oh
m-c
m
7 Days
28 Days
56 Days
Moderate
High
Low

Quality in the Concrete Paving Process
Module 8- 106
Permeability Surface resistivity Test
• Easy and quick test
Rapid Chloride Permeability Test • Takes more time and effort- old stand by
y = 12270x-0.836
R² = 0.7159
0
5
10
15
20
25
30
35
1000 1500 2000 2500 3000 3500 4000 4500
Surf
ace
Re
sist
ivit
y,KO
hm
-cm
RCPT, Columbs
HighModerateLow
Low
Moderate
High

Quality in the Concrete Paving Process
Module 8- 107
Permeability Surface Resistivity Test
• Easy and quick test
Rapid Chloride Penetrability Test • Takes more time and effort- old stand by
0
4
8
12
16
20
24
28
32
36
40
1-1 1-3 1-7 2-6 2-11 3-3 3-5 2-10 PV
Surf
ace
Re
sist
ivit
y, K
Oh
m-c
m
at 14 Days
at 28 Days
at 56 Days
Moderate
High
Low
FRAP Mixture PV Mixture
No Slag in
PV Mixture

Quality in the Concrete Paving Process
Module 8- 108
0
5
10
15
20
25
30
35
40
1-1 1-4 2-1 2-4 3-1 3-3 3-5 4-1 4-3 5-1 5-3
Avg
. Su
rfac
e R
esi
stiv
ity
(kΩ
-cm
)
FHWA7 Day 28 Day 56 Day
Moderate
High
Low
V. Low
Permeability Surface resistivity Test
• Easy and quick test
Rapid Chloride Permeability Test • Takes more time and effort- old stand by
Cured in lime water

Quality in the Concrete Paving Process
Module 8- 109
0
5
10
15
20
25
30
35
40
1-1 1-4 2-1 2-4 3-1 3-3 3-5 4-1 4-3
Avg
. Su
rfac
e R
esi
stiv
ity
(kΩ
-cm
)
MDOT28 Day 56 Day
Moderate
High
Low
V. Low
Permeability Surface resistivity Test
• Easy and quick test
Rapid Chloride Permeability Test • Takes more time and effort- old stand by
Cured in moist room

Quality in the Concrete Paving Process
Module 8- 110
Heat Signature vs. Surface Resistivity
y = 1351.9e-0.046x
R² = 0.9141
5.0
7.0
9.0
11.0
13.0
15.0
17.0
19.0
21.0
23.0
25.0
90 92 94 96 98 100 102 104 106
56
Day
Su
rfac
e R
esi
stiv
ity,
Oh
m-c
m
Maximum Temperature of the Heat Signature Curve, F

Quality in the Concrete Paving Process
Module 8- 111
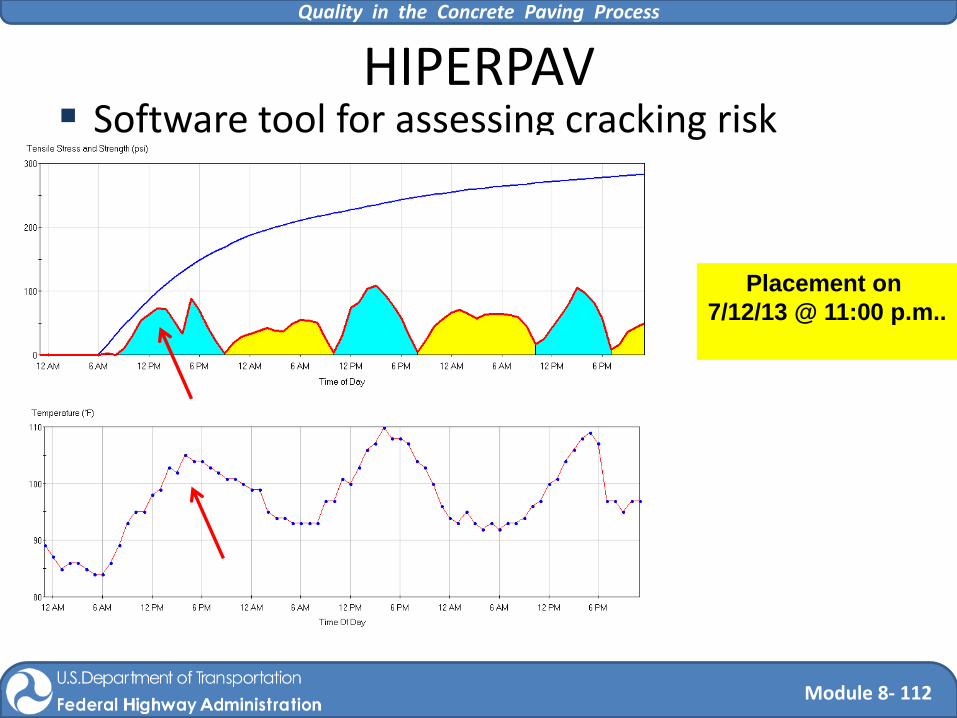
Construction Monitoring/Acceptance HIPERPAV
• Assess early age cracking potential
Maturity • Measures real world conditions • For opening strength only • Not 28 day strength
MIT-SCAN-2 • Dowel bar location and alignment
MIT-SCAN-T2 • Pavement thickness
Quality in the Concrete Paving Process
Module 8- 112
HIPERPAV Software tool for assessing cracking risk
Placement on
7/12/13 @ 11:00 p.m..

Quality in the Concrete Paving Process
Module 8- 113
Field Maturity
Quality in the Concrete Paving Process
Module 8- 114
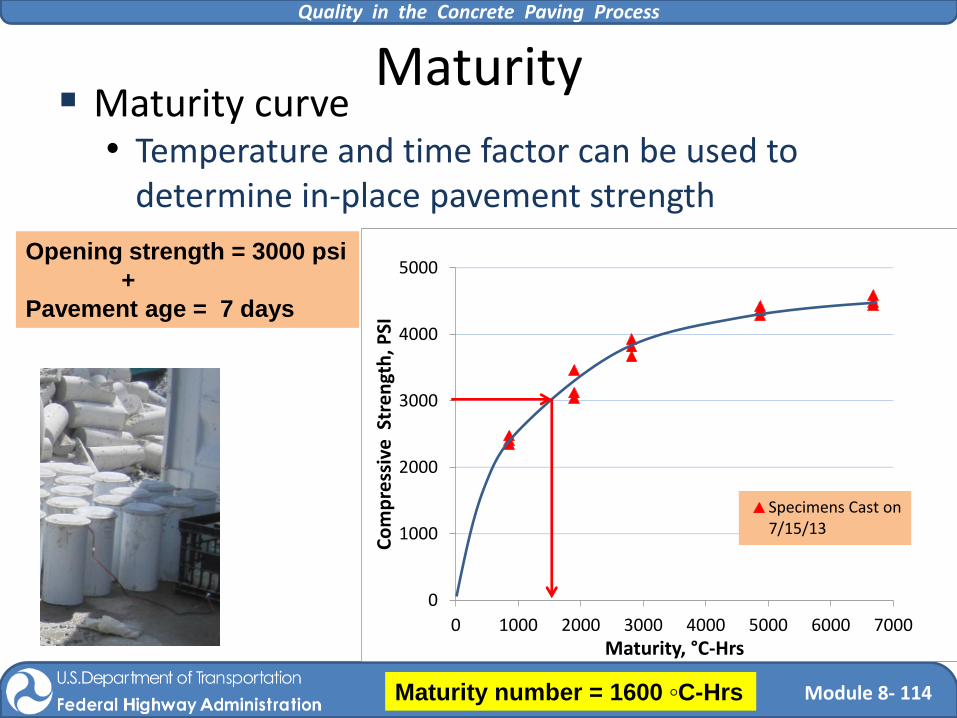
0
1000
2000
3000
4000
5000
0 1000 2000 3000 4000 5000 6000 7000
Co
mp
ress
ive
Str
en
gth
, PSI
Maturity, °C-Hrs
Specimens Cast on7/15/13
Maturity Maturity curve
• Temperature and time factor can be used to determine in-place pavement strength
Opening strength = 3000 psi
+
Pavement age = 7 days
Maturity number = 1600 C-Hrs
Quality in the Concrete Paving Process
Module 8- 115
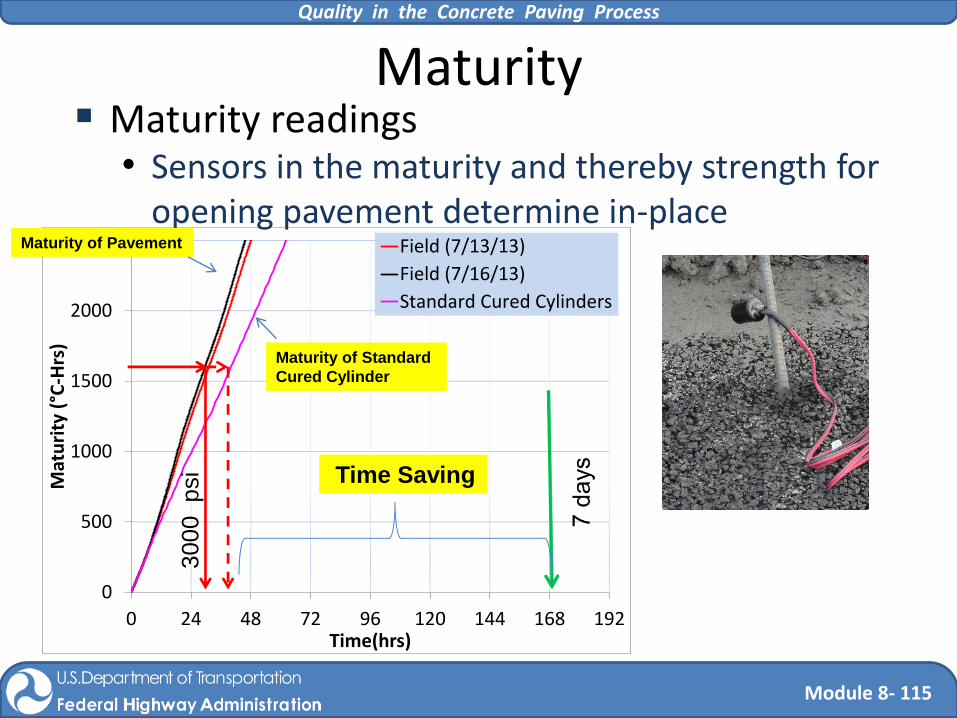
0
500
1000
1500
2000
2500
0 24 48 72 96 120 144 168 192
Mat
uri
ty (
°C-H
rs)
Time(hrs)
Field (7/13/13)
Field (7/16/13)
Standard Cured Cylinders
Maturity Maturity readings
• Sensors in the maturity and thereby strength for opening pavement determine in-place
Time Saving
Maturity of Pavement
Maturity of Standard
Cured Cylinder
3000
psi
Quality in the Concrete Paving Process
Module 8- 116
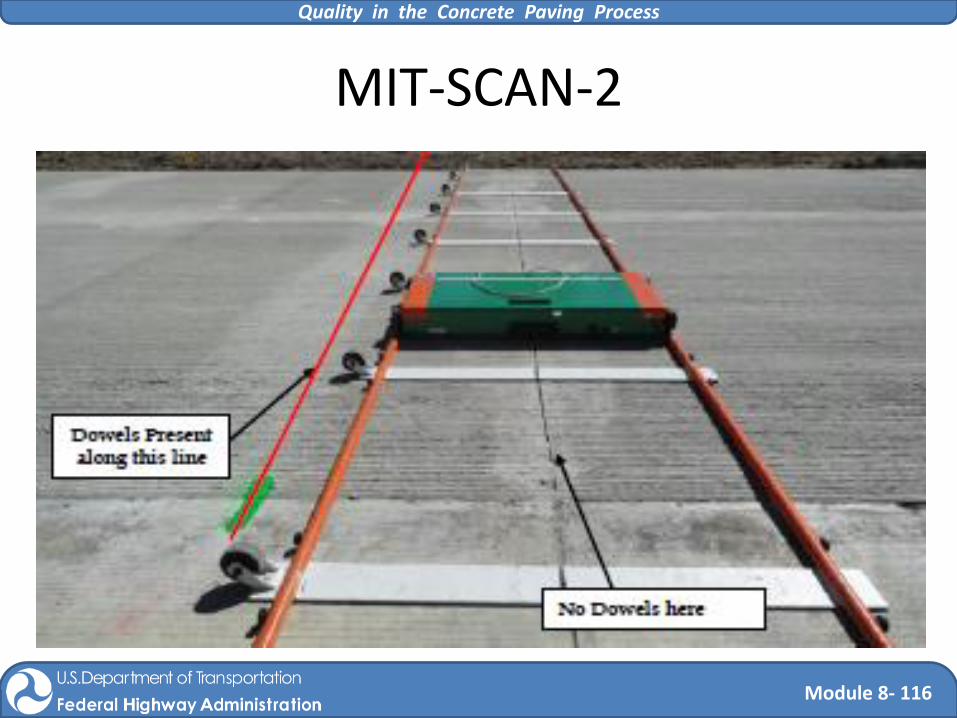
MIT-SCAN-2

Quality in the Concrete Paving Process
Module 8- 117
Identification of Problems Dowel bar inserter
MIT SCAN 2 o 25 joints scanned (both lanes) o 6 of 25 joints have no dowels o 3 of the 6 joints had dowels approximately 2 ½’ away
from the joint Tie bar

Quality in the Concrete Paving Process
Module 8- 118
MIT-SCAN-2 27 Joints Tested No alignment issues Center
Line
Edge of
Pavement

Quality in the Concrete Paving Process
Module 8- 119
MIT-SCAN-2
948+35 948+50 948+65 948+80 948+95
Cut Cut Cut

Quality in the Concrete Paving Process
Module 8- 120
MIT-SCAN-2
948+35 948+50 948+70 949+10 949+25
Cut
Quality in the Concrete Paving Process
Module 8- 121
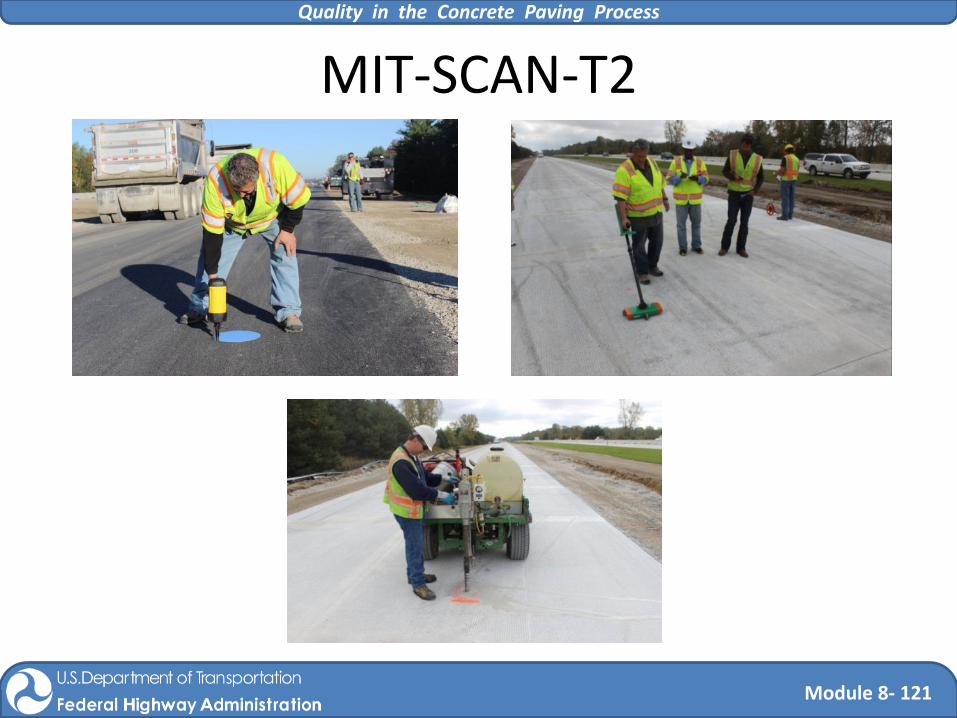
MIT-SCAN-T2

Quality in the Concrete Paving Process
Module 8- 122
MIT-SCAN-T2 Thickness
• Design thickness = 9.0” • Average thickness (T2)= 9.7”
8.08.38.58.89.09.39.59.8
10.010.310.510.811.0
1 2 3 4 5 6 7 8 9 10 11
Pav
em
en
t Th
ickn
ess
, In
che
s
Pavement Thickness Average Thickness Design Thickness
Quality in the Concrete Paving Process
Module 8- 123
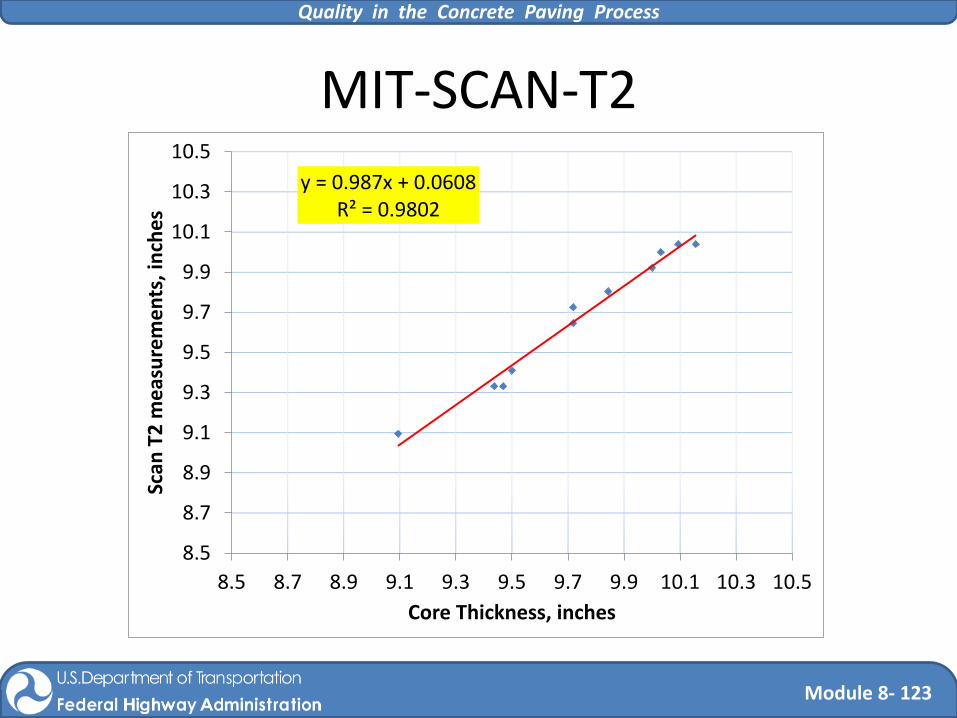
MIT-SCAN-T2
y = 0.987x + 0.0608R² = 0.9802
8.5
8.7
8.9
9.1
9.3
9.5
9.7
9.9
10.1
10.3
10.5
8.5 8.7 8.9 9.1 9.3 9.5 9.7 9.9 10.1 10.3 10.5
Scan
T2
me
asu
rem
en
ts, i
nch
es
Core Thickness, inches

Quality in the Concrete Paving Process
Module 8 - 124
Thank you for your attention.
.
Any final comments or questions?


