National Inclusion Institute Chapel Hill, North Carolina May 11, 2016 Quality Matters: National Initiatives to Support Inclusion Beth Caron AEM Early Learning Challenge TA Center (ELC TA) Shelley deFosset AEM Early Learning Challenge TA Center & Preschool Development Grant TA Center (ELC TA and PDG TA) Jim Squires Center on Enhancing Early Learning Outcomes (CEELO)
Transcript
National Inclusion Institute Chapel Hill, North Carolina
May 11, 2016
Quality Matters: National Initiatives to Support Inclusion
Beth Caron AEM Early Learning Challenge TA Center (ELC TA)
Shelley deFosset AEM Early Learning Challenge TA Center &
Preschool Development Grant TA Center (ELC TA and PDG TA)
Jim Squires Center on Enhancing Early Learning Outcomes (CEELO)
Presenter
Presentation Notes
Beth – Introduce speakers. Ask who is in audience: (If you belong to more than one group, raise hand for all that apply) - state admin (619, Child Care, etc), regional admin, TA provider, local program admin, local provider, family member, other
2
The Facts Inclusion benefits all children
Children can be effectively educated in inclusive programs using specialized instruction
Families of all children generally have positive views of inclusion
Inclusion is not more expensive
Children do not need to be “ready” for inclusion
3
Further Facts
Research is clear: it is effective
IDEA is clear: it is preferred
The profession is clear: it is time!
DEC/NAEYC position statement
DEC Recommended Practices
Joint ED and HHS policy statement
Presenter
Presentation Notes
Research demonstrates that children participating in high quality programs benefits all children. (know it works, know it is good and yet it is not happening)
Preschool Inclusion Survey found these Major Challenges (Barton & Smith, 2014)
(e-survey of 619 coordinators and their colleagues)
Presenter
Presentation Notes
Attitudes & Beliefs 30% Fiscal & contracting 19% Approval of non-public school setting 16% Curricula/methods 15% Transportation 15% Personnel qualifications 11% Conflicting policies 10% Program quality 10% The last national look at challenges and solutions was conducted almost 25 years ago (Smith, Salisbury & Rose, 1992)
6
Initiatives and Opportunities to Support Inclusion
Federal Public Awareness Campaign with a Joint Policy Statement on Inclusion
DEC Recommended Practices and Special Initiative on Inclusion
Race to the Top – Early Learning Challenge Grants
Preschool Development Grants
Presenter
Presentation Notes
So given what we know and the lack of movement, what are the incentives and opportunities that may help? There is at present a convergence of National and Federal initiatives and opportunities that support inclusion and demonstrate an increased interest in inclusion across the country: *In response to the lack of progress that our field has made in Inclusion, the Departments of Health and Human Services and the United States Department of Education are collaborating on a Federal Public Awareness Campaign”. Their strategies will include a position paper that outlines the Department’s position and definition on Inclusion. Case studies of exemplary practices at the State, program and community level will be developed. Resources will be identified and made available. Webinar series *The Division of Early Childhood (DEC) has developed a position paper jointly with the National Association for the Education of Young Children (NAEYC) and will have a Special Initiative on Inclusion. *Both the Race to the Top – Early Learning Challenge Grant (RTT-ELC) and the Pre-School Development Grant programs contain specific references to the inclusion of children with disabilities in State planning and in the performance measure data they collect. * The Early Childhood TA Center (ECTA) and the Early Learning Challenge Grant TA (ELC TA) are partnering in the planning and facilitation of Communities of Practice for Part C and Section 619 Coordinators from States with RTT- ELC grants, this CoP is merging into a new National CoP for IDEA Coordinators from all States. ELCTA and ECTA are also partnering a CoP for 619 Coordinators from States with PDG Grants.
Purpose: To set a vision and provide recommendations for increasing the inclusion of infants, toddlers, and preschool children with disabilities in high-quality early childhood programs.
“All young children with disabilities should have access to inclusive high-quality early childhood programs, where they are provided with individualized and appropriate support in meeting high expectations.”
Presenter
Presentation Notes
Beth Purpose of joint policy statement - To set a vision and provide recommendations to States, LEAs, schools, and public and private early childhood programs, from the U.S. Departments of Education and Health and Human Services for increasing the inclusion of infants, toddlers, and preschool children with disabilities in high-quality early childhood programs Federal priority as reflected in inclusion policy statement, DEC, NAEYC Policy statement components: Foundations (principles, research, legal) Challenges (attitudes/beliefs, IDEA interpretation/perceived barriers, workforce, lack of comprehensive services, time/commitment for partnerships) Building a Nationwide Culture of Inclusion Recommendations for State and Local Action (organize/collaborate, establish/follow policies, use data, allocate resources, QRIS, accountability/incentives, PD/certification, public awareness) Resources
9
DEC Recommended Practices in Early Intervention/Early Childhood Special Education
http://www.dec-sped.org/
This document is available online at: http://www.dec-sped.org/recommendedpractices
Lead
ersh
ip
Teaming and Collaboration
Environment
Assessment Family Instruction
Interaction Tr
ansi
tion
Presenter
Presentation Notes
DEC Rec practices provide guidance to practitioners and families about the most effective ways to improve the learning outcomes and promote the development of young children, birth through age 5, who have or are at-risk for developmental delays or disabilities. Leadership- culture & climate; policies & procedures; collaborate Assessment - decisions about child, family, services, monitoring E- physical, social, temporal Family-centered practices, F capacity-building, & F/prof collaboration Instruction- intentional, systematic, quality Interaction- sensitive to linguistic/cultural background Teaming and Collaboration to support family Transition- proactive, intentional, participatory Leadership - establish the conditions that are essential for the successful implementation of the DEC Recommended Practices. Assessment - the process of gathering information to make decisions. Environment- aspects of the space, materials, equipment, routines, and activities that practitioners and families can intentionally alter to support each child’s learning across developmental domains. Family - ongoing activities that promote the active participation of families in decision-making related to their child; lead to the development of a service plan; or support families in achieving the goals they hold for their child and the other family members Instruction- cornerstone of early intervention and early childhood special education to maximize learning and improve developmental and functional outcomes for young children. Interaction- sensitive and responsive interactional practices to promote the development of a child’s language and cognitive and emotional competence. Teaming and Collaboration – promote and sustain collaborative adult partnerships, relationships, and ongoing interactions to ensure programs and services achieve desired child and family outcomes and goals. Transition- events, activities, and processes associated with key changes between environments or programs during the early childhood years and the practices that support the adjustment of the child and family to the new setting.
A. Percent of children aged 3 - 5 with IEPs attending a regular early childhood program and receiving the majority of special education and related services in the regular early childhood program.
B. Percent of children aged 3 - 5 with IEPs attending a separate special education class, separate school or residential facility.
OSEP SPP/APR Indicator 6 Measurement:
Presenter
Presentation Notes
Under IDEA, states collect and report data on the percentage of preschool children (three to five) with IEPS who attend regular ec programs and receive the majority of their services there Who are in separate segregated settings So how do these data look?
12
IDEA Section 619 Indicator 6 Results: Percent of Children aged 3-5 Attending…
A. a regular early childhood program and receiving the majority of special education and related services in the regular early childhood program.
B. a separate special education class, separate school or residential facility.
(2014/15)
Presenter
Presentation Notes
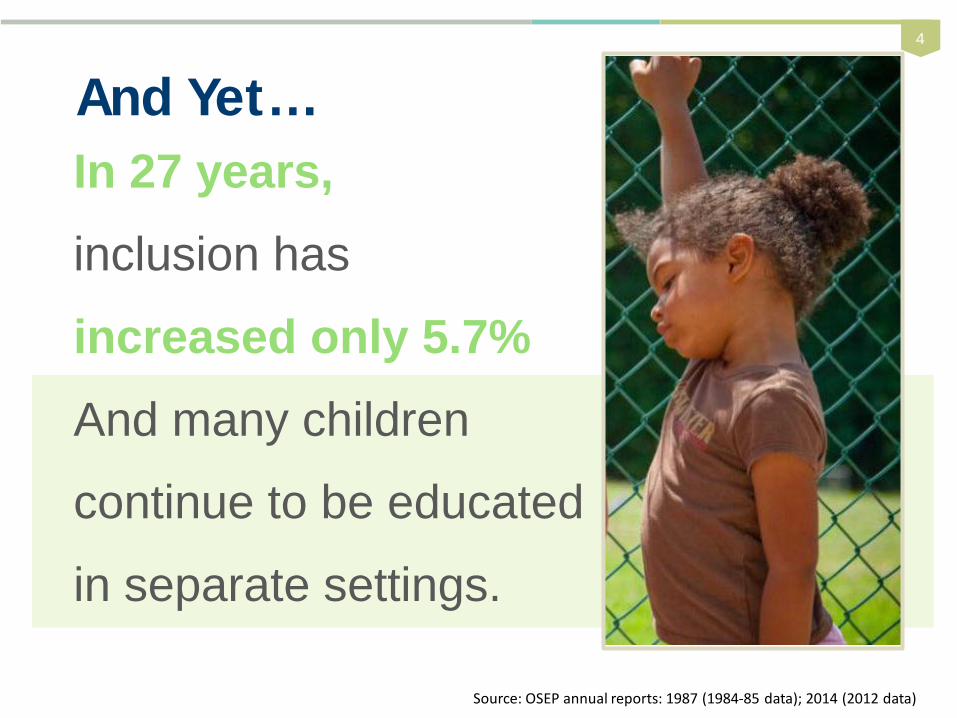
Data vary considerably by state, but as you can see on a national level, the percentages are not high and they are not improving over time. Nationally 26% of children with IEPs are still in separate settings. Remember it is a continuum so not all children should necessarily spend majority of time in regular programs, but we know that a quarter of the children with IEPs do not need to be in separate settings. Also note that the percentages have not changed over time. OSEP data 6a: 43.53 range (8-100%) 6b:25.94 range (0 in 5 states – 62%)
13
Improving Program Quality (B)(2)(c): The number and percentage of early learning and development programs participating in the Statewide tiered quality rating and improvement system (TQRIS) (B)(4)(c)(1). The number of early learning and development programs in the top tiers of the TQRIS
Race to the Top - Early Learning Challenge Annual Performance Measures
Improving Access to Quality Programs (B)(4)(c)(2). The number and percentage of children with high needs enrolled in early learning and development programs in the top tiers of the TQRIS (including programs funded by IDEA, Part B, Section 619 and Part C
Presenter
Presentation Notes
Now let us take a look at two other data sources where information is being collected on children with disabilities RTT-ELC, for those of you who have not heard of it…. Add a few notes from the latest data here
14
Preschool Development Grants Annual Performance Measures:
Indicators (C). Number and Percent of Eligible Children with Disabilities Served in the High-Quality Preschool Programs funded by this grant and served by Subgrantee
Presenter
Presentation Notes
Preschool Development grants (5 development grants) 13 expansion AlabamaDevelopment$17,500,000 ArizonaDevelopment$20,000,000 ArkansasExpansion$14,993,000 ConnecticutExpansion$12,499,000 HawaiiDevelopment$2,074,059 IllinoisExpansion$20,000,000 LouisianaExpansion$2,437,982 MaineExpansion$3,497,319 MarylandExpansion$15,000,000 MassachusettsExpansion$15,000,000 MontanaDevelopment$10,000,000 NevadaDevelopment$6,405,860 New JerseyExpansion$17,498,115 New YorkExpansion$24,991,372 Rhode IslandExpansion$2,290,840 TennesseeExpansion$17,500,000 VermontExpansion$7,231,681 VirginiaExpansion$17,500,000
NIEER STATE OF PRESCHOOL DATA Jim Squires
16
What Can We Learn from the NIEER State of Preschool Yearbook?
• Total state preschool enrollment (3s & 4s) 1,347,072 (29% of 4s)
• EC SpEd enrollment (3s & 4s) 425,445 (5%)
Presenter
Presentation Notes
2015 - 309,992 3s (7%), 1,294,777 4s (32%) = 1.6M 13 unlucky states <10% = AK, HI, ID, IN, MN, MS, MT (<3%), NH, ND, OH, RI, SD, UT (5 no program states, 3 new (MS, HI, IN))
17
Pre-K SpEd Enrollment by State
Presenter
Presentation Notes
Breakdown by State – figures from OSEP and state reports
18
Of 54 state-funded pre-K programs: • 19 (35%) reported enrollment figures for English Language Learners
• 10 (19%) allowed children receiving SpEd services to attend programs but not be counted in enrollment; all others include in enrollment
• 25 (46%) reported exact SpEd enrollment; 22 can break down by age
• 40 (74%) operated on the school-year calendar
• 22 (41%) allowed K age-eligible children with IEPs to attend pre-K
• 18 (33%) specifically include disability or developmental delay in eligibility criteria
• 27 (50%) require teacher licensure that may include EC SpEd; 0 require any specialized training for assistant teacher
• 13 (24%) report use of federal IDEA (619) funds for children (9 unable to report exact amount)


![[Wilfred N. Caron] Antenna Impedance Matching(BookFi.org)](https://static.documents.pub/doc/80x56/55cf983e550346d033967ad4/wilfred-n-caron-antenna-impedance-matchingbookfiorg.jpg)


