19
Quality Measurement framework puts the end user in focus
| Date post: | 13-Aug-2015 |
| Category: |
Technology |
| Upload: | quest-forum |
| View: | 74 times |
| Download: | 0 times |
Slide subtitle
Quality Measurement framework puts the end user in focus
Agenda
› Setting the scene
› QuEST Forum achievements
› Way forward
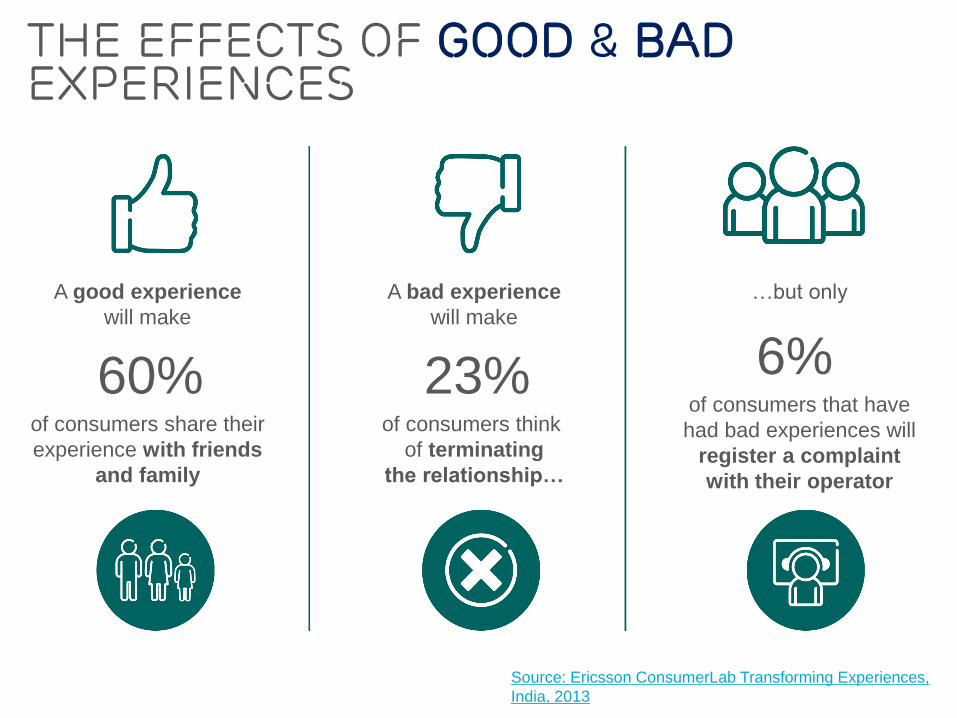
The effects of GOOD & BADEXPERIENCES
A good experience
will make
60%of consumers share their
experience with friends
and family
A bad experience
will make
23%of consumers think
of terminating
the relationship…
…but only
6%of consumers that have
had bad experiences will
register a complaint
with their operator
Source: Ericsson ConsumerLab Transforming Experiences,
India, 2013
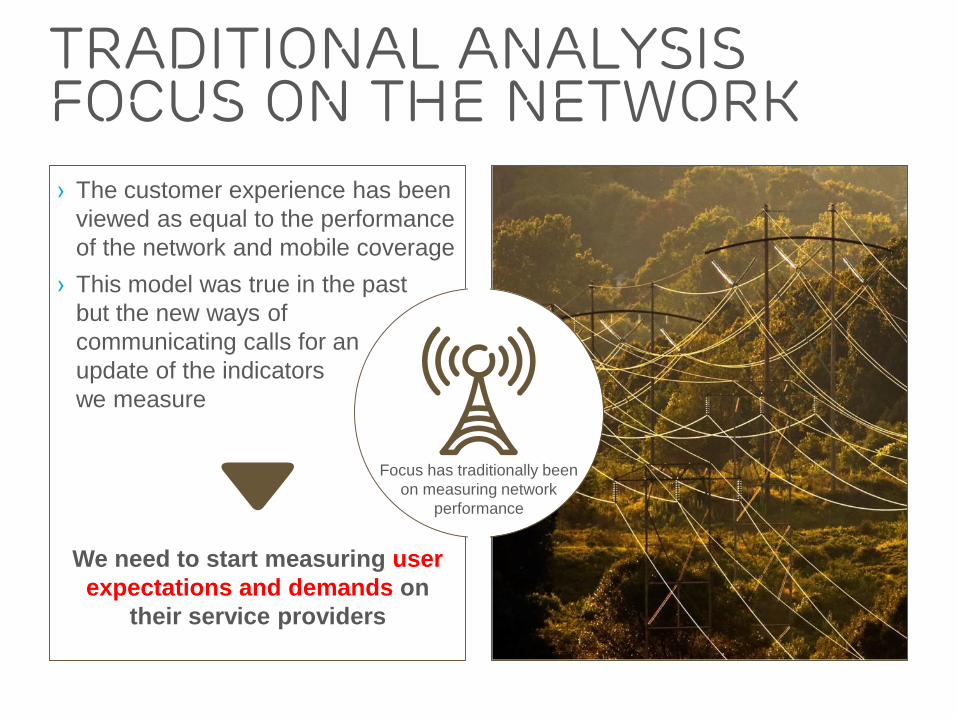
Traditional analysis focus on the network
› The customer experience has been
viewed as equal to the performance
of the network and mobile coverage
› This model was true in the past
but the new ways of
communicating calls for an
update of the indicators
we measure
We need to start measuring user
expectations and demands on
their service providers
Focus has traditionally been
on measuring network
performance
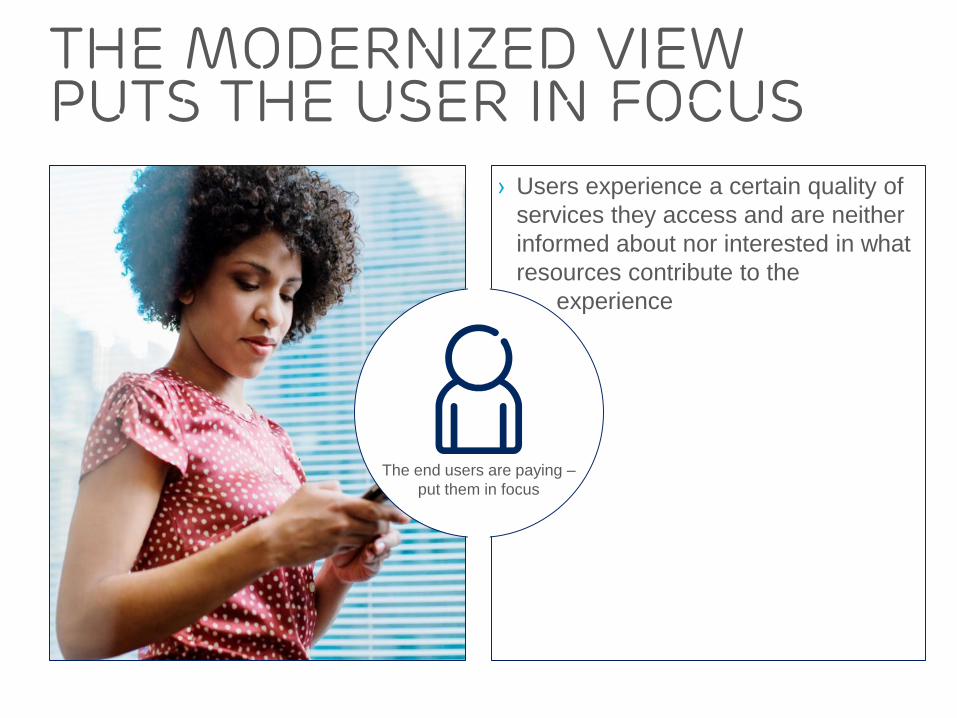
The modernized view puts the user in focus
› Users experience a certain quality of
services they access and are neither
informed about nor interested in what
resources contribute to the
experience
The end users are paying –
put them in focus
The modernized view puts the user in focus
Loading…
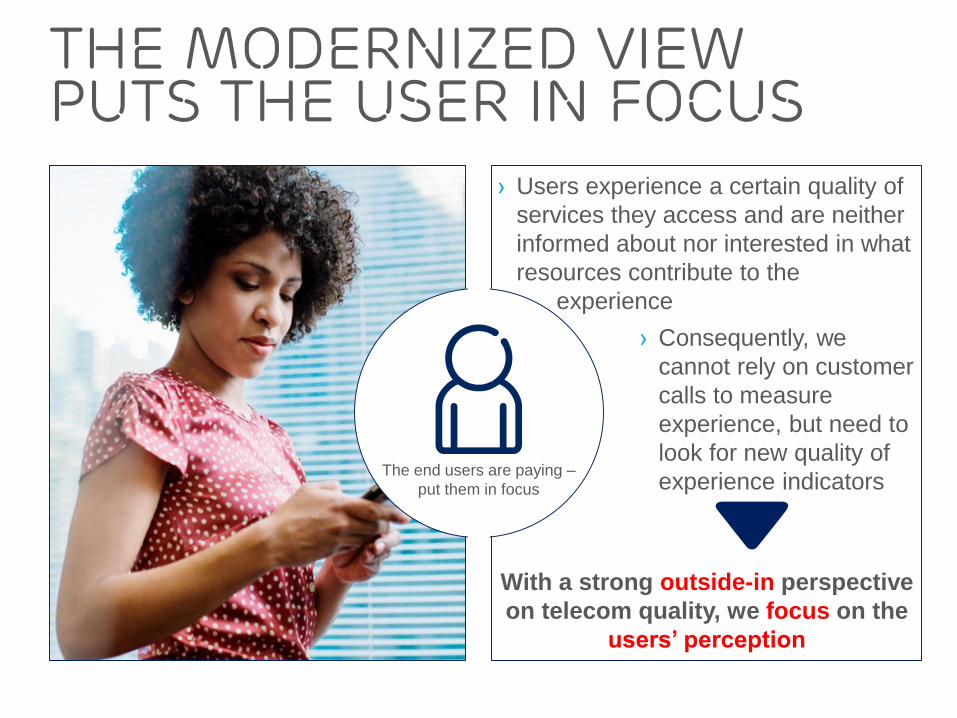
The modernized view puts the user in focus
› Users experience a certain quality of
services they access and are neither
informed about nor interested in what
resources contribute to the
experience
› Consequently, we
cannot rely on customer
calls to measure
experience, but need to
look for new quality of
experience indicators
With a strong outside-in perspective
on telecom quality, we focus on the
users’ perception
The end users are paying –
put them in focus
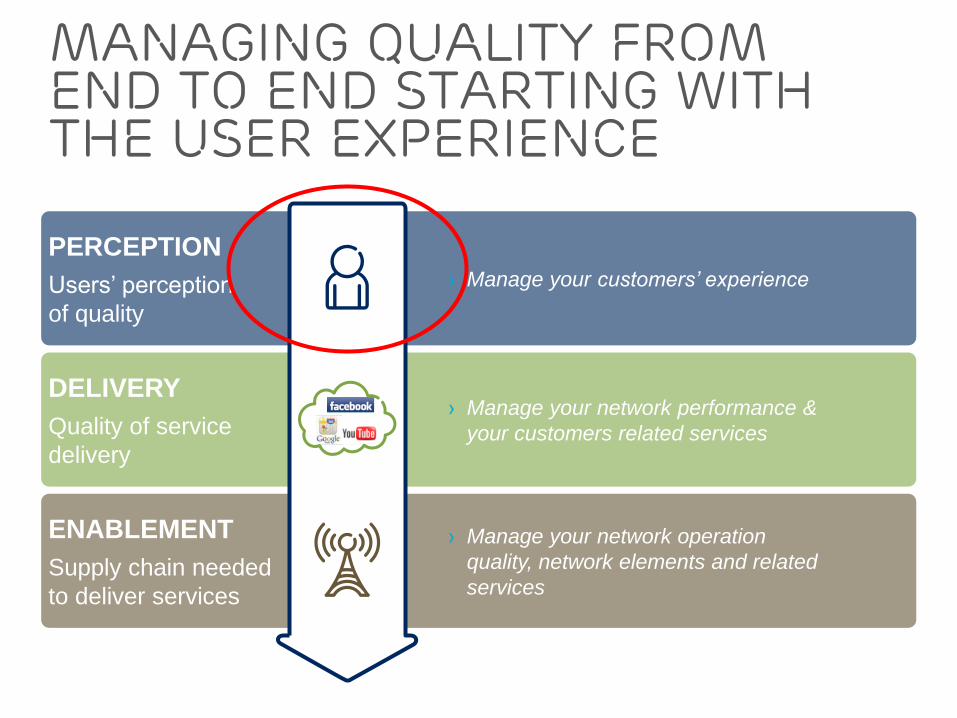
Managing quality from end to end starting with the user experience
PERCEPTION
Users’ perception
of quality
DELIVERY
Quality of service
delivery
ENABLEMENT
Supply chain needed
to deliver services
› Manage your customers’ experience
› Manage your network performance &
your customers related services
› Manage your network operation
quality, network elements and related
services
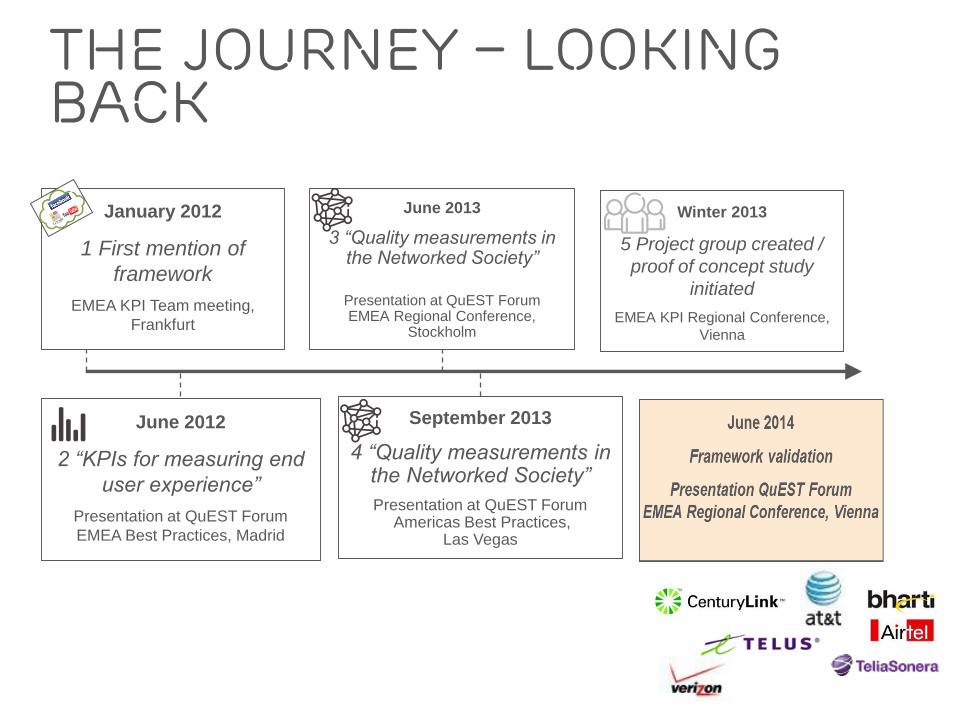
The journey – looking back
June 2012
2 “KPIs for measuring end
user experience”
Presentation at QuEST Forum
EMEA Best Practices, Madrid
June 2013
3 “Quality measurements in the Networked Society”
Presentation at QuEST Forum EMEA Regional Conference,
Stockholm
September 2013
4 “Quality measurements in the Networked Society”
Presentation at QuEST ForumAmericas Best Practices,
Las Vegas
January 2012
1 First mention of
framework
EMEA KPI Team meeting,
Frankfurt
Winter 2013
5 Project group created /
proof of concept study
initiated
EMEA KPI Regional Conference,
Vienna
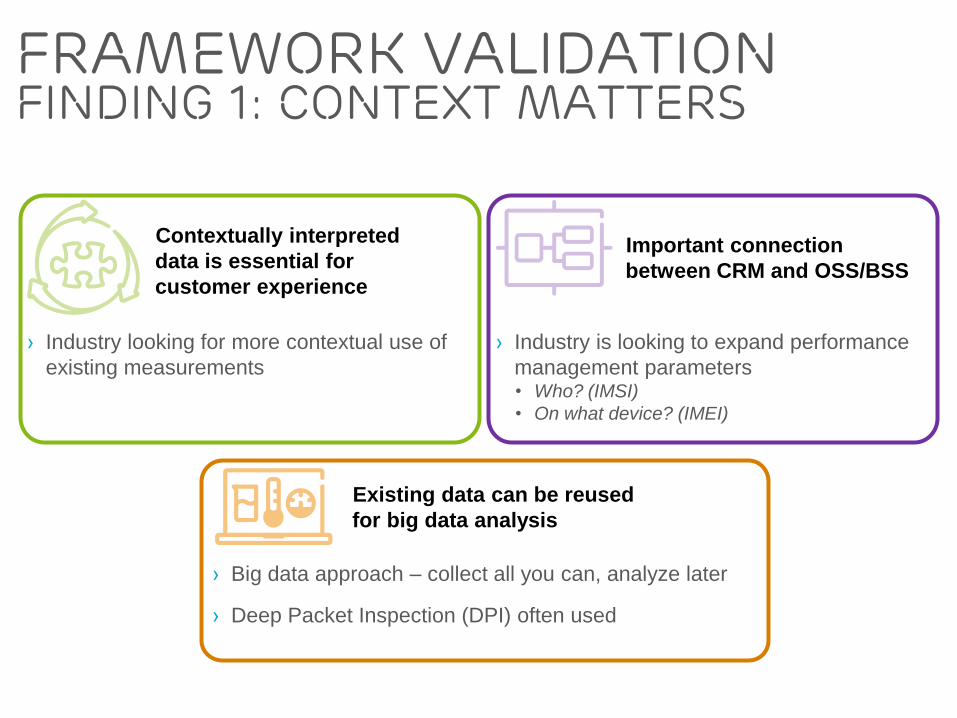
Existing data can be reused
for big data analysis
Contextually interpreted
data is essential for
customer experience
› Industry is looking to expand performance
management parameters• Who? (IMSI)
• On what device? (IMEI)
› Big data approach – collect all you can, analyze later
› Deep Packet Inspection (DPI) often used
Important connection
between CRM and OSS/BSS
› Industry looking for more contextual use of
existing measurements
Framework validationFinding 1: Context matters
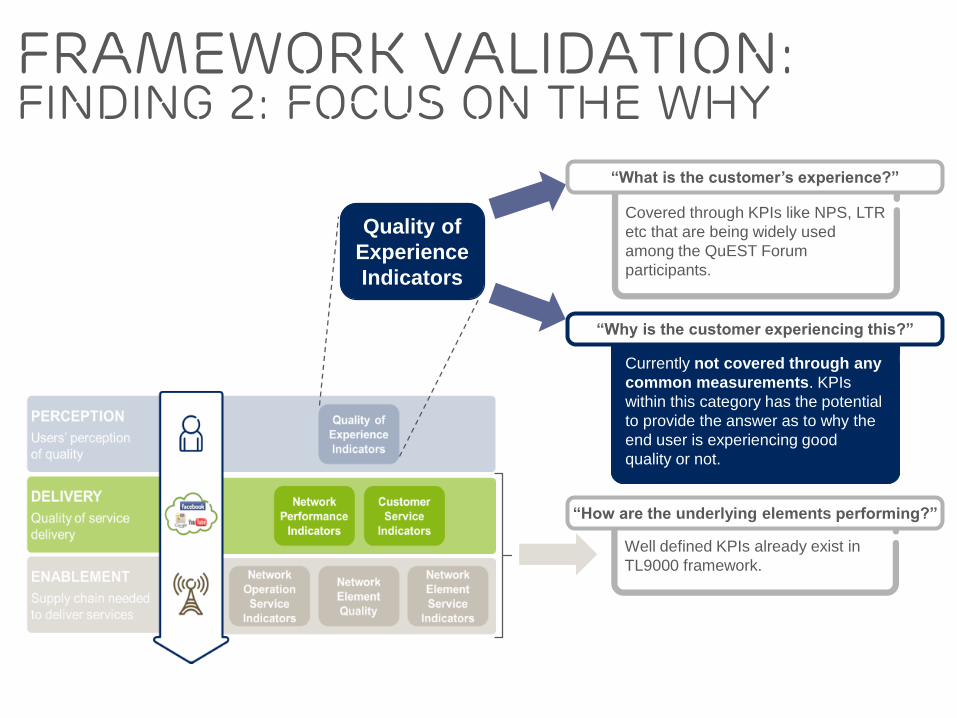
Framework validation:finding 2: focus on the why
Covered through KPIs like NPS, LTR
etc that are being widely used
among the QuEST Forum
participants.
Currently not covered through any
common measurements. KPIs
within this category has the potential
to provide the answer as to why the
end user is experiencing good
quality or not.
Well defined KPIs already exist in
TL9000 framework.
“What is the customer’s experience?”
“Why is the customer experiencing this?”
“How are the underlying elements performing?”
Quality of
Experience
Indicators
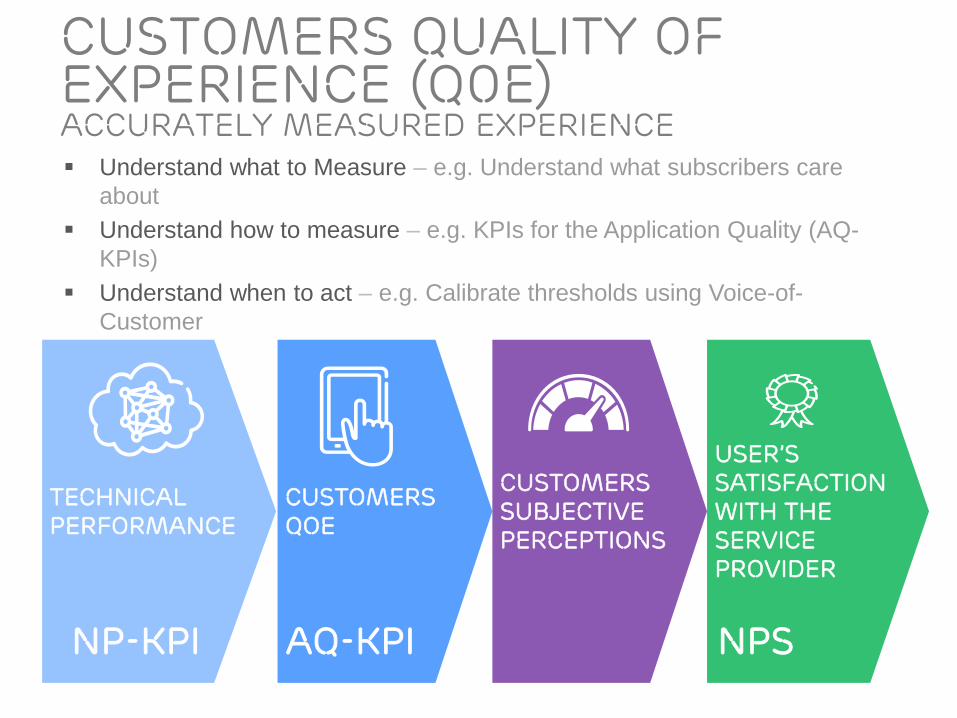
Customers Quality of experience (Q0E)Accurately Measured Experience
Technical performance
Customers QoE
Customers Subjective Perceptions
User’s satisfaction with the service provider
NPSAQ-KPINP-KPI
Understand what to Measure – e.g. Understand what subscribers care
about
Understand how to measure – e.g. KPIs for the Application Quality (AQ-
KPIs)
Understand when to act – e.g. Calibrate thresholds using Voice-of-
Customer
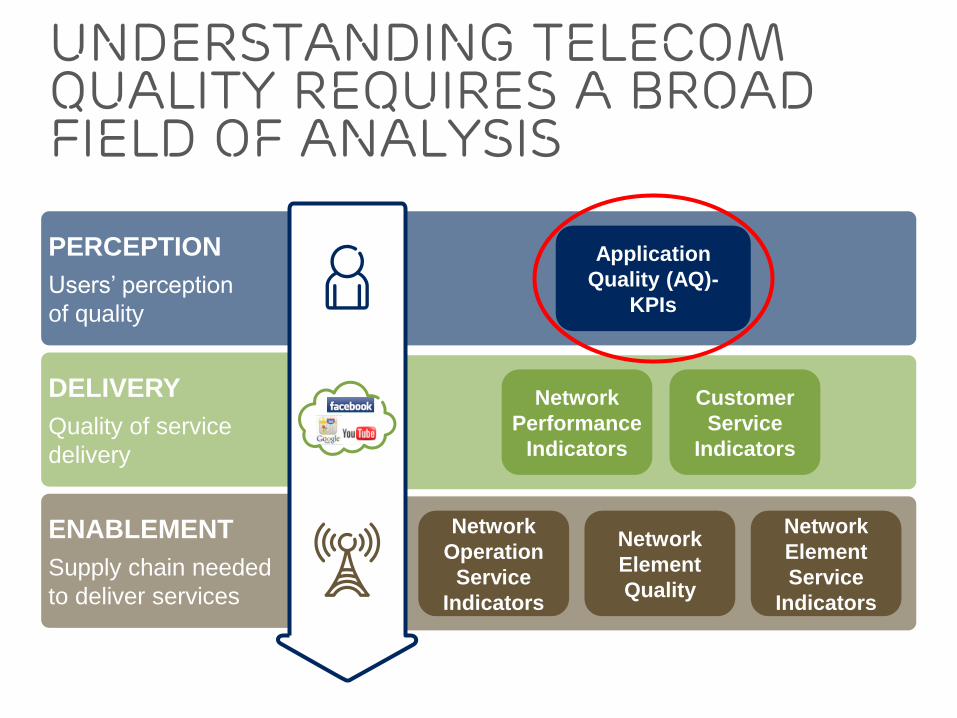
understanding telecom quality requires a broad field of analysis
PERCEPTION
Users’ perception
of quality
DELIVERY
Quality of service
delivery
ENABLEMENT
Supply chain needed
to deliver services
Application
Quality (AQ)-
KPIs
Customer
Service
Indicators
Network
Performance
Indicators
Network
Operation
Service
Indicators
Network
Element
Service
Indicators
Network
Element
Quality
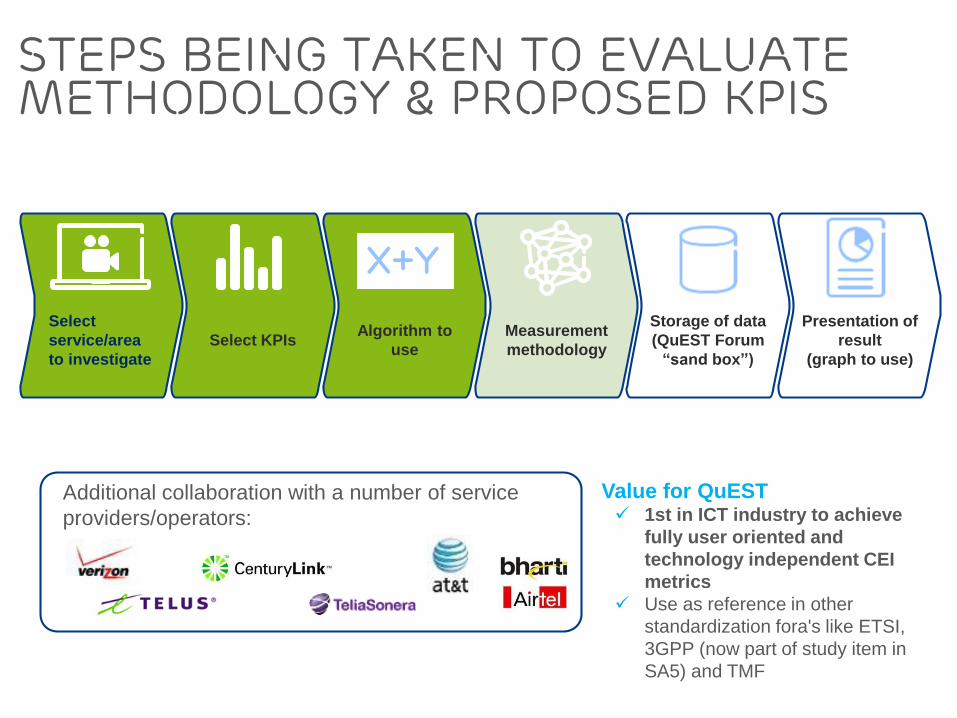
Steps being taken to Evaluate Methodology & proposed KPIs
Additional collaboration with a number of service
providers/operators:
Select
service/area
to investigate
Select KPIsAlgorithm to
use
Measurement
methodology
Storage of data
(QuEST Forum
“sand box”)
Presentation of
result
(graph to use)
X+Y
Value for QuEST 1st in ICT industry to achieve
fully user oriented and
technology independent CEI
metrics
Use as reference in other
standardization fora's like ETSI,
3GPP (now part of study item in
SA5) and TMF
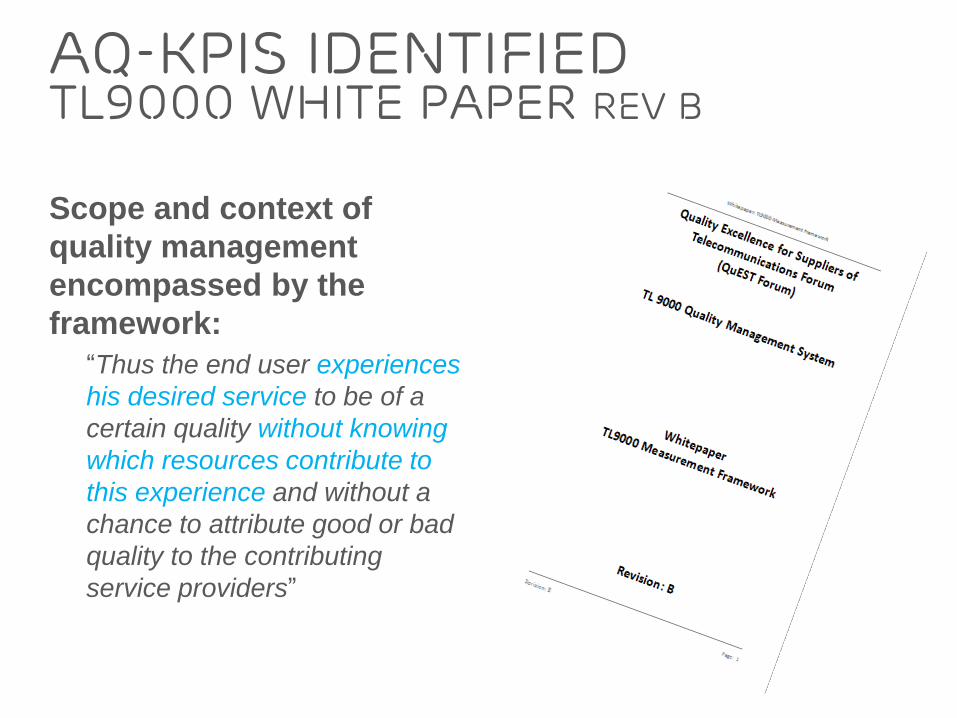
Scope and context of
quality management
encompassed by the
framework:
“Thus the end user experiences
his desired service to be of a
certain quality without knowing
which resources contribute to
this experience and without a
chance to attribute good or bad
quality to the contributing
service providers”
AQ-KPIs identifiedTl9000 white paper rev B
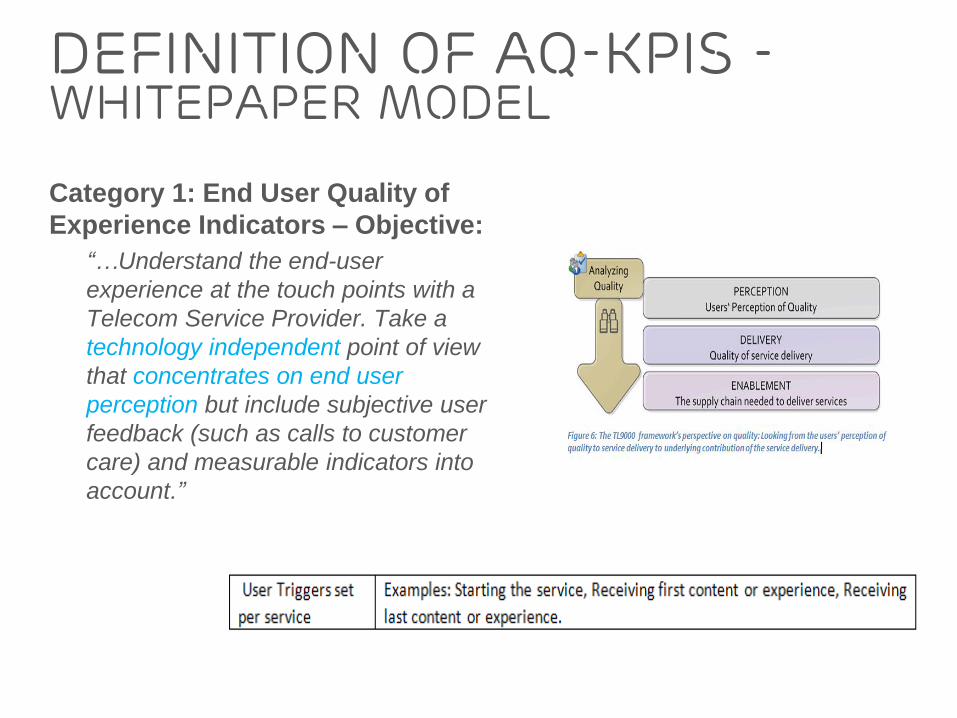
Category 1: End User Quality of
Experience Indicators – Objective:
“…Understand the end-user
experience at the touch points with a
Telecom Service Provider. Take a
technology independent point of view
that concentrates on end user
perception but include subjective user
feedback (such as calls to customer
care) and measurable indicators into
account.”
Definition of AQ-KPIs -Whitepaper Model
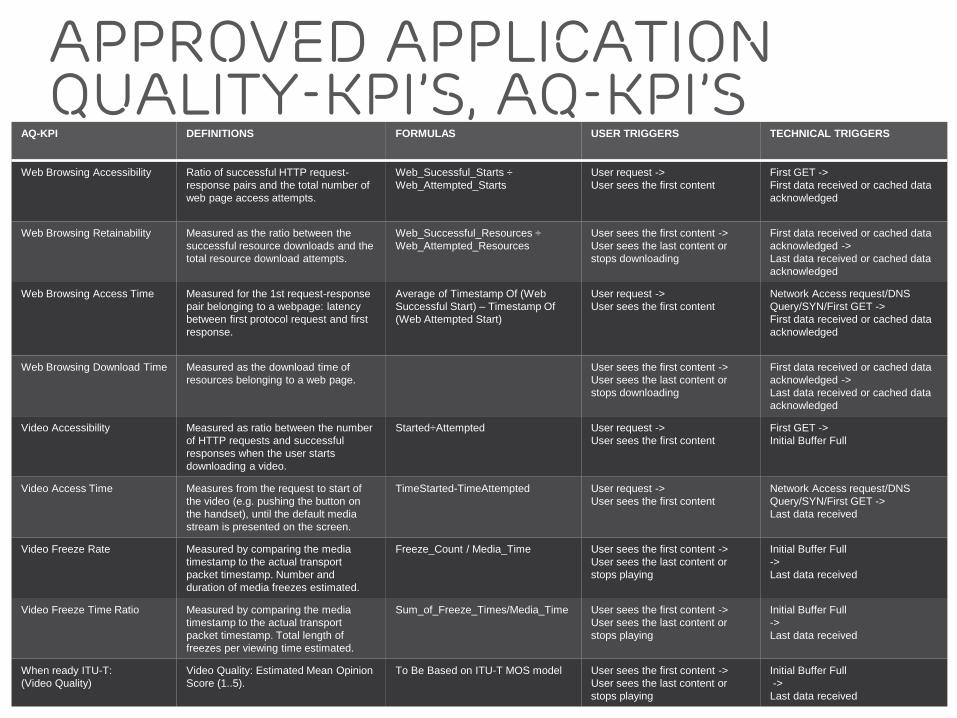
Approved Application quality-kpi’s, AQ-KPI’s
AQ-KPI DEFINITIONS FORMULAS USER TRIGGERS TECHNICAL TRIGGERS
Web Browsing Accessibility Ratio of successful HTTP request-
response pairs and the total number of
web page access attempts.
Web_Sucessful_Starts ÷
Web_Attempted_Starts
User request ->
User sees the first content
First GET ->
First data received or cached data
acknowledged
Web Browsing Retainability Measured as the ratio between the
successful resource downloads and the
total resource download attempts.
Web_Successful_Resources ÷
Web_Attempted_Resources
User sees the first content ->
User sees the last content or
stops downloading
First data received or cached data
acknowledged ->
Last data received or cached data
acknowledged
Web Browsing Access Time Measured for the 1st request-response
pair belonging to a webpage: latency
between first protocol request and first
response.
Average of Timestamp Of (Web
Successful Start) – Timestamp Of
(Web Attempted Start)
User request ->
User sees the first content
Network Access request/DNS
Query/SYN/First GET ->
First data received or cached data
acknowledged
Web Browsing Download Time Measured as the download time of
resources belonging to a web page.
User sees the first content ->
User sees the last content or
stops downloading
First data received or cached data
acknowledged ->
Last data received or cached data
acknowledged
Video Accessibility Measured as ratio between the number
of HTTP requests and successful
responses when the user starts
downloading a video.
Started÷Attempted User request ->
User sees the first content
First GET ->
Initial Buffer Full
Video Access Time Measures from the request to start of
the video (e.g. pushing the button on
the handset), until the default media
stream is presented on the screen.
TimeStarted-TimeAttempted User request ->
User sees the first content
Network Access request/DNS
Query/SYN/First GET ->
Last data received
Video Freeze Rate Measured by comparing the media
timestamp to the actual transport
packet timestamp. Number and
duration of media freezes estimated.
Freeze_Count / Media_Time User sees the first content ->
User sees the last content or
stops playing
Initial Buffer Full
->
Last data received
Video Freeze Time Ratio Measured by comparing the media
timestamp to the actual transport
packet timestamp. Total length of
freezes per viewing time estimated.
Sum_of_Freeze_Times/Media_Time User sees the first content ->
User sees the last content or
stops playing
Initial Buffer Full
->
Last data received
When ready ITU-T:
(Video Quality)
Video Quality: Estimated Mean Opinion
Score (1..5).
To Be Based on ITU-T MOS model User sees the first content ->
User sees the last content or
stops playing
Initial Buffer Full
->
Last data received
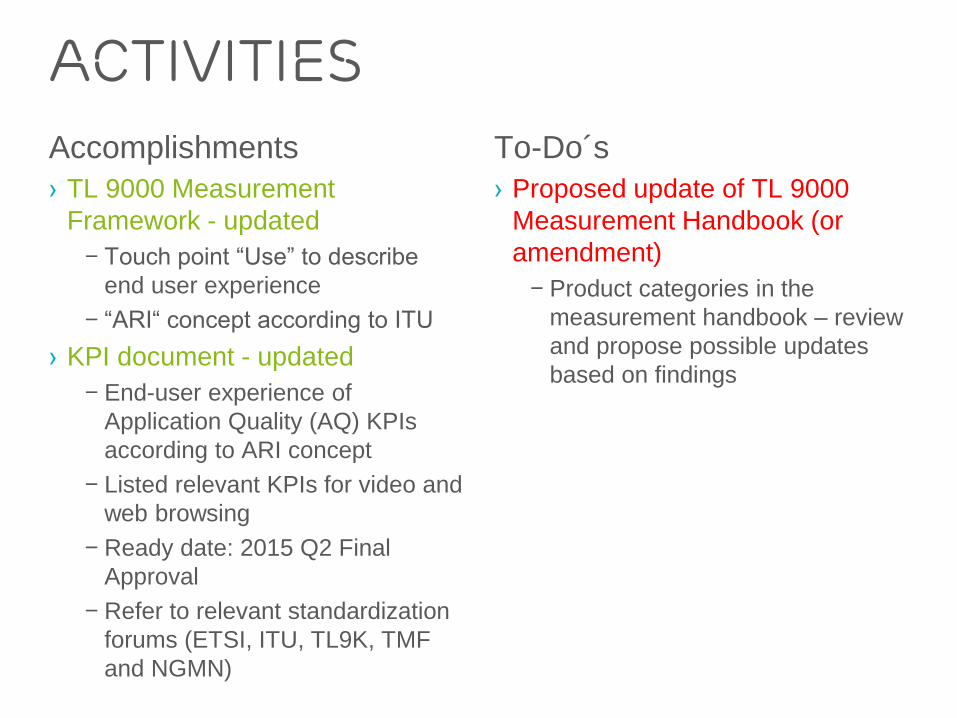
To-Do´s
› Proposed update of TL 9000
Measurement Handbook (or
amendment)
– Product categories in the
measurement handbook – review
and propose possible updates
based on findings
Accomplishments
› TL 9000 Measurement
Framework - updated
– Touch point “Use” to describe
end user experience
– “ARI“ concept according to ITU
› KPI document - updated
– End-user experience of
Application Quality (AQ) KPIs
according to ARI concept
– Listed relevant KPIs for video and
web browsing
– Ready date: 2015 Q2 Final
Approval
– Refer to relevant standardization
forums (ETSI, ITU, TL9K, TMF
and NGMN)
activities
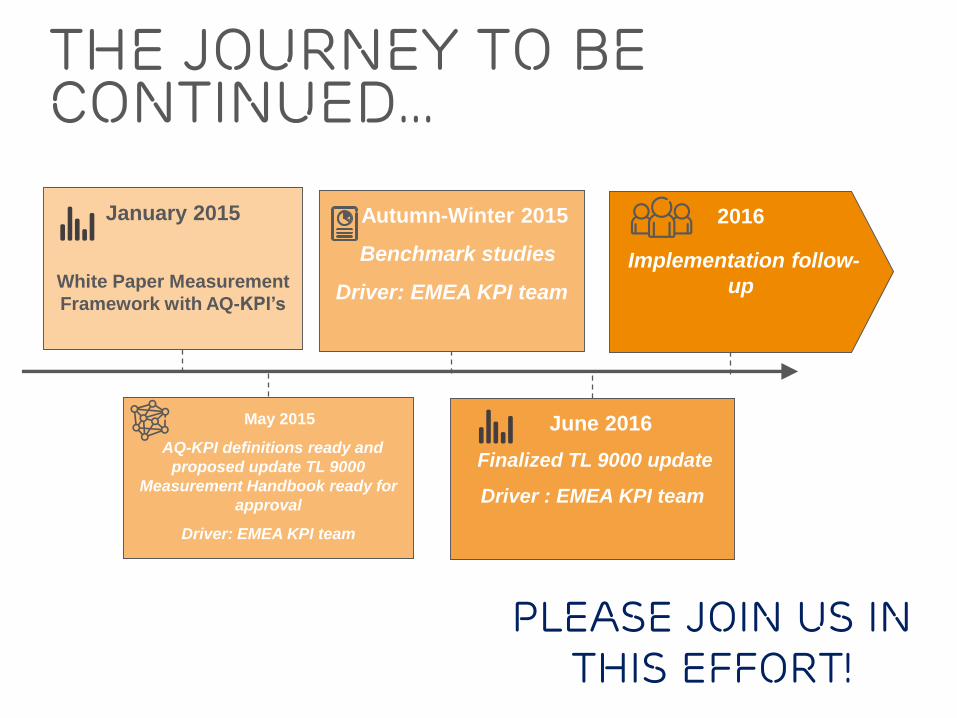
The journey to be continued…
January 2015
White Paper Measurement
Framework with AQ-KPI’s
Autumn-Winter 2015
Benchmark studies
Driver: EMEA KPI team
June 2016
Finalized TL 9000 update
Driver : EMEA KPI team
2016
Implementation follow-
up
May 2015
AQ-KPI definitions ready and
proposed update TL 9000
Measurement Handbook ready for
approval
Driver: EMEA KPI team
Please join us inthis effort!


