244


This document is available on the CanadianHealth Services Research Foundation web site (www.chsrf.ca).
1565 Carling Avenue, Suite 700Ottawa, OntarioK1Z 8R1E-mail: [email protected]: 613-728-2238Fax: 613-728-3527
The Chartbook is a publication of the CanadianHealth Services Research Foundation and itspartners. Funded through an agreement withthe Government of Canada, CHSRF is an independent, not-for-profit corporation with a mandate to promote the use of evidence to strengthen the delivery of services thatimprove the health of Canadians. The viewsexpressed herein represent those of the authors and do not necessarily represent the views of CHSRF and its partners or theGovernment of Canada.
ISBN: 978-0-9689154-3-1


About CHSRF 6
Message from the President 7
Foreword 9
Acknowledgements 10
About the Authors 11
Executive Summary 12
Introduction And Brief Overview 16Table 1: Six domains used as organizing principles for
quality chartbooks 17
At a Glance: The Canadian Healthcare System 19
1
TABLE OF CONTENTSEFFECTIVENESSIntroduction 25Chart 1.1 Mortality from causes amenable to healthcare:
International 26
Chart 1.2 Life expectancy at birth: International 27
Chart 1.3 Life expectancy at birth: Canada 28
Cancer 29Chart 1.4 Cancer mortality: International 30
Chart 1.5 Potential years of life lost to cancer: International 31
Chart 1.6 Cancer mortality: Canada 32
Chart 1.7 Lung cancer: Mortality and potential years of life lost, international 33
Chart 1.8 Colorectal cancer: Mortality and potential years of life lost, international 34
Chart 1.9 Breast cancer: Mortality and potential years of life lost, international 35
Chart 1.10 Prostate cancer: Mortality and potential years of life lost, international 36
Chart 1.11 Cancer: Relative survival ratios, Canada 37
Chart 1.12 Cancer: Relative survival ratios, provinces 38
Chart 1.13 Guideline-compliant cancer care: Ontario 39

Circulatory Disease 41Chart 1.14 Mortality from circulatory disease: International 42
Chart 1.15 Potential years of life lost to circulatory disease:International 43
Chart 1.16 Mortality from circulatory disease: Canada 44
Coronary Heart Disease 45Chart 1.17 Mortality from AMI: International 46
Chart 1.18 Potential years of life lost to AMI: International 47
Chart 1.19 Mortality from AMI: Canada 48
Chart 1.20 AMI Re-admission within 28 days: Canada 49
Chart 1.21 Secondary prevention of AMI: Saskatchewan 50
Stroke 51Chart 1.22 Cerebrovascular disease mortality: International 52
Chart 1.23 Potential years of life lost to cerebrovascular disease:International 53
Chart 1.24 Mortality from cerebrovascular disease: Canada 54
Chart 1.25 Public awareness of stroke as medical emergency: Canada 55
Chart 1.26 Emergency transport for stroke: Ontario 56
Chart 1.27 Emergency imaging and thrombolysis for stroke: Ontario 57
Chart 1.28 Dysphagia screening by hospital type: Ontario 58
Chart 1.29 Secondary prevention for stroke: Ontario 59
Respiratory Disease 61Chart 1.30 Respiratory disease mortality: International 62
Chart 1.31 Respiratory disease mortality: Canada 63
Chart 1.32 COPD in Canada: Diagnosis and spirometry 64
2Quality of Healthcare in Canada: A Chartbook
Diabetes 65Chart 1.33 Monitoring glycemic control in people
with diabetes: International 66
Chart 1.34 Diabetes care processes: International 67
Chart 1.35 Diabetes care processes: Canada 68
Chart 1.36 Diabetes control: Saskatchewan 70
Mental Health and Mental Illness 71Chart 1.37 Mortality and potential years of life lost to suicide:
International 72
Chart 1.38 Potential years of life lost to suicide: Canada 73
Chart 1.39 Hospitalization due to suicide attempts: Canada 74
Chart 1.40 Mental health services: Re-admission within 30 days of discharge: Canada 75
Prevention and Health Promotion 76Chart 1.41 Childhood immunization: International 77
Chart 1.42 Flu vaccination among people aged 65+: Canada 78
Chart 1.43 Monitoring blood pressure and cholesterol: International 79
Chart 1.44 Monitoring blood pressure and cholesterol: Canada 80
Chart 1.45 Screening for breast cancer: Canada 81
Chart 1.46 Adherence to colorectal cancer screening guidelines: Canada 82
Chart 1.47 Cervical cancer screening: Canada 83
Appropriateness 84Chart 1.48 Hospitalizations for ambulatory care
sensitive conditions: Canada 85
Chart 1.49 Re-admission after discharge: International 87
Chart 1.50 Caesarean sections: Canada 88
ACCESSIntroduction 92
Waits for Primary and Emergency Care 93Chart 2.1 Access to a regular doctor: International 94
Chart 2.2 Access to a regular doctor: Canada 95
Chart 2.3 Reported difficulties gaining access to routine or ongoing care: Canada 96
Chart 2.4 Unmet healthcare needs: Canada 97
Chart 2.5 Waits for primary care: International 98
Chart 2.6 Waits for routine primary care: Canada 99
Chart 2.7 Waits for immediate healthcare (minor health problem): Canada 100
Chart 2.8 Emergency department used for primary care:International 101
Chart 2.9 Emergency department used for primary care:International time series 102
Chart 2.10 Emergency department used for primary care: Canada 103
Chart 2.11 Waits in the emergency department: International 104
Chart 2.12 Waits in the emergency department: Canada 105
Waits for Secondary and Specialist Care 107Chart 2.13 Waits to see specialist: International 108
Chart 2.14 Wait times for specialist appointment: Canada 109
Excessive Waits for Priority Procedures 110Chart 2.15 Waits for joint replacement surgery: Canada 111
Chart 2.16 Waits for cataract removal surgery: Canada 112
Chart 2.17 Waits for radiation therapy: Canada 113
Chart 2.18 Waits for coronary artery bypass grafts: Canada 114
Chart 2.19 Waits for selected diagnostic tests: Canada 115
CAPACITYIntroduction 118
Spending 119Chart 3.1 Expenditure on health as a percent of GDP:
International 120
Chart 3.2 Expenditure on health per person, $U.S. purchase price parity: International 121
Chart 3.3 Spending on health per capita: Canada 122
Staffing 123Chart 3.4 Physicians: International 124
Chart 3.5 Physicians in Canada: Provinces and territories
Chart 3.6 Family physicians/general practitioners: International 125
Chart 3.6 Family physicians/general practitioners: International 126
Chart 3.7 Family physicians: Canada 127
Chart 3.8 Specialist physicians: International 1283

Chart 3.9 Specialist physicians: Canada 129
Chart 3.10 Dentists: Canada 130
Chart 3.11 Registered nurses per capita: International 131
Chart 3.12 Registered nursing workforce: Canada 132
Equipment 133Chart 3.13 CT scanners: International 133
Chart 3.14 CT scanners: Canada 134
Chart 3.15 MRI scanners: International 135
Chart 3.16 MRI scanners: Canada 136
Information technology 137Chart 3.17 Advanced IT capacity in primary care: International 138
Chart 3.18 Type of information technology used by primary-care physicians: Canada 140
Chart 3.19 Electronic patient records in primary care: International 141
Chart 3.20 Electronic patient records in primary care: Canada 142
Pharmaceuticals 143Chart 3.21 Per person spending on prescription drugs: Canada 144
Chart 3.22 Age-standardized spending on prescription drugs: Canada 145
SAFETYIntroduction 148
Adverse events in healthcare 149Chart 4.1 Types of adverse events and estimated exposure 150
Chart 4.2 Adverse events time series: Ontario 151
Chart 4.3 Inappropriate prescribing: Select provinces 153
Chart 4.4 Patient-reported error: International 154
Chart 4.5 Patient-reported error: Canada 155
Chart 4.6 In-hospital hip fractures: Canada 156
Chart 4.7 Incorrect surgical site: Neurosurgery case study 158
Chart 4.8 Ventilator-associated pneumonia: Canada 159
Chart 4.9 Perineal trauma in childbirth 160
Healthcare-associated infections 161Chart 4.10 Healthcare-associated MRSA infections: Canada 162
Chart 4.11 Healthcare-associated MRSA infections: Regional incidence 163
Chart 4.12 Hospital-associated Clostridium difficile infections:Canada 164
Safety systems and processes 165Chart 4.13 Safety alerts in primary care: International 166
Chart 4.14 Processes for improving patient safety: Ontario 167
Chart 4.15 Patient safety strategies: Ontario 168
Chart 4.16 Managing comorbidities: International 169
Chart 4.17 Safety and hospital discharge –Awareness of complications: International 170
4
Quality of Healthcare in Canada: A Chartbook

PATIENT CENTREDNESSIntroduction 174Chart 5.1 Extent of change required: International 175
Chart 5.2 Extent of change required: Canada 176
Chart 5.3 Patient ratings of overall quality: International 177
Chart 5.4 Public ratings of overall quality: Canada 178
Chart 5.5 Confidence in healthcare system: Canada 179
Chart 5.6 Coordination-of-care problems: International 181
Chart 5.7 Coordination-of-care problems: Canada 182
Chart 5.8 Patient engagement in care: International 183
Chart 5.9 Patient involvement in decision-making: International 184
Chart 5.10 Patient involvement in decision-making: Canada 185
Chart 5.11 Written care plan: International 186
Chart 5.12 Emotional support: Canada 187
EQUITYIntroduction 190Chart 6.1 Life expectancy by income: Canada 192
Chart 6.2 Life expectancy: Registered Indians vs. Canada 193
Chart 6.3 Mortality rates for aboriginal and non-aboriginal Canadians 194
Chart 6.4 Premature mortality by income: Manitoba 196
Chart 6.5 Cost concerns as a barrier to medical care: International 197
Chart 6.6 Cost concerns as a barrier to dental care and pharmacy: International 198
Chart 6.7 Infant mortality by socio-economic status: Canada 199
Chart 6.8 Incidence of AMI and stroke by income and place of residence: Manitoba 200
Chart 6.9 Angioplasty and statin prescription by income and place of residence: Manitoba 201
Chart 6.10 Diabetes care processes by household income: Canada 203
Chart 6.11 Diabetes and lower-limb amputations by income:Manitoba 204
Chart 6.12 Influenza vaccination in seniors, by income 205
Chart 6.13 Childhood immunizations by income: Manitoba 206
Chart 6.14 Benzodiazepine prescription in seniors, by income and sex: Manitoba 207
Chart 6.15 Chronic kidney disease care, aboriginal vs. non-aboriginal: Alberta 208
Chart 6.16 AMI secondary prevention by age: Saskatchewan 210
TECHNICAL APPENDIX 211
ACRONYMS 228
REFERENCES 229
5

For more than a decade, the Canadian HealthServices Research Foundation has broughttogether researchers and decision makers tocreate and apply knowledge to improve healthservices in Canada.
CHSRF and its national, provincial and regionalpartners involve healthcare providers and
decision makers in shaping and using theknowledge gained through research. Throughthe use of innovative programs, CHSRF aims toconnect healthcare “thinkers” with healthcare“doers” to develop timely, appropriate andhigh-quality services that improve the healthof Canadians. Its strategic priorities focus onengaging and supporting citizens, accelerating
evidence-based change, and promoting policy dialogue.
CHSRF is funded through an agreement withthe government of Canada.
6
Quality of Healthcare in Canada: A Chartbook
ABOUT CHSRF

Canadians see our universal healthcare systemas an important part of our national identity,reflecting values we hold dear, such as equityand solidarity.
In certain key areas – wait times and patientsafety being two prominent examples – policymakers and healthcare leaders have made concerted efforts to address the challenges. But what about the system as a whole? Do Canadians in fact enjoy high-quality healthcare across the country?
Quality of Healthcare in Canada: A Chartbookprovides the best available evidence as to whereCanada’s healthcare stands, internationally andacross jurisdictions within our borders. Thecharts enable us to begin to discern whereCanadian healthcare should be celebrated andwhere it is falling short. Among the reasons tocelebrate: compared to other OECD countries,Canadians experience fewer premature deathsfrom cancer, and fewer deaths from circulatorydisease such as heart attack and stroke than allcomparator countries except the United States.
In other areas, Canada performs relatively poorly:low rates of childhood immunization; poor
access to family physicians; and limited uptakeof health information technology. In addition,the data reveal startling discrepancies in thequality of care and health outcomes betweenCanada’s north and south – as well as betweenhigh- and low-income Canadians – in a numberof areas, including life expectancy, diabetescare, and immunization rates. The structures andprocesses for collecting, collating and reportingCanadian health data vary substantially acrossour country, which can hamper our ability toconduct comparative work within Canada andinternationally. These data are essential to ourunderstanding of what is working well, andnot so well, in our healthcare system, and theimpact on Canadians.
Overall, the Chartbook reveals that Canada,when compared to other nations, usually sitsin the middle of the pack with respect to mostmeasures of quality in healthcare. ShouldCanadians be satisfied with average performance(and below-average performance the further onegets from Canada’s southern, urban centres)? Orshould we aspire to higher quality in all areasof healthcare and in all regions of the country?
The Canadian Health Services ResearchFoundation commissioned this Chartbook for a number of reasons: to be able to compareCanada’s performance to that of other countries;to help raise awareness of the quality of carein Canada; and to provide a foundation for an informed public debate on the quality ofhealthcare. We appreciate the support of theCanadian Patient Safety Institute, StatisticsCanada and the Canadian Institute for HealthInformation in helping to gather these data.The information presented in this Chartbookwill contribute to the work conducted underCHSRF’s three strategic priorities:
• It will support and engage citizens in thepublic discussion of what matters in ourhealthcare sector in terms of quality.
• It will help accelerate evidence-basedchange by providing data that enable us tounderstand what actions are required and toassess progress.
• It will promote policy dialogue, encouragingthe many partners in healthcare in Canada –providers, administrators, researchers andpolicy makers – to work together to identifythe best ways to improve healthcare quality.
7
MESSAGE FROM THE PRESIDENT

8Quality of Healthcare in Canada: A Chartbook
I would like to thank Sheila Leatherman andKim Sutherland for the tremendous work theyhave done in collecting this information. Thestrengths and weaknesses in Canada’s healthcaresystem revealed by this work, as well as thegaps in data that have been highlighted, provide
a roadmap for progress. CHSRF is committedto working with healthcare leaders from acrossCanada to ensure that this Chartbook can supportimprovements in the quality of healthcare forall Canadians, in all parts of the country.
Maureen O’Neil, PresidentCanadian Health Services Research Foundation

9
Does Canada have a high-quality healthcaresystem? Do Canadians receive quality healthcare? If so – or if not – how wouldwe know? Current health system data and performance indicators provide some answersbut, regrettably, do not allow these questionsto be consistently answered with confidencefor all aspects of the healthcare system.
While pockets of excellent data are reported bynational organizations such as the CanadianInstitute for Health Information and StatisticsCanada, and by various provincial health qualitycouncils, the reality is that alignment betweenhealthcare data organizations across the country– national, provincial/territorial and regional –is minimal. It is important to respect andacknowledge that each province and territoryhas unique data and reporting requirementsthat are generated by their priorities. However,healthcare decision makers and providers willbe the first to tell us that there is too muchfragmentation in the requirements for datafrom various credible sources. I frequently hearthem ask, “Can all of you please get your acttogether, streamline and co-ordinate the datarequirements, reduce the workload imposed bythese reporting requirements, and improve thevalue of the process and reporting?”
Quality of Healthcare in Canada: A Chartbookis the result of an extensive review of publiclyreported performance indicator data fromacross the country. This review is an importantfirst step and a seminal platform upon whichto obtain an overview of the existing status ofhealthcare-related data in Canada.
I challenge you to carefully review the content of this chartbook and identify areas of meaning and significance. However, you are also encouraged to focus on the many unanswered questions posed as a result of the significant gaps of data. The selection, collection and application of performanceindicators will be improved when we acknowledge what truly exists – including the data’s quality and deficiencies.
It is essential that the patient/client remain inthe centre of our thinking as indicators are critiqued and examined. The AccreditationCanada standards consider a population healthfocus as fundamental to the provision ofhealthcare, whether within a clinical programor by the organization as a whole. Consider the wealth of knowledge that could be gained when we can all review a consistent,
comprehensive pan-Canadian populationhealth-based data set. Our ability to moreeffectively design and provide healthcarewould escalate dramatically and the overallbenefits would be vast.
The stage is set. Stakeholders from across the country have indicated their strong desirefor improvement and alignment of data.Accreditation Canada is devoted to this goaland is a committed partner in this strategicjourney. We all have a vested interest in collaboratively building on the excellent information that currently exists and taking itto a new level – a level within which healthcaredata will support increasingly effective decision-making and enable measurable improvementsin the quality of healthcare and in the qualityof health of Canadians.
Wendy NicklinPresident and Chief Executive OfficerAccreditation Canada
FOREWORD

10
Quality of Healthcare in Canada: A Chartbook
This chartbook is a compendium of data,encapsulating the efforts of many analysts andresearchers who study and report on healthcaresystems in Canada and internationally. We areindebted to all those who have produced usefuldata and who are involved in efforts to furtherthe field of quality measurement and reporting.
We are grateful to the Canadian HealthServices Research Foundation (CHSRF) and inparticular to Susan Law, who invited us toundertake the chartbook project. We wouldalso like to express our appreciation to KayePhillips, Denice Lewis, Beth Everson, AniqueTurgeon, and Kerrie Whitehurst from CHSRF,who have worked tirelessly behind the scenes
in critically important support roles. CHSRF provides support to a wide range of qualityimprovement work and is a staunch supporterand enabler of evidence-based decision-makingin healthcare systems around the world. It hasbeen a privilege to work with them.
Special thanks go to the members of the chartbook project’s steering committee: Claudia Sanmartin of Statistics Canada; GregWebster of the Canadian Institute for HealthInformation (CIHI); Diane Watson from theCentre for Health Services and Policy Research,University of British Columbia; Marie Owenfrom the Canadian Patient Safety Institute(CPSI); Christopher Dean from Accreditation
Canada; Don MacDonald from the Newfoundlandand Labrador Centre for Health Information;and Alan Katz from the Centre for HealthPolicy, Departments of Family Medicine andCommunity Health Sciences, University ofManitoba. The committee provided invaluableadvice and assistance, guiding us through themaze of data and contextual issues in Canadaand its composite jurisdictions.
Without the invaluable input of these colleagues,the chartbook would not have been possible.
KS and SL
ACKNOWLEDGEMENTS

11
Sheila Leatherman CBE, FRCP (Hon) is aResearch Professor at the School of PublicHealth, The University of North Carolina atChapel Hill, and Visiting Professor of theLondon School of Economics. She conductsresearch and policy analysis internationally,focusing on quality of care, health systemsreform, and methodologies for evaluating theperformance of healthcare systems. She hasreceived various honors for her work, includingbeing elected to the U.S. National Academy ofSciences in 2002 as a member of the Instituteof Medicine and being made an HonoraryFellow of the Royal College of Physicians (2006).
Since 1997 she has worked in the U.K. as anindependent evaluator of the impact on qualityof care in the National Health Service ofLabour Government reforms, resulting in threebooks. In 2007, she was awarded the honour of Commander of the British Empire (CBE) byQueen Elizabeth for her work over the pastdecade with the National Health Service. In theU.S., she has authored a series of books onquality of healthcare: general (2002), child and adolescent health (2004), and Medicarepopulation (2005).
She is the research advisor to a four-yeardemonstration project, funded by the Bill andMelinda Gates Foundation, to develop and testinnovations to link health programs withmicrocredit in India, West Africa, Bolivia andthe Philippines as a global strategy for povertyreduction and health protection. She is alsoconducting a two-year project to assess theglobal evidence of the impact of systematicallyintegrating microfinance and health accessinterventions for the poor.
She has a broad background in healthcaremanagement in state and federal health agencies,as chief executive of an HMO and as a seniorexecutive of United Health Group in the U.S.She is active in humanitarian relief in thedeveloping world through serving for twoorganizations as a trustee and active volunteer:Freedom from Hunger (microcredit and health)and the American Refugee Committee (refugeesand displaced persons in six countries).
ABOUT THE AUTHORSKim Sutherland MSc, MBA, PhD is a Fellow at the Judge Business School, University ofCambridge. Her work concentrates on theinteractions between research evidence, policyand clinical practice in healthcare systems.Her current research interests focus on qualityof healthcare and organizational change.Together with Sheila Leatherman, she hasundertaken a series of studies evaluating theBritish Labour Government’s 10-year qualityagenda for the National Health Service (NHS).She has co-authored a series of chartbooksdepicting quality of healthcare from a range of perspectives: geographical (within Englandand across the countries of the UnitedKingdom); disease-focused (e.g. strokepatients); and in different quality domains (e.g. patient-centredness).
Dr. Sutherland is currently working as co-principal investigator in a multidisciplinary,multi-year project, funded by the U.K.’s HealthFoundation, which seeks to monitor performanceand inform efforts to improve quality andcost-effectiveness in the NHS.
Her work has been published in numerousbooks and peer-reviewed journals.
12Quality of Healthcare in Canada: A Chartbook
EXECUTIVE SUMMARY
accessibility, validity, diversity of perspectives,and balance in presentation of data.
The data are presented in six key domains: the effectiveness of the healthcare sector inimproving health outcomes; access to healthcareservices; the capacity of systems to deliverappropriate services; the safety of care delivered;the degree to which healthcare in Canada ispatient-centred; and equity in healthcare outcomes and delivery. Below are key findingsfrom each of the six domains.
EffectivenessEffectiveness in healthcare refers to the extentto which an intervention, whether a service,visit, procedure or diagnostic test, produces the intended result. It also refers to the appropriateness of care – whether interventionsare provided to those who would benefit fromthem and/or withheld from those who wouldnot. Effectiveness measures focus on both outcomes and processes. As in many othercountries, Canada has seen a significant declinein mortality rates from major killers such ascancer and heart disease in recent years.
Immunization rates, both childhood immunizations and influenza vaccination inpeople aged 65 and over, are relatively low inCanada compared to other developed countries.
There is considerable variation across provincesfor a wide range of effectiveness indicators.While the provinces typically outperform theterritories, there is no clear pattern acrossprovinces, with no one either excellent in allareas or performing uniformly poorly.
Lack of standardized information about health-care delivery and adherence to evidence-basedprocesses of care across the country hampersthe ability to draw more conclusions about the effectiveness of healthcare in Canada.
AccessAccess to healthcare is a prominent concern ofpatients and the public around the world. InCanada, a 2007 public survey found that waittimes were the most commonly cited concernamong a range of healthcare issues.
If we could first know where we are, and whither we are tending, we could then better judge what to do, and how to do it. Abraham Lincoln, 1858
The availability of robust, coherent, defensibleand credible data on healthcare system performance is an essential component of anyeffort to improve quality. Decision makers needa shared understanding of the magnitude andnature of problems facing healthcare systems,along with a basis for communication and co-operation among the many stakeholdersresponsible for the delivery of health servicesand enhancing health outcomes. In recentyears, the amount of available data and information relevant to the quality of healthcare in Canada has grown – produced by national, provincial, territorial, academic, professional and patient organizations. Thischartbook seeks to draw these disparate piecesof data together to build a broad and coherentpicture of the quality of healthcare in Canada.The approach adopted for this Canadian chartbook builds upon that developed by theauthors for similar chartbooks in Australia, the United States, and the United Kingdom.
The chartbook takes a multifaceted approach toassessing quality and examines international,national and provincial/territorial data. It hasbeen designed using four guiding principles –
13
The majority of Canadians (more than 80%)have access to a regular doctor. However, lackof access is a problem in the territories: in the10 largest communities of Nunavut in 2007,only 13.4% of respondents to the CanadianCommunity Health Survey indicated that theyhad a regular doctor; 40.8% of respondents inthe Northwest Territories did so. The situationwas better in Yukon, where 77.9% reportedsuch access, closer to the Canadian average.
Canada does not fare well in a number ofinternational comparisons. Patients in Canadawait longer for primary care appointmentsthan those in many other developed countries,and a significant proportion of emergencydepartment visits in Canada are attributed to limited availability of primary care. Thisgreater use of the emergency department forprimary care may be a factor in the longerwait times found in Canadian emergencydepartments compared to those in other countries,although there is evidence that simply havinga general practitioner does not necessarilyreduce emergency department use.1
Within Canada, there is considerable variationacross provinces in wait times for key proceduresranked by priority in the 10-Year Plan toStrengthen Health Care (joint replacements,
cataract surgery, radiotherapy, coronary arterybypass graft, MRI). The longest waits were forjoint replacements.
CapacityThe provision of reliable, high-quality healthcaredepends upon having sufficient capacity tomeet individual and population needs. Capacityencompasses the necessary financial resources(spending), personnel, equipment, informationtechnology, and pharmaceuticals.
Across developed economies generally, spendingper person on healthcare has grown steadily inthe past decade or so. Canada is in the top 20%of OECD countries in per-person spending onhealthcare. However, as a proportion of GDP,healthcare spending in Canada in 2006 wasalmost the same as it was in 1992. This differsfrom the situation in many other developedcountries, which have seen (sometimes dramatic)increases in the proportion of national wealthdedicated to health. Across provinces, spendingvaries from a low of $4,653 per capita in Quebecto a high of $5,730 per capita in Alberta.Spending is much higher in the territories thanin the provinces, reflecting stark differences in geography, population density, healthcare needs,and delivery models.
In terms of healthcare personnel, Canada has arelatively low level of practising physicians perperson, at 1.0 per 1,000 population. However,when these data are further stratified into generalpractitioners and specialists, Canada fares betterin terms of general practitioners. There is markedvariation within the country, with practisingphysicians at a low in Nunavut, with 0.4 per1,000 population, and at a high in Nova Scotia,with 2.6 per 1,000 population in 2006.Offsetting the shortage of physicians, to someextent, is a higher number of practising nursesin the territories; there were 14.2 practisingnurses per 1,000 population in the NorthwestTerritories/Nunavut in 2006, compared to 6.7 per1,000 population in British Columbia.
Capacity also encompasses the use of healthinformation technology, which can enable dramatic transformations in the delivery ofhealthcare, particularly in a country likeCanada, with its large size and dispersed population. The use of information technologyin Canada appears less well developed than inmany comparable countries. This may changeif a national plan to introduce electronic healthrecords is implemented.
1 See “Myth: Emergency room overcrowding is caused by non-urgent cases” (Mythbusters, October 2009), www.chsrf.ca

14Quality of Healthcare in Canada: A Chartbook
SafetySafety – the elimination of unnecessary risk ofharm to patients – is a fundamental attributeof quality in healthcare. In recent years, safetyhas come to the fore as a pressing concern for policy makers, patients, managers, and healthcare professionals. As is the case withmany developed countries, it is difficult to finddetailed data on adverse incidents acrossCanada. It is also difficult to interpret the datathat do exist. There is a perennial question ofwhether a measured increase in adverse eventsreflects a negative situation of worsening safetyor care, or a positive situation of better reportingof safety problems, making it possible to analyzeand improve them.
Juxtaposing staff-reported adverse events withpatient reports can help unravel what is actuallyhappening in healthcare settings. According topatient surveys, up to one-fifth of patients inCanada report experiencing a medication erroror medical mistake (although the veracity of thepatients’ perspective has not been corroborated).
Hospital-acquired infections are a serious safetyissue for Canada. Within Canada, westernprovinces report the highest rates of MRSA, a common hospital-acquired infection.
Process measures that gauge the extent to whichhealthcare providers comply with evidence-basedguidelines for improving safety (e.g. hand hygieneregimens, alert systems in place for potentiallydangerous prescribing) can provide valuableinformation on safety of care. While country-widedata on the level of investment in, and operationalization of, safety strategies are notavailable, Ontario does release such data forhospitals and reports a steady improvement incompliance with safety advice over the pastfew years.
Patient-CentrednessA concern for and responsiveness to patientpreferences, attitudes and experiences are alsokey components of quality. Responsiveness can entail improving access to treatment and information, ensuring participation inhealthcare decision-making, and supportinginvolvement in policy-making.
Canada, unlike many countries with qualityperformance frameworks, does not include an explicit focus on patient-centredness orresponsiveness in the conceptualization underpinning quality measurement and reporting.International surveys, however, reveal thatCanadians are relatively satisfied with the
healthcare they receive. One such study foundthat 61% of Canadian respondents rated thecare they had received in the preceding year asexcellent or very good, compared to 62% ofrespondents in the United Kingdom and 55%of respondents in the United States. Anotherinternational survey, this time of adults withhealth problems, found that 56% of Canadianrespondents indicated that their doctor alwaysinvolved them in decisions about treatment, a similar percentage to that in many othercountries and higher than in France, the United Kingdom and the United States.
EquityEquity is an underlying value and much-cherished tenet of healthcare across Canada,such that all people in Canada receive carebased on clinical need, and that healthcarecontributes to reduced differences in healthstatus and outcomes across groups. It is avalue that is difficult to track, due to thepaucity of timely data on equity and disparities.An exemplary model of comprehensive dataanalysis exploring the impact of socioeconomicstatus, sex and age on processes and outcomesof care has been undertaken by the ManitobaCentre for Health Policy.

15
Despite a lack of a comprehensive nationaldata set on equity, it is possible to draw some conclusions from the data that are available. Notably, there are serious concernsabout deficiencies in the health status of aboriginal people and their ability to accesshigh-quality healthcare.
Furthermore, as is the case in many developedcountries, there is a clear correlation betweenlow income/socioeconomic status and poorhealth status in Canada. This does not appearto be related to healthcare cost concerns.However, an international survey did find that16% of Canadian respondents indicated thatthey did not fill a prescription or skippeddoses, and that 29% did not seek needed dentalcare – both areas that are not publicly fundedin Canada – because of cost concerns.
Concluding CommentsThe data presented in this chartbook identifyareas where Canada performs well in terms of the quality of the healthcare provided toCanadians and areas that require improvement.The findings should be useful in informing thedevelopment of policies and initiatives toaddress specific quality problems in Canada’shealthcare, and lead to better outcomes forpatients. They provide a baseline against whichthe impact of future quality improvements canbe measured. Perhaps most significantly, theyunderscore the need for improved nationaldata standards, collection and analysis, so thatfurther aspects of quality can be assessed andmonitored over time. Patients, practitioners,policy makers and health administrators wouldall benefit from such an initiative.

16Quality of Healthcare in Canada: A Chartbook
Assessing healthcare quality is a crucial step inimproving care and service delivery. Data on thequality and performance of healthcare hold thepotential to guide quality improvement activities;redesign services; keep people and organizationsaccountable for their performance; change policyand practice; and inspire public debate. By collecting, analyzing and reporting healthcare data,it becomes possible to identify the areas whereperformance is deficient, develop solutions,galvanize action, and monitor progress.
Many national, provincial, territorial andregional healthcare organizations in Canadahave undertaken initiatives to report on thestate of quality for a specific jurisdiction, areaof delivery or unique dimension of quality. Todate, other countries – including the UnitedStates, the United Kingdom and Australia –have successfully embarked upon activities todraw together data to assess various aspects of
quality, compare themselves on an internationalscale and ultimately, improve the quality of careand service delivery to patients (Leathermanand McCarthy, 2002; Leatherman et al, 2008;Clinical Excellence Commission, 2008).However, there have been no reports that provide a comprehensive and rigorous account of the overall quality of healthcare in Canada in relation to national and international benchmarks.
Building on the success of the chartbookmodel, the Canadian Health Services ResearchFoundation (CHSRF), the Canadian Institute forHealth Information (CIHI), and the CanadianPatient Safety Institute (CPSI) have jointlycommissioned, with support from StatisticsCanada, the first-ever Canadian chartbook onhealthcare quality. This chartbook provides dataon the quality and performance of healthcare,serving as a tool to support and inform policy
and management decision-making, to identifygaps in data, to highlight potential areas forinvestment in quality improvement, and toprovide a baseline for future analysis.
Defining Quality in HealthcareQuality in healthcare is a multifaceted concept,with no single, universal definition or frameworkfor assessment. There is, however, a growingconsensus about the key domains of quality in healthcare and the relevant measures andindicators to populate these domains (Instituteof Medicine, 2001; OECD, 2002; AHRQ, 2007).Table 1 outlines the six key domains that havebeen adopted by the authors to evaluate andmonitor quality of care in different jurisdic-tions (Leatherman and Sutherland, 2003; 2005;2008). This framework has also been adoptedfor the development of this Canadian chartbookon quality.
INTRODUCTION AND BRIEF OVERVIEW

17
Quality domain Principle Examples of measuresEffectiveness Healthcare services should be based, as far as possible, on relevant • Mortality rates
rigorous science and research evidence. • Compliance rates with evidence-based guidelines
Access Healthcare services should be provided at the time they are needed • Provision of emergency carewithin the appropriate setting. • Availability of specialist care or rehabilitation
Capacity Healthcare systems should be sufficiently well resourced to enable delivery • Staffing levelsof appropriate services. • Number of scanners
• Information technology
Safety Patients should not be harmed by the care that they receive or exposed • Nosocomial infectionsto unnecessary risk. • Medication errors
• Falls
Patient-centredness Healthcare should be: • Patient evaluations of care
1. based on a partnership between practitioners and patients • Shared decision-making
(and where appropriate, their families) • Patient experiences and interactions with staff
2. delivered with compassion, empathy and responsiveness to the needs, values and preferences of the individual patient.
Equity Healthcare should be provided: • Comparisons of care provided across different
1. on the basis of clinical need, regardless of personal characteristics such as age, sub-populations (for example, older people
gender, race, ethnicity, language, socioeconomic status or geographical location versus entire population)
2. in such a way as to reduce differences in health status and outcomes • Mortality rates by socioeconomic status
across various subgroups.
Source: Leatherman and McCarthy, 2002; Leatherman et al, 2008
Table 1: Six domains used as organizing principles for quality chartbooks

18Quality of Healthcare in Canada: A Chartbook
Introduction to the ChartsThis chartbook has been designed with threekey guiding principles in mind:(1) Accessibility: in presenting charts that are,
to the degree possible, comprehensible andcomprehensive, the chartbook provides anaccessible overview of quality in healthcarein Canada for both expert and non-expertaudiences. Technical information (such as sample size, confidence intervals, standardization techniques, as well ashyperlinks, where available, to the site from which the source material has beendrawn) and metadata are provided in theTechnical Appendix.
(2) Diversity of perspectives: drawing on relevant data sets from general and specialist sources, and combining them in away that illustrates the multifaceted natureof quality, the chartbook presents viewsfrom different perspectives and differentstakeholders within the healthcare sector.
(2) Balance in presentation of data: presentingdata in varied formats, the chartbook provides different types of information:
• longitudinal data to show changes over time;• “snapshot” accounts of quality at a
particular point in time (generally the most recent data available in the publicdomain); and
• comparative data to show differences in performance and facilitate benchmarkingacross countries, regions or provinces and territories.
Several criteria were used to determine whichindicators to include in the chartbook:• relevance: indicators are clinically meaningful
in terms of processes and outcomes of careor important reflections of patient experience
• methodological rigour: the data have credibility and validity and the indicators are derived from a sound evidence base
• balance: the data contribute to a multifacetedpicture of quality in care
• timeliness: the data provide an up-to-dateassessment of quality
• availability: for some key indicators nationaldata were unavailable. Rather than omitsuch indicators, the chartbook presents datafrom specific provinces to act as exemplarsfor future data-reporting development.
The selection of indicators to be included inthis chartbook has been driven by a desire tobe fair and rigorous. Normally this wouldmean excluding data that are more than fiveyears old, based on a concern that includingout-of-date data in the rapidly developing arenaof healthcare could be potentially misleading.
However, the situation in Canada is complicatedby the jurisdictional arrangements for healthcarepolicy-making and delivery, and historicalvariation among provinces and territories with respect to standards, data definition andcollection, analysis and reporting. The chartbookbalances issues of relevance, timeliness andavailability. This means that, in an effort toprovide a comprehensive picture of quality,some datasets are more than five years old and some data focus on a single province,rather than being national in scope.
In order to provide a picture of quality inCanada as a whole, the chartbook utilizes secondary data, bringing together disparateanalyses and information that are already inthe public domain. Data were collected throughextensive searches of peer-reviewed, grey andelectronic literature and an examination oflarge amounts of data produced by a wide rangeof international and Canadian organizations. Inall cases, the data were the most current availableat the time of completing this work. Ongoingreleases of information will, of course, meanthat some chartbook data may be supersededafter publication. To address this issue, thechartbook provides links to sources so thatinterested readers can gain access to relevantupdates. There are some cases (for instance,

19
data to support inter-provincial/territorialanalysis of “mortality from causes consideredamenable to healthcare”) where more up-to-datedata may be available, but resource limitationshave meant that requisite data analysis has notyet been done. In those cases, already-analyzeddata are used.
Quality data reporting inCanadian healthcare: Areas for improvementIn compiling this chartbook, the paucity ofnational-level data that are uniform withrespect to standards, collection and storagewas striking. This is a significant impedimentto assessing the quality of healthcare in Canada.
The lack of a comprehensive, national data seton quality is probably a legacy of the historical,cultural and political context in Canada, whichhas meant that each province and territory hasbuilt its own system for collecting, collatingand reporting quality-of-care data. In recentyears this has been recognized as a problem,and efforts to resolve it have begun. Issuespersist, however, particularly with data compatibility and the lack of standardized datasets and reporting conventions. This deficit innational-scale, readily accessible and standardizeddata has been somewhat addressed by heavy
4. Portability: All citizens can travel throughoutCanada and remain eligible for coverage inall provinces and territories.
5. Accessibility: Services should be providedon a basis that does not impede or preclude(for example, through additional charges)reasonable access to those services.
Healthcare systems in Canada provide “medically necessary hospital care, physicianservices and dental surgery requiring hospitalization” (Health Canada, 2008). Theydo not, as a rule, cover non-surgical dentalcare, eyecare, prescription medications, ambulance services, medical devices or out-of-country healthcare. However, provincialand territorial systems vary considerably infinancing and administration and some covera range of services that would otherwise notbe part of the healthcare system, based onlocal health priorities, policy preferences and financial circumstances (Flood andArchibald, 2001).
While healthcare in Canada is constitutionallya provincial and territorial responsibility, thefederal government also plays a role. Itadministers the principles of the Canada
At a glance: The Canadian healthcare systemThe term “healthcare system” as it applies toCanada is actually a misnomer. It is moreproperly a set of 14 separately administeredsystems including ten provincial, three territorial and one federal system (the federal system provides primary and supplementary health services to aboriginalpopulations, federal police, military personnel and prisoners, among others).
The Canada Health Act sets out five principles under which these systems must operate:
1. Public administration: The health insuranceplan of a province or territory must beadministered and operated on a non-profitbasis by a public authority accountable tothe provincial/territorial government.
2. Comprehensiveness: The provinces and territories must provide medically necessary hospital and physician servicesand, where permitted, also cover servicesrendered by other healthcare practitioners.
3. Universality: Provincial and territorialhealth insurance plans must entitle 100%of eligible residents to insured health services on uniform terms and conditions.

Quality of Healthcare in Canada: A Chartbook
20
health research, and delivers public healthprograms. In addition, the federal governmentis a direct provider of primary and supplementary health services to select populations as above (Health Canada, 2005).
reliance on patient survey data. Surveys suchas the Canadian Community Health Survey aresent to Canadians across the country, andresponses provide a picture of quality that isbased on common metrics. While this is usefulinformation, it gives only one perspective: thatof the patient. A comprehensive review ofquality data should ideally encompass clinicaldata, supplemented by routinely collectedadministrative data on access, capacity, equity,and responsiveness, among other critical topics.
While it is often difficult to navigate thelabyrinth of reporting systems across the country, there are areas where progress hasbeen made. Data on wait times is one sucharea. Following pan-Canadian agreements onstandardized measurement and reporting forkey procedures (joint replacement, coronaryartery bypass graft, radiotherapy, cataract surgery,and MRI) it has become possible to make moremeaningful comparisons across the countryand to use benchmarking and shared knowledgeto drive improvements in healthcare. Further,there are pockets of excellence in reporting onquality data, including cancer reporting inOntario, reporting on health disparities inManitoba, and stroke reporting inSaskatchewan. This expertise and practice canand should be applied on a pan-Canadian basis.
Health Act and provides financial support tothe provinces and territories. In addition, thefederal government has a regulatory role(for example, in pharmaceutical regulation), collects and provides health data, funds
A 10-Year Plan to Strengthen HealthcareIn 2004, the Prime Minister and the 13 premiers of the provinces and territoriesagreed on a 10-year plan to strengthenhealthcare in Canada. The agreement emphasized the following principles:
• commitment to the principles of theCanada Health Act;
• access to medically necessary health services based on need, not ability to pay;
• reforms to ensure that all Canadians havetimely access to needed healthcare services;
• collaboration between all governments,working together in common purpose to meet the evolving health care needs of Canadians;
• advancement through sharing of best practices;
• continued accountability and provision ofinformation to make progress transparentto citizens; and
• jurisdictional flexibility.
The plan sought to secure improvements inthe quality of healthcare across Canada;many of the time-series data presented in the chartbook indicate that there have beenimprovements in several dimensions,although the work is not yet done.

21
Unlike many other countries, Canada has veryfew clinically driven national medical qualitystudies or evaluations that study the quality of care, particularly disease or specialty areas.England, for example, has an influential set ofnational clinical audits that were instigated bythe Royal College of Physicians, and the UnitedStates has a number of national-level qualitymeasurement systems. These evaluations lookat the process and outcomes of care for specificclinical conditions and have been very successfulin highlighting deficiencies in quality of care,catalyzing action to develop consensual
standards, and engaging healthcare providersin quality improvement activities. In Canada,the first step in establishing national clinicalaudits or quality-measurement initiatives –defining key performance indicators – has, in many areas, been taken. For example, theCanadian Cardiovascular Outcomes ResearchTeam (CCORT) has published evidence-basedsets of performance indicators for heart failureand for coronary heart disease (Tu et al., 2008).However, questions remain about how best toimplement the use of established indicatorsand stimulate other changes required to drivequality improvement.
Outcome measures such as mortality rates areavailable on a national basis; however, theseoutcomes are not accompanied by critical dataon adherence to evidence-based care standards– an essential element of being able to developeffective quality improvement strategies.

22
EffectivenessQuality of Healthcare in Canada: A Chartbook

Introduction 25Chart 1.1 Mortality from causes amenable to healthcare:
International 26
Chart 1.2 Life expectancy at birth: International 27
Chart 1.3 Life expectancy at birth: Canada 28
Cancer 29Chart 1.4 Cancer mortality: International 30
Chart 1.5 Potential years of life lost to cancer: International 31
Chart 1.6 Cancer mortality: Canada 32
Chart 1.7 Lung cancer: Mortality and potential years of life lost, international 33
Chart 1.8 Colorectal cancer: Mortality and potential years of life lost, international 34
Chart 1.9 Breast cancer: Mortality and potential years of life lost, international 35
Chart 1.10 Prostate cancer: Mortality and potential years of life lost, international 36
Chart 1.11 Cancer: Relative survival ratios, Canada 37
Chart 1.12 Cancer: Relative survival ratios, provinces 38
Chart 1.13 Guideline-compliant cancer care: Ontario 39
23
Effectiveness
EFFECTIVENESSCirculatory Disease 41Chart 1.14 Mortality from circulatory disease: International 42
Chart 1.15 Potential years of life lost to circulatory disease:International 43
Chart 1.16 Mortality from circulatory disease: Canada 44
Coronary Heart Disease 45Chart 1.17 Mortality from AMI: International 46
Chart 1.18 Potential years of life lost to AMI: International 47
Chart 1.19 Mortality from AMI: Canada 48
Chart 1.20 AMI Re-admission within 28 days: Canada 49
Chart 1.21 Secondary prevention of AMI: Saskatchewan 50
Stroke 51Chart 1.22 Cerebrovascular disease mortality: International 52
Chart 1.23 Potential years of life lost to cerebrovascular disease:International 53
Chart 1.24 Mortality from cerebrovascular disease: Canada 54
Chart 1.25 Public awareness of stroke as medical emergency: Canada 55
Chart 1.26 Emergency transport for stroke: Ontario 56
Chart 1.27 Emergency imaging and thrombolysis for stroke: Ontario 57
Chart 1.28 Dysphagia screening by hospital type: Ontario 58
Chart 1.29 Secondary prevention for stroke: Ontario 59

Respiratory Disease 61Chart 1.30 Respiratory disease mortality: International 62
Chart 1.31 Respiratory disease mortality: Canada 63
Chart 1.32 COPD in Canada: Diagnosis and spirometry 64
Diabetes 65Chart 1.33 Monitoring glycemic control in people
with diabetes: International 66
Chart 1.34 Diabetes care processes: International 67
Chart 1.35 Diabetes care processes: Canada 68
Chart 1.36 Diabetes control: Saskatchewan 70
Mental Health and Mental Illness 71Chart 1.37 Mortality and potential years of life lost to suicide:
International 72
Chart 1.38 Potential years of life lost to suicide: Canada 73
Chart 1.39 Hospitalization due to suicide attempts: Canada 74
Chart 1.40 Mental health services: Re-admission within 30 days of discharge: Canada 75
24
EffectivenessQuality of Healthcare in Canada: A Chartbook
Prevention and Health Promotion 76Chart 1.41 Childhood immunization: International 77
Chart 1.42 Flu vaccination among people aged 65+: Canada 78
Chart 1.43 Monitoring blood pressure and cholesterol: International 79
Chart 1.44 Monitoring blood pressure and cholesterol: Canada 80
Chart 1.45 Screening for breast cancer: Canada 81
Chart 1.46 Adherence to colorectal cancer screening guidelines: Canada 82
Chart 1.47 Cervical cancer screening: Canada 83
Appropriateness 84Chart 1.48 Hospitlizations for ambulatory care
sensitive conditions: Canada 85
Chart 1.49 Re-admission after discharge: International 87
Chart 1.50 Caesarean sections: Canada 88

25
Effectiveness
In the context of the quality of healthcare,effectiveness is concerned with the extent towhich an intervention (service, visit, procedure,diagnostic and others) produces the intendedresult for the patient. It also encompasses theconcept of appropriateness; that is, the extentto which interventions are provided to thosepatients who would benefit and withheld fromthose who would not. Effectiveness indicatorscan measure:• outcomes, such as mortality rates, survivalrates or changes in health or functional status, which reflect the impact of prevention, diagnosis and treatment of disease or ill-health; or
• processes, such as prescribing rates, medicalprocedures and compliance with evidence-based guidelines, which have been proven to affect outcomes in specific clinical conditions and can provide a more immediate measure of quality.
The chapter opens with two broad indicators of effectiveness: mortality rates from diseasesamenable to healthcare and life expectancy.Data are then organized into separate sectionsfocusing on disease areas that:1. have the most impact on Canadians in terms of mortality, morbidity, economic burden (see for example, rankings shown inTable 1.1, below);
2. are amenable to healthcare; 3. have a strong evidence base in terms of best clinical practice; and
4. have relevant data available.
Introduction
Table 1.1: An overview of diseases important in Canada Mortality Morbidity (total days stay in acute care) Economic Burden
Rank 1 Cancer Circulatory disease Cardiovascular disease
Rank 2 Heart disease Cancer Musculoskeletal disease
Rank 3 Stroke Mental health Cancer
Rank 4 Chronic respiratory disease Injuries/poisoning Injuries
Rank 5 Accidents Digestive disease Respiratory disease
The disease areas included in this chapter are: • Cancer• Circulatory disease - Coronary heart disease- Cerebrovascular disease/stroke
• Diabetes• Respiratory disease• Mental healthThe chapter closes with sections on health promotion and prevention, and appropriateness.
Sources: Statistics Canada, online a; CIHI, 2001; Health Canada, 1998
88.0
71.3
88.9
76.8 75.6
64.8
88.4
82.1
130.0
102.8
114.7
109.7
0
30
60
90
120
150
United
State
s
United
King
dom
Swed
enFra
nce
Canad
a
Austr
alia
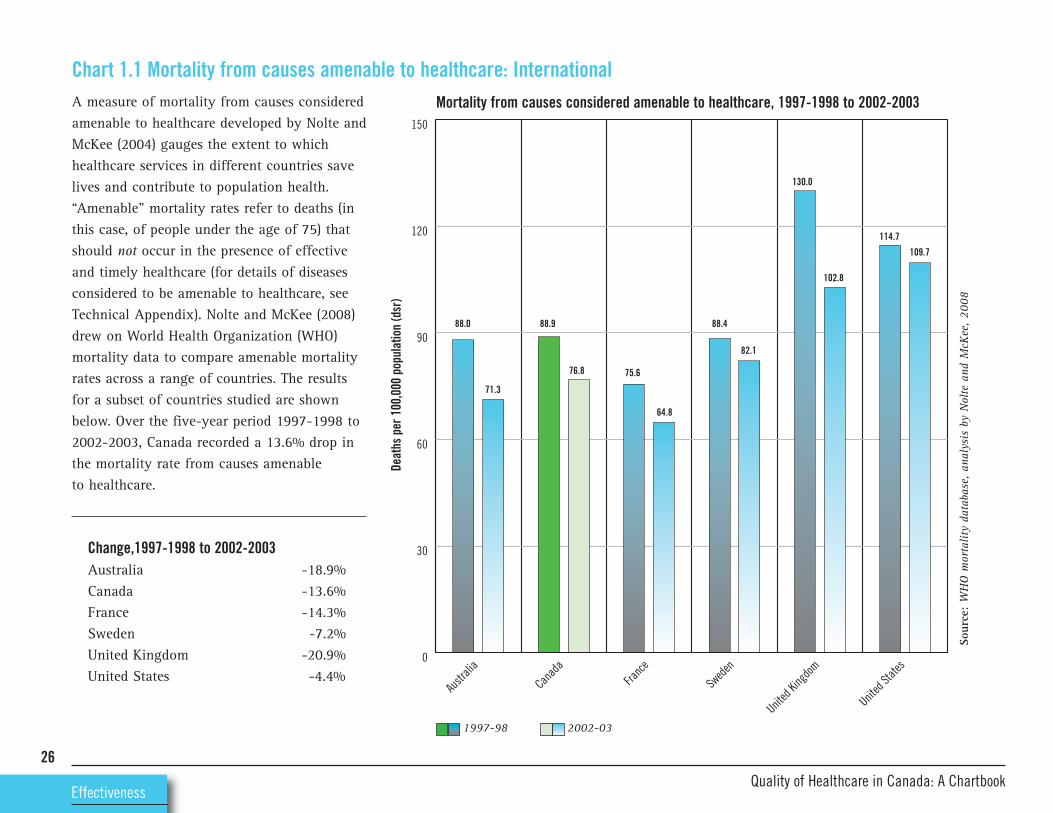
A measure of mortality from causes consideredamenable to healthcare developed by Nolte andMcKee (2004) gauges the extent to whichhealthcare services in different countries savelives and contribute to population health.“Amenable” mortality rates refer to deaths (inthis case, of people under the age of 75) thatshould not occur in the presence of effectiveand timely healthcare (for details of diseasesconsidered to be amenable to healthcare, seeTechnical Appendix). Nolte and McKee (2008)drew on World Health Organization (WHO)mortality data to compare amenable mortalityrates across a range of countries. The resultsfor a subset of countries studied are shownbelow. Over the five-year period 1997-1998 to2002-2003, Canada recorded a 13.6% drop inthe mortality rate from causes amenable to healthcare.
Change,1997-1998 to 2002-2003Australia -18.9%Canada -13.6%France -14.3%Sweden -7.2%United Kingdom -20.9%United States -4.4%
26
EffectivenessQuality of Healthcare in Canada: A Chartbook
Chart 1.1 Mortality from causes amenable to healthcare: International
Sour
ce:WHO mortality database, analysis by Nolte and M
cKee, 2008
Mortality from causes considered amenable to healthcare, 1997-1998 to 2002-2003
Deaths per 100,000 population (dsr)
1997-98 2002-03

76.1
81.1
76.6
80.4
75.6
80.9
77.0
80.8
74.8
79.1
74.7
77.8
0
20
40
60
80
100
United
State
s
United
King
dom
Swed
enFra
nce
Canad
a
Austr
alia
Life expectancy is the number of years a personis expected to live if current age-specific mortalityrates continue. Quality of healthcare is only oneof many factors that influence life expectancy.Others include social and behavioural norms,relative wealth, and socioeconomic disparities.The chart shows that life expectancy has beensteadily increasing across developed countries.Between 1986 and 2006, the greatest increasewas seen in France (5.3 years; 7% increase)and the smallest increase in the U.S. (3.1 years;4.1% increase). Canada recorded an increase of3.8 years (a 5% increase).
Change in life expectancy,1986-2006Australia 6.6%Canada 5.0%France 7.0%Sweden 4.9%United Kingdom 5.7%United States 4.1%
27
Effectiveness
Chart 1.2 Life expectancy at birth: International
Sour
ce:OEC
D, 2008
Not
e:Canada, U.K. and U.S. data are 2005, not 2006.
Life expectancy at birth, 1986 and 2006
Years
1986
2006

77.8
80.8
76.7
78.2
76.4
79.9
77.3
79.677.7
80.1
77.3
80.9
78.0
81.1
77.679.3
78.179.4
78.180.5 78.4
81.4
75.7
0
20
40
60
80
100
Territo
ries
British
Columbia
Albert
a
Saska
tchew
an
Manito
ba
Ontario
Quebe
c
New Brun
swick
Nova Sc
otia
Princ
e Edw
ard
Islan
d
Newfou
ndlan
d
and L
abrad
orCAN
ADA
In the 15-year period between 1991 and 2006,life expectancy increased across all provincesof Canada, ranging from a 1.5-year increase(2.0%) in Newfoundland and Labrador to a 3.6-year increase (4.7%) in Quebec. The differencebetween shortest and longest life expectancy,by province, has increased over the period. In1991, life expectancy at birth in British Columbiawas 2.0 years (2.6%) higher than that in PrinceEdward Island. In 2006, life expectancy at birthin British Columbia was 3.2 years (4.1%) higherthan that in Newfoundland and Labrador.Differences are greater when comparisons withthe territories are included (data available onlyfor 2006). In 2006, life expectancy at birth inBritish Columbia was 5.7 years (7.5%) higherthan that in the territories.
28
EffectivenessQuality of Healthcare in Canada: A Chartbook
Chart 1.3 Life expectancy at birth: Canada
Sour
ces:
Statistics Canada, Canadian Vital Statistics
Life expectancy at birth, 1991 and 2006
Years
1991
2006

Cancer arises from abnormal and uncontrolledcell division. The proliferating cells that resultinvade and destroy surrounding tissue. Spreadof cancer (or metastasis) can occur via thelymphatic system or the blood stream or acrossbody cavities such as the pleural and peritonealspaces, resulting in secondary tumours.
There are more than 200 types of cancer, eachwith different causes, symptoms and treatments.In 2009, it is estimated that there will be
29
Effectiveness
Cancer171,000 new cases of cancer (excluding non-melanoma skin cancer) in Canada and75,300 deaths attributed to the disease. On thebasis of current mortality rates, approximatelyone in every four Canadians will die from the disease. Cancer is the leading cause of premature death in Canada, and is responsiblefor more than one million potential years of life lost in Canada (Canadian CancerSociety, 2009).
Cancer is predominantly a disease of the elderly,with around 70% of cases occurring in peopleaged 60 and over. Breast, lung, bowel andprostate cancer are the most common types ofcancer in Canada. Together they account formore than half of all new cancers each year.

100
150
200
250United States
United Kingdom
Sweden
France
Canada
Australia
20052004200320022001200019991998199719961995199419931992
Comparisons of mortality rates can give someindication of quality of care but should beinterpreted with the understanding that manyother factors, such as lifestyle, genetics andenvironment, also contribute to both incidenceand mortality. International comparisons cangive insight into the extent to which deathsmay be amenable to healthcare, or preventable.The chart illustrates that Canada has highmortality rates overall, relative to many comparator countries. However, these datarefer to all age groups. When the potentialyears of life lost are calculated, Canada’s relativeperformance is stronger (see next page) indicatingthat, compared to other countries, there arefewer premature deaths from cancer in Canada.At a provincial level, mortality rates for allcancers combined are higher in Atlantic Canadaand Quebec (and for females in Manitoba) andlower in Western Canada (data not shown, seeCanadian Cancer Society, 2009).
% change 1992-2005Australia -13.2%Canada -8.9%France -11.8%Sweden -4.5%United Kingdom -16.5%United States -15.1%
Note: Australia data, 2003; Canada and Sweden data, 2004.30
EffectivenessQuality of Healthcare in Canada: A Chartbook
Chart 1.4 Cancer mortality: InternationalMortality from cancer, 1992-2005
Deaths per 100,00 population (dsr)
Source: OECD, 2008

600
800
1000
1200United States
United Kingdom
Sweden
France
Canada
Australia
20052004200320022001200019991998199719961995199419931992
Potential Years of Life Lost (PYLL) is a summarymeasure of premature mortality. It is calculatedby totalling the deaths from cancer occurringat each age and multiplying this figure by thenumber of remaining years of life up to aselected age limit (in the case of OECD data, 70 years). Canada saw a steady reduction inthe years of life lost to cancer between 1992and 2004 and has maintained its position relativeto comparator countries.
% change 1992-2005Australia -22.6%Canada -20.3%France -16.6%Sweden -17.2%United Kingdom -25.6%United States -22.9%
Note: Australia data, 2003; Canada and Sweden, 2004.
31
Effectiveness
Chart 1.5 Potential years of life lost to cancer: InternationalPotential years of life lost, cancer, 1992-2005
YLL (<70yrs) per 100,000 population
Source: OECD, 2008

170.3
196.2
164.6
193.2
181.1 183.6
166.4174.2
160.4164.7152.5
246.5
195.2
380.3
0
50
100
150
200
250
300
350
400
Nunav
ut
Northw
est
Territo
riesYu
kon
British
Columbia
Albert
a
Saska
tchew
an
Manito
ba
Ontario
Quebe
c
New Brun
swick
Nova Sc
otia
Princ
e Edw
ard
Islan
d
Newfou
ndlan
d
and L
abrad
orCAN
ADA
Cancer mortality rates in 2005 varied acrossprovinces, from 152.5 deaths per 100,000 population (age standardized) in BritishColumbia to 196.2 deaths per 100,000 inNewfoundland and Labrador. This means that mortality rates in Newfoundland andLabrador were 29% higher than those in British Columbia.
32
EffectivenessQuality of Healthcare in Canada: A Chartbook
Chart 1.6 Cancer mortality: Canada
Sour
ces:Statistics Canada, Canadian Vital Statistics
Not
e: Rates for Yukon, the Northwest Territories and Nunavut should be interpreted with
caution due to small underlying count.
Mortality from cancer, 2005
Deaths per 100,000 population (age standardized)

20
30
40
50
60United States
United Kingdom
Sweden
France
Canada
Australia
20052004200320022001200019991998199719961995199419931992
In 2009, there will be an estimated 23,400 newcases of lung cancer in Canada. The disease isexpected to account for 20,500 deaths in 2009,making it the most common cause of cancerdeath (Canadian Cancer Society, 2009). Of thecountries shown, the U.K. recorded the steepestfall in death rates: a 22.8% fall between 1992 and2005. France and Sweden both recorded increasesin mortality (3.7% and 8.3% respectively). InCanada, the mortality rate fell by 7.6%between 1992 and 2004, reflecting, to a largeextent, the fall in smoking rates among theCanadian population. Survey data for Canadashow that, in 1994, 29.3% of the populationaged 12+ years were smokers, compared to21.9% in 2007. Notably, provincial-level smokingprevalence data show significant differencesacross Canada. In British Columbia in 2007,17.8% of those aged 12+ years were smokers,compared to 58.5% in the 10 largest Nunavutcommunities (CANSIM Table 105-05120).
33
Effectiveness
Chart 1.7 Lung cancer: Mortality and potential years of life lost, internationalMortality from lung cancer, international comparison, 1992-2005
100
150
200
250
300United States
United Kingdom
Sweden
France
Canada
Australia
20052004200320022001200019991998199719961995199419931992
Years of life lost (<70yrs), lung cancer, international comparison, 1992-2005
Deaths per 100,00 population (dsr)
YLL <7
0 years per 1
00,000 population
Source: OECD, 2008

10
15
20
25United States
United Kingdom
Sweden
France
Canada
Australia
20052004200320022001200019991998199719961995199419931992
In 2009, an estimated 22,000 new cases of colorectal cancer are expected to occur acrossCanada and the disease will account for about9,100 deaths (Canadian Cancer Society, 2009).The charts illustrate that, between 1992 and2004, mortality rates from colorectal cancerfell by 9% in Canada, compared to the 26% fallrecorded in the U.K., albeit from a substantiallyhigher starting point. Canadian data also showthat potential years of life lost per 100,000population fell by 16% between 1992 and2004. Provincial-level data show substantialdifferences: colorectal cancer mortality rates are approximately twice as high inNewfoundland and Labrador as they are in British Columbia (data not shown–seeCanadian Cancer Society, 2009).
34
EffectivenessQuality of Healthcare in Canada: A Chartbook
Chart 1.8 Colorectal cancer: Mortality and potential years of life lost, international
Source: OECD, 2008
Mortality from colorectal cancer, international comparison, 1992-2005
40
60
80
100
120United States
United Kingdom
Sweden
France
Canada
Australia
20052004200320022001200019991998199719961995199419931992
Years of life lost, (<70 yrs), colorectal cancer, 1992-2005Deaths per 100,000 population (dsr)
YLL (<70yrs) per 100,000 population

15
20
25
30
35
40United States
United Kingdom
Sweden
France
Canada
Australia
20052004200320022001200019991998199719961995199419931992
Worldwide each year, approximately 1.3 millionwomen are diagnosed with breast cancer; some519,000 will die from the disease (WHO, 2009).Although breast cancer incidence rates are rising in many western countries, deaths fromthe disease have decreased, generally attributedto improved screening and treatment (forscreening uptake data, see Chart 1.45). The latest Canadian estimates suggest that, in 2009,there will be 22,900 new cases of breast cancerand 5,400 deaths from the disease (CanadianCancer Society, 2009). Between 1992 and 2004,mortality rates in Canada fell by 25% and thenumber of years of life lost to breast cancerdecreased by 29%.
35
Effectiveness
Chart 1.9 Breast cancer: Mortality and potential years of life lost, international
Source: OECD, 2008
Mortality from breast cancer, 1992-2005
150
200
250
300
350United States
United Kingdom
Sweden
France
Canada
Australia
20052004200320022001200019991998199719961995199419931992
Years of life lost (<70yrs), breast cancer, 1992-2005
Deaths per 100,000 females (dsr)
YLL <7
0yrs per 100,000 females

15
20
25
30
35
40United States
United Kingdom
Sweden
France
Canada
Australia
20052004200320022001200019991998199719961995199419931992
The Public Health Agency of Canada estimatesthat, in 2009, there will be 25,500 new cases ofprostate cancer diagnosed and the disease willbe responsible for some 4,400 deaths (CanadianCancer Society, 2009). Between 1992 and 2005,mortality rates from prostate cancer in Canadafell by 26%. Only the U.S. recorded a steeperdecline (a 39% decrease between 1992 and 2005).Among the countries shown, Canada has thefewest years of life lost per 100,000 men under70 years of age. The Canadian Cancer Society(2009: 31) notes that the role of screening viaprostate-specific antigen (PSA) testing in reducingmortality is unclear, and that decreases inpotential years of life lost and mortality ratesprobably reflect improved treatment.
36
EffectivenessQuality of Healthcare in Canada: A Chartbook
Chart 1.10 Prostate cancer: Mortality and potential years of life lost, international
Source: OECD, 2008
Mortality from prostate cancer, 1992-2005
10
20
30
40
50United States
United Kingdom
Sweden
France
Canada
Australia
20052004200320022001200019991998199719961995199419931992
Years of life lost (<70 yrs), prostate cancer, 1992-2005Deaths per 100,00 males (dsr)
YLL (<70 yrs) per 100,000 males

87
91
94
82
86 87
58 6062
16 1515
0
20
40
60
80
100
LungColorectalBreastProstate
Relative survival ratios (RSRs) provide insightinto the impact of different types of cancer onlife expectancy. RSRs are defined as the ratio ofthe observed survival for a group of cancer patientsfive years after diagnosis to the survival expectedfor members of the general population. Thisgeneral population is assumed to be practicallyfree of that cancer and to have the same maincharacteristics associated with survival (such assex, age, and area of residence) as the cancerpatients (Statistics Canada, online b). Cancersurvival is affected by a range of factors outsideof the control of the healthcare system, such astumour characteristics, patient demographicsand lifestyle. However, RSRs do reflect qualityof care in terms of timeliness of diagnosis andprovision of appropriate treatment. Examinedover time, and together with incidence and mortality trends, RSRs can indicate progress incancer control. The chart illustrates RSRs for themost common cancers in Canada over a decadeand shows increases in survival for all exceptlung cancer. Of patients diagnosed with lungcancer between 2002 and 2004, only 15% survived for five years, a ratio comparable toother developed countries.
37
Effectiveness
Chart 1.11 Cancer: Relative survival ratios, Canada
Sour
ce: Canadian Cancer Registry database at Statistics Canada; analysis
by Health Statistics Division, Statistics Canada
Five-year relative survival ratios for common cancers, 1992 to 2002-2004
Age standardized re
lative survival ra
tio (%
)
1992 1995-97 2002-04

94
87
62
88
84
53
97
84
56
96
86
60
96
88
63
93
86
58
87 87
61
91
88
60
95
87
62
14
19
16151411
15
12 13
0
20
40
60
80
100
British
Columbia
Albert
a
Saska
tchew
an
Manito
ba
Ontario
New Brun
swick
Nova Sc
otia
Princ
e Edw
ard
Islan
dCAN
ADA
The five-year relative survival ratio for all cancers combined across Canada was 62%. Inother words, patients diagnosed with cancerbetween 2002 and 2004 were 62% as likely tolive for another five years as comparable members of the general population. The chartillustrates RSRs for the most common cancersacross Canadian provinces. While there was little provincial variation for breast cancer,age-standardized RSRs for prostate cancerranged from a low of 87% in Saskatchewan toa high of 97% in Nova Scotia. RSRs for colorectalcancer ranged from 53% in Prince Edward Islandto 63% in Ontario and, for lung cancer, rangedfrom 11% in Prince Edward Island to 19% inManitoba. Possible explanations for this variationinclude differences in population attributes ordifferences in health system performance, suchas differential patterns of use and diffusion ofscreening and early detection tests; varyingpatterns of diagnosis; and availability andaccess to specialized cancer treatments.
38
EffectivenessQuality of Healthcare in Canada: A Chartbook
Chart 1.12 Cancer: Relative survival ratios, provinces
Sour
ce: Canadian Cancer Registry database at Statistics Canada
Five-year relative survival, cancers diagnosed 2002-2004
Age standardized re
lative survival ra
tio (%
)
Prostate Breast Colorectal Lung

Measures of cancer mortality, survival andpotential years of life lost, although extremelyvaluable in contributing to judgments aboutquality in healthcare, are all imprecise indicatorsof performance. Based on “life and death” outcomes, they reflect many factors outside the control of the healthcare system. It can bedifficult to draw conclusions about performancebecause of long delays between changes in disease management and resultant changes in mortality/survival/PYLL data. Much moreimmediate insight into the quality of care isprovided by process measures. These measuresseek to ascertain the extent to which patientsare receiving evidence-based care. Such dataare not available for Canada as a whole.However, Ontario has a very comprehensivecancer-care reporting initiative. In the absenceof national data, this report focuses onOntario’s performance.
39
Effectiveness
Chart 1.13 Guideline-compliant cancer care: OntarioGuidelines against which performance isjudged are:• Stage I and II breast cancer patients shouldreceive radiation treatment following breast-conserving surgery. Patients are treated within guidelines if they receiveradiation treatment within 12 weeks of surgery.
• Stage III colon cancers are typically treatedby surgical removal of the tumour. It is recommended that patients subsequentlyreceive chemotherapy to improve outcomes.Patients are treated within guidelines if they receive 5-FU (5 Fluorouracil)-basedpost-operative chemotherapy at a regionalcancer centre within 120 days of surgery.
• Stage II non-small cell lung cancer is usuallytreated by surgical removal (resection) of thetumour. Some Stage IIIA cases may also beresectable. Research shows that, for medicallyfit patients, treatment with chemotherapyafter surgery improves survival. Patientsreceiving platinum-based chemotherapy at a regional cancer centre within 120 days of the date of surgery are considered to be treated according to the lung cancertreatment guidelines.
• For locally advanced non-small cell lung cancers with tumours that cannot be surgically removed, research shows treatmentwith combined chemotherapy and radiationimproves survival. Patients who begin radiation therapy and platinum-basedchemotherapy within 180 days of diagnosisare considered to be treated according to thelung cancer treatment guidelines.

30
4345
84
75.6
44
5250
NA
0
20
40
60
80
100
20082007
40
Sour
ce: Cancer Care Ontario
Guideline-complaint cancer care, 2007 and 2008
EffectivenessQuality of Healthcare in Canada: A Chartbook
% of patients receiving guideline-complaint care
Lung cancer chemo-radiation unresectedstage IIIA or IIIBnon small cell
Lung cancerchemotherapy stageII or IIIA non-smallcell
Colon cancerchemotherapy post optreatment of stage III
Breast cancer radiationtreatment followingbreast conserving surgery

The circulatory system moves blood and lympharound the body and consists of the heart andblood vessels. Circulatory system disease, whichincludes coronary heart disease (also known asischemic heart disease) and stroke, is the leadingcause of illness, disability and death in Canada.In 2005, the last year for which there are published data, there were 71,749 deaths fromcirculatory disease – almost one-third of all deathsin Canada that year. Circulatory disease is amajor cause of premature death and, in 2005,was responsible for 20,294 deaths in Canadiansunder the age of 75. It is the leading cause ofhospitalization, accounting for 18% of totaladmissions (Conference Board of Canada, online).
Circulatory disease can be genetic or acquired.Lifestyle factors, such as diet and smoking,have a large influence on the likelihood ofdeveloping a circulatory disease. Circulatorydisease is also largely age-related. The threeleading conditions contributing to circulatory-system disease burden and mortality are stroke,high blood pressure, and coronary heart disease, with coronary heart disease being the most prevalent.
It has been estimated that heart disease andstroke cost the Canadian economy more than$18 billion every year in physician services,hospital costs, lost wages and decreased productivity. Canadian acute care hospitalshandled almost three million (2.8 million) hospitalizations in 2004, a slight increase from the previous year and approximately 14% fewer than in 1995 (Heart and StrokeFoundation, online).
41
Effectiveness
Circulatory Disease
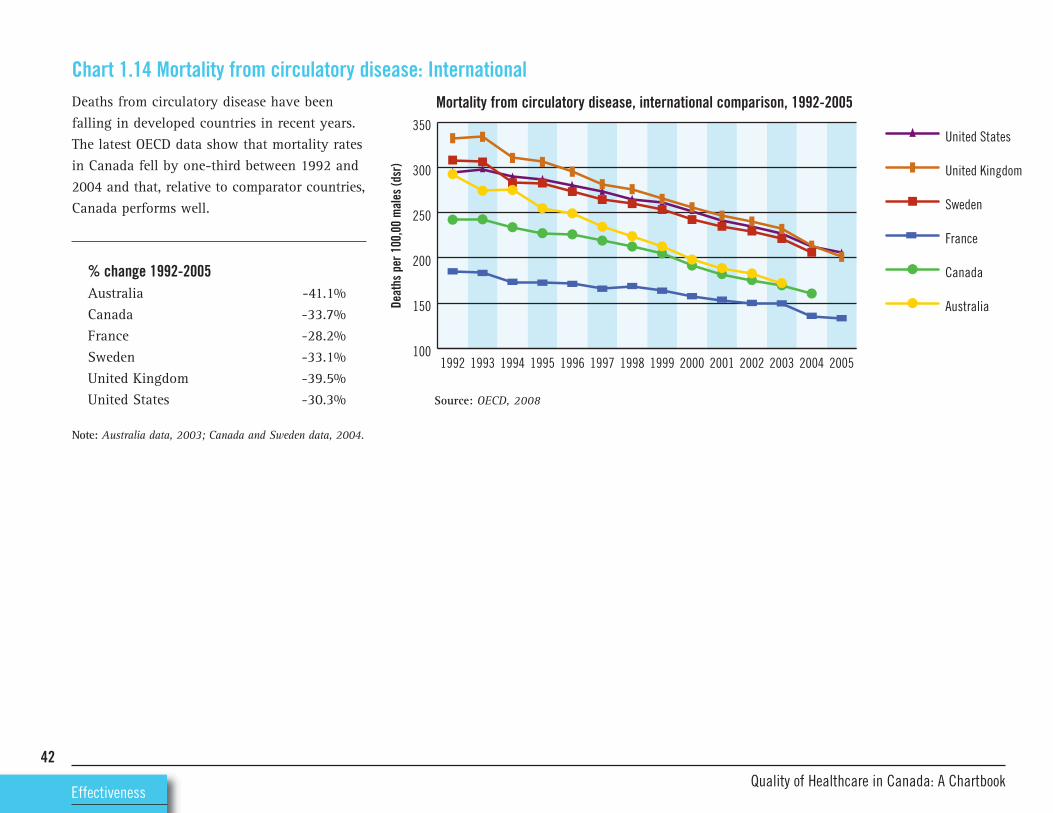
100
150
200
250
300
350United States
United Kingdom
Sweden
France
Canada
Australia
20052004200320022001200019991998199719961995199419931992
Deaths from circulatory disease have beenfalling in developed countries in recent years.The latest OECD data show that mortality ratesin Canada fell by one-third between 1992 and2004 and that, relative to comparator countries,Canada performs well.
% change 1992-2005Australia -41.1%Canada -33.7%France -28.2%Sweden -33.1%United Kingdom -39.5%United States -30.3%
Note: Australia data, 2003; Canada and Sweden data, 2004.
42
Chart 1.14 Mortality from circulatory disease: International
Source: OECD, 2008
Mortality from circulatory disease, international comparison, 1992-2005
EffectivenessQuality of Healthcare in Canada: A Chartbook
Deaths per 100,00 males (dsr)

200
400
600
800
1000
1200United States
United Kingdom
Sweden
France
Canada
Australia
20052004200320022001200019991998199719961995199419931992
Because of treatment advances, many individualswho in the past would have died of circulatorydisease are now living with the disease. This isreflected in the potential years of life lost(PYLL) data, which show a generalized reductionin all developed countries, including Canada,where PYLL fell by one-third between 1992and 2004. However, it is important to note that there are quality-of-life implications forpatients with circulatory disease. According toa survey conducted by the Heart and StrokeFoundation in 2000, 90% of the populationwith no history of circulatory disease reported“good, very good, or excellent” health.Respondents with self-reported circulatory diseaseclaimed much lower levels of “good, very good,or excellent health” – 51% for heart diseasepatients and 37% for stroke patients (Heart andStroke Foundation, online).
% change 1992-2005Australia -38.7%Canada -33.5%France -29.3%Sweden -33.1%United Kingdom -39.7%United States -24.1%
Note: Australia data, 2003; Canada and Sweden data, 2004.43
Effectiveness
Chart 1.15 Potential years of life lost to circulatory disease: International
Source: OECD, 2008
Potential years of life lost to circulatory disease, international comparison, 1992-2005
YLL (<70yrs) per 100,000 population
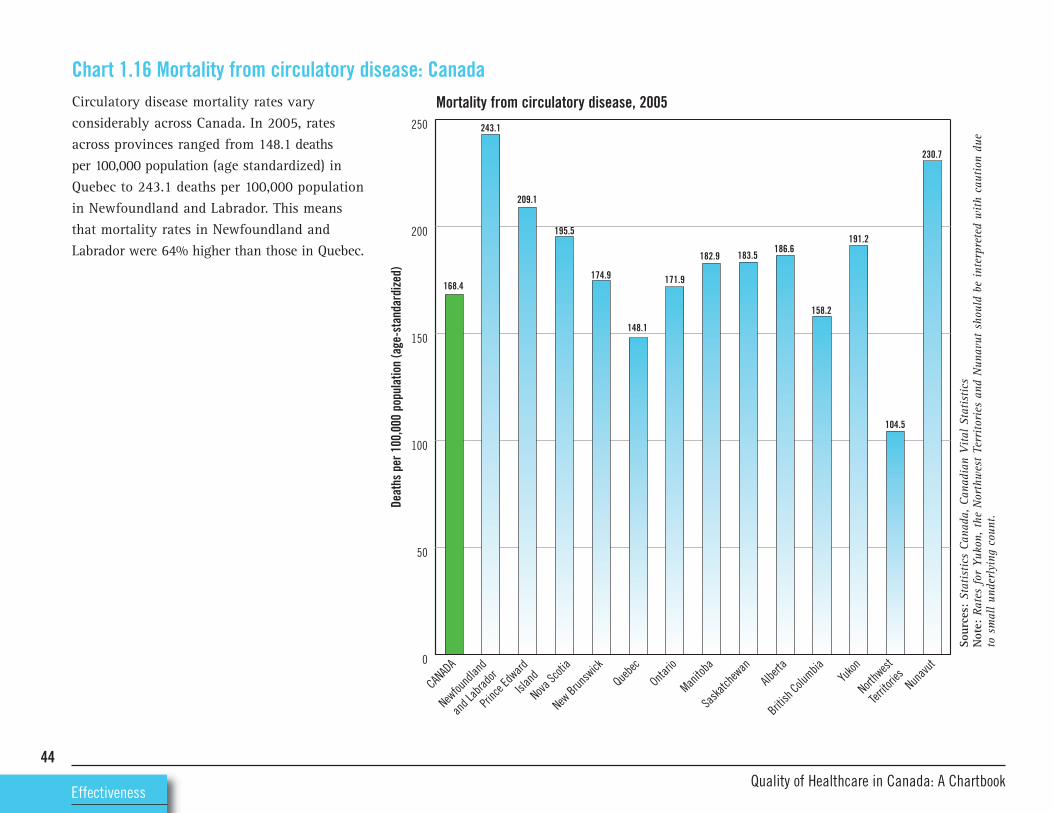
0
50
100
150
200
250
Nunav
ut
Northw
est
Territo
riesYu
kon
British
Columbia
Albert
a
Saska
tchew
an
Manito
ba
Ontario
Quebe
c
New Brun
swick
Nova Sc
otia
Princ
e Edw
ard
Islan
d
Newfou
ndlan
d
and L
abrad
orCAN
ADA
168.4
243.1
209.1
195.5
174.9
148.1
171.9
182.9 183.5186.6
158.2
191.2
104.5
230.7
Circulatory disease mortality rates vary considerably across Canada. In 2005, ratesacross provinces ranged from 148.1 deaths per 100,000 population (age standardized) inQuebec to 243.1 deaths per 100,000 populationin Newfoundland and Labrador. This meansthat mortality rates in Newfoundland andLabrador were 64% higher than those in Quebec.
44
EffectivenessQuality of Healthcare in Canada: A Chartbook
Chart 1.16 Mortality from circulatory disease: Canada
Sour
ces:
Statistics Canada, Canadian Vital Statistics
Not
e:Rates for Yukon, the Northwest Territories and Nunavut should be interpreted with caution due
to small underlying count.
Mortality from circulatory disease, 2005
Deaths per 100,000 population (age-standardized)

Coronary heart disease, also known as ischemicheart disease, is a largely preventable diseasethat, in 2005, was responsible for the deaths of38,480 Canadians (Statistics Canada, CANSIMtable 102-0529).
Coronary heart disease is characterized by theaccumulation of fatty deposits (atheroma) in thewall of the coronary arteries. A build-up of thesedeposits in a process known as atherosclerosisleads to narrowing or hardening of the coronaryarteries, resulting in poor blood supply to theheart muscle. It can present in two main forms:• Angina pectoris (chest pain on exertion, incold weather or emotional situations)
• Acute chest pain due to acute coronary syndrome (i.e. myocardial infarction, orunstable angina)
Diagnosis of coronary heart disease is accomplished with an electrocardiogram, bloodtests (cardiac markers), cardiac stress testing or a coronary angiogram. Depending on thesymptoms and risk, treatment may be medication,percutaneous coronary intervention (angioplasty)or coronary artery bypass (CABG) surgery.
Risk factors for coronary heart disease include:• Age (45 years or older for men; 55 years orolder for women)45
Effectiveness
Coronary Heart Disease• Family history of early heart disease• High total blood cholesterol• Smoking• Hypertension• Diabetes• Obesity• Physical inactivityCharts in this section focus on acute myocardialinfarction (AMI) or heart attack, the most significant type of coronary heart disease interms of mortality and morbidity.
Acute Myocardial InfarctionAn acute myocardial infarction (AMI), or heartattack, occurs when the blood supply to part ofthe heart is interrupted, resulting in the death ofheart cells. This interruption is most commonlydue to blockage of a coronary artery followingthe rupture of an artherosclerotic plaque,which is an unstable collection of lipids (suchas cholesterol) and white blood cells in thearterial wall. If the blood supply is not restoredquickly, the heart muscle suffers permanentdamage. The restoration of blood supply viathrombolysis (clot-busting) or revascularisation(the use of surgical procedures) has beenproven to be an effective treatment for AMI.
A recently published paper (Atzema et al.2009) states that fewer than one-half of AMI
patients meet benchmark times for restoringblood flow (30 minute door-to-needle time).A cardiac arrest is the abrupt cessation of normal circulation of the blood due to failureof the heart to contract effectively. A cardiacarrest is different from, but may be caused by,a myocardial infarction where the heart usuallycontinues to beat but blood flow to the heart isblocked. About 40,000 Canadians experience acardiac arrest every year. Fewer than 5% ofthose who have a cardiac arrest outside of ahospital survive. Ultimately, survival from cardiacarrest is dependent on the strength of individuallinks in the care chain, including early access,early cardiopulmonary resuscitation (CPR),early defibrillation, and early advanced cardiaclife support (ACLS), with each link representinga specific community response to the emergencysituation of cardiac arrest.
Cardiac arrest incidence rates per 100,000 varybetween 53 and 59 across Canada. Most victimsare men in their late 60s or early 70s. Their collapse is witnessed 35% to 55% of the time.For every one-minute delay in defibrillation,the survival rate of a cardiac arrest victimdecreases by 7-10%. Defibrillation, when usedwith CPR, can improve cardiac arrest survivalrates to more than 50% if delivered in the firstfew minutes (Heart and Stroke Foundation, online).

Mortality rates from AMI have been falling inmost developed countries in recent years. Thechart shows that, between 1992 and 2004,Canada recorded a 45.7% decrease in mortalityrates. Viewed alongside the provincial data onAMI mortality (see Chart 1.19), it is apparentthat, in 2004-2005, the level of variation withinCanada was almost as marked as the level ofvariation among the countries shown in the chart.
% change 1992-2005Australia -56.1%Canada -45.7%France -43.5%Germany -40.0%Sweden -48.1%United Kingdom -61.8%United States -50.5%
Note: Australia data, 2003; Canada and Sweden data, 2004.
46
EffectivenessQuality of Healthcare in Canada: A Chartbook
Chart 1.17 Mortality from AMI: International
20
40
60
80
100
120United States
United Kingdom
Sweden
France
Canada
Australia
20052004200320022001200019991998199719961995199419931992
Mortality from AMI, 1992-2005
Deaths per 100,00 population (dsr)
Source: OECD, 2008

50
100
150
200
250
300
350
400United States
United Kingdom
Sweden
France
Canada
Australia
20052004200320022001200019991998199719961995199419931992
Rates of premature mortality due to AMI havefallen dramatically across most developedcountries. The chart shows that the number of years lost to AMI per 100,000 populationdecreased by 50.4% in Canada between 1992and 2004.
% change 1992-2005Australia -64.3%Canada -50.4%France -36.4%Germany -45.7%Sweden -52.0%United Kingdom -65.5%United States -47.1%
Note: Australia data, 2003; Canada and Sweden data, 2004.
47
Effectiveness
Chart 1.18 Potential years of life lost to AMI: International
Source: OECD, 2008
Potential years of life lost to AMI, 1992-2005
YLL (<70 yrs) per 100,000 population

0
10
20
30
40
50
Nunav
ut
Northw
est
Territo
riesYu
kon
British
Columbia
Albert
a
Saska
tchew
an
Manito
ba
Ontario
Quebe
c
New Brun
swick
Nova Sc
otia
Princ
e Edw
ard
Islan
d
Newfou
ndlan
d and
Labra
dor
CANAD
A
42
49
38
45
42
47
42
3637
36
38
45
20
41
AMI mortality data from across Canada showconsiderable variation. Across the provinces,rates in 2005 ranged from 36.1 deaths per100,000 population (age standardized) inAlberta to 49.0 deaths per 100,000 populationin Newfoundland and Labrador.
48
EffectivenessQuality of Healthcare in Canada: A Chartbook
Chart 1.19 Mortality from AMI: Canada
Sour
ces:
Statistics Canada; Canadian Vital Statistics, Death Database and Dem
ography Division
Not
e:Rates for Yukon, the Northwest Territories and Nunavut should be interpreted with caution due
to small underlying count.
Mortality from AMI, 2005
Deaths per 100,000 population (age-standardized)

0
20
40
60
80
100
British
Columbia
Albert
a
Saska
tchew
an
Manito
ba
Ontario
Quebe
c
New Brun
swick
Nova Sc
otia
Princ
e Edw
ard
Islan
d
Newfou
ndlan
d
and L
abrad
orCAN
ADA
5.67.1
8.57.2 7.0
NA
5.4 5.8 6.64.2
5.6
Comparatively high rates of unplanned re-admission can indicate problems with earlydischarge from hospital or with post-hospitalcare. The risk of re-admission following anAMI may be related to the type of drugs prescribed at discharge, patient compliancewith post-discharge therapy, the quality of follow-up care in the community, or theavailability of appropriate diagnostic or therapeutic technologies during the initial hospital stay. The chart illustrates that re-admission rates across Canada ranged from4.2% in Alberta to 8.5% in Prince Edward Island.
49
Effectiveness
Chart 1.20 AMI re-admission within 28 days: Canada
Sour
ce:
Hea
lth I
ndic
ator
s, C
IHI,
2008
Not
e:Ca
nada
rat
e do
es n
ot i
nclu
de Q
uebe
c du
e to
diffe
renc
es i
n da
ta c
olle
ctio
n.
Rate
s ar
e ba
sed
on t
hree
yea
rs o
f po
oled
dat
a.
AMI re-admission within 28 days, 2004-05 to 2006-07
Risk adjusted rate %

After a patient has had a heart attack, there areseveral drugs that have been shown in largeclinical trials to reduce the risk of anotherattack (National Institute for Health andClinical Excellence, 2007). These drugs, whoseadministration is called secondary prevention,include:• aspirin, which helps prevent the blood fromclotting;
• beta-blockers, which slow the heart rate andlower blood pressure;
• angiotensin-converting enzyme inhibitors(ACE inhibitors) and angiotensin II receptorblockers (ARBs), which block an enzyme inthe blood that causes blood vessels to tighten,thereby relaxing blood vessels and loweringblood pressure (for patients who are intolerantof ACE inhibitors, angiotensin receptorblockers); and
• statins, which reduce both total cholesteroland low-density lipoprotein (LDL or “bad”)cholesterol levels in the blood, reducing therelative risk of coronary events.
National data for secondary prevention of AMIare not available. Saskatchewan provides anexample of comprehensive data collection andreporting on AMI care processes. The chartillustrates the proportion of hospitalized AMIpatients aged 20+ years who had secondary-prevention medications dispensed 90 days
50
EffectivenessQuality of Healthcare in Canada: A Chartbook
Chart 1.21 Secondary prevention of AMI: Saskatchewanpost-discharge. Saskatchewan data are alsoavailable for the proportion of patients on secondary prevention medication at three dayspost-discharge in 2005-2006. The data indicatethat 73.5% of AMI patients were prescribedbeta-blockers, 73.8% ACE inhibitors or ARBs,and 69.3% statins. To put these data in international context, a national audit conducted annually by the Royal College ofPhysicians (U.K.) found that, in 2008, the proportion of heart attack patients in Englandprescribed secondary-prevention medication on
discharge from hospital was 98% for aspirin,92% for beta-blockers and 96% for statins.Similarly, in the U.S., the National Committeefor Quality Assurance (NCQA) reported that in2006, of health plan members aged 35+ whowere hospitalized after an AMI, 98% received aprescription for a beta-blocker within sevendays of hospital discharge. These internationalcomparisons should be interpreted with care, asthe methodologies differ, particularly in termsof whether patients with contraindications areincluded in the analyses.
0
20
40
60
80
100Statin
Beta-blocker
ACE inhibitor/ARB
2005-20062004-20052003-20042002-20032001-2002
56.5
56.6
39.7
58.3
60.3
46.8
57.8
60.5
52.5
62.967.8
69.3
62.5
64.6
56.7
Source: Discharge Abstract Database, Prescription Drug Plan Historical Claims.Analysis by Health Quality Council, Saskatchewan (2008)
AMI secondary prevention among residents of Saskatchewan aged 20+, 90th day post-discharge, 2001-2002 to 2005-2006
percent

A stroke, also known as a cerebrovascular accident, occurs when a blood vessel that carriesoxygen and nutrients to the brain either getsblocked by a clot (an ischemic stroke) or rupturesand bleeds (a hemorrhagic stroke). As a result,the area of the brain supplied by the bloodvessel is damaged or dies. The severity andconsequences of stroke vary dramatically, froma limited episode known as a transient ischemicattack (TIA) or “mini-stroke”, with no persistentconsequences, to a severe incident that causesdeath or disability.
Risk factors for stroke fall into two maingroups: those that can be controlled and thosethat cannot. Factors that are not amenable tocontrol or change include: • Age• Family history• Race• Gender• Prior stroke, TIA or heart attack
Risk factors that can be controlled include:• High blood pressure• Smoking• Blood cholesterol levels• Physical inactivity• Obesity
51
Effectiveness
StrokeAccording to the Heart and Stroke Foundation(online b), of the approximately 50,000 peoplewho suffer a stroke each year: • 15% will die• 10% will recover completely• 25% will recover with a minor impairmentor disability
• 40% will be left with a moderate-to-severeimpairment
• 10% will be so severely disabled they requirelong-term care
In 2005, there were more than 14,000 deathsattributed to cerebrovascular disease (thecausal disease for stroke).
It has been estimated that widespread access toorganized stroke care could prevent more than160,000 strokes, prevent disability in 60,000Canadians, and save $8 billion net in healthcarecosts over the next 20 years in Canada (Heartand Stroke Foundation, online b).
The Canadian Stroke Strategy (online) is acomprehensive program designed to provide allCanadians with the best stroke care possible,regardless of where they live, by 2010. Thestrategy aims to support provinces and territoriesin preventing and treating strokes and
rehabilitating and re-integrating survivors intotheir communities. The strategy also seeks tobuild public awareness of stroke, developguidelines and standards of care, provide training for health professionals, and co-ordinateresearch efforts. It also sets out an agreed-uponset of quality indicators. However, there appearto be no national data sets that use those qualityindicators or report on performance acrossCanada. Ontario does have a comprehensive setof quality data related to stroke; in the absenceof national information, this section presents asubset of the Ontario data.

20
40
60
80
100United States
United Kingdom
Sweden
France
Canada
Australia
20052004200320022001200019991998199719961995199419931992
52
Source: OECD, 2008
Mortality from cerebrovascular disease, 1992-2005
EffectivenessQuality of Healthcare in Canada: A Chartbook
Cerebrovascular disease (CVD) makes it morelikely that a stroke will occur, through either asudden blockage or a rupture of a blood vesselwithin the brain. A blockage can be caused bya blood clot forming (a thrombosis) or by afragment of material (blood clot, piece of tissue,cholesterol or various other substances) travellingin the bloodstream (an embolism). The chartshows that, internationally, mortality ratesfrom cerebrovascular disease have been fallingsteadily. In Canada, mortality rates between1992 and 2004 fell by 30.5%. Compared tomany other developed countries, Canada has alow CVD mortality rate.
% change 1992-2005Australia -33.8%Canada -30.5%France -38.6%Germany -47.8%Sweden -27.5%United Kingdom -36.4%United States -25.3%
Note: Australia data, 2003; Canada and Sweden data, 2004.
Chart 1.22 Cerebrovascular disease mortality: International
Deaths per 100,000 population (sdr)

50
100
150
200United States
United Kingdom
Sweden
France
Canada
Australia
20052004200320022001200019991998199719961995199419931992
Of the countries shown in the chart, Canada hasthe fewest years of life lost to cerebrovasculardisease. Over the period 1992-2004, Canadarecorded a 38.7% fall in the potential years oflife lost per 100,000 population.
% change 1992-2005Australia -39.3%Canada -38.7%France -36.5%Germany -42.0%Sweden -31.6%United Kingdom -32.7%United States -20.9%
Note: Australia data, 2003; Canada and Sweden data, 2004.
53
Effectiveness
Chart 1.23 Potential years of life lost to cerebrovascular disease: International
Source: OECD, 2008
Potential years of life lost to cerebrovascular disease, 1992-2005
YLL (<70yrs) per 100,000 population

0
10
20
30
40
50
60
70
80
Nunav
ut
Northw
est
Territo
riesYu
kon
British
Columbia
Albert
a
Saska
tchew
an
Manito
ba
Ontario
Quebe
c
New Brun
swick
Nova Sc
otia
Princ
e Edw
ard
Islan
d
Newfou
ndlan
d and
Labra
dor
CANAD
A
32.5
49.5
36.3 36.4
32.9
26.1
33.6 33.934.9 34.7
35.5
40.1
14.9
66.6
Cerebrovascular disease mortality data fromacross Canada show considerable variation.Among provinces, rates in 2005 ranged from 26.1deaths per 100,000 population (age standardized)in Quebec to 49.5 deaths per 100,000 populationin Newfoundland and Labrador. This meansthat in Newfoundland and Labrador, the ratewas 90% higher than that in Quebec.
54
EffectivenessQuality of Healthcare in Canada: A Chartbook
Chart 1.24 Mortality from cerebrovascular disease: Canada
Sour
ce: Statistics Canada, Canadian Vital Statistics
Not
e: Rates for Yukon, the Northwest Territories and Nunavut should be interpreted with caution due
to small underlying count.
Mortality from cerebrovascular disease, 2005
Deaths per 100,000 population (age-standardized)

0
20
40
60
80
100
British
Columbia
Albert
a
Saska
tchew
an
Manito
ba
Ontario
Quebe
c
New Brun
swick
Nova Sc
otia
Princ
e Edw
ard
Islan
d
Newfou
ndlan
d
and L
abrad
orCAN
ADA
49
2426
5052 53
41
51
33
43
49
After a stroke, it is critically important thatpatients seek medical care quickly, as the windowof opportunity within which to optimally treatmost strokes is very small – no greater thanthree hours. Many charities, foundations andclinical groups around the world emphasizethat, after stroke, “Time is Brain.” In 2007, theHeart and Stroke Foundation conducted anational survey that asked respondents:“Would you call 9-1-1 or local EMS if you or someone you know experienced a strokewarning sign?” The results are illustrated in the chart. In Newfoundland and Labrador,fewer than one-quarter of respondents indicatedthat they would call for emergency assistance.Overall, fewer than half of Canadians would do so.
55
Effectiveness
Chart 1.25 Public awareness of stroke as medical emergency: Canada
Sour
ce: Heart and Stroke Fundation, 2007
Would call for help urgently with stroke symptoms, public survey, 2007
% re
spondents

It is critically important that patients quicklyreceive medical care for appropriate diagnosisand clinical intervention to minimize permanentdamage from stroke (Lindsay et al., 2008).Recognizing stroke warning signs and gettingimmediate medical attention within three hoursof stroke onset have a major impact on survivaland recovery. However, according to the Heartand Stroke Foundation of Canada (online b),only 20-25% of people who have a strokeactually get emergency care within this criticalwindow. Emergency transport is a major contributor to delays in accessing stroke carewithin this time frame. A stroke audit conductedin Ontario found that, in 2004-2005, fewerthan one-third of stroke patients were treatedmedically within 2.5 hours of stroke onset.
56
EffectivenessQuality of Healthcare in Canada: A Chartbook
Chart 1.26 Emergency transport for stroke: Ontario
0
10
20
30
40
50
60
70
80
90
100
2004-20052002-2003
31.6 32.5
Patients with stroke or TIA arriving in the emergency department within 2.5 hours of stroke onset,2002-2003 and 2004-2005
% stroke/TIA patients
Sour
ce: Institute for Clinical Evaluative Sciences (ICES), 2009

Thrombolysis, or “clot busting” with recombinanttissue plasminogen activator (rTPA), has beenshown in clinical trials to improve outcomesafter ischemic stroke, if administered within4.5 hours of symptom onset (Lindsay et al.,2008). Neuroimaging is required prior tothrombolysis in order to ascertain whether thestroke is ischemic, as thrombolytic treatmentwould exacerbate the symptoms of hemorrhagicstrokes. The chart shows that, in 2004-2005,only 3.9% of Ontario patients with acuteischemic stroke received thrombolytic treatment.In the subgroup of patients presenting within2.5 hours of stroke onset, 14.1% receivedthrombolysis. Current Canadian guidelines(Lindsay et al., 2008) state that all eligiblepatients should receive thrombolysis withinone hour of hospital arrival (i.e. door-to-needle,or DTN, time <60mins). Median door-to-needletime for those receiving thrombolysis inOntario in 2004-2005 was 84.2 minutes. Thelowest median DTN was recorded in regionalstroke centres, where a result of 73.1 minuteswas recorded (data not shown).
57
Effectiveness
Chart 1.27 Emergency imaging and thrombolysis for stroke: Ontario
0
10
20
30
40
50
60
70
80
90
100
2004-20052002-2003
2.6 3.2
9.5
5.93.9
14.1
Patients with ischemic stroke receiving neuroimaging and thrombolysis, 2002-2003 and 2004-2005
% ischem
ic stroke patients
Neuroimaging within 25minutes
Thrombolysis Thrombolysis among thosearriving within 2.5hrs of symptom onset
Sour
ce: ICES, 2009

0
10
20
30
40
50
60
70
80
90
100
2004-20052002-2003
46.744.4 45
54.151.1
48
54.256.1
Dysphagia screening by hospital type, 2002-2003 and 2004-2005
% patients with stroke admitted to hospital
National guidelines recommend dysphagiascreening (screening for swallowing problems)before patients are given anything to eat ordrink (Lindsay, et al., 2008). This is to preventdevelopment of inhalation pneumonia. Pneumoniais an important complication of ischemicstroke and increases mortality threefold. Thelatest available data for Ontario (2004-2005)show that slightly more than one-half of hospitalized stroke patients were screened fordysphagia. For details about the different hospital types shown, see Technical Appendix.
58
EffectivenessQuality of Healthcare in Canada: A Chartbook
Chart 1.28 Dysphagia screening by hospital type: Ontario
Sour
ce: ICES, 2009
Ontario Non-designated District Stroke Centre
Regional Stroke Centre

0
20
40
60
80
100
2004-20052002-2003
80.3
69.5
31.6
23.4
92.4
74.3
36.1
44.1
Drug therapy at discharge among stroke/TIA patients, 2002-2003 and 2004-2005
% hospitalized stroke/TIA patients
The recommended treatment for secondary prevention of ischemic stroke includes the useof antithrombotics, warfarin for atrial fibrillation,antihypertensives, and lipid-lowering agents.The chart on this page illustrates utilizationrates for these treatments across Ontario.Secondary prevention clinics can help patientsadhere to medication regimes and supportthem to make lifestyle changes in order to prevent subsequent cerebrovascular episodes.The chart on the next page shows that, in2004-2005, 29% of patients were referred to a secondary prevention clinic after dischargefrom hospital.
59
Effectiveness
Chart 1.29 Secondary prevention for stroke: Ontario
Sour
ce: ICES, 2009
Anti-thrombotics Warfarin for atrialfibrillation
ACE inhibitors Lipid-lowering therapy

60
EffectivenessQuality of Healthcare in Canada: A Chartbook
0
10
20
30
40
50
60
70
80
90
100
2004-20052002-2003
14.1
7.1
16.7
39.9
29.1
20.9
27.4
67
Referral to a secondary prevention clinic among stroke/TIA patients, by hospital type, 2002-2003 and 2004-2005
% of patients
Ontario Non-designated District Stroke Centre
Regional Stroke Centre
Sour
ce: ICES, 2009

Respiratory disease, which includes asthma,chronic obstructive pulmonary disease (COPD),influenza and pneumonia, bronchiolitis, cysticfibrosis and respiratory distress syndrome,affects more than 3.5 million Canadians1
(Public Health Agency of Canada, 2007). In2005, there were 20,485 deaths attributed torespiratory disease (CANSIM Table 102-0530,excludes lung cancer).
61
Effectiveness
Respiratory DiseaseApproximately 6.5% of Canada’s total healthcarespending is allocated to respiratory diseases(not including lung cancer). In 2000, almost$5.7 billion was invested in direct costs of caring for patients with respiratory disease,including covering hospitalization, physicianvisits, research, and drugs, while a further $6.7billion was spent on indirect expenses associatedwith disability and mortality (PHAC, 2007).
The two most important risk factors for respiratory diseases are tobacco smoke(through personal smoking and exposure to second-hand smoke) and air quality.
1 There is some variation in the way respiratory disease is defined: some reports include lung cancer within respiratory disease (e.g. PHAC, 2007) while others, notablythose based on the International Classification of Disease(ICD-10), consider lung cancer under neoplasms andexclude it from respiratory disease.

20
40
60
80
100
120France
Sweden
Australia
Canada
United States
United Kingdom
20052004200320022001200019991998199719961995199419931992
Respiratory disease affects the lung, pleuralcavity, bronchial tubes, trachea and upper respiratory tract, as well as the nerves andmuscles involved in breathing. It ranges frommild and self-limiting illnesses such as thecommon cold, to life-threatening conditionssuch as bacterial pneumonia and to syndromesthat can significantly compromise quality oflife such as chronic obstructive pulmonary disease (COPD). According to the Public HealthAgency of Canada (2007), respiratory disease isresponsible for more than 10% of hospitalizationsand more than 16% of deaths in Canada. Thecharts show that, between 1992 and 2004,Canada recorded a 17% reduction in respiratorydisease mortality and a 31.2% decrease in thepotential years of life lost to the disease.
62
Chart 1.30 Respiratory disease mortality: International
Source: OECD, 2008
EffectivenessQuality of Healthcare in Canada: A Chartbook
50
100
150
200
250
300France
Sweden
Australia
Canada
United States
United Kingdom
20052004200320022001200019991998199719961995199419931992
Mortality from respiratory disease, international, 1992-2005
Potential years of life lost to respiratory disease, international, 2002-2005Deaths per 100,000 population (dsr)
YLL (<70yrs) per 100,000 population

0
30
60
90
120
150
Nunav
ut
Northw
est
Territo
riesYu
kon
British
Columbia
Albert
a
Saska
tchew
an
Manito
ba
Ontario
Quebe
c
New Brun
swick
Nova Sc
otia
Princ
e Edw
ard
Islan
d
Newfou
ndlan
d
and L
abrad
orCAN
ADA
48
53.6
43.6
55
49.8
40.6
45.749.8
46.7
129
47.8 46
74
118.2
According to the Public Health Agency ofCanada (2007), Canada is facing a wave ofchronic respiratory diseases as a consequenceof an aging population. The latest availabledata show that there is considerable variationin mortality rates across the country, withprovincial rates ranging from 40.6 deaths per 100,000 population in Quebec to 55.0 deathsper 100,000 population in Nova Scotia.
63
Effectiveness
Chart 1.31 Respiratory disease mortality: Canada
Sour
ce: Statistics Canada, Canadian Vital Statistics
Not
e: Rates for Yukon, the Northwest Territories and Nunavut should be interpreted with caution due
to small underlying count.
Mortality from respiratory disease, 2005
Deaths per 100,000 population (age standardized)

Chronic obstructive pulmonary disease (COPD),which includes chronic bronchitis and emphysema, is characterized by shortness ofbreath, cough and sputum production. COPD is a result of a narrowing of the airway limitingthe flow of air to and from the lungs.Symptoms do not usually appear before age55; however, changes to the lung begin manyyears earlier. In general, COPD progressesslowly over a period of years. As the diseaseadvances, shortness of breath limits the activitylevels of individuals and reduces their qualityof life. Current guidelines recommend thatpatients suspected to have COPD should bediagnosed by spirometry (O’Donnell et al.,2007). Early diagnosis can help to improveoutcomes. The chart illustrates data from aLung Association survey of Canadians deemed“at risk” for COPD (that is, aged 18+ years andcurrent smokers) and patients with diagnosedCOPD. More than one-third of patients diagnosedwith COPD and more than two-thirds of thosedeemed “at risk” reported that they had neverundergone a spirometry test.
64
EffectivenessQuality of Healthcare in Canada: A Chartbook
Chart 1.32 COPD in Canada: Diagnosis and spirometry
0
20
40
60
80
100
At riskCOPD diagnosed
62
38
68
32
Spirometry testing, Canada, public survey, 2007
% of respondents
Spirometry test No spirometry test
Sour
ce: Lung Association, 2007

Diabetes mellitus is a disease in which thebody either does not produce, or does notproperly use, insulin. A hormone produced bythe pancreas, insulin is needed to convertsugar, starches and other food into energy. Theresult of insulin deficiency is the high bloodsugar levels characteristic of the disease. Thereare two main forms of diabetes: type 1 diabetesresults from the body’s failure to produceinsulin, and type 2 diabetes results frominsulin resistance (suboptimal use of insulin).Ten percent of cases in Canada are type 1 and 90% type 2. Obesity is closely linked withtype 2 diabetes.
Diabetes is the seventh-leading cause of deathin Canada and accounts for 25,000 years oflife lost before age 75. Internationally, there issignificant under-recording of diabetes as anunderlying cause of death, as deaths in diabeticpeople are often coded to secondary complicationsassociated with the disease. The extent ofunder-recording may vary geographically andover time. Therefore, mortality rates from thedisease are not reported here.
65
Effectiveness
DiabetesIn 2005, 1.8 million Canadians – 5.5% of thepopulation – had diagnosed diabetes. However,more than 2.25 million Canadians are estimatedto have diabetes, with many adults with diabetesunaware that they have the condition. The costof diabetes in Canada is estimated to be up to$9 billion annually (PHAC, online).
Diabetes is associated with serious chronic illhealth, disability and premature mortality.Long-term complications include heart disease,stroke, blindness, kidney disease and amputations(PHAC, online). Many of the long-term effectsof diabetes can be avoided with effective controlof blood pressure, cholesterol and blood sugarlevels (Diabetes Control and ComplicationsTrial, 1993).
Two population groups are at highest risk of diabetes:• Seniors –10% of those aged 65+ have thedisease, compared to 3% of those aged 35–64
• Aboriginal people – type 2 diabetes rates are3 to 5 times higher in aboriginal communitiesthan in the general population
In 1999, the Government of Canada allocated$115 million to the Canadian Diabetes Strategy(CDS), aimed at preventing type 2 diabetes andaddressing complications associated with thedisease. A policy review (PHAC, online) in 2007revisited the strategy and noted that progressin achieving priorities has been slow.

The Canadian Diabetes Association (CDA)Clinical Practice Guidelines (2008) state thatglycated hemoglobin (HbA1c) is a valuableindicator of treatment effectiveness, and shouldbe measured every three months when glycemictargets are not being met and when diabetestherapy is being adjusted. HbA1C testing at six-month intervals may be considered in adultsduring periods of treatment and lifestyle stability, when glycemic targets have been consistently achieved. The chart illustrates findings from diabetic respondents to aCommonwealth Fund International HealthPolicy Survey question about whether theirHbA1c had been checked in the past year. The data indicate that the majority of diabeticpatients are having their HbA1c levels checked,but the data provide no insight into how effectively glycemic control is being maintained.
66
EffectivenessQuality of Healthcare in Canada: A Chartbook
Chart 1.33 Monitoring glycemic control in people with diabetes: International
0
20
40
60
80
100
United
State
s
United
King
dom
New Ze
aland
Netherl
ands
German
yFra
nce
Canad
a
Austr
alia
83
90
9392
96
87
9492
HbA1c monitoring among people with diabetes, 2008
% diabetic re
spondents
Sour
ce: Commonwealth Fund, 2008
Not
e:Data should be interpreted with care due to sm
all sample sizes.

Screening for possible complications andsequelae of diabetes is important, as earlydetection means that disease processes can betreated and arrested. International data fromthe Commonwealth Fund survey, 2008, includeresponses from adults with diabetes. Almostone-half of Canadian respondents indicatedthat they had not received a foot exam in thepreceding year, and almost one-third indicatedthat they had not undergone an eye examination.The strongest results were recorded in the U.K.,which recently implemented the QualityOutcomes Framework, a national system forincentivizing primary-care physicians to provide evidence-based care.
67
Effectiveness
Chart 1.34 Diabetes care processes: International
0
20
40
60
80
100
United
State
s
United
King
dom
New Ze
aland
Netherl
ands
German
yFra
nce
Canad
a
Austr
alia
53
65
53
69
41
61
47
80
67
85
71
68
61
68
80
85
Adherence to recommended care processes, 2008
% re
spondents (with diabetes)
Foot exam in past year
Eye exam in past year Sour
ce: Commonwealth Fund, 2008
Not
e:Data should be interpreted with care due to sm
all sample sizes.

0
20
40
60
80
100
All four recommendedFeet checkedUrine protein testHbA1c testDilated eye exam
86
78
70
50
29
In 2007, the Canadian Community HealthSurvey asked respondents with diabeteswhether they had received four recommendedcare components in the preceding year (or preceding two years for eye exams). The chartsbelow show that across Canada, fewer thanone-third of respondents indicated that theyhad received comprehensive diabetes care.
68
EffectivenessQuality of Healthcare in Canada: A Chartbook
Chart 1.35 Diabetes processes: CanadaProportion of adults with diabetes who received recommended care processes from ahealthcare professional, 2007
% re
spondents

69
Effectiveness
0
10
20
30
40
50
60
70
80
90
100
British
Columbia
Albert
a
Saska
tchew
an
Manito
ba
Ontario
Quebe
c
New Brun
swick
Nova Sc
otia
Princ
e Edw
ard
Islan
d
Newfou
ndlan
d
and L
abrad
orCAN
ADA
29
21
33 32
24
31
NA
323434
Age-standardized proportion of adults with diabetes who received all four recommended care processes, 2007
Sour
ce: Statistics Canada, CCH
S, 2007
Not
e: Data exclude gestational diabetes
% re
spondents

0
50
100LDL < 2.5 mmol/L
HbA1c </= 7.0%
2005-20062004-20052003-2004
42.6
37.3
47.4
44.8
48.5
45.9
Chronic hyperglycemia of diabetes is associatedwith significant long-term complications, particularly damage, dysfunction and failure of various organs. The 2008 Clinical PracticeGuidelines of the Canadian DiabetesAssociation state that, for most individuals,HbA1c levels should be ≤ 7.0% in order to minimize risks of microvascular andmacrovascular complications. The beneficialeffects of lowering low-density lipoproteincholesterol (LDL) with statin therapy applyequally well to people with diabetes as to thosewithout. The primary target for high-risk personswith diabetes is an LDL-C of ≤2.0 mmol/L,which is generally achievable with statins. Thechart illustrates the percentage of people withdiabetes aged 20+ years in Saskatchewan withmost recent HbA1c and LDL results within therecommended levels. To place these data incontext, results from the Quality OutcomesFramework in England show that HbA1c levelsof less than 7.5% (less strict than levels inCanada) were achieved in 66.8% patients inEngland in 2007-2008. Cholesterol levels of less than 5 mmol/litre(also less strict than Canadian levels) wereachieved in 83.2% of diabetic patients.
70
EffectivenessQuality of Healthcare in Canada: A Chartbook
Chart 1.36 Diabetes control: Saskatchewan
Source: Saskatchewan Diabetes Database
Diabetes management, Saskatchewan, 2003-2004 to 2005-2006
Percent diabetic patients

Healthcare organizations in Canada generallydefine mental health as “the capacity of eachand all of us to feel, think, and act in waysthat enhance our ability to enjoy life and dealwith the challenges we face. It is a positivesense of emotional and spiritual well-beingthat respects the importance of culture, equity,social justice, interconnections and personaldignity.” Mental illness, on the other hand, is defined as “alterations in thinking, mood or behaviour due to distress and impairedfunctioning” (Government of Canada, 2006).
The most common mental illnesses are mooddisorders (depression), schizophrenia, anxiety,personality disorders, and eating disorders.According to the International Classification of Diseases used by the World HealthOrganization, the wide-ranging category ofmental disorders also includes sleep disorders,autism, substance abuse, mental retardation,dementia, paranoia, and mania.
71
Effectiveness
Mental Health and Mental IllnessMental illness is classified as one of the fivemajor chronic diseases in Canada and depressionis one of the leading causes of disability indeveloped countries (CIHI 2008b; ConferenceBoard of Canada, online b). The CanadianCommunity Health Survey on mental healthand well-being found that 4.5% of Canadiansreported having major depression, similar torates found for diabetes and heart disease. Anestimated 20% of Canadians will experiencemental illness at some time in their lives; two-thirds of these people will never receivetreatment. The economic burden attributed tomental disorders in Canada is significant. In 1998, the costs associated with mental illness in Canada were estimated to be about$7.9 billion, or 5% of total healthcare costs.Mental illness is the second-leading cause ofhospital admission among Canadians between20 and 44 years of age (Health Canada, 1998).
Mortality rates are an imprecise measure of theimpact of mental health disorders becausedeaths directly attributable to mental illnessesare uncommon, with the exception of suicidesamong the young. Every year in Canada, some3,400 people end their life through suicide.Approximately 90% of suicides are related todepression, other mental health disordersand/or substance abuse. Most notably, youthsuicide is an urgent issue for First Nations andInuit youth in Canada. While there is muchvariation among communities, overall rates are high. Suicide rates are five to seven times higher for First Nations youth than fornon-aboriginal youth. Suicide rates amongInuit youth are among the highest in theworld, at 11 times the Canadian average(Health Canada, online).
The federal government established the MentalHealth Commission of Canada in 2007 toincrease understanding of mental health andmental illness in Canada.

5
10
15
20United States
United Kingdom
Sweden
France
Canada
Australia
20052004200320022001200019991998199719961995199419931992
Suicide can represent a failure of the healthsystem, and society, to help an individual inneed of medical and psychosocial care andcommunity support. The chart illustrates OECDdata and shows that Canadian rates of suicidefell by 18% between 1992 and 2004. Thepotential years of life lost over the same timeperiod fell by 20%.
72
EffectivenessQuality of Healthcare in Canada: A Chartbook
Chart 1.37 Mortality and potential years of life lost to suicide: International
Source: OECD, 2008
Mortality from suicide/intentional self harm, 1992-2005
Deaths per 100,000 population (age standardized)
100
200
300
400
500United States
United Kingdom
Sweden
France
Canada
Australia
20052004200320022001200019991998199719961995199419931992
Potential years of life lost to suicide/intentional self harm, 1992-2005YLL (<70yrs) per 100,000 population

371.8 358.6
182.4303.4
380.4499.3
266.5401.1
478.5456.3
329.8
504.8
977.5
4138.3
0
1000
2000
3000
4000
5000
Nunav
ut
Northw
est
Territo
riesYu
kon
British
Columbia
Albert
a
Saska
tchew
an
Manito
ba
Ontario
Quebe
c
New Brun
swick
Nova Sc
otia
Princ
e Edw
ard
Islan
d
Newfou
ndlan
d
and L
abrad
orCAN
ADA
In 2004, across Canadian provinces, the potentialyears of life lost to suicide per 100,000 populationranged from 182.4 in Prince Edward Island to499.3 in Quebec. This is a considerable difference,with the Quebec figure being some 146% higherthan the PEI statistic. The scale of this differenceis, however, dwarfed by the comparisonbetween the provinces as a group and the territories, particularly the Northwest Territoriesand Nunavut. Care should be taken in makingsuch comparisons because of small underlyingpopulation counts in the territories.Nonetheless, there are grounds for serious concerns about this aspect of health.
73
Effectiveness
Chart 1.38 Potential years of life lost to suicide: Canada
Sour
ces:
Statistics Canada, Canadian Vital Statistics
Not
e: Rates for Yukon, the Northwest Territories and Nunavut should be interpreted with
caution due to small underlying count.
Potential years of life lost to suicide, 2004
YYL (<75yrs) per 100,000 population

7.6
6.2
6.8 6.6
9.6
4.6
7.9
9.4
7.1
8.99.2
19.3
0
5
10
15
20
Territo
ries
British
Columbia
Albert
a
Saska
tchew
an
Manito
ba
Ontario
Quebe
c
New Brun
swick
Nova Sc
otia
Princ
e Edw
ard
Islan
d
Newfou
ndlan
d
and L
abrad
orCAN
ADA
Suicide is one of the leading causes of death inboth males and females from adolescence tomiddle age, accounting for 24% of all deathsamong those aged 15 to 24 and 16% amongthose aged 25 to 44. The mortality rate fromsuicide in males is four times that for females(data not shown). There is marked variationacross Canada, with the territories recordinghospitalizations due to attempted suicide at arate two-and-a-half times that seen in Canadaas a whole. The relative roles of primary careand mental health services - as well as behavioural, cultural, economic or educationalissues – in such high levels of attempted suicidein the territories are unknown.
74
EffectivenessQuality of Healthcare in Canada: A Chartbook
Chart 1.39 Hospitalization due to suicide attempts: Canada
Sour
ce: Hospital Morbidity Database, CIHI
Not
e: Rates for Yukon, the Northwest Territories and Nunavut should be interpreted with caution due
to small underlying count.
Hospitalization rates due to suicide attempts, 2001-2002
Rate per 100,000 population age standardized (dsr)

0
10
20
30
40
50
60
70
80
90
100
British
Columbia
Albert
a
Saska
tchew
an
Manito
ba
Ontario
New Brun
swick
Nova Sc
otia
Princ
e Edw
ard
Islan
d
Newfou
ndlan
d
and L
abrad
orCAN
ADA
9.2 9.811.7
10.1 9.4 9.16.5 7.1 7.9
10.2
Although re-admission to hospital within 30 days of discharge for mental illness may beunavoidable, a CIHI study showed that shorterinitial hospital stays are related to higher re-admission rates for schizophrenia and psychotic disorders (CIHI, 2008c). The highlydebilitating and hard-to-treat nature of suchdisorders means long hospital stays are oftennecessary to stabilize patients. In some cases, a high level of re-admissions suggests thatpatients were discharged prematurely or thatthe level of mental health support provided inthe community was inadequate, or both. The chart shows data released by CIHI’sHospital Mental Health Database on 30-day re-admissions. Rates ranged from 6.5% inManitoba to 11.7% in Prince Edward Island.
75
Effectiveness
Chart 1.40 Mental health services: Re-admission within 30 days of discharge, Canada
Sour
ce:
Hos
pita
l M
enta
l H
ealth
Dat
abas
e, C
IHI; H
ospi
tal M
orbi
dity
Dat
abas
e, C
IHI
Mental health re-admission within 30 days, 2005-2006
% patients

Assessments of the quality of healthcare in anycountry or jurisdiction often focus on how thesystem deals with patients and their ailments.In developed countries, however, a significantproportion of illnesses that afflict the populationare associated with, and exacerbated by,lifestyle choices. The extent to which we canhold a healthcare system to account for thebehaviour choices of the public it serves is
76
EffectivenessQuality of Healthcare in Canada: A Chartbook
Prevention and Health Promotiondebatable. However, it is undeniable that public health, health promotion and healthprevention are an increasingly important facet of healthcare delivery.
Table 1.2 contains data from the CanadianCommunity Health Survey (2003-2007) and provides insight into the health status of Canadians.
Table 1.2 Modifiable health risk factors, Canadian Community Health Survey (2003-2007)Modifiable health risk factors Year % respondents Current smoking (daily or occasional) 2003 22.9%
2005 21.7%2007 21.9%
Overweight/Obese 2003 48.1%2005 48.9%2007 48.5%
Five or more drinks, on one occasion, at least once per month in preceding year 2003 20.7%2005 21.8%2007 21.8%
Leisure time, physically inactive 2003 46.4%2005 46.2%2007 47.6%
Vegetable and fruit consumption, fewer than five or more per day 2003 38.9%2005 41.2%2007 41.3%
Source: Health Care in Canada Survey, 2007
There are a number of processes and services thathealthcare systems should provide in order toprevent ill health or to facilitate early detectionof disease, thus improving outcomes. This sectionpresents data on such processes, including:• immunization • management of risk factors such as hypertension and hyperlipidaemia
• cancer screening.

94.5
85.2
0
20
40
60
80
100
United
State
s
United
King
dom
Swed
enFra
nce
Canad
a
Austr
alia
99.098.0
78.0
92.2
Vaccinations are one of the most cost-effectivedisease prevention strategies in public health.The World Health Organization recommendsimmunity levels of around 95% to prevent outbreaks of disease (Health Protection Agency, 2001). The chart shows coverage rates for diphtheria, tetanus and pertussis (DTP) vaccination. The results from Canada are substantially lower than those of comparator countries.
77
Effectiveness
Chart 1.41 Childhood immunization: International
Sour
ce OEC
D, 2008
Not
e:Canada data are from
2004.
Childhood immunization coverage: Diphtheria, tetanus and pertussis, 2006
Coverage (%
)

0
20
40
60
80
100
2007200520032000-20011996-1997
47.8
62.9 62.166.2 64.1
An estimated 10-25% of Canadians may getinfluenza each year. For the majority of people, itis an unpleasant but self-limiting illness. However,for those in high-risk groups (those aged 65+ orwith underlying respiratory or cardiovascular disease, diabetes or impaired immunity), influenzais much more serious. An estimated 4,000 to8,000 Canadians, mostly seniors, die every yearfrom pneumonia related to influenza, and manyothers may die from other serious complicationsof the disease (Health Canada, online b). The chartsillustrate data from the Canadian CommunityHealth Survey and show the proportion ofrespondents aged 65+ years who indicated thatthey had a flu shot in the preceding year. Thereis considerable variation in rates of immunizationamong provinces. To set these data in context, in2007-2008, the percentage of the population inEngland aged 65+ years immunized against influenzawas 74% (NHS Information Centre, online).
78
EffectivenessQuality of Healthcare in Canada: A Chartbook
Chart 1.42 Flu vaccination among people aged 65+: Canada
Influenza immunization in previous year, age65+, Canada 1996-1997 to 2007
64
48
62
71
57
60
70
6163
56
61
74
71
85
0
20
40
60
80
100
Nunav
ut
Northw
est Te
rritori
esYu
kon
British
Columbia
Albert
a
Saska
tchew
an
Manito
ba
Quebe
c
Ontario
New Brun
swick
Nova Sc
otia
Princ
e Edw
ard
Islan
d
Newfou
ndlan
d
and L
abrad
orCAN
ADA
Influenza vaccination in the 65+ age group, 2007
% re
spondents
% re
spondents (age standardized)
Sour
ce:Statistics Canada, Canadian Community Health Survey, 2007
Not
e: Nunavut data are from
2005.

89
81
91
82
86 87
95
86
78
90
77 77
84 83
95
84
0
20
40
60
80
100
United
State
s
United
King
dom
New Ze
aland
Netherl
ands
German
yFra
nce
Canad
a
Austr
alia
Hypertension (high blood pressure) and hyperlipidaemia (high cholesterol) are important risk factors in the development of heart disease and stroke. Evidence-basedguidelines recommend that patients with diabetes, heart disease and hypertension should undergo regular checks. In 2008, the Commonwealth Fund survey of sickeradults asked all respondents whether, in theprevious year, they had their blood pressurechecked, and asked respondents with heart disease, diabetes or hypertension whether theyhad their cholesterol level checked in the sameperiod. The chart illustrates the proportion whoanswered “yes” to these questions. For Canada,91% of respondents had their blood pressurechecked and 82% of respondents indicated thatthey had their cholesterol checked.
79
Effectiveness
Chart 1.43 Monitoring blood pressure and cholesterol: International
Sour
ce: Commonwealth Fund, 2008
Blood pressure and cholesterol checks, survey data, 2008
% re
spondents
Blood pressure checked in past year (all respondents)
Cholesterol checked in past year (CHD, hypertension and diabetes pts)

94
82
89
77
90
78
82
75
89
83
90
75
9496
8083
86
77
88
76
91
76
0
20
40
60
80
100
British
Columbia
Albert
a
Saska
tchew
an
Manito
ba
Ontario
Quebe
c
New Brun
swick
Nova Sc
otia
Princ
e Edw
ard
Islan
d
Newfou
ndlan
d
and L
abrad
orCAN
ADA
The Canadian Survey of Experiences withPrimary Health Care (CSE-PHC), 2008, askedrespondents who reported having diabetes,heart disease, stroke, high blood pressure orhypertension: “In the past 12 months, did youget blood pressure and cholesterol measurementsto monitor your condition?” The proportion ofrespondents who indicated that they had theirblood pressure measured ranged from 82.1% inNova Scotia to 96.4% in Manitoba. The datafor a routine cholesterol test in the precedingyear ranged from 74.6% in Nova Scotia to82.9% in New Brunswick.
80
EffectivenessQuality of Healthcare in Canada: A Chartbook
Chart 1.44 Monitoring blood pressure and cholesterol: Canada
Sour
ce: Statistics Canada, CSE-PHC, 2008
Provision of routine health checks, people with select chronic conditions, survey data, 2008
% re
spondents (age/sex standardized)
Blood pressure Cholesterol
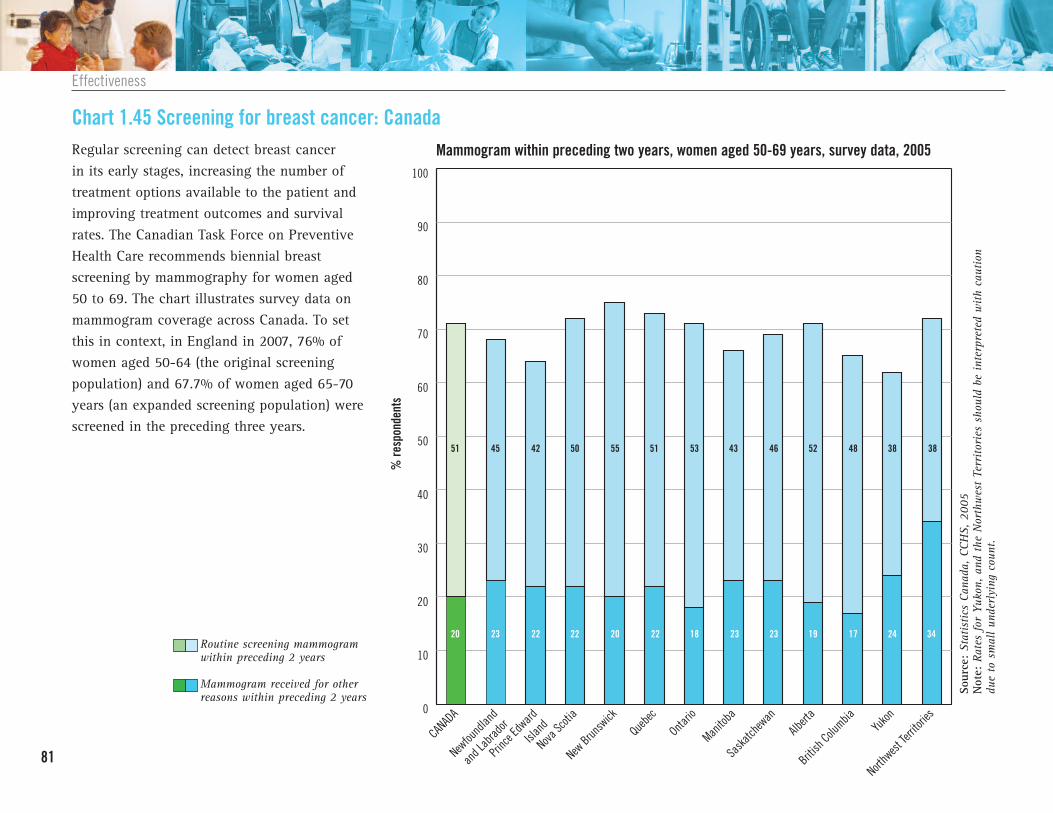
0
10
20
30
40
50
60
70
80
90
100
Northw
est Te
rritori
esYu
kon
British
Columbia
Albert
a
Saska
tchew
an
Manito
ba
Ontario
Quebe
c
New Brun
swick
Nova Sc
otia
Princ
e Edw
ard
Islan
d
Newfou
ndlan
d
and L
abrad
orCAN
ADA
20 23 22 22 20 22 18 23 23 19 17 24 34
51 45 42 50 55 51 53 43 46 52 48 38 38
Regular screening can detect breast cancer in its early stages, increasing the number oftreatment options available to the patient andimproving treatment outcomes and survivalrates. The Canadian Task Force on PreventiveHealth Care recommends biennial breastscreening by mammography for women aged50 to 69. The chart illustrates survey data onmammogram coverage across Canada. To setthis in context, in England in 2007, 76% ofwomen aged 50-64 (the original screeningpopulation) and 67.7% of women aged 65-70years (an expanded screening population) werescreened in the preceding three years.
81
Effectiveness
Chart 1.45 Screening for breast cancer: Canada
Sour
ce: Statistics Canada, CCH
S, 2005
Not
e: Rates for Yukon, and the Northwest Territories should be interpreted with caution
due to small underlying count.
Mammogram within preceding two years, women aged 50-69 years, survey data, 2005
% re
spondents
Mammogram received for other reasons within preceding 2 years
Routine screening mammogram within preceding 2 years

0
10
20
30
40
50
60
70
80
90
100
Adherence to CRC guidelines
Adherence to endoscopy screening guidelines
Adherence to FOBT screening guidelines
15
21
30
Regular screening can reduce death from colorectal cancer. Patients whose cancer isdetected early have an estimated 90% chanceof being cured, compared with only 10% if thecancer is detected at an advanced stage.Studies have demonstrated that colorectal cancer death rates can be reduced by 15-18%with regular screening using the fecal occultblood test (FOBT) (Mandel et al, 1993; 1999;Hardcastle et al, 1996). The chart contains survey data drawn from the CanadianCommunity Health Survey, 2003, and illustratesthe number of respondents aged 50+ yearswho indicated that they received guideline-compliant care. Internationally, other countriesthat have implemented FOBT screening programshave achieved significantly higher participationrates. Australia and Finland achieved 45% and 70% participation respectively among theinvited population in their programs’ initialrounds of screening. In the United States, theVeterans’ Administration screened about 75%of its plan members for colorectal cancer in2003; 90% of them were screened with FOBT.
82
EffectivenessQuality of Healthcare in Canada: A Chartbook
Chart 1.46 Adherence to colorectal cancer screening guidelines: Canada
Sour
ce: Statistics Canada, CCH
S, analysis by Sewitch et. al., 2008
Not
e:Data are draw
n from
all health regions in Newfoundland and Labrador and British Colum
bia,
14/37 regions in Ontario and 7/11 regions in Saskatchewan.
Adherence to colorectal cancer screening guidelines among Canadians aged 50+ years, survey data, selected provinces, 2003
% re
spondents

74
78
81 8279
70
73
7678 77
74
7982
78
0
20
40
60
80
100
Nunav
ut
Northw
est
Territo
riesYu
kon
British
Columbia
Albert
a
Saska
tchew
an
Manito
ba
Ontario
Quebe
c
New Brun
swick
Nova Sc
otia
Princ
e Edw
ard
Islan
d
Newfou
ndlan
d
and L
abrad
orCAN
ADA
Cervical cancer is preventable. Despite this, in2009 there will be an estimated 1,300 newcases of cervical cancer in Canada and some380 women will die from the disease (CanadianCancer Society, 2009). Regular screening viaPap smear is an essential defence against cervicalcancer. Cervical screening can detect early cellchanges on the cervix caused by persistenthuman papillomavirus (HPV) infection, whichcan progress to cancer if not found and treated.Although there is now a vaccine that can blockHPV infections before they occur, it does notprotect against all cancer-causing HPV strains.As a result, vaccination is not a substitute forcervical cancer screening; women continue toneed regular (every three years) cervicalscreening tests. The chart illustrates surveydata from women across Canada. The proportionof respondents who indicated they had undergonecervical screening in the preceding three yearsranged from 69.8% in Quebec to 82.2% inNova Scotia. To set this in an internationalcontext, in 2008 in England, 78.6 % of eligiblewomen had been screened at least once in theprevious five years.
83
Effectiveness
Chart 1.47 Cervical cancer screening: Canada
Sour
ce: Statistics Canada, CCH
S, 2005
Pap smear in preceding 3 years, females aged 18-69, survey data, 2005
% re
spondents (age standardized)

An appropriate procedure is defined as one in which “the expected health benefit (e.g.,increased life expectancy, relief of pain, reductionin anxiety, improved functional capacity)exceeds the expected negative consequences(e.g., mortality, morbidity, anxiety, pain, timelost from work) by a sufficiently wide marginthat the procedure is worth doing, exclusive ofcost” (Brook et al., 1986; Park et al., 1986).
84
EffectivenessQuality of Healthcare in Canada: A Chartbook
AppropriatenessThe concept of appropriateness has been usedto examine both overuse and underuse ofhealthcare services (Fitch et al, 2001). Thisreport adopts a broad interpretation of theconcept to examine three issues: • Appropriateness of primary care services(measured via hospitalizations for ambulatorycare sensitive conditions, as an indicator of underuse)
• Appropriateness of hospital discharge (measured via re-admission rates, with highre-admissions indicating underuse)
• Caesarean section rates (often cited as an example of an overused procedure indeveloped countries)

451
351
668
522
704
548 560
809
402
640
484
380
426
317
476
392
614
559
445
360 353
294
606
518
869
710
1036
1204
0
300
600
900
1200
1500
Nunav
ut
Northw
est
Territo
riesYu
kon
British
Columbia
Albert
a
Saska
tchew
an
Manito
ba
Ontario
Quebe
c
New Brun
swick
Nova Sc
otia
Princ
e Edw
ard
Islan
d
Newfou
ndlan
d
and L
abrad
orCAN
ADA
Hospitalization rate (age <75 yrs) for ambulatory care sensitive conditions, 2001-2002 to 2006-2007Ambulatory care sensitive conditions (ACSCs)encompass chronic diseases – such as angina,asthma, chronic obstructive pulmonary disease,diabetes, heart failure and hypertension – thatcan be managed in the community. While notall hospital admissions for ACSCs are avoidable,appropriate ambulatory care in the communitycan prevent acute exacerbations or arrest diseaseprogression. Well-functioning and accessibleprimary healthcare services are essential to themanagement of ACSCs. Hospitalization ratescan serve as a proxy indicator for quality of care, although rates are also affected by factors such as patients’ socioeconomic status,co-morbidities, and others. Between 2001 and2006, there was a 22% fall in hospitalizationsfor ACSCs across Canada as a whole (dataexclude Quebec). The greatest decrease wasrecorded in Nova Scotia (-28.2%). Higher ACSChospitalization rates are associated with lowphysician supply. Chart 3.7 shows that Nunavuthas low rates of family physicians per capita.
85
Effectiveness
Chart 1.48 Hospitalizations for ambulatory care sensitive conditions: Canada
Rate per 100,000 population (age standardized)
2001-2002
2006-2007

Change, 2001-06Canada -22.2%Newfoundland and Labrador -21.9%Prince Edward Island -22.2%Nova Scotia -28.2%New Brunswick -20.9%Quebec -21.5%Ontario -25.6%Manitoba -17.6%Saskatchewan -9.0%Alberta -19.1%British Columbia -16.7%Yukon -14.5%Northwest Territories -18.3%Nunavut 16.2%
.
86
EffectivenessQuality of Healthcare in Canada: A Chartbook
Source: Health Indicators, CIHI, 2008 Notes: Canada rates exclude Quebec. Data from Quebec for 2006-2007 were not available at thetime of publication; rates for 2001-2002 and 2005-2006 are presented for Quebec. Rates forYukon, the Northwest Territories and Nunavut should be interpreted with caution due to smallunderlying count.

12
6
9
1311 12
17
0
10
20
30
40
50
60
70
80
90
100
United
State
s
United
King
dom
New Ze
aland
Netherl
ands
German
yFra
nce
Canad
a
Austr
alia
15
High re-admission rates can be an indicator of premature discharge or poor quality of care (CIHI, 2002). The Commonwealth FundInternational Health Policy Survey, 2008, askedrespondents who had been hospitalized in thepreceding two years: “After you were discharged,were you readmitted to a hospital or did youhave to go to a hospital emergency departmentas a result of complications that occurred duringyour recovery?” The proportion of respondentsanswering “yes” in each country is depicted inthe chart. Canada recorded the second-highestproportion of re-admissions, with only the U.S.respondents indicating a higher proportion ofre-admissions.
87
Effectiveness
Chart 1.49 Re-admission after discharge: International
Sour
ce: Commonwealth Fund, 2008
Re-admission after discharge, survey data, 2008
% re
spondents

26.3
30.631.4
26.8
28
22.9
27.8
19.820.8
27
30.5
22.9
19.6
6.8
0
5
10
15
20
25
30
35
Nunav
ut
Northw
est
Territo
riesYu
kon
British
Columbia
Albert
a
Saska
tchew
an
Manito
ba
Ontario
Quebe
c
New Brun
swick
Nova Sc
otia
Princ
e Edw
ard
Islan
d
Newfou
ndlan
d
and L
abrad
orCAN
ADA
The proportion of women in Canada whodelivered by Caesarean section increased fromapproximately 5% in the late 1960s to about20% in the early 1980s. A persistent increasehas occurred since then, both in Canada andmany other industrialized countries (PHAC,2008). Explanations for the increase includechanging maternal characteristics such asincreases in maternal age, increases in pre-pregnancy body mass index, obstetric practice, and social factors. Caesarean sectionsincrease maternal morbidity/mortality and areassociated with higher costs. Rates can be usedto monitor practice with the assumption thatlower rates indicate more appropriate, as well asmore efficient, care. Across provinces, Caesareansection rates in 2006-2007 ranged from 19.8%in Manitoba to 31.4% in Prince Edward Island.To set these data in an international context, OECDfigures for 2005 show that Caesarean sectionsaccounted for 30.0% of live births in Australiaand 23.3% of live births in the U.K. (equivalentOECD Canada data for 2005 was 26.2%).
88
EffectivenessQuality of Healthcare in Canada: A Chartbook
Chart 1.50 Caesarean sections: Canada
Sour
ce: Health Indicators 2008, CIHI
Not
e:Data from
Quebec for 2006-2007 were not available at the time of publication; data for 2005-
2006 are presented for Quebec and Canada. Rates for Yukon, the Northwest Territories and Nunavut
should be interpreted with caution due to small underlying count.
Caesarean section rates, 2006-2007
C sections per 100 hospital deliveries

89
Effectiveness

90
AccessQuality of Healthcare in Canada: A Chartbook

Introduction 92
Waits for Primary and Emergency Care 93Chart 2.1 Access to a regular doctor: International 94
Chart 2.2 Access to a regular doctor: Canada 95
Chart 2.3 Reported difficulties gaining access to routine or ongoing care: Canada 96
Chart 2.4 Unmet healthcare needs: Canada 97
Chart 2.5 Waits for primary care: International 98
Chart 2.6 Waits for routine primary care: Canada 99
Chart 2.7 Waits for immediate healthcare (minor health problem): Canada 100
Chart 2.8 Emergency department used for primary care:International 101
Chart 2.9 Emergency department used for primary care:International time series 102
Chart 2.10 Emergency department used for primary care: Canada 103
Chart 2.11 Waits in the emergency department: International 104
Chart 2.12 Waits in the emergency department: Canada 105
91
Access
ACCESSWaits for Secondary and Specialist Care 107Chart 2.13 Waits to see specialist: International 108
Chart 2.14 Wait times for specialist appointment: Canada 109
Excessive Waits for Priority Procedures 110Chart 2.15 Waits for joint replacement surgery: Canada 111
Chart 2.16 Waits for cataract removal surgery: Canada 112
Chart 2.17 Waits for radiation therapy: Canada 113
Chart 2.18 Waits for coronary artery bypass grafts: Canada 114
Chart 2.19 Waits for selected diagnostic tests: Canada 115

IntroductionAccess to healthcare is a prominent concern ofpatients and the public around the world. Accessencompasses a range of issues: the timeliness ofservices received; whether services are providedwithin an appropriate setting; and whether theyare delivered by skilled providers (Grol et al., 1999;Davis et al., 2007; inter alia).
Barriers to access are many and varied. Theyinclude long waits for service, charges forservices, costs for insurance coverage, lack ofpersonal or public transport, and cultural or
92
AccessQuality of Healthcare in Canada: A Chartbook
language differences between patients andhealth professionals. Poor access has potentiallyserious consequences, including deteriorationin individuals’ health status and subsequentextra costs for healthcare systems.
In countries with no public health insurance,costs and affordability are the primary barriersto access. In countries with public healthinsurance, wait times tend to be problematic;consequently wait times, along with availabilityof healthcare professionals, remain overriding
concerns in Canada. In Canada, a 2007 surveyfound that wait times was the most commonlycited concern (20% of respondents) among arange of healthcare issues facing the country(Health Care in Canada, 2007).
This chapter focuses on these issues. It is organizedaround two key areas of service provision:• Waits for primary and emergency care• Waits for secondary care and
specialist services

93
Access
Waits for Primary and Emergency CareGovernments across Canada have beenengaged in significant primary care reform: • In September 2000, First Ministers agreed
that improvements to primary healthcarewere crucial to the renewal of Canada’shealth system.
• In February 2003, First Ministers agreed to a Health Care Accord that set a target of50% of Canadians having 24/7 access to an appropriate primary healthcare providerby 2011.
• In September 2004, First Ministers reiteratedthe target in the 10-Year Plan to StrengthenHealth Care, and First Ministers furtheragreed to establish a best practices networkfor information-sharing and collaboration.
(Health Canada, online c)
Primary care is the cornerstone of healthcarein Canada. Primary healthcare offers a sustainable way to improve quality through:health promotion activities and improvedhealth status of Canadians; early managementof chronic diseases and prevention of complications; co-ordination of care, eliminating waste and duplication; and continuity of care and appropriate follow-up to hospitalization, reducing readmission ratesand relapses.
There is almost universal agreement that primary health care offers tremendous potentialbenefits to Canadians and to the health caresystem ... no other initiative holds as muchpotential for improving health and sustainingour health care system.
(Romanow Commission, 2002: 150).
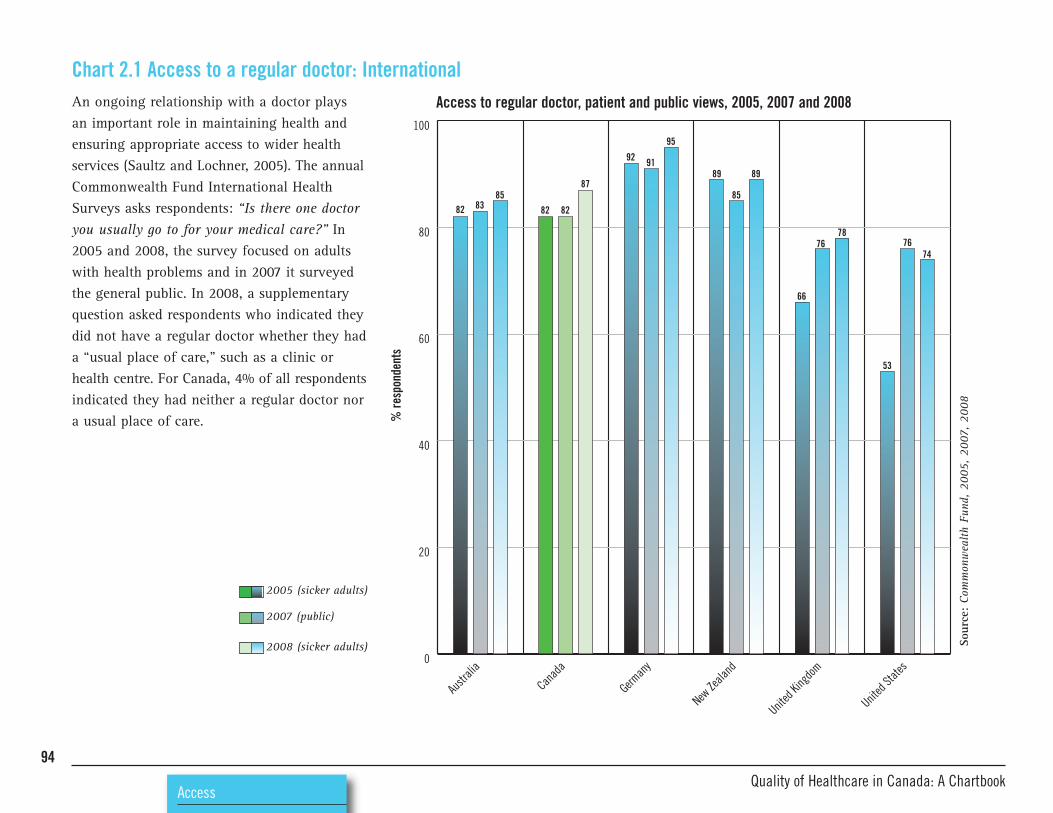
94
AccessQuality of Healthcare in Canada: A Chartbook
82 8385
82 82
87
92 91
95
89
85
89
66
7678
53
7674
0
20
40
60
80
100
United
State
s
United
King
dom
New Ze
aland
German
y
Canad
a
Austr
alia
An ongoing relationship with a doctor plays an important role in maintaining health andensuring appropriate access to wider healthservices (Saultz and Lochner, 2005). The annualCommonwealth Fund International HealthSurveys asks respondents: “Is there one doctoryou usually go to for your medical care?” In2005 and 2008, the survey focused on adultswith health problems and in 2007 it surveyedthe general public. In 2008, a supplementaryquestion asked respondents who indicated theydid not have a regular doctor whether they hada “usual place of care,” such as a clinic orhealth centre. For Canada, 4% of all respondentsindicated they had neither a regular doctor nora usual place of care.
Chart 2.1 Access to a regular doctor: InternationalAccess to regular doctor, patient and public views, 2005, 2007 and 2008
Sour
ce: Commonwealth Fund, 2005, 2007, 2008
% re
spondents
2005 (sicker adults)
2007 (public)
2008 (sicker adults)

95
Access
0
20
40
60
80
100
British
Columbia
Albert
a
Saska
tchew
an
Manito
ba
Ontario
Quebe
c
New Brun
swick
Nova Sc
otia
Princ
e Edw
ard
Islan
d
Newfou
ndlan
d
and L
abrad
orCAN
ADA
85
89 88
9392
74
90
85 8482
87
The Canadian Community Health Survey(CCHS) consistently asks whether respondents(Canadians 15 years and over) have a “regularfamily physician;” that is, a general physicianseen for most routine care such as annualcheck-ups, blood tests and flu shots. The chartshows that, in 2007, 85% of Canadians reportedhaving a regular medical doctor. Based onCCHS data, it has been estimated that, in 2007,around 1.7 million Canadians had looked for a regular doctor but could not find one (CIHI,2008b). Across provinces, access to a regularfamily physician was variable, with Quebecresidents indicating the lowest level of access.Supplementary data for the 12+ age-rangeshows generally poorer access to a regulardoctor in the three territories. In the 10 largestcommunities of Nunavut, only 13.4% ofrespondents indicated that they had access to a regular doctor, compared to 40.8% ofrespondents in the Northwest Territories and77.9% in Yukon (see CANSIM 105-0501).
Chart 2.2 Access to a regular doctor: Canada
Sour
ce: Statistics Canada, CCHS, 2007
Regular family physician, age 15+ years, public survey, 2007
% re
spondents

96
AccessQuality of Healthcare in Canada: A Chartbook
0
10
20
30
40
50
60
70
80
90
100
British
Columbia
Albert
a
Saska
tchew
an
Manito
ba
Ontario
Quebe
c
New Brun
swick
Nova Sc
otia
Princ
e Edw
ard
Islan
d
Newfou
ndlan
d
and L
abrad
orCAN
ADA
14.0 13.4
4.42.5
5.3
8.4
2.24.0
5.4 4.42.7 2.5
4.73.5
10.9
18.2
13.116.1
13.316.1
13.1
16.5
The Canadian Community Health Survey regularly asks respondents if they have experienced difficulties in gaining access toroutine or ongoing care, either during or outsideregular office hours. The chart illustrates that, in2007, respondents from Prince Edward Islandreported the most difficulties gaining access toroutine care and Nova Scotia respondents thefewest. Types of barriers to accessing routineor ongoing care were analyzed by the HealthServices Access Survey in 2001. It found thatthe most frequently cited barriers included: difficulties getting an appointment; waiting too long for an appointment; waiting too longto see a physician (in-office wait); and difficulty contacting a physician (see CANSIM Table 105-3019).
Chart 2.3 Reported difficulties gaining access to routine or ongoing care: CanadaReported difficulties accessing routine or ongoing care, aged 15+ years, 2007
Sour
ce: Statistics Canada, CCHS, 2007
Not
e: Data for "during evenings and weekends" for NL, NS, NB, MB, SK and BC should be
interpreted with caution.
% re
spondents
Regular office hours
During evenings and weekends

97
Access
0
10
20
30
40
50
60
70
80
90
100
British
Columbia
Albert
a
Saska
tchew
an
Manito
ba
Ontario
Quebe
c
New Brun
swick
Nova Sc
otia
Princ
e Edw
ard
Islan
d
Newfou
ndlan
d
and L
abrad
orCAN
ADA
10.28.0 8.6
7.0
9.3
13.5
10.1 11.0
7.5 7.8 7.8
The Canadian Survey of Experiences withPrimary Health Care, 2008, asked respondents:“During the past 12 months, was there ever atime when you felt that you needed health carebut you didn’t receive it?” The chart illustratesthat respondents from Quebec were most likelyto report unmet healthcare needs (13.5%) whilethose from Nova Scotia recorded the lowestlevels of unmet needs (7.0%).
Chart 2.4 Unmet healthcare needs: CanadaUnmet healthcare needs, public survey, provinces, 2008
% re
spondents
Sour
ce: CSE-PHC, 2008
Data from PEI should be interpreted with caution.

98
AccessQuality of Healthcare in Canada: A Chartbook
0
20
40
60
80
100
United
State
s
United
King
dom
New Ze
aland
Netherl
ands
German
yFra
nce
Canad
a
Austr
alia
14
10
37
37 25
29
12
28 5
12
34
44
43
27
10
19
35
55
32
3
5
37
51
45
32
11
10
13
20
38
25
The Commonwealth Fund International HealthPolicy Survey generally asks respondents: “Last time you needed medical attention, howquickly could you get an appointment to see a doctor (not including a visit to EmergencyDepartment)?” In 2008, the survey focused on sicker adults. Of the countries surveyed,Canada and the United States had the lowestproportion of respondents (25%) indicatingthat they could get an appointment on thesame day.
Chart 2.5 Waits for primary care: International
Sour
ce:Commonwealth Fund, 2008
Waits for primary care, survey of sicker adults, 2008
% re
spondents
> 1 week/never
4-7 days
1-3 days
Same day

99
Access
0
20
40
60
80
100
British
Columbia
Albert
a
Saska
tchew
an
Manito
ba
Ontario
Quebe
c
New Brun
swick
Nova Sc
otia
Princ
e Edw
ard
Islan
d
Newfou
ndlan
d
and L
abrad
orCAN
ADA
18
23
15
36
19
21
22
41
27
21
22
7
22
9
24
36
33
14
32
17
33
6
28
29
20
36
20
15
13
21
29
33
24
15
20
3437
17
27
12
19
9
18
44
The Canadian Survey of Experiences withPrimary Health Care, 2008, asked respondents:“Thinking about the last time you received routine or ongoing care, how long did you haveto wait between when you needed care and whenyou received care?” The chart illustrates thatoverall, about one-third of patients wait lessthan one day for a routine appointment. Theproportion of patients who reported waitinglonger than three weeks for routine or ongoingcare ranged from 6.8% in Newfoundland andLabrador to 28.8% in Quebec.
Chart 2.6 Waits for routine primary care: Canada
Sour
ce:Statistics Canada, CSE-PHC, 2008
Waits for routine or ongoing care, patient survey, 2008
% re
spondents
> 21 days
4-21 days
1-3 days
< 1 day

100
AccessQuality of Healthcare in Canada: A Chartbook
0
20
40
60
80
100
British
Columbia
Albert
a
Saska
tchew
an
Manito
ba
Ontario
Quebe
c
New Brun
swick
Nova Sc
otia
Princ
e Edw
ard
Islan
d
Newfou
ndlan
d
and L
abrad
orCAN
ADA
78.7
76.573.7
75.7
82.785.0
76.4 76.6
80.4
77.175.3
In 2008, the Canadian Survey of Experienceswith Primary Health Care asked respondents:“Thinking of the last time you received immediatecare for a minor health problem, how long didyou have to wait to receive care?” The chartshows that overall, more than three-quarters ofpatients reported that they were seen in less thanone day. The largest proportion of respondentsseen quickly was from Quebec (85.0%) and thesmallest proportion was from Prince EdwardIsland (73.7%).
Chart 2.7 Waits for immediate healthcare (minor health problem): CanadaWaits of < 1 day for immediate primary care (minor problem), survey data, 2008
Sour
ce: Statistics Canada, CSE-PHC, 2008
% re
spondents

101
Access
0
10
20
30
40
50
60
70
80
90
100
United
State
s
United
King
dom
New Ze
aland
Netherl
ands
German
yFra
nce
Canad
a
Austr
alia
35
39
24
18
29
21
24
36
In 2008, the Commonwealth Fund surveyfocused on adults with health problems. Itasked those respondents who indicated thatthey had used the emergency department inthe preceding two years: “The last time youwent to the hospital emergency department,was it for a condition that you thought couldhave been treated by your regular doctor ifhe/she had been available?” A high proportionof positive responses suggests that access toprimary care is problematic. Of the countriesincluded in the survey, Canada had the highestproportion of respondents indicating that they had used the emergency department forprimary care. Canadian respondents to theCommonwealth Fund surveys have consistentlyreported problems with access to primary care,as shown in the chart on the next page.
Chart 2.8 Emergency department used for primary care: International
Sour
ce: Commonwealth Fund, 2008
Use of ED for primary care, survey of sicker adults, 2008
% re
spondents

102
AccessQuality of Healthcare in Canada: A Chartbook
0
10
20
30
40
50
60
70
80
90
100
United StatesUnited KingdomCanada
49
35
44
39
21
2628
24
52
46
36
45
The Commonwealth Fund’s International HealthPolicy Survey has consistently asked respondentswhether they had used the emergency departmentin the preceding two years. In 2008, of the fullsamples, 64% of Canadians, 41% of British and58% of American respondents indicated thatthey had used the emergency department. Thissubset was then asked: “The last time you wentto the hospital emergency department, was itfor a condition that you thought could havebeen treated by your regular doctor if he/shehad been available?” The chart illustrates theresponses from Canadian surveys between2004 and 2008. The surveys vary from year toyear in terms of sampling frames, sometimesfocusing on adults with health problems,sometimes on the general public. Between one-third and one-half of Canadian respondentswho reported using the emergency departmentindicated that they did so for primary care.Despite similarities in terms of substantial publicfunding between the United Kingdom andCanada, responses from Canadian respondentsare more closely aligned with those from theU.S. than the U.K.
Chart 2.9 Emergency department used for primary care: International time series Use of ED for primary care, Canada, UK, and US, patient and public surveys, 2004-2008
Sour
ce: Commonwealth Fund, 2004, 2005, 2007, 2008
% re
spondents
2004 (public)
2005 (sicker adults)
2007 (public)
2008 (sicker adults)

103
Access
0
10
20
30
40
50
60
70
80
90
100
British
Columbia
Albert
a
Saska
tchew
an
Manito
ba
Ontario
Quebe
c
New Brun
swick
Nova Sc
otia
Princ
e Edw
ard
Islan
d
Newfou
ndlan
d
and L
abrad
orCAN
ADA
41.6
55.2
49.547.3
51.248.6
38.9 39.0
45.7
42.4
28.4
The Canadian Survey of Experiences withPrimary Health Care, 2008, asked respondentswhether they had visited the emergencydepartment in the preceding 12 months. Ofthose who answered yes, it asked: “The lasttime you went to the hospital emergencydepartment, was it for a condition that youthought could have been treated by your primary care provider if he/she had been available?” The chart illustrates that the proportion of respondents that did use theemergency department for primary care ranged from 28.4% in British Columbia to55.2% in Newfoundland and Labrador.
Chart 2.10 Emergency department used for primary care: Canada
Sour
ce: Statistics Canada, CSE-PHC, 2008
Use of ED for primary care, public survey, provinces, 2008
% re
spondents (of those who attended ED)

104
AccessQuality of Healthcare in Canada: A Chartbook
0
20
40
60
80
100
United
State
s
United
King
dom
New Ze
aland
Netherl
ands
German
y
Canad
a 200
8
(sick
er ad
ults)
Canad
a
2007
(pub
lic)
Austr
alia
12
21
10
55
39
14
20
25
1
29
1
17
16
35
72
9
15
3
17
73
5
3
16
9
12
61
50
16
22
9
18
12
1
16
52
Respondents to the 2007 Commonwealth FundInternational Health Policy survey were askedwhether they had used the emergency departmentin the preceding two years. Respondents whoindicated that they had done so were thenasked: “The last time you went to the hospitalemergency department, how long did you wait before being treated?” Compared to othercountries, Canadian respondents in 2007 hadthe longest waits in the emergency department.In 2008, the same question was asked ofCanadian respondents only.
Chart 2.11 Waits in the emergency department: InternationalWaits in emergency department, public and patient surveys, 2007 and 2008
Sour
ce: Commonwealth Fund, 2007, 2008
% re
spondents
< 1 hour
1 to < 2 hours
2 to < 4 hours
4 hours or more
left without being seen

105
Access
The Canadian Association of EmergencyPhysicians has outlined medically acceptablewait times in emergency departments, in termsof the Canadian Triage and Acuity Scale(CTAS). The five CTAS triage levels are shownin Table 2.1, below.
Chart 2.12 Waits in the emergency department: CanadaThe Canadian Survey of Experiences withPrimary Health Care, 2008, asked respondentswho indicated that they had visited the emergency department in the preceding 12months: “The last time you went to the hospitalemergency department, how long did you waitfrom the time you entered the ER to the timeyou were treated?” The chart illustrates responsesfrom around the country. Of respondentswho visited the emergency department in thepreceding 12 months, the proportion that waitedlonger than four hours ranged from 14% inSaskatchewan to 44.6% in Quebec. The survey
provides no information about the severity ofthe problem for which patients visited theemergency department. Across Canada, 29.5%of respondents indicated that they waitedlonger than four hours to be seen: twice themaximum recommended response time. Thesedata should be interpreted in light of the factthat many Canadians in rural locations use theemergency department for primary care (seeChart 2.9), rather than for emergencies per se.Such differences in patient population and utilization patterns may contribute to the longwaits reported.
CTAS level Level of Nursing response Physician response Sentinel diagnosis ED Targets* illness/acuity time time
Level 1 Resuscitation Immediate Immediate Cardiac arrest 98%
Level 2 Emergent Immediate <15 minutes Chest pain 95%
Level 3 Urgent <30 minutes <30 minutes Moderate asthma 90%
Level 4 Less urgent <60 minutes <60 minutes Minor trauma 85%
Level 5 Non urgent <120 minutes <120 minutes Common cold 80%
* ED targets refer to the proportion of patients triaged to each level who should be seen within the stated response times.
Source: CAEP, 2005
Table 2.1: Canadian Triage and Acuity Scale

106
AccessQuality of Healthcare in Canada: A Chartbook
0
20
40
60
80
100
British
Columbia
Albert
a
Saska
tchew
an
Manito
ba
Ontario
Quebe
c
New Brun
swick
Nova Sc
otia
Princ
e Edw
ard
Islan
d
Newfou
ndlan
d
and L
abrad
orCAN
ADA
30
35
34 43
34
23 22
42
36
43
34
21
40
33
27
27
28
45
39
33
27
19
40
4146
38
14
38
34
28
35
21
43
Waits in the emergency department, patient survey, 2008
Sour
ce: Statistics Canada, CSE-PHC, 2008
% re
spondents
4+ hours
1 to <4 hours
< 1 hour

107
Access
In response to sustained levels of concern, FirstMinisters in 2004 made a collective commitmentto achieve meaningful reductions in wait timesfor secondary care in the 10-Year Plan toStrengthen Health Care (Health Canada, online d).The 10-Year Plan identified five priority areas: • cancer• heart• diagnostic imaging• joint replacements• sight restoration
Waits for secondary and specialist care Poor access and delays can have serious consequences, resulting in emotional distressand physical suffering or harm to patients, aswell as higher treatment costs (Leddy et al.,2003; Boudreau et al., 2004). In terms of theeconomic cost of waits in Canada, the Centrefor Spatial Economics (CSE, 2008) analyzeddata for four procedures: total joint replacementsurgery; cataract surgery; coronary arterybypass graft (CABG); and MRI scans. Costs ofwaits for these procedures were found to rangefrom an average of $2,900 per patient forcataract surgery to $26,400 per patient forjoint replacement surgery. The economic costof waiting for treatment across all four priorityareas in 2007 was an estimated $14.8 billion.
In 2008, CIHI reviewed available data on waittimes across Canadian provinces. The studyrevealed marked variation in both targets anddata definitions across key disease areas. Thelack of robust, standardized and validated dataon a country-wide basis has hampered thoseseeking to investigate issues of access to qualityhealthcare in Canada. However, this shortcomingis beginning to be addressed; a 2009 CIHIreport documents progress made, althoughsome variations in data definitions and collectionpersist (CIHI 2008; 2009).

108
AccessQuality of Healthcare in Canada: A Chartbook
0
20
40
60
80
100
United
State
s
(200
8)
United
State
s
(200
5)
United
King
dom
(200
8)
United
King
dom
(200
5)Canad
a
(200
8)Canad
a
(200
5)
57
26
10
44
42
14
11
21
60
41
16
43
20
47
23
59
13
27
The 2008 Commonwealth Fund survey focusedon sicker adults, asking them: “After learningyou needed to see a specialist doctor, how longdid you have to wait for an appointment?”Compared to other countries, Canada had themost respondents indicating that they were notseen by a specialist in under a month. Twentypercent indicated they waited longer than threemonths – the highest proportion among thecountries surveyed (data not shown). The same question was asked in the 2005 survey ofsicker adults. In that survey, 10% of Canadianrespondents indicated that they waited lessthan one week to see a specialist, 26% indicatedthat they waited one-to-four weeks, and 57%waited more than four weeks.
Chart 2.13 Waits to see specialist: InternationalWaits to see specialist, sicker adults, 2005 and 2008
Sour
ce: Commonwealth Fund, 2005, 2008
% re
spondents
> 4 weeks
1 week to < 4 weeks
< 1 week

109
Access
0
20
40
60
80
100
British
Columbia
Albert
a
Saska
tchew
an
Manito
ba
Ontario
Quebe
c
New Brun
swick
Nova Sc
otia
Princ
e Edw
ard
Islan
d
Newfou
ndlan
d
and L
abrad
orCAN
ADA
14
41
46
37
42
21
11
44
45 48
38
15
44
38
18
51
37
12
41
45
15 14
49
37
46
39
15
42
46
12
41
15
44
The Canadian Community Health Survey routinely asks Canadians how long they waitedto be seen by a specialist. The data refer to a visitwith a medical specialist to obtain a diagnosisfor a new illness or condition; they do notinclude visits to specialists for ongoing care for a previously diagnosed condition. In 2007there were approximately three million specialistvisits for a new illness or condition acrossCanada. More than 420,000 patients waitedlonger than three months for their appointment.Across Canada, the median wait for specialistvisits for new illnesses and conditions was 4.3 weeks. At a provincial level, more than one-fifth of respondents from Newfoundlandand Labrador indicated that they waited longerthan three months for an appointment, whichwas the highest proportion of all the provinces.
Chart 2.14 Wait times for specialist appointment: Canada
Sour
ce: Statistics Canada, CCHS, 2007
Not
e: For PEI, NS, NB, MB and AB - estimates suppressed because of extreme sampling variability
Waiting times for specialist visits, survey data, 2007
% re
spondents
> 3 months
1-3 months
< 1 month

110
AccessQuality of Healthcare in Canada: A Chartbook
Following the publication of the 10-Year Planto Strengthen Health Care (2004), there hasbeen a concerted effort to provide timelyaccess to care. Efforts to reduce wait timesfocused initially on five areas: cancer, heart,diagnostic imaging, joint replacement andsight restoration. Provincial benchmarks foracceptable wait times for key procedures in thesepriority areas are shown in Table 2.2, below.
Excessive waits for priority proceduresThe charts on the following pages illustratedata from analyses undertaken by CIHI (2009)showing available data on the proportion ofpatients in each province who were seen within the benchmark period. Of the four procedures analyzed, joint replacement had the highest proportion of patients exceedingrecommended wait times.
Table 2.2: Benchmarks for priority proceduresPriority area Provincial benchmarksJoint replacement (hip and knee) Within 26 weeks
Cataract removal (ophthalmology) Within 16 weeks for patients deemed “at high risk”
Radiation oncology (cancer care) Within 4 weeks
Coronary artery bypass graft (heart disease) Within 2 weeks for level I cases (non-emergency)
Within 6 weeks for level II cases
Within 26 weeks for level III cases

0
20
40
60
80
100
British
Columbia
Albert
a
Saska
tchew
an
Manito
ba
Ontario
Quebe
c
New Brun
swick
Nova Sc
otia
Princ
e Edw
ard
Islan
d
71
75
45 46
66
55
90
86
90
85
80
71
56
37
77
72
78
71
The pan-Canadian benchmark for jointreplacement surgery states that patients shouldwait no longer than 26 weeks (182 days)between the date a surgeon makes a decisionto treat and the date the patient is operated on.The chart illustrates that, for hip replacements,the proportion of patients operated on withinthe benchmark ranged from 45% in NovaScotia to 90% in Quebec and Ontario. Forknees, the proportions ranged from 37% inSaskatchewan to 86% in Quebec. Nova Scotiareported particularly long waits for jointreplacement surgeries, with 90th percentilewaits (that is, the time within which 90% ofpatients are treated) of 642 days for hips and647 days for knees (data not shown).
111
Access
Chart 2.15 Waits for joint replacement surgery: CanadaJoint replacements: Proportion of patients operated on within benchmark, 2008
Sour
ce: CIHI, 2009
Not
e:The CIHI data include only waits for elective hip replacements, and exclude those that are done
on an urgent basis (most often to repair a hip fracture). Newfoundland and Labrador reported regional
ranges (no province-wide data available): 79-100%
for hips; 67-100%
for knees.
% patients
Hip replacement
Knee replacement

0
20
40
60
80
100
British
Columbia
Albert
a
Saska
tchew
an
Manito
ba
Ontario
New Brun
swick
Nova Sc
otia
Princ
e Edw
ard
Islan
d
60
75 74
88
77
84
71
78
In the case of cataract surgery, the pan-Canadianbenchmark specifies that patients should undergosurgery within 16 weeks (112 days) of the surgeon’s decision to treat. The chart illustratesthat the proportion of patients operated onwithin the benchmark ranged from 60% inPrince Edward Island to 88% in Ontario.
112
Chart 2.16 Waits for cataract removal surgery: Canada
Sour
ce: CIHI, 2009
Not
es:Newfoundland and Labrador reported regional ranges (no province-wide data available):
29-100%. Quebec reported 95%
of patients seen within six months.
Cataract surgery: Proportion of patients operated on within benchmark, 2008
AccessQuality of Healthcare in Canada: A Chartbook
% patients

0
20
40
60
80
100
British
Columbia
Saska
tchew
an
Manito
ba
Ontario
New Brun
swick
Princ
e Edw
ard
Islan
d
Newfou
ndlan
d
and L
abrad
or
85
10094
90
99
81
95
The pan-Canadian benchmark for radiationtherapy wait time is four weeks (28 days) fromthe date an oncologist decides the patient isready to begin radiotherapy to the date of thefirst radiotherapy treatment. The chart illustratesthat the proportion of patients receiving treatmentwithin the benchmark ranged from 81% inSaskatchewan to 100% in Prince Edward Island.
113
Access
Chart 2.17 Waits for radiation therapy: CanadaRadiation therapy: Proportion of patients treated within benchmark, 2008
Sour
ce: CIHI, 2009
Not
e: Quebec reported regional ranges (no province-wide data available): 79-100%. Other data
caveats and available 50
thand 90
thpercentile data are contained in the Technical Appendix.
% patients

0
20
40
60
80
100
British
Columbia
Albert
a
Saska
tchew
an
Manito
ba
Ontario
New Brun
swick
Newfou
ndlan
d
and L
abrad
or
95 10095 9998
96
91
The pan-Canadian benchmark for coronaryartery bypass graft surgery states that patientsshould wait no longer than 26 weeks (182days) between the date of the decision to treatand the date the patient is operated on. Thebenchmark states that more urgent cases needto be seen more quickly (within two weeks forlevel I cases and within six weeks for level IIcases). There is, however, no consensus on definitions for urgency levels, so data shownrefer to all cases. The chart illustrates that theproportion of patients operated on within thebenchmark ranged from 91% in BritishColumbia to 100% in Ontario.
114
Chart 2.18 Waits for coronary artery bypass grafts: Canada
Sour
ce: CIHI, 2009
Not
es:PEI does not offer cardiac services; Ontario data refer to elective CABGs only. Nova Scotia
unable to provide data.
CABG: Proportion of patients operated on within benchmark, 2008
AccessQuality of Healthcare in Canada: A Chartbook
% patients

0
20
40
60
80
100
British
Columbia
Albert
a
Saska
tchew
an
Manito
ba
Ontario
Quebe
c
New Brun
swick
Nova Sc
otia
Princ
e Edw
ard
Islan
d
Newfou
ndlan
d
and L
abrad
orCAN
ADA
1111
34
55
52
37
1116
34
50
58
33
8
49
36
15
58
33
9
36
55
9 9
43
48 48
39
13
52
31
18
29
12
60
Waits for diagnostic tests can be a significantbottleneck in patient pathways. This chartillustrates data from the Canadian CommunityHealth Survey. It includes tests such as non-emergency MRI, CT scans and angiography,but not x-rays or blood tests. In 2007 therewere 2.46 million tests performed nationwide.The median wait for tests was two weeks, butapproximately 258,000 patients (about one in10) waited longer than three months.
115
Access
Chart 2.19 Waits for selected diagnostic tests: Canada Waits for selected diagnostic tests, survey data, 2007
Sour
ce: Statistics Canada, CCHS, 2007
> 3 months
1-3 months
< 1 month
% re
spondents

116
CapacityQuality of Healthcare in Canada: A Chartbook

Introduction 118
Spending 119Chart 3.1 Expenditure on health as a percent of GDP:
International 120
Chart 3.2 Expenditure on health per person, $U.S. purchase price parity: International 121
Chart 3.3 Spending on health per capita: Canada 122
Staffing 123Chart 3.4 Physicians: International 124
Chart 3.5 Physicians in Canada: Provinces and territories
Chart 3.6 Family physicians/general practitioners: International 125
Chart 3.6 Family physicians/general practitioners: International 126
Chart 3.7 Family physicians: Canada 127
Chart 3.8 Specialist physicians: International 128
Chart 3.9 Specialist physicians: Canada 129
Chart 3.10 Dentists: Canada 130
Chart 3.11 Registered nurses per capita: International 131
Chart 3.12 Registered nursing workforce: Canada 132
117
Capacity
CAPACITYEquipment 133Chart 3.13 CT scanners: International 133
Chart 3.14 CT scanners: Canada 134
Chart 3.15 MRI scanners: International 135
Chart 3.16 MRI scanners: Canada 136
Information technology 137Chart 3.17 Advanced IT capacity in primary care: International 138
Chart 3.18 Type of information technology used by primary-care physicians: Canada 140
Chart 3.19 Electronic patient records in primary care: International 141
Chart 3.20 Electronic patient records in primary care: Canada 142
Pharmaceuticals 143Chart 3.21 Per person spending on prescription drugs: Canada 144
Chart 3.22 Age-standardized spending on prescription drugs: Canada 145

IntroductionThe provision of high-quality healthcare reliesupon a complex network of critically importantelements, including efficiency of operations,compliance with scientific evidence, adequacyand optimal distribution of resources, andcompassionate and responsive interactionsbetween staff and patients. The delivery ofthese elements depends upon the predictablecapacity of the system to provide healthcarethat meets both individual and population needs.
118
CapacityQuality of Healthcare in Canada: A Chartbook
The 10-Year Plan to Strengthen Health Care(Health Canada, 2004) recognized this andhighlighted, in particular, the need for invest-ment in capacity in order to ensure access tohealth services:First Ministers agree that access to timely careacross Canada is our biggest concern and anational priority…. [and] recognize thatimproving access to care and reducing waittimes will require…. strategic investments inareas such as: increasing the supply of healthprofessionals (e.g. doctors, nurses and pharmacists); effective community based services, including home care; a pharmaceuticals strategy; effective health promotion and disease prevention, and adequate financial resources.
This section focuses on investment andresources, comparing levels of investment bothacross Canada and internationally in terms of:• Spending• Staffing • Equipment • Information technology• Pharmaceuticals

In 2008, spending on healthcare in Canada wasan estimated $172 billion, or $5,170 per capita.After adjusting for inflation and populationgrowth, spending growth has been estimated tobe 3.4% in 2008. Real healthcare spending hasbeen rising steadily in recent years: in 2008,Canada’s healthcare spending outpaced inflationand population growth for the 12th consecutiveyear. As a share of Canada’s gross domesticproduct (GDP), expenditures on health continuedthe pattern of gradual increases, rising slightlyfrom 10.5% in 2006 to an estimated 10.7% in2008 (National Health Expenditure Trends,1975-2008. CIHI, 2008e).
In an international context, Canada is in thetop 20% of OECD countries in terms of percapita spending on healthcare. As a proportionof its national wealth, or GDP, Canada spentone in every 10 dollars on healthcare in 2006.
119
Capacity
SpendingAt the provincial level, total health expenditureswere lowest in Quebec and British Columbia, at approximately $4,653 and $5,093 per capitarespectively. Total health expenditures amongthe provinces were highest in Alberta andManitoba at $5,730 and $5,555 per personrespectively; however, per capita healthcarespending is highest in the territories. In 2008,total health expenditures, per capita, were estimated to be $7,837 in Yukon, $9,652 in theNorthwest Territories and $11,379 in Nunavut.Many factors contribute to such variation inspending patterns, including demographic differences, health status, patterns of health-service delivery, geography and populationdensity, and the costs of providing care indiverse environments (CIHI, 2008e).
The major categories of spending in 2008 were:• hospitals, 28.0% of total healthcare spending($48.1 billion);
• drugs (prescription and non-prescription),17.4% ($29.8 billion); and
• physicians, 13.4% ($23.1 billion).
In 2008, public-sector healthcare spending wasexpected to account for 70% of the total, or$120.3 billion, compared to $51.6 billion spentby the private sector.

5
10
15
20United States
United Kingdom
Sweden
Germany
France
Canada
Australia
200620052004200320022001200019991998199719961995199419931992
Internationally, there has been a steady increasein the proportion of developed countries’ GDPdedicated to healthcare. However, Canada’sratio of health expenditure to GDP in 2006 wasalmost the same as the level recorded in 1992.In 1992, of the 30 OECD member countries,Canada ranked as the second-highest spenderon health, after the U.S. In 2006, Canadaranked eighth-highest spender on health as apercentage of GDP among OECD countries. Theearly 1990s saw a decrease in the proportion of Canada’s GDP spent on health, probably asa result of the economic recession in 1990-1992(CIHI, 2008e).
% change, 1992-2006Australia 1.4Canada 0.2France 2.1Sweden 1.0United Kingdom 1.5United States 2.4
Note: Data should be interpreted with care due tomethodological differences across countries.
120
Chart 3.1 Expenditure on health as a percentage of GDP: InternationalTotal expenditure on health as a percentage of GDP, 1992-2006
CapacityQuality of Healthcare in Canada: A Chartbook
Source: OECD, 2008% GDP

1000
2000
3000
4000
5000
6000
7000
8000United Kingdom
Australia
Sweden
France
Canada
United States
200620052004200320022001200019991998199719961995199419931992
Across most developed economies, per capitaspending on healthcare has grown steadily in the past decade or so. This has resulted from a range of factors, including medical andtechnological advances, aging populations,higher public expectations, and increases innational wealth. The chart illustrates expenditureat purchase price parity (PPP). The PPP rate is the rate at which the domestic purchasingpower of currencies is equivalent. For example,if identical items cost $10 in Canada and $12 in the U.S., the PPP exchange rate isC$1=US$1.20. Relative to most other countries,Canada had a less-steep rise in health expenditures over the period 1992–2006, withan increase of 86.8% in per person spending(38.9% when inflation is taken into account).The steepest increase was seen in the U.K., with a 139.4% increase (73.0% when correctedfor inflation).
121
Capacity
Chart 3.2 Expenditure on health per capita, $US purchase price parity: InternationalTotal expenditure on health per capita ($US purchase price parity), 1992-2006
Source: OECD, 2008Note: Data should be interpreted with care due to methodological differences across countries.
US$

0
2000
4000
6000
8000
10000
12000
Nunav
ut
Northw
est
Territo
riesYu
kon
British
Columbia
Albert
a
Saska
tchew
an
Manito
ba
Ontario
Quebe
c
New Brun
swick
Nova Sc
otia
Princ
e Edw
ard
Islan
d
Newfou
ndlan
d
and L
abrad
orCAN
ADA
1553
1233 1472 1585
1569
1342 17
02
1420
1294 16
19
1560
1597 17
80
675
3617
4162
3710 38
66
3710
3310 35
27
4134
4099 41
11
3533
6239
7872 10
703
The total health expenditure per person forecastfor 2008 ranged from $4,653 in Quebec to$11,379 in Nunavut. Across jurisdictions, totalhealth expenditure per capita is influenced bydifferent age distributions, population densityand geography across the provinces/territories.The territories, in particular, are characterizedby large geographical areas and low populationdensities, which contribute to their higher cost base.
122
Chart 3.3 Spending on health per capita: CanadaHealth expenditure per capita, 2008
CapacityQuality of Healthcare in Canada: A Chartbook
Sour
ce: National Health Expenditure Database (CIHI, 2008e)
$
Private sector expenditure
Public sector expenditure

Table 3.1 Healthcare Professional data available from CIHI Audiologists Environmental public health Medical radiation Pharmacists Registered psychiatric nurses
professionals technologists
Chiropractors Health information management Midwives Physicians Respiratory therapistsprofessionals
Dental hygienists Licensed practical nurses Nurse practitioners Physiotherapists Speech-language pathologists
Dentists Medical laboratory technologists Occupational therapists Psychologists Social workers
Dieticians Medical physicists Optometrists Registered nurses
Front-line staff are a key element in the deliveryof quality healthcare. This section focuses onstaffing levels for various staff groupings.Simple counts are not the sole determinant ofquality in terms of staffing. The specific skills,individual experience, attitudes and compassionof staff towards the public and patients, as well as the context and environment withinwhich human resources are deployed, areequally important.
123
Capacity
StaffingIn 2008, CIHI published a reference guide toCanada’s healthcare professionals that providesdata on the numbers, characteristics and distribution of healthcare providers acrossCanada. Table 3.1 below, arrays the 24 healthpersonnel groups included in the guide.
Source: Health Personnel Database (CIHI, 2008f)

2.8
3.4
2.5
2.4
0.0
0.5
1.0
1.5
2.0
2.5
3.0
3.5
United
State
s
United
King
dom
Swed
en
German
yFra
nce
Canad
a
Austr
alia
2.1
3.5 3.5
Physicians are highly trained and skilled professionals who play a central role in healthcare delivery, preventing, diagnosing,treating and ameliorating disease and injury.The number of practising physicians hasremained stable in Canada over the past 10years, at 2.1 physicians per 1,000 population.Canada has fewer practising physicians thanother developed countries. In 1996, of thecountries shown in the chart, the U.K. was theonly country that had fewer physicians, with1.8 per 1,000 population. In the interveningyears, however, the U.K. increased its medicalworkforce considerably. The latest data nowshow that Canada has the fewest physiciansper 1,000 population of the countries shown.
124
Chart 3.4 Physicians: InternationalPractising physicians per 1,000 population, 2005-2006
CapacityQuality of Healthcare in Canada: A Chartbook
Sour
ce: OECD, 2008
Physicians per 1,000 population

2.2
2.4
1.5
2.6
1.8
2.5
2.0
2.1
2.2
1.8
2.2
1.1
0.4
0.0
0.5
1.0
1.5
2.0
2.5
3.0
Nunav
ut
Northw
est Te
rritori
esYu
kon
British
Columbia
Albert
a
Saska
tchew
an
Manito
ba
Ontario
Quebe
c
New Brun
swick
Nova Sc
otia
Princ
e Edw
ard
Islan
d
Newfou
ndlan
d
and L
abrad
orCAN
ADA
2.3
Across Canada as a whole, physician services is the third-largest category of total healthexpenditure and in 2008 was forecast toaccount for $23.1 billion, or 13.4% of totalexpenditure. Public-sector expenditure onphysicians has remained above 98% of totalphysician expenditure since 1975 (CIHI, 2008e).Canada has, in recent years, substantiallyincreased the number of doctors in training.In the decade from 1997-98 to 2007-08, first-year enrolment has risen by 59%, from1,577 to 2,506, although the effects of thisexpansion are yet to be fully reflected in theworkforce data (Evans and McGrail, 2008). Thechart shows that the number of physicians per1,000 population in 2006 ranged from 0.4 inNunavut to 2.6 in Nova Scotia.
125
Capacity
Chart 3.5 Physicians per capita: Provinces and territoriesActive registered physicians per 1,000 population, 2006
Sour
ces:
Scott’s Medical Database, CIHI, and the Canadian Post-M.D. Education Registry
Physicians per 1,000 population

1.4
1.7
0.7
1.0
0.0
0.5
1.0
1.5
2.0
United
State
s
United
King
dom
Swed
en
German
yFra
nce
Canad
a
Austr
alia
1.0 1.0
0.6
In most developed countries, family physiciansand general practitioners are the linchpins andgatekeepers in healthcare delivery. Communitieswith access to comprehensive services providedby family physicians/general practitioners,working with other primary healthcare professionals, have been shown to have betterpatient outcomes (Starfield and Shi, 2002). In 2006, Canada had 1.0 active family physicians/general practitioners for every 1,000 people; this level has been unchangedfor more than a decade.
126
Chart 3.6 Family physicians/general practitioners: International Practising family physicians/general practitioners per 1,000 population, 2005-2006
CapacityQuality of Healthcare in Canada: A Chartbook
Sour
ce:
OEC
D, 20
08
GPs per 1
,000 population

1.0
1.1
0.9
1.3
1.1
1.2
0.9
1.0
1.1
1.0
1.1
0.8
0.3
0.0
0.5
1.0
1.5
2.0
Nunav
ut
Northw
est
Territo
riesYu
kon
British
Columbia
Albert
a
Saska
tchew
an
Manito
ba
Ontario
Quebe
c
New Brun
swick
Nova Sc
otia
Princ
e Edw
ard
Islan
d
Newfou
ndlan
d
and L
abrad
orCAN
ADA
2.0
As noted on the previous page, the number offamily physicians per capita across Canada hasremained constant at 1.0 physicians per 1,000population for more than a decade. However,the actual number of family physicians increasedby 14% between 1997 and 2006, from 29,723to 34,038, while the population increased from29.9 million to 32.9 million. The chart illustratesthe number of family physicians per 1,000population across Canadian jurisdictions. Thelowest density of family physicians was recordedin Nunavut (0.3 physicians per 1,000 population)and the highest in Yukon (2.0 physicians per1,000 population).
127
Capacity
Chart 3.7 Family physicians: CanadaActive family physicians per 1,000 population, 2006
Sour
ce: Scott’s Medical Database and CAPER (CIHI, 2008f)
Not
e:Data include medical residents.Physicians per 1,000 population

0
1
2
3Canada
Australia
United States
United Kingdom
France
Sweden
2006200520042003200220012000199919981997
Specialist physicians provide a diverse range ofservices ranging from obstetrics and paediatricsto care of the elderly and palliative care. Overtime, there has been a tendency for these highly trained professionals to focus on sub-specialties as knowledge and technologybecome increasingly complex and intricate.The number of specialist physicians in Canadahas remained steady at 1.1 specialists per 1,000population over the past decade. Canada hasthe lowest density of specialists of all thecountries shown.
128
Chart 3.8 Specialist physicians: International
Source: OECD, 2008
Practising specialists per 1,000 population, 1997-2006
CapacityQuality of Healthcare in Canada: A Chartbook
Specialists per 1,000 population

1.1
1.3
0.6
1.3
0.7
1.3
1.1 1.1 1.1
0.9
1.0
0.3
0.00.0
0.3
0.6
0.9
1.2
1.5
Nunav
ut
Northw
est
Territo
riesYu
kon
British
Columbia
Albert
a
Saska
tchew
an
Manito
ba
Ontario
Quebe
c
New Brun
swick
Nova Sc
otia
Princ
e Edw
ard
Islan
d
Newfou
ndlan
d
and L
abrad
orCAN
ADA
0.2
Although the number of practising specialistsper capita in Canada has remained unchangedover the past decade (see Chart 3.8), the actualnumber of specialists increased between 1997and 2006, from 32,248 to 36,832 (14%). Thechart illustrates the number of specialist physicians per 1,000 population acrossCanadian jurisdictions. The lowest density ofspecialists was recorded in Nunavut (wherethere was only one specialist recorded in officialdata, or effectively 0 per 1,000 population) andthe highest was recorded in Newfoundland andLabrador, Nova Scotia and Quebec (1.3 physiciansper 1,000 population).
129
Capacity
Chart 3.9 Specialist physicians: CanadaActive specialist physicians per 1,000 population, 2006
Sour
ce: Scott’s Medical Database, Canadian Post-MD Education Registry (CIHI, 2008f)
Not
e:Data include medical residents.Specialists per 1,000 population

0.6
0.3
0.5 0.5
0.4
0.5
0.6
0.5
0.6
0.4
0.7
1.2
1.6
0.0
0.5
1.0
1.5
2.0
Nunav
ut
Northw
est
Territo
riesYu
kon
British
Columbia
Albert
a
Saska
tchew
an
Manito
ba
Ontario
Quebe
c
New Brun
swick
Nova Sc
otia
Princ
e Edw
ard
Islan
d
Newfou
ndlan
d
and L
abrad
orCAN
ADA
0.6
Total expenditures on dental services in Canadawere estimated at $12.1 billion in 2008 (CIHI,2008e). Of this, $11.6 billion (95.6%) were private-sector expenditures. Expenditures ondental services were approximately 7% of totalhealth expenditures in Canada. In 2006, therewere 18,925 licensed dentists in Canada. There is a marked difference in availability of dentists between urban and rural areas. Theresident:dentist ratio for Canada as a whole in2004 was 1,734:1, but in rural areas the ratiowas 5,096:1 (Canadian Dental Association,online). The chart illustrates the distribution ofdentists across Canada, ranging from 0.3 dentistsper 1,000 population in Newfoundland andLabrador to 1.6 per 1,000 population in Nunavut.To place these data in context, OECD data showthat, in 2006, there were 0.5 dentists per 1,000population in Australia and the U.K., 0.7 per1,000 in France and 0.8 per 1,000 in Germany.
130
Chart 3.10 Dentists: CanadaDentists per 1,000 population, 2006
CapacityQuality of Healthcare in Canada: A Chartbook
Sour
ce: Hea
lth P
erso
nnel D
atab
ase (C
IHI,
2008
f)N
ote:
Dat
a for NW
T sh
ould be in
terp
reted
with
caut
ion.
Dent
ists
per
1,0
00 p
opul
atio
n

9.7
7.6
10.5
0
2
4
6
8
10
12
United
State
s
United
King
dom
Swed
en
German
yFra
nce
Canad
a
Austr
alia
8.8
9.8
10.7
11.9
Registered nurses are employed in a variety ofsettings including hospitals, nursing homes,rehabilitation centres, clinics, communityhealth centres, home care agencies, educationand research facilities, private companies,nursing agencies, government, and physicians’offices. Canada has seen a slight increase innurses per capita in the last few years, increasingfrom 8.5 registered nurses per 1,000 populationin 2003 to 8.8 per 1,000 in 2006. The chartshows that many developed healthcare systemshave a higher density of registered nurses thanthat seen in Canada.
131
Capacity
Chart 3.11 Registered nurses per capita: International Practising nurses per 1,000 population, 2005-2006
Sour
ce: OECD, 2008
Not
e: Data should be interpreted with caution due to differences in data definition and collection
across countries.
Registered nurses per 1
,000 population

0
3
6
9
12
15
Northw
est Te
rritori
es/
Nunav
utYukon
British
Columbia
Albert
a
Saska
tchew
an
Manito
ba
Ontario
Quebe
c
New Brun
swick
Nova Sc
otia
Princ
e Edw
ard
Islan
d
Newfou
ndlan
d
and L
abrad
orCAN
ADA
7.8
11.0
10.4
9.5
10.3
8.4
7.1
9.1
7.9
8.7
6.9
14.2
10.4
In 2007, there were 257,961 active registerednurses in Canada (CIHI, 2008). The chart illustrates the number of employed active registered nurses per 1,000 population acrossthe jurisdictions of Canada. The lowest densityof registered nurses was recorded in BritishColumbia, with 6.9 registered nurses per 1,000 population and the highest density inNorthwest Territories and Nunavut, with 14.2registered nurses per 1,000 population.
132
Chart 3.12 Registered nursing workforce: CanadaRegistered nurses per 1,000 population, 2007
CapacityQuality of Healthcare in Canada: A Chartbook
Sour
ce: Nur
sing
Dat
abas
e, C
IHI; S
tatistics Ca
nada
Regi
ster
ed n
ursi
ng w
orkf
orce
per
1,0
00 p
opul
atio
n

51.1
10.0 10.5
0
10
20
30
40
50
60
United
State
s
United
King
dom
German
yFra
nce
Canad
a
Austr
alia
12.0
16.7
7.6
33.9
Chart 3.13 CT scanners: International CT (computerized tomography) scanners provideimages of hard tissues such as bones and softtissues such as muscles, organs, the brain, largeblood vessels and nerves. Most commonly usedto determine the cause of strokes, CT scannersare also used to investigate and diagnose tumours,abscesses, head injuries and abnormal bloodvessels. CT is the method of choice for rapidlyscreening trauma victims to detect internalbleeding or other life-threatening conditions.Canada appears to have a relatively low numberof scanners compared to other countries.However, analyses conducted by CIHI in 2006-2007 found that scanners were moreintensively used in Canada than in other countries,with 8,735 exams per scanner, compared to2,448 exams per scanner in Denmark, 5,000exams per scanner in Sweden and 6,108 examsper scanner in the U.S. (CIHI, 2007).
133
Capacity
EquipmentCT scanners per million population, 2006
Sour
ce: OECD, 2008
Not
e:Data should be interpreted with caution due to differences in data definition and collection
across countries.
CT scanners per m
illion population

0
5
10
15
20
25
30
35
Northw
est Te
rritori
esYu
kon
British
Columbia
Albert
a
Saska
tchew
an
Manito
ba
Ontario
Quebe
c
New Brun
swick
Nova Sc
otia
Princ
e Edw
ard
Islan
d
Newfou
ndlan
d
and L
abrad
orCAN
ADA
12.8
21.6
14.5
17.1
20.0
15.5
10.2
16.1
12.0
15.2
11.3
23.6
32.3
The number of CT scanners across Canadianjurisdictions varies considerably, from 10.2 permillion population in Ontario to 32.3 per millionpopulation in Yukon. However, the data shouldbe interpreted with care. Further analysisundertaken by CIHI revealed a weak inverserelationship between the number of scannersper million population and the intensity of utilization (when the territories are excluded).Average number of hours of operation perweek in 2006-07 ranged from 38 in Yukon and Northwest Territories to 69 in Ontario[data not shown].
134
Chart 3.14 CT scanners: CanadaCT scanners per million population, provinces and territories, 2007
CapacityQuality of Healthcare in Canada: A Chartbook
Sour
ce: Natioal Survey of Selected Medical Imaging Equipment, CIHI, 2007
CT scanners per m
illion population

4.9 5.3 10.5
0
5
10
15
20
25
30
United
State
s
United
King
dom
German
yFra
nce
Canad
a
Austr
alia
6.2
7.7
5.6
26.5
Magnetic resonance imaging (MRI) is a medicalimaging technique used to visualize the internalstructure and function of the body. MRI providesmuch greater contrast between the differentsoft tissues of the body than does computedtomography (CT), making it especially useful in neurological (brain), musculoskeletal, cardiovascular and oncological (cancer) imaging.In 2006, Canada had 6.2 MRI scanners per million population. Further analysis found thatCanada has relatively high utilization rates foreach scanner (CIHI, 2007). In 2006-2007, 5,123MRI exams were performed on average byeach scanner in Canada, compared to 3,460 in the U.S. (CIHI, 2007).
135
Capacity
Chart 3.15 MRI scanners: InternationalMRI scanners per million population, 2006
Sour
ce: OECD, 2008
Not
e: Data should be interpreted with caution due to differences in data definition and collection
across countries.
MRI scanners per m
illion population
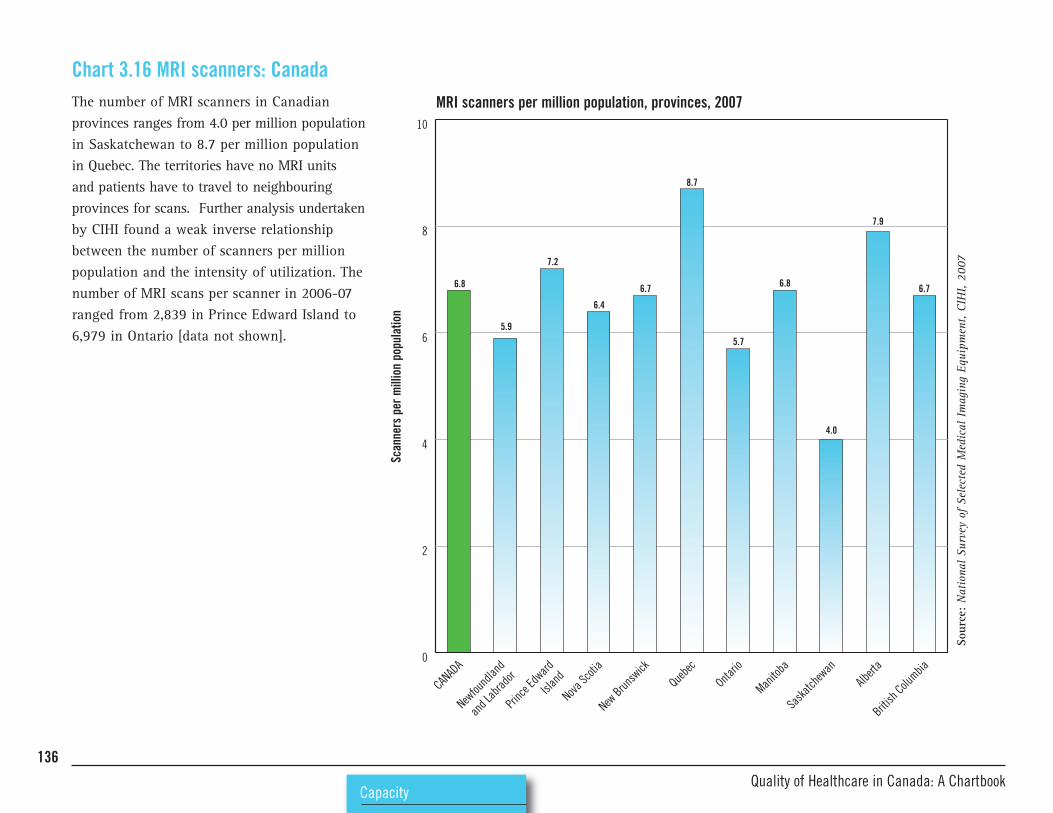
0
2
4
6
8
10
British
Columbia
Albert
a
Saska
tchew
an
Manito
ba
Ontario
Quebe
c
New Brun
swick
Nova Sc
otia
Princ
e Edw
ard
Islan
d
Newfou
ndlan
d
and L
abrad
orCAN
ADA
6.8
5.9
7.2
6.4
6.7
8.7
5.7
6.8
7.9
4.0
6.7
The number of MRI scanners in Canadianprovinces ranges from 4.0 per million populationin Saskatchewan to 8.7 per million populationin Quebec. The territories have no MRI units and patients have to travel to neighbouringprovinces for scans. Further analysis undertakenby CIHI found a weak inverse relationshipbetween the number of scanners per millionpopulation and the intensity of utilization. Thenumber of MRI scans per scanner in 2006-07ranged from 2,839 in Prince Edward Island to6,979 in Ontario [data not shown].
136
Chart 3.16 MRI scanners: CanadaMRI scanners per million population, provinces, 2007
CapacityQuality of Healthcare in Canada: A Chartbook
Sour
ce: National Survey of Selected Medical Imaging Equipment, CIHI, 2007
Scanners per million population

Health information technology (HIT) can havea profound effect on quality. It has the potentialto enable dramatic transformations in thedelivery of healthcare, making it safer, moreeffective and more efficient (Chaudhry et al.,2006; Shekelle et al., 2006).
In a country with regions of sparse populationand huge geographical areas, health informationtechnology offers particular benefits throughtelehealth (or telemedicine), remote consultations,digital imaging, and other ways of providingcare from a distance.
137
Capacity
Information technologySome of the most significant potential gainsfrom HIT are gleaned from multifunctional,interoperable HIT systems built around an electronic health record (EHR) (Shekelle et al.,2006). In 2004, First Ministers pledged that50% of Canadians would have an interoperableelectronic health record by 2010. As of March2008, only 7% of the population had an interoperable EHR despite investments of$1.457 billion via the Infoway program(Canada Health Infoway, 2008). Table 3.2,below, shows the estimated timelines for implementing EHRs across Canada.
Table 3.2: Timelines for implementing EHRs across CanadaComplete by 2010 Complete late in 2010 Partial completion by 2010; Need more time and resources
need more time or resourcesAlberta British Columbia Saskatchewan New Brunswick
Prince Edward Island Quebec Manitoba Nova Scotia
Northwest Territories Ontario Nunavut Yukon
Newfoundland and Labrador
Source: Health Council of Canada, 2008
The data in this section focus primarily on theuse of HIT in primary care. There were fewdatasets available on the use of HIT in acutecare. The exception was in Ontario, where theHospital Report series provides information onHIT use across the province’s hospitals(Hospital Report Research Collaborative, 2008).

The 2006 Commonwealth Fund Health PolicySurvey sought the views of primary carephysicians in seven countries. The surveyincluded a series of 14 questions on the use ofinformation technology (IT) and clinical recordsystems in the respondents’ practices. Across
138
Chart 3.17 Advanced IT capacity in primary care: International
CapacityQuality of Healthcare in Canada: A Chartbook
the countries surveyed, Canadian physiciansreported the lowest level of advanced information capacity, with fewer than one in10 respondents indicating that their practicehad advanced IT capacity.
The chart provides a composite picture of ITuse, showing the proportion of respondentswho indicated that their practice had seven ormore out of the following 14 functions in routine use:
% respondents indicating yes
CAN U.K. U.S.
• current use of electronic medical records 23 89 28
• ability to share patient records electronically with clinicians outside the practice 24 15 42
• ability to access patient records when away from the surgery/office 50 22 76
• ability to provide patients with easy access to their medical records 25 51 34
• routine electronic ordering of tests 8 20 22
• routine use of electronic prescribing 11 55 20
• routine electronic access to patients’ test results 27 84 48
• routine electronic access to patient hospital records (e.g. discharge summary) 15 19 40
• patients sent reminder notices for preventive or follow-up care using computerized system 8 83 18
• physicians receive an alert or prompt about a potential problem with drug dosage or interaction via computerized system 10 91 23
• physicians receive a computerized alert or prompt to provide patients with test results 6 53 15
• easily able to generate a list of patients by diagnosis or health risk 26 92 37
• easily able to generate a list of patients who are overdue for tests or preventive care 13 77 20
• easily able to generate a list of all medications taken by individual patients, including those prescribed by other doctors 25 88 37

72
32
19
0
20
40
60
80
100
United
State
s
United
King
dom
New Ze
aland
Netherl
ands
German
y
Canad
a
Austr
alia
8
59
87
83
139
Capacity
Primary care practices with advanced information capacity, physician survey, 2006
Sour
ce:Commonwealth Fund, 2006
Not
es: Since the survey was conducted, there has been significant and sustained investment in information
technology across Canada. The Canadian data are based on a low sample size of 578 physicians and
should be interpreted with care.
% re
spondents

50
17
45
25
30
13
14
14
5
14
2
0 10 20 30 40 50 60
Electronic interface toexternal chronic care
patient registries
Electronic interfaceto external pharmacy
Electronic decision aids
Electronic reminder systemsfor recommended patient care
Electronic warning system foradverse prescribing and/or
drug interactions
Telemedicine/webcasting/videoconferencing
Electronic interface to otherexternal systems for accessingor sharing patient information
Electronic records to enterand retrieve clinical patient notes
Electronic interface to externallaboratory/diagnostic imaging
Electronic patientappointment/scheduling system
Online access to journals,clinical practice guidelines,
databases
Electronic billing59
Canada’s National Physician Survey, 2007,asked respondents in primary care whetherthey used a range of information technologyaids in patient care. The chart shows functionsranked in order of most-to-least utilized, asindicated by survey respondents across Canada.Electronic billing systems were the most widelyused. Overall, 5.2% respondents indicated thatthey neither had nor used any of the listed ITaids, and 21.5% indicated that they chose notto use any of the aids. The proportion ofrespondents who said they did not use any ITaids ranged from 16.5% in New Brunswick to26.7% in Quebec.
140
Chart 3.18 Type of information technology used by primary care physicians: Canada Type of IT used by primary care physicians, survey data, 2007
CapacityQuality of Healthcare in Canada: A Chartbook
Sour
ce:National Physician Survey, 2007
Not
e:Chart uses CIHI calculations to allow for non-response (CIHI 2008h).
% of respondents

79
42
28
0
20
40
60
80
100
United
State
s
United
King
dom
New Ze
aland
Netherl
ands
German
y
Canad
a
Austr
alia
23
92
89
98
In 2006, the Commonwealth Fund surveyedprimary care physicians across seven countriesand asked respondents: “Do you currently useelectronic patient medical records in your practice?” It is important to distinguishbetween electronic patient records (EPRs),which can be based on stand-alone systems in individual family-practice offices, and thenational initiative for electronic health records(EHRs), Infoway. Currently there are some concerns about the mismatch between EPR andEHR (Canadian EMR online). The chart refersto the use of stand-alone EPRs and shows thatrespondents in the Netherlands, New Zealandand the U.K. had a high utilization rate compared to North American respondents.
141
Capacity
Chart 3.19 Electronic patient records in primary care: International Primary care physicians' use of electronic patient medical records, survey, 2006
Sour
ce:Commonwealth Fund, 2006
% re
spondents

0
10
20
30
40
50
60
70
80
90
100
Northw
est Te
rritori
es
British
Columbia
Albert
a
Saska
tchew
an
Manito
ba
Ontario
Quebe
c
New Brun
swick
Nova Sc
otia
Princ
e Edw
ard
Islan
d
Newfou
ndlan
d
and L
abrad
orCAN
ADA
25.7
29.0
8.8
26.8
16.1
25.2
13.4
29.3
20.7
40.2
23.5
29.4
In 2007, the Canadian National PhysicianSurvey asked primary care physicians whetherthey used electronic patient records to enterand retrieve clinical patient notes. Utilizationranged from 8.8% of respondents in PrinceEdward Island to 40.2% of respondents inAlberta.
142
Chart 3.20 Electronic patient records in primary care: Canada Use of electronic patient records, physician survey, 2007
CapacityQuality of Healthcare in Canada: A Chartbook
Sour
ce: National Physician Survey, 2007 (not corrected for non response)
% re
spondents

Retail sales of prescription and non-prescriptiondrugs together represent the second-largestcategory of health expenditure in Canada, estimated at $29.8 billion in 2008 (DrugExpenditure in Canada, 1985-2008. CIHI).
Survey data suggest that more than one-half of Canadian adults are taking one or more prescription drug (Statistics Canada, 2007Primary Care Survey; Commonwealth Fund,2007). In 1975, the private sector accounted formore than 79.5% of expenditures for prescriptiondrugs. This share decreased to 52.3% by 1992and, in 2008 it was estimated to be 55.5%(Drug Expenditure in Canada, 1985-2008. CIHI).
143
Capacity
PharmaceuticalsCanadians spent $578 per person on retail purchases of prescription drugs in 2007, almost$19 billion in total (Rx Atlas). One-quarter ofall spending on prescription drugs in Canadain 2007 was for cardiovascular treatment: antihypertensives (14.5% of total spending),statins (10%) and antithrombotics (1.7%).Neurological treatments also accounted for alarge share of spending on prescription drugsin 2007, led by antidepressants (6.1% of totalspending) and antipsychotics (3.3%). Canadiansspent $1.4 billion (7.4% of total spending) onprescription drugs to reduce stomach acid in2007 and $888 million (4.7%) on inhaled prescription drugs for respiratory conditions(Rx Atlas).
The National Pharmaceuticals Strategy wasestablished in 2004 to develop nation-widesolutions to some of the concerns about thesafety and affordability of prescription medications in Canada. The strategy was partof the 2004 10-Year Plan to Strengthen HealthCare, in which participating governments(except Quebec) agreed to make a variety ofimprovements to their healthcare sectors,accompanied by additional annual paymentsfrom the federal government.
In 2009 the Health Council of Canada releaseda review of progress in implementing thePharmaceutical Strategy (HCC, 2009).
Main features of the National Pharmaceutical StrategyExplore options for “catastrophic” pharmaceutical coverage Pursue value for money in drug purchasing strategies(e.g. for illnesses with high drug costs such as cancer, HIV)
Establish a common national drug formulary Encourage appropriate prescribing practices by health professionals
Accelerate access to breakthrough drugs for unmet health needs Encourage e-prescribing and use of electronic health records
Strengthen evaluation of drug safety and effectiveness Accelerate access and value for money on non-patented drugs
Analyze cost-effectiveness in drug-plan policies

432
496 491
525
580
655
681 674
606622
0
100
200
300
400
500
600
700
800
Albert
a
British
Columbia
Saska
tchew
an
Manito
ba
Ontario
Quebe
c
New Brun
swick
Nova Sc
otia
Princ
e Edw
ard
Islan
d
Newfro
undla
nd
and L
abrad
or
Almost three-quarters of all Canadians fill atleast one prescription per year, at a total costof some $20 billion. Researchers at theUniversity of British Columbia analyzed variation in spending on prescription drugsacross provinces (Morgan et al., 2008). Thechart illustrates their findings: the annual percapita spending ranged from $432 in BritishColumbia to $681 in Quebec.
144
Chart 3.21: Per person spending on prescription drugs: CanadaPer capita spending on prescription drugs, 2007
CapacityQuality of Healthcare in Canada: A Chartbook
Sour
ce: UBC Centre for Health Services and Policy Research, 2008
$

-100
-80
-60
-40
-20
0
20
40
60
80
100
Newfou
ndlan
d
and L
abrad
or
Princ
e Edw
ard Is
land
Nova Sc
otia
New Brun
swick
Quebe
c
Ontatio
Manito
ba
Saska
tchew
anAlb
erta
British
Columbia
-27.7
-4.4
-15.5
-7.6
1.97.6
13.4 11.3
1.2 2.7
Some of the inter-provincial variation seen inspending on prescription drugs is explained bydifferences in age structure. Provinces such asthose to the east of Ontario, as well as BritishColumbia and Saskatchewan, have older populations than the national average andwould be expected to have higher spending percapita. This chart illustrates the variation inspending on drugs, after age has been takeninto account. It shows that age-standardizedspending was significantly higher than thenational average in Quebec, New Brunswickand Nova Scotia, and significantly lower thanthe national average in British Columbia,Saskatchewan and Manitoba.
145
Capacity
Chart 3.22 Age-standardized spending on prescription drugs: CanadaSpending on prescription drugs, age-standardized variation, 2007
Sour
ce:UBC Centre for Health Services and Policy Research, 2008
% variation

146
SafetyQuality of Healthcare in Canada: A Chartbook

Introduction 148
Adverse events in healthcare 149Chart 4.1 Types of adverse events and estimated exposure 150
Chart 4.2 Adverse events time series: Ontario 151
Chart 4.3 Inappropriate prescribing: Select provinces 153
Chart 4.4 Patient-reported error: International 154
Chart 4.5 Patient-reported error: Canada 155
Chart 4.6 In-hospital hip fractures: Canada 156
Chart 4.7 Incorrect surgical site: Neurosurgery case study 158
Chart 4.8 Ventilator-associated pneumonia: Canada 159
Chart 4.9 Perineal trauma in childbirth 160
Healthcare-associated infections 161Chart 4.10 Healthcare-associated MRSA infections: Canada 162
Chart 4.11 Healthcare-associated MRSA infections: Regional incidence 163
Chart 4.12 Hospital-associated Clostridium difficile infections:Canada 164
147
Safety
SAFETYSafety systems and processes 165Chart 4.13 Safety alerts in primary care: International 166
Chart 4.14 Processes for improving patient safety: Ontario 167
Chart 4.15 Patient safety strategies: Ontario 168
Chart 4.16 Managing comorbidities: International 169
Chart 4.17 Safety and hospital discharge –Awareness of complications: International 170

IntroductionSafety, the elimination of unnecessary risk ofharm to patients, is a fundamental attribute ofquality in healthcare. In recent years, safetyhas come to the fore as a pressing concern ofhealth policy makers, patients, managers, andhealthcare professionals.
Underlining the critical importance nowafforded safety issues, the World HealthOrganization in 2004 established a WorldAlliance for Patient Safety. The Alliance provides a forum to coordinate the manyefforts of different countries to improve safetyas well as to standardize and/or promulgatecommon terminology, methods of measurementand compatible reporting of adverse events.Similarly, the OECD and the United States’Agency for Healthcare Research and Quality(AHRQ) have published comprehensive indicatorsets for patient safety, drawing on availableevidence and on consensus recommendationsof international expert panels.
148
SafetyQuality of Healthcare in Canada: A Chartbook
In Canada, the 2003 First Ministers’ Accord on Health Care Renewal stated that “the implementation of a national strategy forimproving patient safety is critical.” As a resultof this imperative, the Canadian Patient SafetyInstitute (CPSI) was established, with a nationalmandate to build and advance a safer healthsystem for Canadians. Health Canada allocated$50 million to patient safety initiatives (toinclude the work of the CPSI) over a five-yearperiod (CPSI, online).
For Canada as a whole, there is a paucity ofpublicly reported safety data. Safer HealthcareNow!, an initiative partly funded by CPSI, hasrecently released data on a number of safetyindicators, including surgical site infectionrates, central line infection rates, venousthromboembolism rates, patient falls, adversedrug events, and ventilator-associated pneumoniarates (Safer Healthcare Now!, 2009). However,these datasets are generated by self-selectingteams that participate in targeted safety
improvement initiatives. While the SaferHealthcare Now! data show significantimprovements in the safety of care deliveredby the participating teams, they do not providea picture of quality of care more generally.Until there is a mandated requirement for collecting these types of data, it will be difficultto assess properly the domain of safety withinquality of healthcare.
This chapter presents available data on threeaspects of safety and quality:• Adverse events• Healthcare-associated infections (HAIs)• Systems and processes for ensuring patient safety
For many of the indicators, national data wereunavailable. Therefore, this chapter includesdata drawn from provincial reports, as well asfrom studies conducted in discrete geographicalareas within Canada and published in the peer-reviewed literature.

A number of studies have been conductedaround the world seeking to quantify the number of adverse events in different healthcaresystems (Brennan et al., 1991; Wilson et al.,1995; Vincent et al., 2001). In Canada, Baker et al. (2004) estimated that 7.5% of all hospitalpatients experienced an adverse event. Thiscorresponds to 185,000 admissions per yearassociated with an adverse event. Furtheranalysis suggested that of these, 70,000 arepotentially avoidable.
149
Safety
Adverse events in healthcareData on adverse events can be difficult tointerpret. There is a perennial question ofwhether a measured increase in adverse eventsreflects a negative situation of worsening safetyof care or actually reflects a positive situationof better reporting of safety problems, exposingthem to analysis and mitigation.
Juxtaposing staff-reported adverse event rateswith patient reports can help to unravel whatis actually happening in healthcare settings.There is a growing recognition that patients
can play a vital role in helping to identify andquantify risks and provide options to devisesolutions. Although patients are a valuable sourceof information about quality in healthcare, datafrom patient surveys should be interpreted withcare. Patients are not necessarily in possessionof the information required to ascertainwhether an error has occurred in their care.They may either be unaware of an error that hasoccurred or may assume an error in a situationthat has a poor outcome, when in fact no errorhas occurred.

In 2007, CIHI, drawing on a variety of datasources, conducted a review of patient safetyin Canada (CIHI, 2007b). The analysis estimatedthe frequency of a range of adverse events. Its findings are summarized in the chart below.Of the events examined, nosocomial (or health-
150
Chart 4.1 Types of adverse events and estimated exposure
SafetyQuality of Healthcare in Canada: A Chartbook
Event Number exposed per event Reported yearAdults contracting a nosocomial infection while in an acute care hospital 1 in 10 2002
Children contracting a nosocomial infection while in an acute care hospital 1 in 12 2002
Obstetrical traumas during childbirth (vaginal delivery) 1 in 21 2003-2006
Birth trauma – injury to neonate 1 in 141 2003-2006
Post-admission pulmonary embolism or deep vein thrombosis 1 in 279 2003-2006
In-hospital hip fracture for adults aged 65+ 1 in 1,263 2003-2006
Foreign object left in after procedure 1 in 2,998 2003-2006
Adverse blood transfusion events 1 in 4,091 2003
Fatal events definitely, probably and possibly related to transfusion of blood components 1 in 87,863 2002
Source: Adapted from CIHI, 2007b.
care-acquired) infections were most common, occurring in around 10% of patients. At theother end of the scale, the least-common incident in the analysis was a fatal event dueto blood transfusions, which occurred in0.001% of patients.

In collaboration with CIHI, the Health SystemPerformance Research Network (HSPRN, formerly known as Hospital Report ResearchCollaborative) compiles annual performanceresults for hospitals in Ontario. The HSPRNreports collate data on nurse-sensitive adverseevents, distinguishing between medical andsurgical settings. The medical indicator refersto patients with acute myocardial infarction,heart failure, asthma, GI bleed or stroke, andaggregates the incidence of post-admission
151
Safety
Chart 4.2 Adverse events time series: Ontariopressure ulcers and post-admission fracturesfrom falls. The surgical indicator refers to patients admitted for cholecystectomy, hysterectomy or prostatectomy, and aggregatesthe incidence of post-admission pressure ulcersand post-admission fractures from falls, as wellas post-admission urinary tract infections (UTIs).Post-admission pneumonia was added to thelist of nurse-sensitive conditions for bothpatient groups starting in 2004-2005. Whilethe rate for adverse events in surgical patients
fell between 2002-2003 and 2004-2005 andremained relatively stable up to 2006-2007, thecorresponding figure for medical patients sawa marked increase. This may be due to theaddition of post-admission pneumonia to thelist of adverse events. The increase may alsoreflect improved hospital reporting resultingfrom a system-wide focus on patient safety.Note that, as methodological refinements weremade from year to year, caution must be usedwhen comparing results across years.

0.3
0.5
0.2
0.3
0.2
1.0
0.2 0.2
0.0
0.2
0.4
0.6
0.8
1.0
1.2
2006-20072005-20062004-20052003-20042002-2003
1.2 1.2
152
Nurse-sensitive adverse events, Ontario, 2002-2003 to 2006-2007
SafetyQuality of Healthcare in Canada: A Chartbook
Sour
ce:Discharge Abstract Database, 2002-2003 to 2006-2007 and National A
mbulatory Care Reporting
System
, 20
03-200
4 to 200
6-20
07. Adapted from Hospital Report Research Collaborative, 20
08.
% o
f epi
sode
s of
car
e
Medical Surgical

0
10
20
30
40
50
60
70
80
90
100
New Brun
swick
Manito
ba
Saska
tchew
anAlb
erta
1.40.2
11.4
0.31.9
13.9
0.21.6
12.5
23
0.5
2.5
15.8
Medication errors (MEs) are a relatively common,and potentially life-threatening, occurrence inCanada. It has been estimated that adversedrug events account for 24% of total adverseevents (Baker et al., 2004). Their full impact isdifficult to quantify, due to significant under-reporting of these errors (CIHI, 2005; Wilkinsand Shields, 2008). The main causes of medication errors have been shown to be inappropriate prescribing by professionals,skipped doses or incorrect use by patients, and the lack of systems for continuous and adequate tracking of problems (Health Councilof Canada, 2009). The chart illustrates findingsfrom a CIHI report (2007c) on inappropriateprescribing for seniors (aged 65+ years). Itfocuses on the continued prescription of drugsfrom “Beers List,” an internationally recognizedlist of drugs considered to be inappropriate forseniors due to an elevated risk of adverseeffects. In provinces with available data, theproportion of seniors on public drug programswho were chronically prescribed “Beers List”drugs ranged from 12.9% in Alberta to 18.8%in New Brunswick.
153
Safety
Chart 4.3 Inappropriate prescribing: Select provincesProportion of seniors on public drug programs chronically dispensed "Beers List" drugs, 2005-2006
Sour
ce:National Prescription Drug Utilization Information System Database, CIHI
% of claimants (age amd sex standardized)
3+
2
1
Number of Beers Listdrugs prescribed

0
10
20
30
40
50
60
70
80
90
100
United
State
s
United
King
dom
New Ze
aland
Canad
a
Austr
alia
23
1921
19
25
18
23
18 18 18 1715
28
22 22
The Commonwealth Fund International HealthPolicy Surveys in 2002, 2005 and 2008focused on adult patients with health problems.Respondents were asked whether in the pasttwo years they thought that either a medicationerror or a medical mistake had been made intheir treatment or care. In 2008, among Canadianrespondents who indicated that an error ormistake (or lab error) was made, 12% said thatit led to a serious health problem (n = 82 outof 669 respondents who reported error; totalsample was 2,635). These data should be interpreted with caution. As previously noted,although patients are a valuable source ofinformation about quality in healthcare, theyare not necessarily in possession of the necessaryinformation to ascertain whether an error hasoccurred in their care. They may either beunaware of an error that has occurred or mayassume an error in a situation that has a pooroutcome when, in fact, no error has occurred.
154
Chart 4.4 Patient-reported error: InternationalPatient report of either a medication error or medical mistake in treatment or care in the past two years, 2002, 2005 and 2008
SafetyQuality of Healthcare in Canada: A Chartbook
Sour
ce:Commonwealth Fund, 2002, 2005, 2008
2002
2005
2008
% of respondents

0
10
20
30
40
50
60
70
80
90
100
BC/Territ
ories
Albert
a
Prairie
s
Ontario
Quebe
c
Atlan
tic
CANAD
A
19
15
23
18 1817 16
The Health Care in Canada Survey was established in 1997. The most recent survey,conducted in November 2007, asked respondents:“Within the past two years, have either yourselfor a member of your family experienced anyadverse effects or events as a result of carereceived in Canada’s health care system?” Thechart shows the proportion of respondents whoanswered positively. Of those respondents whoindicated that they had experienced adverseeffects or events, 20% experienced medicalcomplications, 17% were affected by excessivewait times, 14% indicated a general poor qualityof care, 13% were misdiagnosed, and 6% experienced a medication error (data not shown).
155
Safety
Chart 4.5 Patient-reported error: Canada
Canadians' experiences of adverse events, 2007
Sour
ce:Health Care in Canada Survey, 2007
% of respondents

0.0
0.5
1.0
1.5
2.0
20052004200320022001
0.9
0.8 0.8 0.8 0.8
156
In-hospital hip fracture rate, 2001-2005
SafetyQuality of Healthcare in Canada: A Chartbook
Source: Health Indicators e-publication, CIHI/Statistics CanadaNotes: Rates are based on three years of pooled data. The reference year reflectsthe mid-point of the three-year period. Canada rate includes only jurisdictionsfor which comparable data were available.
Chart 4.6 In-hospital hip fractures: CanadaIn-hospital hip fractures are preventable complications that have serious consequencesfor patients and for the cost of care. The chartsprovide two views of in-hospital hip fracturerates for patients aged 65+. The first shows atime series of fracture rates across Canada and illustrates that rates have remained largelyunchanged in recent years. The second chartdelves into the Canada-wide data for 2004-2005to 2006-2007 and shows that Manitoba, Albertaand British Columbia had in-hospital hip fracturerates that were significantly higher than thosein Canada as a whole. Variation in rates maybe attributed to numerous factors, includinghospital processes, environmental safety andavailability of nursing care.
Rate per 1,000 discharges

0.0
0.2
0.4
0.6
0.8
1.0
1.2
British
Columbia
Albert
a
Saska
tchew
an
Manito
ba
Ontario
Quebe
c
New Brun
swick
Nova Sc
otia
Princ
e Edw
ard
Islan
d
Newfou
ndlan
d
and L
abrad
orCAN
ADA
0.8 0.8 0.8 0.8
0.6 0.6 0.6
N/A
1.0 1.0
1.2
157
Safety
In-hospital hip fracture rate, 2004-2005 to 2006-2007
Sour
ce:Health
Ind
icators e-pu
blication, CIH
I/Statistics Can
ada
Not
es:Ra
tes are ba
sed on
three years of po
oled data. The
referen
ce year refle
cts the mid-p
oint of the
three-year period. Can
ada rate inc
ludes on
ly jurisdictions
for w
hich
com
parable da
ta w
ere av
ailable.
Risk adjusted rate per 1,000 discharges

2.0
2.9
0
3
6
9
12
15
Cervical discectomyLumbar discectomyCraniotomy
12.8
10.8
7.6
6.0
A national survey conducted by Jhawar et al.(2007) asked neurosurgeons across Canadaabout their experiences with incorrect-site surgery. Incorrect-site surgery for neurosurgeonsincludes both wrong-sided cranial surgery andwrong-level spinal surgery (i.e. wrong disc).The chart illustrates the estimated rate ofincorrect-site surgeries both in the previousyear and throughout the neurosurgeons’careers for three procedures:• Craniotomy: surgery in which an opening ismade in the skull, most commonly performedfor brain tumour removal. Also performed toremove blood clots, to control hemorrhage,to repair abnormal connections of bloodvessels, to drain a brain abscess, to relievepressure inside the skull, to perform a biopsyor to inspect the brain.
• Lumbar discectomy: surgery to remove partof an intervertebral disc from the lower back.
• Cervical discectomy: surgery to remove thedisc between two (or more) neck vertebrae.Generally, a cervical spine fusion procedureis performed at the same time.
Notably, patients were not informed about theerrors in 15% of wrong-sided cranial surgeriesand 19% of wrong-level spinal surgeries.
158
Chart 4.7 Incorrect surgical site: Neurosurgery case study Rate of incorrect site surgery, neurosurgeons survey 2003
SafetyQuality of Healthcare in Canada: A Chartbook
Sour
ce:Jhawar et al., 2007
Incorrect site surgeries per 1
0,000 cases
In previous year In career

4,000
0
5000
10000
15000
20000
Deaths attributable to VAP (calc)Attributable VAP ICU days (calc)VAP cases/year (calc)
17,000
230
Ventilator-associated pneumonia, also knownas hospital-acquired pneumonia, is a commonnosocomial infection (the second most prevalentafter urinary tract infections). Ventilator-associated pneumonia (VAP) accounts for up to 60% of deaths associated with nosocomialinfection. Hospitalized patients who are ventilatedin the intensive care unit (ICU) have the highestrisk of developing nosocomial pneumonia. Itshould be noted that, even in units providingexemplary standards of care, some cases ofVAP are unavoidable. Total costs for VAP are$11,450 per case. Based on 4,000 cases of VAPeach year, the total cost of VAP per year isapproximately $46 million.
159
Safety
Chart 4.8 Ventilator-associated pneumonia: CanadaEstimates of the impact of ventilator-associated pneumonia
Sour
ce:Muscedere et al., 2008
Number

Perineal trauma can be a serious consequenceof childbirth. Up to 50% of women with third- orfourth-degree perineal tears during childbirthsuffer from fecal incontinence. Historically,episiotomies have been performed in the beliefthat the procedure benefited both mother andchild: the mother by reducing injury to theperineum and the newborn through shortenedsecond stage of labour. However, there is nowstrong evidence that liberal or routine use ofepisiotomy provides no benefit compared toselective or restrictive use, such as in cases of fetal distress or imminent severe perineallaceration. The chart illustrates the incidence of four types of perineal trauma: • First degree: superficial laceration
involving skin • Second degree: laceration involving the
perineal muscles• Third degree: injury to the perineum
involving the anal sphincter complex • Fourth degree: involves anal sphincter &
rectal mucosa • Episiotomy: A surgical procedure for
widening the outlet of the birth canal tofacilitate delivery of the baby and to avoid a jagged rip of the perineum
160
Chart 4.9 Perineal trauma in childbirth
SafetyQuality of Healthcare in Canada: A Chartbook
Between 1995-1996 and 2004-2005, the rate of third-degree tears increased by 10%, whilethe rate of fourth-degree tears remained relatively steady at 0.6 per 100 hospital vaginaldeliveries. The number of episiotomies has fallen considerably, from 31.1 per 100 vaginalbirths to 20.4 per 100 vaginal births over thesame period (PHAC, 2008).
0
10
20
30
40
50
60 First-or-second-degree lacerations
Episiotomies
Third-degree lacerationsFourth-degree lacerations
2004/052003/042002/032001/022000/011999/20001998/991997/981996/971995/96
44.8
31.1
3.00.7
46.1
29.1
3.2
0.7
46.7
27.4
3.1
0.7
47.0
26.6
3.2
0.7
47.8
25.4
3.2
0.7
49.5
24.1
3.4
0.6
50.1 50.7 51.1 51.4
23.3 22.1 21.1 20.4
3.2 3.2 3.3 3.30.6 0.6 0.6 0.6
Rate of trauma to the perineum in childbirth, Canada, 1995-1996 to 2004-2005
Source: CIHI, Hospital Morbidity Database, 1995-1996 to 2004-2005.Note: Data for Quebec were excluded because of data quality concems.
Trauma per 1
00 hospital vaginal deliveries

Nosocomial infections are infections that are aresult of treatment in a hospital or a healthcareservice unit. Infections are considered nosocomialif they first appear 48 hours or more after hospital admission or within 30 days after discharge. They are an important cause ofmorbidity and mortality in hospitalizedpatients and lead to increases in individualsuffering, length of stay in hospital, andhealthcare costs.
161
Safety
Healthcare-associated infectionsEach year in Canada, there are an estimated220,000 cases of nosocomial infections, resulting in more than 8,000 deaths (Zoutmanet al., 2003). Ongoing problems with methicillin-resistant Staphylococcus aureus (MRSA) andClostridium difficile-associated diarrhoea affecthealthcare organizations throughout the country.The costs associated with MRSA alone inCanadian hospitals have been estimated atbetween $42 million and $59 million annually(Kim et al., 2001).

0
1
2
3
4
5Infection
Colonization
2007200620052004200320022001200019991998199719961995
162
Healthcare-associated MRSA incidence rates, 1995-2007
SafetyQuality of Healthcare in Canada: A Chartbook
Source: CNISP, 2008
Methicillin-resistant Staphylococcus aureus(MRSA) is a strain of bacteria that is resistantto a wide range of antibiotics. MRSA was firstdiscovered in 1961 and is now widespread,particularly in hospitals, where it is commonlycalled a “superbug.” The Canadian NosocomialInfection Surveillance Program (CNISP) wasestablished in 1994 to examine trends inhealthcare-associated infections across Canada.At present, 49 sentinel hospitals from nineprovinces participate in the CNISP network.The CNISP publishes annual reports on MRSAsurveillance and the chart illustrates time seriesdata on MRSA isolates. Healthcare-associatedMRSA infections increased more than nine-foldbetween 1995 and 2007 (from 0.2 to 1.8 isolatesper 10,000 days). For context, the EuropeanAntimicrobial Resistance Surveillance System(EARSS), in 2007, reported MRSA bacteremiarates (blood infections only) of 0.02 isolatesper 10,000 patient days in Sweden, 0.09 isolatesper 10,000 patient days in Germany, 0.71 isolatesper 10,000 patient days in France and 1.34 per10,000 patient days in the U.K.
Chart 4.10 Healthcare-associated MRSA infections: Canada
MRSA per 1
0,000 patient days

2.74 2.75
1.51
1.08
1.74
2.30
1.97
1.79
0.0
0.5
1.0
1.5
2.0
2.5
3.0
OverallEasternCentralWestern
NCISP publishes data on MRSA incidence from47 sentinel hospitals in nine provinces. Thechart illustrates regional data on healthcare-associated MRSA infections and shows that, in both 2006 and 2007, the western region ofCanada reported much higher MRSA incidencethan the rest of the country. While the centralregion saw a decrease in healthcare-associatedMRSA incidence between 2006 and 2007, the other two regions saw increases over thetwo-year period.
163
Safety
Chart 4.11 Healthcare-associated MRSA infections: Regional incidenceHealthcare-associated MRSA incidence, 2006-2007
Sour
ce:CNISP, 2008
MRSA incidence per 1
0,000 patient days
2006 2007

0
2
4
6
8
10
12
Atlan
tic
Quebe
c
Ontario
Saska
tchew
an/
Manito
baAlbert
a
British
Columbia
CANAD
A
6.4
4.74.5
3.8
7.8
11.9
3.9
Clostridium difficile is a bacterium that causesdiarrhoea and can lead to serious illness anddeath. People aged 65+ and patients with seriousunderlying disease are particularly susceptibleto infection. Under certain conditions,Clostridium difficile, which is found in feces,can produce spores. These spores are resistantto heat, alcohol and acids in the stomach, andcan survive in patients and in the environmentfor long periods of time. A hospital can becomecontaminated with spores, placing patients atrisk. The chart illustrates data on the incidenceof Clostridium difficile in sentinel hospitalsacross Canada in 2005. Rates ranged from 3.8 per 10,000 patient days in Saskatchewan/Manitoba to 11.9 per 10,000 patient days inQuebec. CNISP also reported fatality rates(deaths directly or indirectly related toClostridium difficile within 30 days of infection).The overall fatality rate was 5.6 per 100 casesand ranged from 1.1 per 100 cases in Albertato 5.6 per 100 cases in Quebec (data not shown).
164
Chart 4.12 Hospital-associated Clostridium difficile infections: CanadaClostridium difficile incidence, 2005
SafetyQuality of Healthcare in Canada: A Chartbook
Sour
ce:CNISP, 2007
Rate per 10,000 patient days

Current thinking on safety in healthcare recognizes the importance of system failures in creating conditions that allow adverseevents to occur (Reason, 1997). Experiencefrom other high-risk industries, such as aviationand nuclear power, has shown that highly reliable organizations do not depend on humanperfection to achieve high levels of safety.Rather, these industries design “fault-tolerant”systems with attention to the human propensity
165
Safety
Safety systems and processesfor error. Accordingly, efforts for improvementin safety in healthcare have sought to bringabout a shift away from blaming individualsand toward designing systems, organizationsand operations that will better assure patientsafety (WHO, 2004).
This section provides data on the use of varioussafety systems and processes.

0
20
40
60
80
100
United
State
s
United
King
dom
New Ze
aland
Netherl
ands
German
y
Canad
a
Austr
alia
10
31
33
2
6
6
28
80
10
40
93
87 91
23
The Commonwealth Fund International HealthPolicy Survey, 2006, was conducted with primarycare physicians across seven countries.Respondents were asked: “Do doctors in yourpractice routinely receive an alert or promptabout a potential problem with drug dose ordrug interaction?” The chart illustrates theresponses, distinguishing between the use ofmanual and computerized alert systems. InCanada, fewer than one-half of respondentsindicated that such a system was in place. Thiswas in contrast to the countries surveyed outsideNorth America, where drug-alert safety systemswere in widespread use.
166
Doctor routinely receives alert about potential problem with drug dose/interaction, physician survey, 2006
SafetyQuality of Healthcare in Canada: A Chartbook
Sour
ce:Commonwealth Fund, 2006
Chart 4.13 Safety alerts in primary care: International
% of respondents
Computerized system
Manual system

43
53
38
58
76
84 85
40
64
67
0
20
40
60
80
100
Implemented adverse event team/patient safety steering committee
Implemented reporting system
Designated patient safety officer
Provided feedback to frontline staff
In Ontario, the system for reporting hospitalperformance draws on data from the SystemIntegration and Change (SIC) survey, which issent annually to hospital management staff inacute care facilities across the province, as part of the Hospital Report: Acute Care project.The survey asks about a number of initiativesdesigned to support a strong safety culture. In2008, more than 90% of participating hospitalsreported having a hospital-wide non-punitivereporting policy (data not shown). The chartillustrates that, over the three-year period2006-2008, substantial efforts went into implementing safety strategies in Ontario.
167
Safety
Chart 4.14 Processes for improving patient safety: OntarioHospitals pursuing selected patient strategies, hospital executive survey, Ontario, 2006-2008
Sour
ce:System Integration and Change Survey (CIHI, 2008g)
% of hospitals
2006
2007
2008

0 10 20 30 40 50 60 70 80 90 100
Fully implemented formal mechanism for auditing hand-hygiene practices
Surveillance method reporting daily
Reporting on all surgical infection rates
Reporting surgical infection rates after specific procedures
Reuse of single-use medical devices permitted
(with sterilization)
13
57
33
67
38
The System Integration and Change survey inOntario asks hospital executives about specificinitiatives to reduce nosocomial infection rates.The chart illustrates the proportion of respondentsindicating that their facility had implementedthese initiatives.
168
Chart 4.15 Patient safety strategies: OntarioPatient safety strategies, hospital executive survey, Ontario, 2008
SafetyQuality of Healthcare in Canada: A Chartbook
Sour
ce:CIHI, Patient Safety in Ontario Acute Care Hospitals:
A Snapshot of Hospital-Acquired Infection Control Practices, 200
8N
ote:
A different colour is used for re-use of single-use devices, as this is not a desirable practice,
in contrast to the other strategies reported.
% hos
pitals

0
10
20
30
40
50
60
70
80
90
100
United
State
s
United
King
dom
New Ze
aland
Netherl
ands
German
yFra
nce
Canad
a
Austr
alia
13
20
12
21
11
26
6
18
9
14
8
16
10
1614
19
Patients often have more than one conditionthat requires management and treatment.Failure to appreciate the potential consequencesof treatment of one condition upon anothercomorbid condition may have significant safetyconsequences. The 2008 Commonwealth Fundsurvey asked of respondents with multiple conditions: “Was there ever a time when:• a doctor gave you instructions for one ofyour chronic conditions that conflicted withwhat you have been told to do for anothercondition?
• the specialists you see did not seem aware ofthe different chronic conditions that you have?”
The responses are depicted in the chart. Onboth questions, Canadian responses were higherthan average rates of conflicting instructionsand specialists unaware of co-morbidities, suggesting deficiencies in the management ofcomorbid conditions.
169
Safety
Chart 4.16 Managing comorbidities: InternationalManaging comorbidities, patient survey, 2008
Sour
ce:Commonwealth Fund, 2008
% of respondents (w
ith multiple conditions)
Conflictinginstructions
Specialistunaware ofcomorbidity

0
20
40
60
80
100
United
State
s
United
King
dom
New Ze
aland
Netherl
ands
German
yFra
nce
Canad
a
Austr
alia
76
80
63
78
70
7371
87
Post-surgical complications, or exacerbations ofchronic conditions that occur following dischargefrom hospital, can be extremely serious.Patients’ awareness about which symptoms mightcomprise a clinically significant deterioration intheir condition is vital if those symptoms are tobe managed quickly and effectively. The 2008Commonwealth Fund survey asked patientswho had been hospitalized in the previous twoyears: “When you left the hospital did youreceive clear instructions about symptoms towatch for and when to seek further care?” Thechart shows that 80% of Canadian respondentswere well briefed on danger signs to watch outfor once they had returned home, the second-highest proportion of the countries shown(after the U.S.).
170
Chart 4.17 Safety and hospital discharge – Awareness of complications: InternationalReceived clear instructions on discharge from hospital, patient survey, 2008
SafetyQuality of Healthcare in Canada: A Chartbook
Sour
ce:Commonwealth Fund, 2008
% of respondents (of those hospitalized)

171
Safety

172
Patient CentrednessQuality of Healthcare in Canada: A Chartbook

Introduction 174Chart 5.1 Extent of change required: International 175
Chart 5.2 Extent of change required: Canada 176
Chart 5.3 Patient ratings of overall quality: International 177
Chart 5.4 Public ratings of overall quality: Canada 178
Chart 5.5 Confidence in healthcare system: Canada 179
Chart 5.6 Coordination-of-care problems: International 181
Chart 5.7 Coordination-of-care problems: Canada 182
Chart 5.8 Patient engagement in care: International 183
Chart 5.9 Patient involvement in decision-making: International 184
Chart 5.10 Patient involvement in decision-making: Canada 185
Chart 5.11 Written care plan: International 186
Chart 5.12 Emotional support: Canada 187
173
Patient Centredness
PATIENT CENTREDNESS

IntroductionProviding high-quality healthcare requires theuse of the best available scientific evidence,diagnostic acumen, and technical proficiency,all applied in safe and managerially efficientenvironments. An equally important componentis patient centeredness: a concern for – andresponsiveness to – patient preferences, attitudesand experiences.
According to the International Alliance ofPatients’ Organizations (IAPO), “a patient-centredapproach aims to better align national healthcare systems with the needs and expectationsof patients, notably by improving their accessto treatment and information, ensuring participation in healthcare decision-makingand involvement in policy-making” (IAPO, 2006).
Health systems can be seen as networks ofinterconnected and disparate stakeholders. Atthe centre of the network is the patient/citizen:the primary beneficiary and, in Canada, theprincipal funder of the healthcare system.Internationally, there is a growing recognitionthat patients’ views should be taken into
174
Patient CentrednessQuality of Healthcare in Canada: A Chartbook
account in decision-making, both at the levelof individual care and in issues of managementand policy. Patients and their families can provide an important perspective on the qualityof health services, one that complements otherassessment methods such as inspections, auditsand routine data collection. Patient and publicperspectives can provide insight into the convenience, compassion, cleanliness andavailability of healthcare services, and can alsogive insights into clinical outcomes throughthe use of patient-reported outcome measures(or PROMs). PROMs are currently used in Canadain the context of discrete clinical trials, butthey have also been used to report on qualityof healthcare more broadly in a number ofcountries, including the Netherlands (Quality of Care through the Patients’ Eyes), the U.S.(Consumer Assessment of Health Plans Study;Improving Chronic Illness Care Evaluation;Patient Assessment of Chronic Illness Care) andEngland (Department of Health, online). PROMsmay be an area for development in Canada.
There are a number of sets of survey data ofpublic and patient perceptions about quality of healthcare in Canada, including:
• Statistics Canada/Health Council of Canada:Canadian Survey of Experiences with HealthCare Services
• Statistics Canada: Canadian CommunityHealth Survey
• Commonwealth Fund International HealthPolicy Survey
• Health Council of Canada: CanadianPerceptions of the Health Care System
• Canadian Medical Association: NationalReport Card on Health Care
• Pollara Research: Health Care in Canada Survey
According to the Health Care in Canada Survey(2007), Canadians have, over the past decade,changed their perspective on the key healthissues facing the country. In 1998, they regardedlack of funding as the most important issue. In2007, they deemed waiting times and the shortageof doctors to be the most pressing issue.

0
20
40
60
80
100
United
State
s
United
King
dom
New Ze
aland
Netherl
ands
German
yFra
nce
Canad
a
Austr
alia
19
56
24
34
50
14
41
33
22
24
50
25
49
41
7
19
50
29
12
36
49
45
30
23
The 2008 Commonwealth Fund InternationalHealth Policy Survey asked respondents:“Which of these statements comes closest toexpressing your overall view of the health caresystem in this country?” Respondents in theNetherlands were the most satisfied, with only7% indicating that their healthcare systemrequired a complete rebuild. In Canada, aroundone in seven respondents (14%) indicated thata complete rebuild of the system was required.
175
Patient Centredness
Chart 5.1 Extent of change required: International
% of respondents
Extent of change required in healthcare system, sicker adults survey, 2008
Sour
ce:Co
mmon
wealth
Fun
d, 200
8
On the whole, the system works pretty well and onlyminor changes are necessary to make it better.
There are some good things in our health caresystem, but fundamental changes are needed to make it work better.
Our healthcare system has so much wrong with itthat we need to completely rebuild it.

0 10 20 30 40 50 60 70 80 90 100
On the whole, the system works
pretty well and only minor changes are necessary
to make it better.
There are some good things in our
health care system, but fundamental
changes are needed to make it work better.
Our healthcare system has so much wrong with it that we need
to completely rebuild it.
17
14
61
50
21
34
In 2005 and 2008, the Commonwealth Fundsurveys focused on adults with health problems.Over the time period shown, Canadians becamesignificantly more positive about their healthcaresystem. In 2005, 21% indicated that only minorchanges were needed, compared to 34% in 2008.
176
Chart 5.2 Extent of change required: CanadaExtent of change required, Canada, 2005 and 2008
Patient CentrednessQuality of Healthcare in Canada: A Chartbook
Sour
ce:Co
mmon
wealth
Fun
d 20
05, 20
08
2005
2008
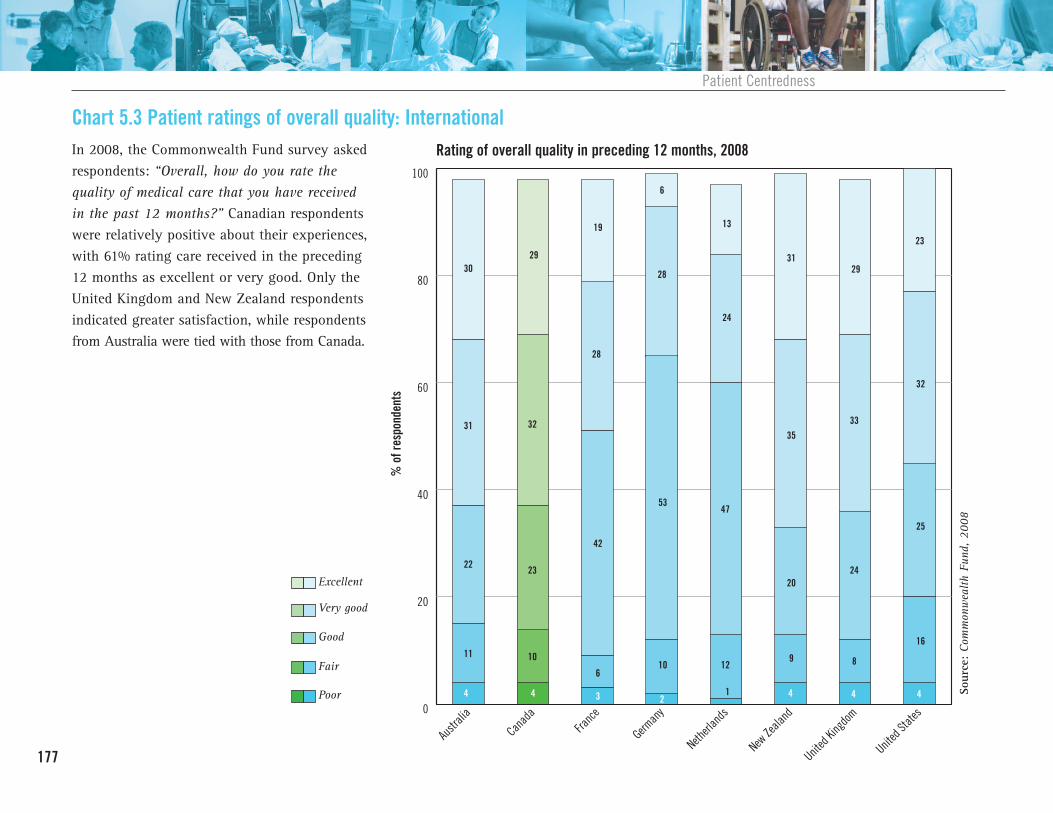
0
20
40
60
80
100
United
State
s
United
King
dom
New Ze
aland
Netherl
ands
German
yFra
nce
Canad
a
Austr
alia
4
31
22
11
3029
32
23
10
4
28
6
42
19
3
6
28
53
10
2
47
12
13
24
1 4
9
20
35
31
4
29
8
24
33
32
25
16
4
23
In 2008, the Commonwealth Fund survey askedrespondents: “Overall, how do you rate thequality of medical care that you have receivedin the past 12 months?” Canadian respondentswere relatively positive about their experiences,with 61% rating care received in the preceding12 months as excellent or very good. Only theUnited Kingdom and New Zealand respondentsindicated greater satisfaction, while respondentsfrom Australia were tied with those from Canada.
177
Patient Centredness
Chart 5.3 Patient ratings of overall quality: International Rating of overall quality in preceding 12 months, 2008
Sour
ce:Co
mmon
wealth
Fun
d, 200
8
% of respondents
Excellent
Very good
Good
Fair
Poor

0
20
40
60
80
100
British
Columbia
Albert
a
Saska
tchew
an
Manito
ba
Ontario
Quebe
c
New Brun
swick
Nova Sc
otia
Princ
e Edw
ard
Islan
d
Newfou
ndlan
d
and L
abrad
orCAN
ADA
11
34
34
20
15
4240
36
19
4
41
16
32
36
7
3539
35
18
36
33
20
6 811
17
21
35
34
12 11
21
39
27
69
32
27
36
3330
25
10
31
In 2008, the Canadian Survey of Experienceswith Primary Health Care (CSE-PHC) askedrespondents: “Overall, how do you rate thequality of health care that you have received inthe past 12 months?” The results in the chartshow that Manitoba had the lowest proportionof respondents that rated care as excellent (27.3%)while Prince Edward Island had the highest proportion that judged care to be excellent(42.4%). Ontario had the highest proportion ofrespondents that rated care fair or poor (11.7%).
178
Chart 5.4 Public ratings of overall quality: CanadaOverall ratings of healthcare quality in preceding 12 months, 2008
Patient CentrednessQuality of Healthcare in Canada: A Chartbook
Sour
ce:Statistics Can
ada, CSE
-PHC, 200
8
% of respondents (a
ge standardized)
Excellent
Very good
Good
Fair/poor

0
20
40
60
80
100
27
50
23
In 2007, a survey conducted by StatisticsCanada on behalf of the Health Council ofCanada asked adults about their experiences of primary healthcare. The survey asked twoquestions about respondents’ confidence in thehealthcare system: “How confident are you thatyou will get quality/safe care when you needit?” and “Is your confidence in the health caresystem rising, falling or about the same?” Morethan three-quarters of respondents indicatedthey were very or somewhat confident theywould get quality/safe care, while two-thirds of respondents indicated either increasing orstatic levels of confidence.
179
Patient Centredness
Chart 5.5: Confidence in healthcare system: CanadaConfidence in healthcare system, 2007
% of respondents
Very confident
Somewhat confident
Not very confident/not at all confident

0
20
40
60
80
100
33
57
9
180
Trajectory of confidence in healthcare system, 2007
Patient CentrednessQuality of Healthcare in Canada: A Chartbook
Sour
ce:Statistics Can
ada, H
ealth
Cou
ncil of Can
ada, 200
8
% of respondents
Falling
About the same
Rising

0
10
20
30
40
50
60
70
80
90
100
United
State
s
United
King
dom
New Ze
aland
Netherl
ands
German
yFra
nce
Canad
a
Austr
alia
15.0 15.0
18.0
15.0
23.0
18.0
13.0
9.0
In 2008, the Commonwealth Fund survey askedsicker adults in eight countries about their perceptions and experiences of their healthcaresystem. The chart illustrates the proportion ofrespondents answering yes to the question: “In the past two years, when getting care for a medical problem, was there ever a time whentest results, medical records, or reasons forreferrals were not available at the time of yourscheduled doctor’s appointment?” Almost onein five Canadian respondents indicated that theyhad experienced such coordination problems.
181
Patient Centredness
Chart 5.6 Coordination-of-care problems: InternationalTest results, medical records, or reasons for referrals were not available at scheduled doctor'sappointment, 2008
Sour
ce:Co
mmon
wealth
Fun
d, 200
8
% of respondents

7.45.9
4.26.6 7.6
0
10
20
30
40
50
60
70
80
90
100
British
Columbia
Albert
a
Saska
tchew
an
Manito
ba
Ontario
Quebe
c
New Brun
swick
Nova Sc
otia
Princ
e Edw
ard
Islan
d
Newfou
ndlan
d
and L
abrad
orCAN
ADA
5.1
8.5
3.85.3
8.8
11.8
The 2008 Canadian Survey of Experiences with Primary Health Care (CSE-PHC) askedrespondents: “In the past 12 months, howoften have test results or medical record notbeen available to your family physician at thetime of your scheduled appointment?” Thechart illustrates the proportion of respondentswho said that such coordination problemsoccurred either always or usually. Overall,7.4% of respondents across Canada indicatedthat they had experienced problems with availability of medical records and test results.The proportion ranged from 3.8% in NewBrunswick to 11.8% in Manitoba.
182
Chart 5.7 Coordination-of-care problems: CanadaTest results or medical record always/usually not available to family physician at appointment, 2008
Patient CentrednessQuality of Healthcare in Canada: A Chartbook
Sour
ce:Statistics Can
ada, CSE
-PHC, 200
8N
ote:
Can
adian results on this page differ from tho
se sho
wn in Cha
rt 5.6. Th
e discrepa
ncy is probably
due to differences in time scales (12
mon
ths vs. tw
o years), sampling fram
e (primary care patients vs.
sicker adu
lts) an
d na
ture of the qu
estion
(“how
often” vs. “ever occurred”).
% of respondents (a
ge/sex standardized)

42
60
47
65
34
51
31
64
35
51
43
58
35
50
66
74
0
10
20
30
40
50
60
70
80
90
100
United
State
s
United
King
dom
New Ze
aland
Netherl
ands
German
yFra
nce
Canad
a
Austr
alia
Recent developments in primary care provisionand, in particular, chronic disease management,have focused on increasing patient engagementand collaboration in the healthcare process. Arecent systematic review found encouragingevidence that increasing patient engagementcan have a positive impact on a variety ofpatient and provider outcomes (National Centrefor Health Outcomes Development, 2005). The2008 Commonwealth Fund survey asked adultswith chronic conditions: “Has any health careprofessional you see for your condition(s):• Given you a written plan or instructions to
help you manage your own care at home?• Discussed with you your main goals or
priorities in caring for your condition?” The chart shows that almost one-half ofCanadian respondents had a written plan tohelp them manage their own care and almosttwo-thirds indicated that they had discussedmain goals or priorities for care with their primary care provider.
183
Patient Centredness
Chart 5.8 Patient engagement in care: InternationalClinician-patient engagement, patients with chronic conditions, 2008
Sour
ce:Co
mmon
wealth
Fun
d, 200
8
% of respondents (w
ith chronic conditio
n)
Discussed main goals orpriorities for care
Given written plan or instructionsto help manage own care

58
42
60
48
51
0
10
20
30
40
50
60
70
80
90
100
United
State
s
United
King
dom
New Ze
aland
Netherl
ands
German
yFra
nce
Canad
a
Austr
alia
56 56
61
Collaborative care has been defined as: “interaction between a patient and the healthcare system in which the patient is active inproviding information to aid diagnosis andproblem-solving; sharing his or her preferencesand priorities for treatment or management;asking questions; and/or identifying managementapproaches that best meet his or her needspreferences and priorities” (National Centre forHealth Outcomes Development, 2005). In 2008,the Commonwealth Fund survey gauged theextent of patient involvement in decision-makingacross eight countries, asking adults withhealth problems who had a regular doctor:“When you visit your doctor, does he or shealways tell you about treatment options andinvolve you in decisions about best treatment?”
The chart shows that more than one-half of Canadian respondents indicated that thiswas the case.
184
Chart 5.9 Patient involvement in decision-making: InternationalPatients involved in decision-making, 2008
Patient CentrednessQuality of Healthcare in Canada: A Chartbook
Sour
ce:Co
mmon
wealth
Fun
d, 200
8
% of respondents

71
7875
71
68
0
10
20
30
40
50
60
70
80
90
100
British
Columbia
Albert
a
Saska
tchew
an
Manito
ba
Ontario
Quebe
c
New Brun
swick
Nova Sc
otia
Princ
e Edw
ard
Islan
d
Newfou
ndlan
d
and L
abrad
orCAN
ADA
7577 76
64
70 70
In 2008, Statistics Canada surveyed primarycare patients and asked: “In the past 12months, how often did your family physician(or general practitioner) involve you in clinicaldecisions about your health care?” The chartshows that respondents indicated a considerablevariation in the extent of their involvement inclinical decisions. The proportion of peopleindicating that they were usually or alwaysinvolved ranged from 64.0% in Quebec to 78.1%in Nova Scotia.
185
Patient Centredness
Chart 5.10 Patient involvement in decision-making: CanadaAlways/usually involved in clinical decisions, survey data, 2008
Sour
ce:Statistics Can
ada, CSE
-PHC, 200
8
% of respondents (a
ge/sex standardized)

0
10
20
30
40
50
60
70
80
90
100
United
State
s
United
King
dom
New Ze
aland
Netherl
ands
German
yFra
nce
Canad
a
Austr
alia
58 57
63
58
89
66
57
61
Most healthcare, perhaps as much as 85%, isself-care (Coulter and Ellins, 2006). Averageindividuals, in looking after themselves andtheir families, provide a far greater quantity of healthcare than do health professionals. Forpeople with complex health problems, it isimportant that self-care is rooted in evidence.Written care plans are one way to provideappropriate support for self-care following discharge from hospital. In 2008, theCommonwealth Fund survey asked patientshospitalized in the preceding two years: “Whenyou left the hospital did the hospital staff provideyou with a written plan for your care after discharge?” Two-thirds of Canadian respondentsindicated that they received this support, thesecond-highest proportion among the countriesshown, behind the U.S.
186
Chart 5.11 Written care plan: InternationalGiven a written plan for care after discharge, 2008
Patient CentrednessQuality of Healthcare in Canada: A Chartbook
Sour
ce:Co
mmon
wealth
Fun
d, 200
8
% of h
ospitalized re
spondents

81
91
84 83
76
0
10
20
30
40
50
60
70
80
90
100
British
Columbia
Albert
a
Saska
tchew
an
Manito
ba
Ontario
Quebe
c
New Brun
swick
Nova Sc
otia
Princ
e Edw
ard
Islan
d
Newfou
ndlan
d
and L
abrad
orCAN
ADA
85
82
88
7981
86
In 2008, the Canadian Survey of Experienceswith Primary Health Care (CSE-PHC) askedrespondents: “Overall, how often does yourfamily physician (or general practitioner) allowyou enough time to discuss your feelings, fearsand concerns about your health?” The chartillustrates the proportion of respondents thatanswered always or usually. Across Canada,results ranged from 76.1% of respondents inBritish Columbia to 91.4% of respondents inNova Scotia.
187
Patient Centredness
Chart 5.12 Emotional support: CanadaPhysician always/usually allows enough time to discuss feelings, fears and concerns, 2008
Sour
ce:Statistics Can
ada, CSE
-PHC, 200
8
% of respondents (a
ge standardized)

188
EquityQuality of Healthcare in Canada: A Chartbook

Introduction 190Chart 6.1 Life expectancy by income: Canada 192
Chart 6.2 Life expectancy: Registered Indians vs. Canada 193
Chart 6.3 Mortality rates for aboriginal and non-aboriginal Canadians 194
Chart 6.4 Premature mortality by income: Manitoba 196
Chart 6.5 Cost concerns as a barrier to medical care: International 197
Chart 6.6 Cost concerns as a barrier to dental care and pharmacy: International 198
Chart 6.7 Infant mortality by socio-economic status: Canada 199
Chart 6.8 Incidence of AMI and stroke by income and place of residence: Manitoba 200
Chart 6.9 Angioplasty and statin prescription by income and place of residence: Manitoba 201
Chart 6.10 Diabetes care processes by household income: Canada 203
Chart 6.11 Diabetes and lower-limb amputations by income:Manitoba 204
Chart 6.12 Influenza vaccination in seniors, by income 205
Chart 6.13 Childhood immunizations by income: Manitoba 206
Chart 6.14 Benzodiazepine prescription in seniors, by income and sex: Manitoba 207
Chart 6.15 Chronic kidney disease care, aboriginal vs. non-aboriginal: Alberta 208
Chart 6.16 AMI secondary prevention by age: Saskatchewan 210
189
Equity
EQUITY

IntroductionIt is unacceptable for a privileged country likeCanada to continue to tolerate such disparitiesin health. Our challenge is to find ways toimprove the health of all Canadians to equalthat of those who experience the best regardlessof their ethnicity, social or economic position. (Fourth Report of the Subcommittee onPopulation Health of the Standing SenateCommittee on Social Affairs, Science andTechnology, April 2008)
Equity is an underlying value and much cherished tenet of healthcare across Canada.Quantifying and monitoring equity is generallydone in two ways:
1. Measures of disparities (i.e. inequity) inhealth status and outcomes. These measuresdocument variation in “healthiness” of different groups or sub-populations, variations that are often attributed to socio-economic status and influenced by awide range of contributory factors, such aseducation, employment and housing. Thesocial and economic differences are oftencompounded by differences in health-related
190
EquityQuality of Healthcare in Canada: A Chartbook
behaviours such as smoking, diet and exercise, as well as health-services utlilization. Often referred to as healthinequalities, these measures include differences in life expectancy and incidenceof disease, when comparing groups acrossdifferent socio-economic levels.
2. Measures of disparities in delivery of services. These measures document variationin the provision of healthcare services, dueeither to physical constraints, such as geographical location and distribution ofhealthcare providers, or to inconsistent andinequitable clinical decision-making; forexample, on the basis of age, gender orsocial class.
This section depicts data for disparities on thebasis of:• Socio-economic status and income• Aboriginal status (see box for definitions)• Geography• Gender• Age
Definitions of Registered Indian, First Nationsand Aboriginal People Registered Indian (or Status Indian) refers toan Indian person who is registered (or isentitled to be registered) under the IndianAct. The Act sets out the requirements fordetermining who is a Status Indian.
First Nations is a term that came into commonusage in the 1970s to replace the word“Indian,” which some people found offensive.Although the term “First Nations” is widelyused, no legal definition of it exists. Amongits uses, the term “First Nations peoples”refers to the Indian peoples in Canada, bothStatus and Non-Status. Some Indian peopleshave also adopted the term “First Nation” toreplace the word “band” in the name of their community.
Aboriginal People is a collective term for theoriginal peoples of North America and theirdescendants. The Canadian Constitution (theConstitution Act, 1982) recognizes threegroups of aboriginal peoples: Indians, Métisand Inuit. These are three separate peopleswith unique heritages, languages, culturalpractices and spiritual beliefs.
(from Lemstra and Neudorf, 2008)

A number of the charts in this section containdata that are more than five years old. In normal circumstances, we exclude data morethan five years old on the basis that emergingscientific evidence, available technology, formulations of public policy and improvementsin performance can all change significantly ina five-year period. Thus, out-of-date data cangive a misleading picture of performance. Inthe case of the equity charts contained in thissection, we have relaxed our timeliness inclusioncriteria for the following reasons:
1. Inequality is a serious concern when assessingthe quality of care in health systems (ChiefPublic Health Officer, 2008). Excluding key
191
Equity
Authors’ note on data availability for equity and disparitiesindicators on the basis of the age of theavailable analyses would mean that we hadlittle data to present on this issue, whichcould be interpreted to mean that we do notconsider equity to be an important aspect ofquality in healthcare.
2. The controversial nature of inequality canmean that performance in this area is notexposed to careful analysis, public attentionand policy development. This can lead toincreasing disparities and inequalities, oftenaffecting groups that struggle to navigatecomplex social and healthcare systems, further exacerbating the problem.
As well as experiencing difficulties in accessingtimely equity data, we also struggled to findmeaningful information on a national basis.While our goal has been to present a Canada-wide picture throughout this chartbook,where this has not been possible we have highlighted province-specific data.
In this chapter, we present a number of indicators that have been produced by theManitoba Centre for Health Policy and theHealth Quality Council Saskatchewan (Fransoo et al., 2005). Their work providesexcellent case studies of the type of analysespossible in this domain.

0
10
20
30
40
50
60
70
80
Quintile 5 (richest)Quintile 4Quintile 3Quintile 2Quintile 1 (poorest)
48.4
56.4
51.5
58.7
53.0
59.5
54.0
60.1
55.3
60.7
Life expectancy in Canada has increased dramatically over the past century. A Canadianborn today can expect to live for about 80years (see Chart 1.3), a statistic that placesCanada among the longest-lived nations in the world. Within Canada, however, there is considerable variation. The chart shows differences in life expectancy by income. Ithighlights that, for males aged 25 in 2001,there was a 6.9 year difference in lifeexpectancy; that is, males in the richest quintile could expect to live 14% longer thanthose in the poorest. For females, there was a 4.3 year difference (8%). To place the scale of these differences in context, it has been estimated that eliminating all cancers wouldincrease U.S. life expectancy by 2.8 years(Manton, 1991).
192
Chart 6.1 Life expectancy by income: CanadaRemaining life expectancy at age 25, 1991-2001
EquityQuality of Healthcare in Canada: A Chartbook
Sour
ce: Census m
ortality follo
w-up stud
y 19
91-200
1 (see W
ilkins et al., 200
8)
Years
Males
Females

61
68
79
7270
76 77
82
0
20
40
60
80
100
CanadaRegistered IndiansCanadaRegistered Indians
First Nations peoples are more likely to experiencepoor outcomes in almost all areas of health.The following are some of the key findingsfrom Health Canada’s A Statistical Profile onthe Health of First Nations in Canada (2000;update due in late 2009): • In First Nations populations, the potentialyears of life lost from injury was almost 3.5 times the national average.
• Compared with the overall Canadian population, First Nations had elevated ratesof pertussis (2.2 times higher), rubella (7times higher), tuberculosis (6 times higher),shigellosis (2.1 times higher), and chlamydia(7 times higher).
• First Nations hospitalization rates werehigher than Canadian rates for all causesexcept cancers. Where the principal hospitaldischarge diagnosis was respiratory disease,digestive disease, or injuries and poisonings,the rates were approximately 2 to 3 timeshigher than the national averages (Lemstraand Neudorf, 2008).
This chart illustrates the latest available datacomparing life expectancy of Canadians overallwith that of Registered Indians. In 1980, theabsolute gap for males was 10.8 years and forfemales 10.9 years. In 2001 the absolute gapwas 6.6 years for males and 6.6 for females.
193
Equity
Chart 6.2 Life expectancy: Registered IndiansLife expectancy at birth, Registered Indians, 1980 and 2001
Sour
ce:Indian
Northern Affairs Can
ada
Years
Men Women
1980 2001
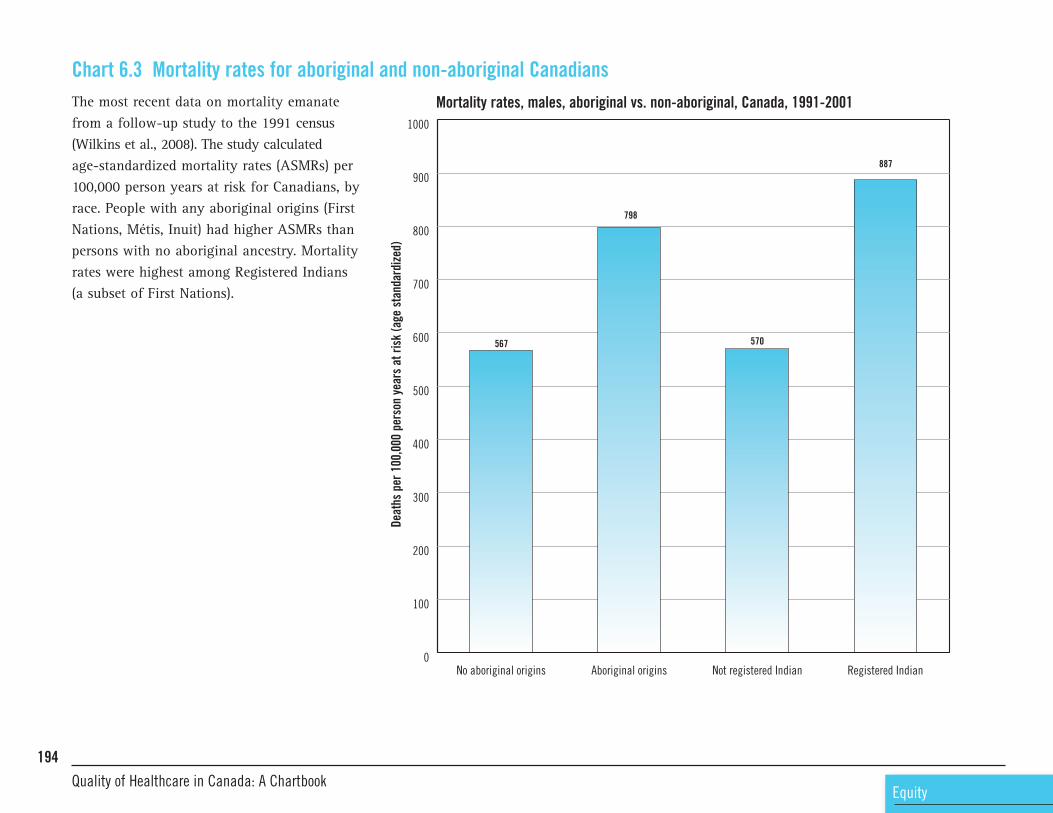
567
798
570
887
0
100
200
300
400
500
600
700
800
900
1000
Registered IndianNot registered IndianAboriginal originsNo aboriginal origins
The most recent data on mortality emanatefrom a follow-up study to the 1991 census(Wilkins et al., 2008). The study calculatedage-standardized mortality rates (ASMRs) per100,000 person years at risk for Canadians, byrace. People with any aboriginal origins (FirstNations, Métis, Inuit) had higher ASMRs thanpersons with no aboriginal ancestry. Mortalityrates were highest among Registered Indians (a subset of First Nations).
194
Chart 6.3 Mortality rates for aboriginal and non-aboriginal CanadiansMortality rates, males, aboriginal vs. non-aboriginal, Canada, 1991-2001
EquityQuality of Healthcare in Canada: A Chartbook
Deaths per 100,000 person years at risk (age standardized)

319
560
321
624
0
100
200
300
400
500
600
700
800
900
1000
Registered IndianNot registered IndianAboriginal originsNo aboriginal origins
195
Equity
Mortality rates, females, aboriginal vs. non-aboriginal, Canada 1991-2001
Sour
ce:Census m
ortality follo
w-up stud
y 19
91-200
1 (W
ilkins et al., 200
8)
Deaths per 100,000 person years at risk (age standardized)

7.02
4.20
4.61
2.58
4.73
2.39
3.56
2.30
3.27
2.04
6.80
4.004.17
2.52
3.50
2.02
2.55
1.71
2.32
1.60
0
1
2
3
4
5
6
7
8
Urban highestincome U5
U4U3U2Urban lowestincome U1
Rural highestincome R5
R4R3R2Rural lowestincome R1
Premature mortality rate (PMR) is a standardized(age- and sex-adjusted) rate of “premature”death; in this case, death before the age of 75.Many researchers consider PMR to be the bestsingle indicator of the overall health status ofa region’s population and need for healthcare(Carstairs and Morris, 1991; Eyles et al., 1991;Eyles and Birch, 1993). PMR is highly correlatedwith morbidity and with self-rated health, as well as with socio-economic risk factors(Martens et al., 2002). The chart illustrates aclear relationship between premature mortalityand low income, in both rural and urban settingsand for both males and females. The greatestrelative difference was in urban areas, wheremales in the lowest-income group had prematuremortality rates nearly two times greater thanthose in the highest-income group.
196
Chart 6.4 Premature mortality by income: ManitobaPremature mortality rates, by income and urbanization, Manitoba, 1994-2003
EquityQuality of Healthcare in Canada: A Chartbook
Sour
ce:Man
itoba Centre for H
ealth
Policy (Fransoo et al., 20
05)
Deaths per year p
er 1,000 re
sidents aged 0-74
Males
Females

3436
46
20
2
17
3
1614
10 119 10
2123
0
10
20
30
40
50
60
70
80
90
100
United
State
s
United
King
dom
New Ze
aland
Netherl
ands
German
yFra
nce
Canad
a
Austr
alia
Internationally, cost is a frequent factor ininhibiting equitable access to medical carewhen needed. These charts present data fromthe patients’ perspective regarding cost-relatedbarriers to care. Data are drawn from the 2008Commonwealth Fund survey of adults withhealth problems, which asked: “Was there atime in the past year when you:• Had a specific medical problem but did not
visit the doctor because of cost?• Skipped or did not get a medical test that was
recommended by a doctor because of cost?”The chart illustrates the proportion of allrespondents in each country who answeredyes. For Canadian respondents, around one inten respondents in each group indicated thatthey had not accessed medical care because ofcost concerns.
197
Equity
Chart 6.5 Cost concerns as a barrier to medical care: International Cost concerns as a barrier to medical care, 2008
Sour
ce:Co
mmon
wealth
Fun
d, 200
8
% of respondents
Had a specific medical problembut did not visit doctor
Skipped or did not get a recommendedmedical test, treatment or follow-up

0
10
20
30
40
50
60
70
80
90
100
United
State
s
United
King
dom
New Ze
aland
Netherl
ands
German
yFra
nce
Canad
a
Austr
alia
39
47
8
1816
3
37
7
13 1312
1816
29
18
35
The 2008 Commonwealth Fund survey askedrespondents: “Was there a time in the pastyear when you:• Did not fill a prescription for medicine or
skipped doses because of cost?• Needed dental care but did not see dentist
because of cost?”More than one-quarter of Canadian respondentsindicated that they had not sought neededdental care because of cost and one in six had not taken recommended pharamaceuticalsbecause of financial concerns.
198
Chart 6.6 Cost concerns as a barrier to dental care and pharmacy: InternationalCost concerns as a barrier to dental care and pharmacy, 2008
EquityQuality of Healthcare in Canada: A Chartbook
Sour
ce:Co
mmon
wealth
Fun
d, 200
8
% of respondents
Did not fill prescription formedicine or skipped doses
Needed dental care but did notsee dentist

0
2
4
6
8
10
12Q1 (poorest)
Q5 (richest)
2001199619911986
Infant mortality refers to the number of deathsunder the age of one year per 1,000 live births.In 2005, Canada’s infant mortality rate was 5.4per 1,000 live births. Income levels are knownto affect infant mortality rates. The chart showsthat infant mortality rates in urban Canada fellbetween 1986 and 2001 and that the gap betweenrichest and poorest communities decreased froma difference of 4.7 deaths per 1,000 live birthsin 1986 to 2.1 deaths per 1,000 live births in2001, Further insight is gained from estimatesof infant mortality rates among aboriginalpeoples and those living in Canada’s northerncommunities. The infant mortality rate amongFirst Nations people living on reserves is estimatedat 7 deaths per 1,000 live births, although this maybe an underestimate, due to limitations associatedwith data and reporting. Recent research relatedto First Nations in British Columbia puts theestimate as high as 7.5 deaths per 1,000 livebirths for First Nations living in rural areas. Theestimated rate in Nunavut (where approximately85% of the population is Inuit) is more thanthree times the national rate, at 16 deaths per1,000 live births (Public Health Agency ofCanada, 2008).
199
Equity
Chart 6.7 Infant mortality by socio-economic status: CanadaInfant mortality rate by neighbourhood income (richest vs. poorest quintiles), urban Canada, 1986-2001
Source: Wilkins, 2007
Per 1
,000 live births

8.25
6.82
7.52
5.27
3.90
2.64
3.67
1.84
6.14
3.59 3.65
2.60
4.79
2.24
2.63
1.53
0
2
4
6
8
10
FemalesMalesFemalesMales
The Manitoba Centre for Health Policy analyzedadministrative data on deaths and hospitalizationsfor acute myocardial infarction (AMI) and strokeby sex and income (stratified into urban andrural areas). The chart shows the data for lowest-and highest-income groups in both rural andurban areas. There is a strong relationshipbetween AMI/stroke rates and income/place of residence.
200
Chart 6.8 Incidence of AMI and stroke by income and place of residence: Manitoba AMI and stroke incidence by income (lowest vs. highest), Manitoba, 1998-1999 to 2002-2003
EquityQuality of Healthcare in Canada: A Chartbook
Sour
ce:Man
itoba Centre for H
ealth
Policy (Fransoo et al., 20
05)
Not
e:Pa
tients aged 40
+ years; data exclud
e AMI ho
spitalization for <3
days to exclude m
isdiagno
sed
or m
iscoded AMIs. Death or hospitalization (age standardized) per 1,000 re
sidents age 40+
Lowest rural
Highest rural
Lowest urban
Highest urban
AMI Stroke

2.80
3.06
3.27
2.75
1.37
1.16
1.69
0.94
0.0
0.5
1.0
1.5
2.0
2.5
3.0
3.5
FemalesMales
On the previous page, Chart 6.8 illustrates that,in Manitoba, patients in lower income bracketssuffered more heart attacks and strokes thanthose in higher income brackets. These chartsexamine the rate at which two types of treatmentfor cardiovascular diseases are given, by incomeand urban or rural residence. In the case ofangioplasty, the rate for lower-income males in rural areas is lower than that for rural high-income males, despite the fact that incidence ishigher in the lower-income group. For statins,urban males in the higher income bracket havea higher rate of prescription despite recordinglower relative levels of AMI/stroke incidencewhen compared to lower-income urban males.
201
Equity
Chart 6.9 Angioplasty and statin prescription by income and place of residence: ManitobaAngioplasty procedures by income, Manitoba 1999-2000 to 2003-2004
Age-adjusted ra
te per 1,000 re
sidents aged 40+
Lowest rural
Highest rural
Lowest urban
Highest urban

10.50
9.71
8.23
10.09
9.76
7.69 7.75
6.35
0
2
4
6
8
10
12
FemalesMales
202
Statin prescriptions, by income, Manitoba, 2003-2004
EquityQuality of Healthcare in Canada: A Chartbook
Sour
ce: Man
itoba Centre for H
ealth
Policy (Fransoo et al., 20
05)
Age-adjusted %
residents age 20+ prescribed statins
Lowest rural
Highest rural
Lowest urban
Highest urban
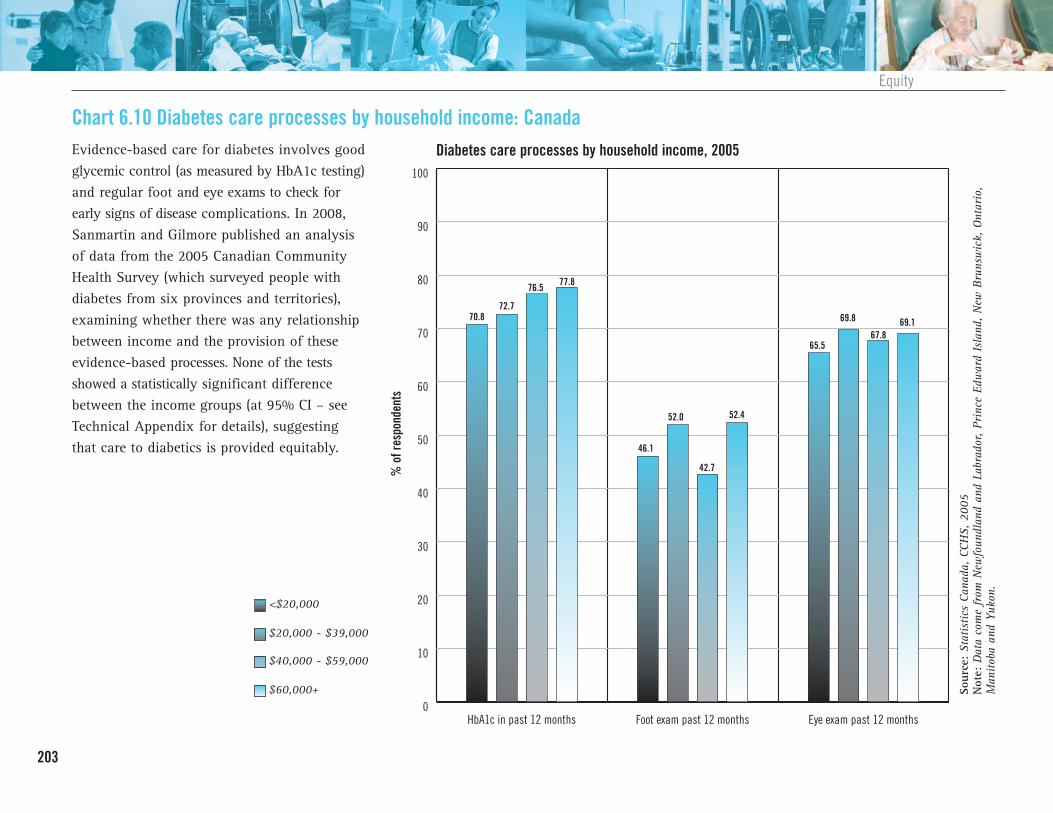
70.872.7
76.5 77.8
46.1
52.0
42.7
52.4
65.5
69.8
67.869.1
0
10
20
30
40
50
60
70
80
90
100
Eye exam past 12 monthsFoot exam past 12 monthsHbA1c in past 12 months
Evidence-based care for diabetes involves goodglycemic control (as measured by HbA1c testing)and regular foot and eye exams to check forearly signs of disease complications. In 2008,Sanmartin and Gilmore published an analysisof data from the 2005 Canadian CommunityHealth Survey (which surveyed people withdiabetes from six provinces and territories),examining whether there was any relationshipbetween income and the provision of theseevidence-based processes. None of the testsshowed a statistically significant differencebetween the income groups (at 95% CI – seeTechnical Appendix for details), suggestingthat care to diabetics is provided equitably.
203
Equity
Chart 6.10 Diabetes care processes by household income: CanadaDiabetes care processes by household income, 2005
Sour
ce:Statistics Can
ada, CCH
S, 200
5Not
e:Data come from
New
foun
dlan
d an
d Labrador, Prince Edw
ard Island
, New
Brunswick, Ontario,
Man
itoba an
d Yu
kon.
% of respondents
<$20,000
$20,000 - $39,000
$40,000 - $59,000
$60,000+
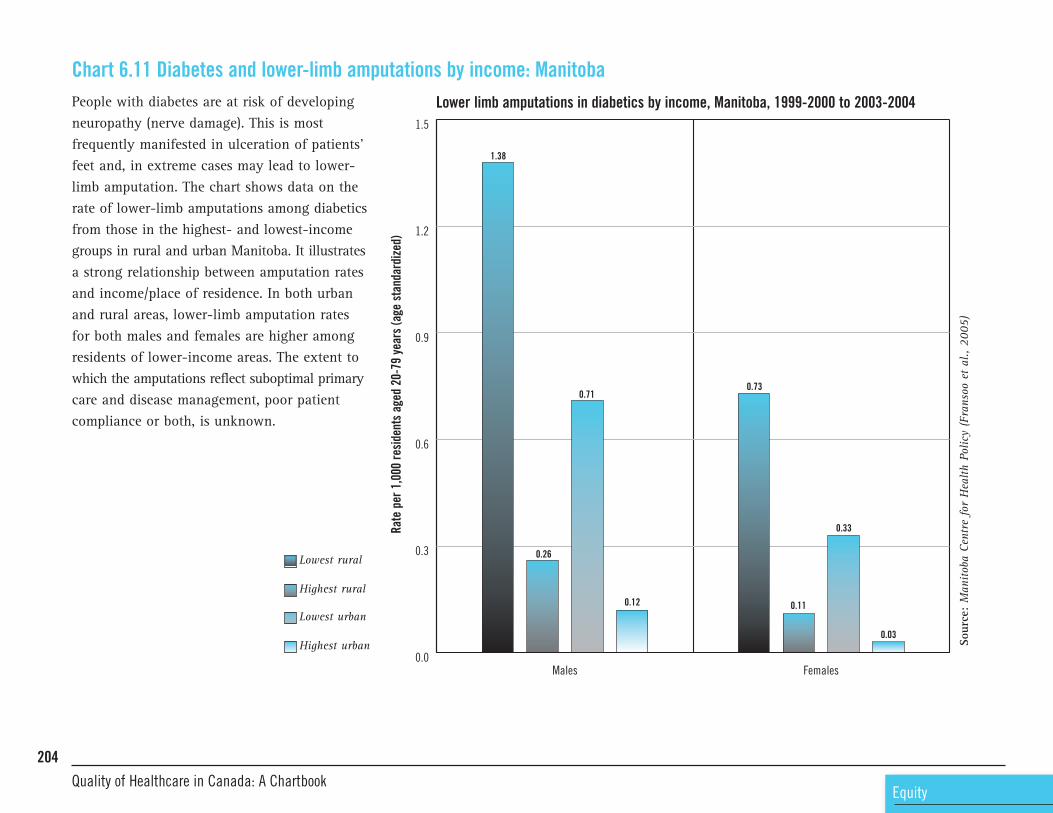
1.38
0.26
0.71
0.12
0.73
0.11
0.33
0.03
0.0
0.3
0.6
0.9
1.2
1.5
FemalesMales
People with diabetes are at risk of developingneuropathy (nerve damage). This is most frequently manifested in ulceration of patients’feet and, in extreme cases may lead to lower-limb amputation. The chart shows data on therate of lower-limb amputations among diabeticsfrom those in the highest- and lowest-incomegroups in rural and urban Manitoba. It illustratesa strong relationship between amputation ratesand income/place of residence. In both urbanand rural areas, lower-limb amputation ratesfor both males and females are higher amongresidents of lower-income areas. The extent towhich the amputations reflect suboptimal primarycare and disease management, poor patientcompliance or both, is unknown.
204
Chart 6.11 Diabetes and lower-limb amputations by income: ManitobaLower limb amputations in diabetics by income, Manitoba, 1999-2000 to 2003-2004
EquityQuality of Healthcare in Canada: A Chartbook
Sour
ce:Man
itoba Centre for H
ealth
Policy (Fransoo et al., 20
05)
Rate per 1,000 re
sidents aged 20-79 years (age standardized)
Lowest rural
Highest rural
Lowest urban
Highest urban

68
6563
0
10
20
30
40
50
60
70
80
90
100
Low SESAverage SESHigh SES
A study conducted by the Canadian PopulationHealth Initiative (CPHI) focusing on 15Canadian census metropolitan areas analyzeddata from the Canadian Community HealthSurvey and found that 63% of seniors withlow socio-economic status (SES) reportedreceiving an influenza immunization, comparedwith 65% of those seniors with an average SESand 68% of seniors with a high SES.
205
Equity
Chart 6.12 Influenza vaccination in seniors, by incomeInfluenza vaccination for seniors by socioeconomic status, 2003-2005
Sour
ce:CP
HI an
alysis of CC
HS 2.1 (200
3) and
3.1 (20
05), Statistics Can
ada.
% of respondents

53.5
74.6
63.6
79.9
53.8
76.1
67.3
79.8
0
10
20
30
40
50
60
70
80
90
100
FemalesMales
The chart illustrates the proportion of childrenin highest- and lowest-income quintiles inboth rural and urban Manitoba, born betweenApril 1, 2000 and March 30, 2001, who hadcomplete immunization schedules as of theirsecond birthday. A complete immunizationschedule at that time included • four diphtheria, acellular pertussis, tetanusand polio (DaPTP)
• four haemophilus influenzae B (HIB) • one measles, mumps and rubella (MMR). There is a strong relationship between area-levelincome and immunization rates for two-year-olds:children from families living in higher-incomeareas had higher immunization rates. The ratesare considerably lower than the target of 95%or higher for most childhood immunizationsidentified by the Public Health Agency of Canada.
206
Chart 6.13 Childhood immunizations by income: ManitobaProportion of children with complete immunizations at two years old, by income, Manitoba, 2002-2003
EquityQuality of Healthcare in Canada: A Chartbook
Sour
ce:Man
itoba Centre for H
ealth
Policy (Fransoo et al., 20
05)
% of children
Lowest rural
Highest rural
Lowest urban
Highest urban

14.8613.29
15.2013.61
25.13
20.90
24.20
20.52
0
10
20
30
40
50
60
70
80
90
100
FemalesMales
Benzodiazepines are a commonly prescribeddrug, especially for older adults suffering fromanxiety or sleep problems. Intended for short-termuse (<3 weeks), benzodiazepines can be relativelyeffective and safe when prescribed and takenin an appropriate manner. However, some olderadults are prescribed the drug for much longerthan therapeutically recommended and at levelsthat may be unsafe for them. The use of highdaily doses of benzodiazepines by seniors, inparticular, is associated with increased risk ofhip fractures, motor vehicle accidents, accidentalfalls, accidental poisonings, hospitalization fordepression and other psychiatric problems, andwith attempted and completed suicides. Thechart illustrates that females in Manitoba wereprescribed benzodiazepines twice or more, orwere prescribed more than a 30-day supplymuch more frequently than were men. Lowest-income quintiles had higher prescription ratesthan the highest quintiles.
207
Equity
Chart 6.14 Benzodiazepine prescription in seniors, by income and sex: ManitobaCommunity-dwelling seniors prescribed benzodiazepine, by income, Manitoba, 2003-2004
Sour
ce: Man
itoba Centre for H
ealth
Policy (Fransoo et al., 20
05)
% of residents aged 75+ with tw
o or more prescriptions OR >3
0 day supply of benzodiazepine
Lowest rural
Highest rural
Lowest urban
Highest urban

7.7
2.8 2.8
1.6
2.4
1.5
0
1
2
3
4
5
6
7
8
9
Adjusted for age, sex, diabetes, baseline GFR, median household income quintile, admission for non-ambulatory care condition and rural location of residence
Adjusted for age, sex, diabetes, baseline GFR and admission for non-ambulatory care condition
Unadjusted
A research study conducted by Goa et al.(2008) examined whether access to care differedbetween status Indians and non-aboriginalpeople with chronic kidney disease. Good primary care should keep admission rates low.The chart on the left illustrates disparities inadmission rates, disparities that remain in evidence after controlling for other variablesknown to increase admission rates. The charton the right illustrates the likelihood of visiting the nephrologist, adjusting for variousconfounders. It shows that aboriginal peoplewere much less likely to visit a nephrologist.Increased rates of hospital admissions forambulatory care-sensitive conditions and areduced likelihood of nephrology visits point to inequities in care. The extent to which thiscontributes to a higher rate of kidney failureamong aboriginal people is unknown.
208
Chart 6.15 Chronic kidney disease care, aboriginal vs. non-aboriginal: AlbertaHospital admission rates for ambulatory care-sensitive conditions, aboriginal vs. non-aboriginalpatients with chronic kidney disease, Alberta 2003-2004
EquityQuality of Healthcare in Canada: A Chartbook
Rate per 100 person years
Aboriginal
Non-aboriginal

0
2
4
6
8
10
12
14
16
18
Adjusted for age, sex, diabetes, baseline GFR, median household income quintile, admission for non-ambulatory care condition and rural location of residence
Adjusted for age, sex, diabetes, baseline GFR and admission for non-ambulatory care condition
Unadjusted
15.615.3
7.8
13.8
9.3
13.5
209
Equity
Likelihood of an outpatient nephrologist visit, aboriginal vs. non-aboriginal, Alberta 2003-2004
Sour
ce:Goa et al., 20
08
Rate per 100 person years
Aboriginal
Non-aboriginal

79.8 80.7 78.9 79.9 79.0
83.1
78.1 78.175.8
67.670.0
63.9 63.9 63.0
43.1
0
20
40
60
80
100
85+75-8465-7450-6420-49
Secondary prevention medications are prescribedto prevent people from having another heartattack. There is good evidence to show thatheart attack patients who take the recommendedmedications live longer. This chart illustratesthat age-related disparities are in evidence andsuggests that older adults may not be receivingadequate cardioprotective medications followinga heart attack.
210
Chart 6.16 AMI secondary prevention by age: Saskatchewan Secondary prevention AMI, drugs dispensed three days post-discharge, Saskatchewan, 2005-2006
EquityQuality of Healthcare in Canada: A Chartbook
Sour
ce:Sa
skatchew
an H
ealth
Cou
ncil, 200
5
Percent
Beta-blockers
ACE/ARB
Statins

Chart 1.1 Age-standardized death rates per 100,000 peopleaged 0-74 years using direct standardization tothe European standard population. Mortality andpopulation data were extracted for 1997-2003from World Health Organization (WHO) mortalitydatabase. Data include deaths coded according tothe 9th and 10th revisions of the InternationalClassification of Diseases (ICD). The causes ofdeath considered amenable to healthcare werebased on a systematic review (see Nolte and McKee,2004 for details and ICD codes). Included were: • For ages 0-14: intestinal infections, whoopingcough, measles (1-14), all respiratory diseasesexcept pneumonia and influenza (1-14).
• For ages 0-44: malignant neoplasm of thecervix uteri and body of cervix, leukemiaand diabetes (0-49).
• For ages 0-74: tuberculosis, other infections(diphtheria, tetanus, septicemia andpoliomyelitis), malignant neoplasm of therectum and colon, skin, breast, cervix uteri,testis, Hodgkin’s disease, diseases of the thyroid, epilepsy, chronic rheumatic heartdisease, hypertensive disease, ischemic heart disease (as per growing internationalconsensus, only one-half of IHD deaths werecounted as “amenable”), cerebrovascular disease, influenza, pneumonia, peptic ulcer,
appendicitis, abdominal hernia, cholelithiasisand cholecystitis, nephritis and nephrosis,benign prostatic hyperplasia, misadventuresto patients, maternal death, congenital cardiovascular anomalies, perinatal deaths(all causes except stillbirths). Note that agelimits other than 75 years were set for: diabetes (<50 years because the preventabilityof deaths at older ages–and in particular the effectiveness of good diabetic control in reducing vascular complications–is controversial), intestinal infectious diseases,whooping cough, measles and childhoodrespiratory diseases (<15 years because deathfrom these diseases other than in childhoodis likely to reflect the presence of other diseaseprocesses); leukemia (<44 years becauserecent evidence demonstrates improvementin mortality from leukemia in the EuropeanUnion up to age 44 since 1960, largelyattributed to advances in treatment).
Chart 1.2From OECD Health Data 2008, sourced fromAustralian Bureau of Statistics (Farr’s methodused; from 1995 onwards, data represent three-year rolling averages); Statistics Canada (estimatesfor 1986–a census year–based on three-yearmortality data; estimates for 2005 calculated
via Greville’s method using three-year averageof age-specific mortality rates; non-residentsof Canada are excluded from the deaths andpopulation estimates used); Eurostat NewCronosdatabase for European data; U.S. NationalCenter for Health Statistics (note change inmethodology in 1997 to one that constructscomplete life tables by single years of age thatextend to 100 using a methodology similar tothat of the U.S. dicennial tables).
Chart 1.3Calculation based on Greville’s method for abridgedlife tables. For 1991, annual mortality rates andfive-year age groupings of population and mortalityrates were used. For the 2006 data, life expectancywas calculated using a three-year average ofage-specific mortality rates. Chart is based ondata tabulated by place of residence. Data excludebirths to mothers not resident in Canada; birthsto mothers resident in Canada whose provinceor territory of residence was unknown; deaths ofnon-residents of Canada; deaths of residents ofCanada whose province or territory of residencewas unknown; deaths for which age or sex ofdecedent was unknown. The territories includeYukon, the Northwest Territories and Nunavut.For 95% confidence intervals and furtherdetails, see CANSIM table 102-0511.
211
TECHNICAL APPENDIX

Chart 1.4Number of deaths extracted from WHOMortality Database. Age-standardized deathrates per 100,000 population , using the OECDpopulation for 1980 as the reference population.ICD-10 codes C00-C97.
Chart 1.5Potential years of life lost (PYLL) is a measurethat sums deaths (in this case from cancer:ICD-10 C00-C97) occurring at each age andmultiplying this by the number of remainingyears to reach 70 years. PYLL per 100,000 isbased on age-specific death statistics providedby WHO and uses the OECD population for1980 as the reference population.
Chart 1.6Data from CANSIM table 102-0552. Rates are: based on usual place of residence, age-standardized using the direct method and the1991 Canadian Census of Population structure.ICD-10 codes C00-C97. Data exclude deaths ofnon-residents of Canada; deaths of residents ofCanada whose province or territory of residencewas unknown; and deaths for which age ofdecedent was unknown.
Charts 1.7-1.10 (a and b)a. Number of deaths extracted from WHOMortality Database. Age-standardized deathrates per 100,000 population, using theOECD population for 1980 as the reference
population. ICD-10 codes: C33-C34 for lungcancer; C18 – C21 for colorectal cancer; C50for breast cancer; C61 for prostate cancer.
b. Sums of deaths (for each type of cancer)occurring at each age and multiplying thisby the number of remaining years to reach70 years. PYLL per 100,000 is based on age-specific death statistics provided by WHOand uses the OECD population for 1980 asthe reference population.
Chart 1.8 (a and b)See Chart 1.6
Chart 1.9 (a and b)See Chart 1.6
Chart 1.10 (a and b)See Chart 1.6
Chart 1.11 Data exclude Quebec due to methodologicaldifferences in data collection; 1992 data alsoexcludes PEI. Colorectal cancer does not includecancer of the anus (2002-04 data).
Care should be taken with prostate survivalratios. Extensive use of PSA testing to diagnoseprostate cancer may identify “indolent” cancerthat would otherwise go undetected and thathas a high survival rate (artefactually raising survival ratios).
International comparisons are difficult to makebecause of differences in age standardization.A study published in 2008 (Coleman et al),however, compared cancer survival (forprostate, colorectal, breast) across five continentsfor patients diagnosed between 1990 and 1994. While these data are too out of date toinclude in the chartbook, we note that Canadaoutperformed European countries.
Chart 1.12Newfoundland and Labrador data not shown as they were artefactually high. Quebec dataexcluded from analysis because of methodologicaldifferences (see Canadian Cancer Society, 2009:60). Due to the relatively small number ofcases from Prince Edward Island available foranalysis, RSR estimates for this province areless precise than for other provinces.
Chart 1.13 Cancer System Quality Index (CSQI) of Ontariois a web-based public reporting tool. Furtherdetails available at: http://csqi.cancercare.on.ca/
Chart 1.14Number of deaths extracted from WHOMortality Database. Age-standardized deathrates per 100,000 population, using the OECDpopulation for 1980 as the reference population.ICD-10 codes I00-I99.
212Quality of Healthcare in Canada: A Chartbook

Chart 1.15Sum of deaths from circulatory disease occurringat each age and multiplying this by the numberof remaining years to reach 70 years. PYLL per100,000 is based on age-specific death statisticsprovided by WHO and uses the OECD populationfor 1980 as the reference population.
Chart 1.16Data from CANSIM table 102-0552. Rates arebased on place of residence; data excludedeaths of non-residents of Canada. Data referto underlying cause of death. ICD-10 codesI00-I798 and I80-I99.
Chart 1.17Number of deaths extracted from WHOMortality Database. Age-standardized deathrates per 100,000 population, using the OECDpopulation for 1980 as the reference population.ICD-10 codes I21, I22
Chart 1.18Sum of deaths from AMI occurring at each ageand multiplying this by the number of remainingyears to reach 70 years. PYLL per 100,000 isbased on age-specific death statistics providedby WHO and uses the OECD population for1980 as the reference population.
Chart 1.19Data from CANSIM table 102-0552. Rates arebased on usual place of residence and age-standardized using the direct method and the1991 Canadian Census of Population structure.ICD-10 code I21-I22. Data exclude deaths ofnon-residents of Canada; deaths of residents ofCanada whose province or territory of residencewas unknown; and deaths for which age ofdecedent was unknown.
Chart 1.20Risk-adjusted rate of unplanned re-admissionfollowing discharge for AMI. A case is countedas a re-admission if it is for a relevant diagnosisand occurs within 28 days after the index AMIepisode of care. An episode of care refers to all contiguous in-patient hospitalizations and same-day surgery visits.
Relevant diagnoses for assigning re-admission cases:• Acute myocardial infarction• Other acute and subacute forms of ischemicheart disease
• Old myocardial infarction• Angina pectoris• Other forms of chronic ischemic heart disease• Conduction disorders• Cardiac dysrhythmias
• Functional disturbances following cardiac surgery
• Pneumococcal pneumonia• Other bacterial pneumonia• Bronchopneumonia, organism unspecified• Pneumonia, organism unspecified• Urinary tract infectionNumerator: number of AMI episodes with a re-admission for a given year. Denominator:total number of AMI episodes in an 11-monthperiod. Data collection period April 1-March31. Data are labelled by CIHI as the mid-pointof a three-year period. The Canada rate includesonly those provinces for which comparabledata were available.
Chart 1.21Data refer to financial years April 1-March 31.Data were suppressed for dispensing rates wherethe denominator (number of AMI patients) wasless than 15. Data were also suppressed in anyinstance where the numerator or denominatorminus numerator was less than five. Patientswho died in hospital, patients with RegisteredIndian status and patients with no drug usewhatsoever were excluded from analysis.Patients who died between discharge and anyof the three time points were also removedfrom the denominator when determining drugadherence at various time points.
213

Chart 1.22Number of deaths extracted from WHOMortality Database. Age-standardized deathrates per 100,000 population, using the OECDpopulation for 1980 as the reference population.ICD-10 codes I60 – I69
Chart 1.23 Sum of deaths from cerebrovascular diseaseoccurring at each age and multiplying this bythe number of remaining years to reach 70 years.PYLL per 100,000 is based on age-specific deathstatistics provided by WHO and uses the OECDpopulation for 1980 as the reference population.
Chart 1.24Data from CANSIM table 102-0126. Rates arebased on place of residence and age-standardizedusing the direct method and the 1991 CanadianCensus of Population structure. ICD-10 codeI60-I69. Data exclude deaths of non-residentsof Canada; deaths of residents of Canadawhose province or territory of residence wasunknown; and deaths for which age of decedentwas unknown.
Chart 1.25National survey conducted in the fall of 2007, forfurther details see Heart and Stroke Foundationhttp://www.heartandstroke.com/site/apps/nlnet/content2.aspx?c=ikIQLcMWJtE&b=4955951&ct=5591565
Charts 1.26-1.29All Ontario acute-care institutions (excludingchildren’s and mental healthcare hospitals andthose with fewer than 10 stroke or TIA separationsper year) participated in the stroke audit (n=153).All patients seen in the emergency departmentor admitted to hospital between April 1, 2004and March 31, 2005 with a “most responsible”diagnosis of stroke or TIA were eligible forinclusion in the audit. Stroke/TIA separationswere identified from the discharge abstractdatabase (DAD) and the National AmbulatoryCare Reporting System (NACRS). For individualswith more than one stroke/TIA in the samplingtime frame, only the first stroke/TIA event wasincluded. From all eligible cases, a simple randomsample of 21% was selected, with over-samplingperformed at low-volume institutions so thateach institution contributed a minimum of 10cases. The total sample size was 4,913 stroke/TIA events. Different hospital types are defined as:• Non-designated: acute-care hospital thatdoes not fit the definition of District orRegional Stroke Centre
• District Stroke Centre: facilities with writtenstroke protocols for emergency services,emergency department and acute care,including transport and triage protocols;ability to offer thrombolytic therapy to suitableischemic stroke patients; timely CT scanningand expert interpretation; clinicians withstroke expertise; and linkages to rehabilitationand secondary prevention
• Regional Stroke Centre: all the requirementsof a District Stroke Centre, plus neurosurgicalfacilities and interventional radiology.
Chart 1.27See Chart 1.26
Chart 1.28See Chart 1.26
Chart 1.29See Chart 1.26
Chart 1.30a. Number of deaths extracted from WHOMortality Database. Age-standardized deathrates per 100,000 population , using theOECD population for 1980 as the referencepopulation. ICD-10 codes J00-J98.
b. Sum of deaths from respiratory diseaseoccurring at each age and multiplying thisby the number of remaining years to reach 70years. PYLL per 100,000 is based on age-specificdeath statistics provided by WHO and usesthe OECD population for 1980 as the reference population.
Chart 1.31Data from CANSIM table 102-0552. Rates arebased on usual place of residence and age-standardized using the direct method and the1991 Canadian Census of Population structure.ICD-10 codes J10-J18; J20-J22; J40-J47; J60-J66,
214
Quality of Healthcare in Canada: A Chartbook

J68; J69; J00-J06; J30-J39; J67; J70-J98. Dataexclude deaths of non-residents of Canada;deaths of residents of Canada whose provinceor territory of residence was unknown; anddeaths for which age of decedent was unknown.
Chart 1.32Survey conducted by Leger Marketing. Randomsample of 2,196 Canadians from British Columbia(207); Alberta (185); Manitoba/Saskatchewan(314); Ontario (569); Quebec (523); andMaritimes (398). COPD-diagnosed segmentn=143; “at risk” segment n=425. Details availableat: http://www.lung.ca/media-medias/news-nouvelles_e.php?id=98
Chart 1.33-1.34The 2008 Commonwealth Fund InternationalHealth Policy Survey screened random samplesof adults aged 18+ years to identify those whorated their health as fair or poor or who had aserious illness or disability, major surgery orhad been hospitalized (for conditions otherthan childbirth) in the preceding two years.Full sample sizes: Australia (750), Canada (2,635),France (1,202), Germany (1,201), Netherlands(1,000), New Zealand (751), United Kingdom(1,200) and United States (1,205). Interviewswere conducted by telephone between Marchand May 2008. The margin of sample error forcountry averages are approximately: +-4% for
Australia, New Zealand and the Netherlands;+-3% for France, Germany and the U.S.; and +-2% for Canada at the 95 percent confidence level.
This chart limited to respondents with diagnoseddiabetes. This more limited sample was:Australia, 105; Canada, 452; France 151;Germany, 205; Netherlands, 143; New Zealand, 78; U.K. 144; U.S. 264.
Chart 1.34See Chart 1.23
Chart 1.35The CCHS is a cross-sectional survey that collects information related to health status,health care utilization and health determinantsfor the Canadian population. It relies upon alarge sample of respondents and is designed toprovide reliable estimates at the health regionlevel. Further details available at:http://www.statcan.gc.ca/cgi-bin/imdb/p2SV.pl?Function=getSurvey&SDDS=3226&lang=en&db=imdb&adm=8&dis=2#2
Chart 1.36Denominator for indicators was number of persons who met the diabetes mellitus definitioncriteria who are in the Saskatchewan DiabetesDatabase (SDD) and who had at least one
HbA1c test done (or one LDL cholesterol measurement) in the measurement year. Labrecords with missing test data were excluded.For further details, see: http://www.hqc.sk.ca/download.jsp?2z6ed94Gr0iMC4qBWunaBDBIzBf0QfLQkUwK4QBZaJukPeUN9CnxMA==
Chart 1.37 a and ba. Number of deaths extracted from WHOMortality Database. Age-standardized deathrates per 100,000 population, using theOECD population for 1980 as the referencepopulation. ICD-10 codes X60-X84
b. Sum of deaths from intentional self-harmoccurring at each age and multiplying thisby the number of remaining years to reach70 years. PYLL per 100,000 is based on age-specific death statistics provided by WHOand uses the OECD population for 1980 asthe reference population.
Chart 1.38Data drawn from CANSIM Table 102-0110.PYLL is defined as the number of years ofpotential life not lived when a person dies“prematurely”; defined for this indicator asbefore age 75. Data exclude deaths of non-residents of Canada; deaths of residents ofCanada whose province or territory of residence was unknown; and deaths for whichage of decedent was unknown.
215

Chart 1.39Rates directly age-standardized using Canada1991 as the standard population. Populationbased on estimates from Statistics Canada.Further details available at: http://secure.cihi.ca/cihiweb/en/downloads/NTROctober2004_Suicide%20Attempts%20Bulletin_FINAL.pdf
Chart 1.40 Health regions are based on patients’ residence.Re-admission rates included only individualswhose age at admission was between 15 and65 years old, who were diagnosed with a mental illness in the index episode and whowere re-admitted with mental disorders via theemergency department. Rates exclude patientswith invalid health card numbers or postalcodes. Data needed for the computation ofQuebec re-admission rates were not available.
Chart 1.41 Percentage of children at one or two years ofage who have been fully immunized againstdiphtheria, tetanus and pertussis (DTP). Differentcountries have different immunization schedules.
Chart 1.42Data from CANSIM table 105-4045. Populationaged 65 and over who reported when they hadtheir last influenza immunization. Rates areage standardized using the direct method andthe 1991 Canadian census population structure.Nunavut data is from 2005.
Chart 1.43The 2008 Commonwealth Fund InternationalHealth Policy Survey screened random samplesof adults aged 18+ years to identify those whorated their health as fair or poor or who had aserious illness or disability, major surgery orhad been hospitalized (for conditions otherthan childbirth) in the preceding two years.Full sample sizes: Australia (750), Canada(2,635), France (1,202), Germany (1,201),Netherlands (1,000), New Zealand (751), UnitedKingdom (1,200) and United States (1,205).Interviews were conducted by telephonebetween March and May 2008. The margin of sample error for country averages areapproximately: +-4% for Australia, New Zealandand the Netherlands; +-3% for France, Germany,and the U.S.; and +-2% for Canada at the 95 percent confidence level. Sample size forcholesterol question was: Australia, 355; Canada,1,196; France, 536; Germany, 681; Netherlands,488; New Zealand, 292; U.K., 582; U.S., 717.
Chart 1.44Canadian Survey of Experiences with PrimaryHealth Care (CSE-PHC) was conducted withCanadians aged 18+ years living in privatedwellings in the 10 provinces and the threeterritories. Persons living on Indian reserves orCrown lands, residents of institutions, full-timemembers of the Canadian Armed Forces andresidents of certain remote regions wereexcluded. The sample for this survey was
drawn from the Canadian Community HealthSurvey (CCHS, record number 3226), Cycle 4.1,and consisted of 16,482 respondents. Theresponse rate was 71.0%. Further details at:http://www.statcan.gc.ca/cgi-bin/imdb/p2SV.pl?Function=getSurvey&SDDS=5138&lang=en&db=imdb&adm=8&dis=2
Chart 1.45Data from CANSIM table 105-0443. Femalesaged 50-69 years who reported when they hadtheir last mammogram for routine screening orother reasons. Data from Nunavut suppresseddue to extreme sampling variability.
Chart 1.46Data drawn from CCHS 2003 and come fromall health regions in Newfoundland and BritishColumbia, 14/37 regions in Ontario and 7/11regions in Saskatchewan. Since 1996, Canadianand U.S. organizations have published guidelinesfor CRC screening in individuals who are 50years of age and older and at average risk fordeveloping the disease. Recommendationsinclude performance of either annual or biannualFOBT, flexible sigmoidoscopy every five years,double contrast barium enema every five-to-tenyears or colonoscopy every 10 years. Nationalrecommendations for the development of population-based CRC screening were publishedfor Canada in 2002. Since then, severalprovinces have implemented small-scale pilotscreening-program projects. In 2007, provinces
216
Quality of Healthcare in Canada: A Chartbook

and territories began to formally announcetheir intentions to launch organized CRCscreening programs and/or indicated CRCscreening was an upcoming priority. Programsare currently at various stages of development,with some provinces still at the planning phaseand others moving to expand their existingpilots. At the federal level, a pan-CanadianCRC screening network has been established topromote collaborative action aimed at facilitatingthe development of CRC screening programsacross Canada.
Chart 1.47Data from CANSIM table 105-4042. Includesfemales aged 18-69 who reported when they hadtheir last Pap (Papanicolaou) smear test. Ratesare age-standardized using the direct method andthe 1991 Canadian Census population structure.
Chart 1.48Ambulatory care sensitive conditions include: • Grand mal status and other epileptic convulsions
• Chronic obstructive pulmonary diseases• Asthma• Heart failure and pulmonary edema• Hypertension• Angina• Diabetes
Data exclude patients who died before discharge.Data age-standardized using direct method and1991 Canadian census population structure.
Chart 1.49The 2008 Commonwealth Fund InternationalHealth Policy Survey screened random samplesof adults aged 18+ years to identify those whorated their health as fair or poor or who had aserious illness or disability, major surgery orhad been hospitalized (for conditions otherthan childbirth) in the preceding two years.Full sample sizes: Australia (750), Canada(2,635), France (1,202), Germany (1,201),Netherlands (1,000), New Zealand (751), UnitedKingdom (1,200) and United States (1,205).Interviews were conducted by telephonebetween March and May 2008. The margin ofsample error for country averages are approxi-mately: +-4% for Australia, New Zealand andthe Netherlands; +-3% for France, Germany,and the U.S.; and +-2% for Canada at the 95percent confidence level.
This chart limited to respondents who had beenhospitalized within the preceding two years;data include respondents who went to emergencydepartment, were re-admitted to ward or both.This more limited sample was: Australia, 420;Canada, 1,265; France, 709; Germany, 697;
Netherlands, 470; New Zealand, 436; U.K., 528;U.S., 554.
Chart 1.50Calculated as number of caesarean sections pernumber of deliveries (live births and stillbirths),expressed as a percentage. Quebec data wereunavailable for 2006-2007.
Chart 2.1
Chart 2.5
Chart 2.6
Chart 2.8
Chart 2.9
Chart 2.11
Chart 2.13The 2008 Commonwealth Fund InternationalHealth Policy Survey screened random samplesof adults aged 18+ years to identify those whorated their health as fair or poor or who had aserious illness or disability, major surgery orbeen hospitalized (for conditions other thanchildbirth) in the preceding two years. Fullsample sizes: Australia (750), Canada (2,635),France (1,202), Germany (1,201), Netherlands(1,000), New Zealand (751), United Kingdom(1,200) and United States (1,205). Interviews
217

were conducted by telephone between Marchand May 2008.
The 2007 Commonwealth Fund InternationalHealth Policy Survey was conducted by telephonein Australia (sample size 1,009), Canada(3,003), Germany (1,407), the Netherlands(1,557), New Zealand (1,000), United Kingdom(1,434) and United States (2,500). The surveyconsisted of interviews with representativesamples of adults aged 18+ years.
The 2005 Commonwealth Fund InternationalHealth Policy Survey of Sicker Adults surveyedadults with health problems in six countrieswho met at least one of four criteria: ratedtheir health as fair or poor; reported that theyhad a serious illness, injury, or disability thatrequired intensive medical care in the past twoyears; reported that in the past two years theyhad major surgery; or had been hospitalized inthe past two years. The sample size was 700-750adults in Australia, Canada and New Zealandand 1,500 or more in the United Kingdom,United States and Germany. Interviews wereconducted by telephone between March andMay 2005.
The 2004 Commonwealth Fund InternationalHealth Policy Survey focused on primary-careand ambulatory-care experiences. It consisted oftelephone interviews with random, representativesamples of people age 18+ years: Australia
(1,400), Canada (1,410), New Zealand (1,400),United Kingdom (3,061) and United States(1,401). Not all columns tally to 100 due torounding errors and missing responses.
Chart 2.2Data from CANSIM table 105-3024. Countsand percentages exclude non-responses. Dataare not age standardized. Canada total doesnot include Yukon, the Northwest Territoriesand Nunavut.
Chart 2.3Data from CANSIM table 105-3067. “Routineor ongoing care” refers to healthcare providedby a family or general physician, includingannual check up, blood tests or routine care foran on-going illness. Regular office hours are9:00 a.m. to 5:00 p.m. Monday to Friday;evenings are 5:00 p.m. to 9:00 p.m., Mondayto Friday; and weekends are Saturday andSunday from 9:00 a.m. to 9:00 p.m. Excludesnon-responses.
Chart 2.4
Chart 2.6
Chart 2.7
Chart 2.10
Chart 2.12Canadian Survey of Experiences with PrimaryHealth Care (CSE-PHC) was conducted with
Canadians aged 18+ years living in privatedwellings in the 10 provinces and the threeterritories. Persons living on Indian reserves orCrown lands, residents of institutions, full-timemembers of the Canadian Armed Forces andresidents of certain remote regions wereexcluded. The sample for this survey wasdrawn from the Canadian Community HealthSurvey (CCHS, record number 3226), Cycle 4.1,and consisted of 16,482 respondents. Theresponse rate was 71.0%. Further details at:http://www.statcan.gc.ca/cgi-bin/imdb/p2SV.pl?Function=getSurvey&SDDS=5138&lang=en&db=imdb&adm=8&dis=2
Chart 2.5See Chart 2.1
Chart 2.6See Chart 2.4
Chart 2.7See Chart 2.4
Chart 2.8See Chart 2.1The percentage of respondents who indicatedthat they had used the emergency departmentin the preceding two years (that is, the denom-inator for this indicator) was: Australia, 52%;Canada, 64%; France, 39%; Germany, 38%;Netherlands, 28%; New Zealand, 46%; U.K.41%; U.S. 58%.
218
Quality of Healthcare in Canada: A Chartbook

Chart 2.9See Chart 2.1
Chart 2.10See Chart 2.4
Chart 2.11See Chart 2.1
Chart 2.12See Chart 2.4
Chart 2.13See Chart 2.1
Chart 2.14Data from CANSIM table 105-3002. Waitingtimes for specialist visits is defined as timebetween when individuals and their doctordecided that they should see a specialist andwhen they actually visited the specialist. Based on household population aged 15+ years reporting waiting times for servicesaccessed in preceding 12 months. Data excludenon-responses.
Chart 2.15Adults aged 18+ years. Excludes emergencycases and elective partial hip replacements andhip/knee resurfacing techniques. Includes all
total hip and knee joint replacements (primaryand revision); bilateral joints count as a singlewait. See table for 50th and 90th percentile waits.
219
HIPS KNEES
50th percentile 90th percentile 50th percentile 90th percentile(days) (days) (days) (days)
NL
PEI 110 356 108 345
NS 201 642 213 647
NB 140 309 167 408
QC
ONT 63 180 71 223
MAN 110 245 121 312
SK 155 482 246 616
AB 103 255 123 299
BC 71 279 102 332For details on data definitions and differences in provincial datasets, see http://secure.cihi.ca/cihiweb/dispPage.jsp?cw_page=PG_2010_E&cw_topic=2010&cw_rel=AR_1909_E

Chart 2.16Adults aged 18+ years. Excludes emergencycases. For first eye only; bilateral cataractremoval counts as a single wait. See table for50th and 90th percentile waits.
CATARACTS 50th 90th
percentile percentile(days) (days)
NL
PEI 78 180
NS 54 199
NB 57 194
QC
ONT 44 123
MAN 75 151
SK 38 134
AB 70 199
BC 55 171
For details on data definitions and differencesin provincial datasets, seehttp://secure.cihi.ca/cihiweb/dispPage.jsp?cw_page=PG_2010_E&cw_topic=2010&cw_rel=AR_1909_E
Chart 2.17Adults aged 18+ years. All new cases. Excludes emergency cases. Includes palliativecare patients. See table for 50th and 90th
percentile waits.
RADIATION 50th 90th
THERAPY percentile percentile(days) (days)
NL
PEI 7 19
NS
NB
QC
ONT 11 29
MAN 5 23
SK 14 36
AB 21-42
BC 7
For details on data definitions and differencesin provincial datasets, seehttp://secure.cihi.ca/cihiweb/dispPage.jsp?cw_page=PG_2010_E&cw_topic=2010&cw_rel=AR_1909_E
Chart 2.18Adults aged 18+ years. Excludes emergencycases. Includes CABG with and without valve replacement. See table for 50th and 90th
percentile waits.
CABGs 50th 90th
percentile percentile(days) (days)
NL
PEI
NS
NB 4 135
QC
ONT 19 56
MAN 17 119
SK 4 73
AB 7 83
BC 43 109
For details on data definitions and differencesin provincial datasets, seehttp://secure.cihi.ca/cihiweb/dispPage.jsp?cw_page=PG_2010_E&cw_topic=2010&cw_rel=AR_1909_E
220
Quality of Healthcare in Canada: A Chartbook
Chart 2.19Data from CANSIM Table 105-3004. Waitingtimes for selected diagnostic tests is defined astime between when individuals and their doctordecided to go ahead with the test and the dayof the test. Based on household populationaged 15+ years reporting waiting times forservices accessed in preceding 12 months. Dataexclude non-responses.
Chart 3.1
Chart 3.2Total expenditure on health is defined as thesum of expenditure on activities that–throughthe application of medical, paramedical andnursing knowledge and technology–have thegoals of: promoting health and preventing disease; curing illness and reducing prematuremortality; caring for persons affected bychronic illness who require nursing care; caringfor persons with health-related impairments,disability and handicaps who require nursingcare; assisting patients to die with dignity;providing and administering public health;providing and administering health programs,health insurance and other funding arrangements. OECD countries have adopted the OECD’sSystem of Health Accounts (SHA) at varioustimes and have yet to restate their series for
earlier years. Thus, the data may not be considered comparable for the period identified.The data presented for these countries are considered to be in accordance with the SHAstarting in the following years: Australia,1998; Canada, 1975; France, 2003; UnitedStates, 1999. Sweden and the U.K. do not submit according to the SHA and thus are notconsidered strictly comparable to the othercountries in this list.
Chart 3.2See Chart 3.1
Chart 3.3The data are collected from diverse sources andinclude varying classes of financial information.The data are collected and classified accordingto methods established by a review committee.CIHI analysts and external experts continue toimprove the comprehensiveness, accuracy andcurrency of the data, in order to provide themost complete and objective estimates possible.Further details available at: http://secure.cihi.ca/cihiweb/products/nhex_2008_en.pdf
Chart 3.4Head count. Included: persons who have completed studies in medicine at universitylevel and who are licensed to practise; internsand resident physicians providing services
under the supervision of other physicians;salaried and self-employed physicians; foreignphysicians licensed to practise and activelypracticing in the country. Data from Australiaand Sweden 2005, other countries 2006.
Chart 3.5
Chart 3.7
Chart 3.9Physician counts reflect the summation of datafrom two distinct sources: the total of “active”physicians from Scott’s Medical Database andresident counts from the Canadian Post-M.D.Education Registry (CAPER). Data as ofDecember 31, 2006. Population estimates for 2006 from Statistics Canada.
Chart 3.6Based on head count. A general practitioner isa physician who does not limit his/her practiceto certain disease categories and assumes theresponsibility for the provision of continuingand comprehensive care or referring to anotherhealth professional. Data from Australia andSweden 2005, other countries 2006.
Chart 3.7See Chart 3.5
221

Chart 3.8Based on head count. A medical specialist is aphysician who diagnoses and treats physicaland mental disorders using specialist testing,diagnostic, medical and surgical techniques.He/she may limit his/her practice to certaindisease categories or methods of treatment.
Chart 3.9See Chart 3.5
Chart 3.10“Active registered dentists” represents licensedgeneral practice and certified specialist dentistsas reported by the Canadian Dental Association.Population estimates for 2006 from Statistics Canada.
Chart 3.11Based on head count. Included: persons whohave completed studies in nursing and who arelicensed to practice; salaried and self-employednurses; foreign nurses licensed to practise andactively practicing in the country. Data fromAustralia and Sweden 2005, other countries 2006.
Chart 3.12Employed, active registered nurses.
Chart 3.13Australia figures are for 2005; U.K. figures arean estimate.
Chart 3.14
Chart 3.16Includes medical imaging equipment in bothhospitals and freestanding facilities. IncludesCT scanners exclusively for cancer treatmentand for research. Includes MRI scanners usedexclusively for research. Number of scanners in Ontario and British Columbia is an estimate.
Chart 3.15U.K. data are an estimate
Chart 3.16See Chart 3.14
Chart 3.17
Chart 3.19The 2006 Commonwealth Fund InternationalHealth Policy Survey of Primary Care Physicianswas conducted by telephone and post betweenFebruary and July 2006. The sample coveredprimary-care physicians and the sample sizeswere as follows: Australia, 1,003; Canada, 578; Germany, 1,006; Netherlands, 931; New Zealand, 503; U.K, 1,063; U.S., 1,004.
Chart 3.18
Chart 3.20The National Physician Survey (NPS) is anongoing collaborative initiative led by the
College of Family Physicians of Canada theCanadian Medical Association and the RoyalCollege of Physicians and Surgeons of Canada.Every three years, all licensed practicing physicians (specialists and family doctors), second-year medical residents and medical students are invited to participate in a self-reported survey; responses are are completedeither on paper or electronically. In 2007, thetotal study group was 60,811; the sample sizewas 19,239 (response rate of 31.64%). Furtherdetails available at: http://www.nationalphysiciansurvey.ca/nps/2007_Survey/pdf/2007.NPS.Methodology.and.Generalizability.of.Results_FINAL.pdf
Chart 3.19See Chart 3.17
Chart 3.20See Chart 3.18
Chart 3.21
Chart 3.22Information from: retail sales of prescription-onlydrugs sold in Canada; IMS Health’s CompuScriptAudit; IMS Health’s Anonymous LongitudinalPatient Database. Linking the data from thesesources at the product level yielded province-specific estimates of number, size and cost ofprescriptions. Population estimates fromStatistics Canada.
222
Quality of Healthcare in Canada: A Chartbook

Chart 4.1 The chart presents the number of people whoreceive care or are exposed to risk per patientsafety event, with the exception of blood transfusion-related indicators, which present thenumber of blood transfusions per patient safetyevent. Sources: Gravel et al, 2007 Journal ofHospital Infection 66:243-48; Gravel et al (2007)American Journal of Infection Control 35:157-62;Discharge Abstract Database/Hospital MorbidityDatabase; Transfusion Transmitted InjuriesSurveillance System Program Report, PHAC, 2005.
Chart 4.2For further details, refer to the technical reportsat http://hospitalreport.ca/downloads/year.html
Chart 4.3The top five Beers drugs, by number of chronicusers, were similar between the four provincialpublic drug programs. Overall, the top five were: • Oral conjugated estrogens, used for hormone replacement
• Amitriptyline, an antidepressant • Digoxin, used to treat congestive heart failure • Oxybutynin, used to treat overactive bladders (incontinence)
• Temazepam, a benzodiazepine used to treatsleep disorders
Note that one-off prescriptions ranged from25.2% in Manitoba to 31.3% in New Brunswick
in 2005-2006. In all four provinces, the rate ofchronic use of Beers drugs was highest amongfemales and seniors aged 85 and older. Ratesare age- and sex-standardized using a directmethod of standardization based on theOctober1, 2006 Canadian senior population.For further details, see CIHI, (2007c).
Chart 4.4
Chart 4.16
Chart 4.17The 2008 Commonwealth Fund InternationalHealth Policy Survey screened random samplesof adults aged 18+ years to identify those whorated their health as fair or poor or who had aserious illness or disability, major surgery orbeen hospitalized (for conditions other thanchildbirth) in the preceding two years. Fullsample sizes: Australia (750), Canada (2,635),France (1,202), Germany (1,201), Netherlands(1,000), New Zealand (751), United Kingdom(1,200) and United States (1,205). Interviewswere conducted by telephone between Marchand May 2008.
The 2005 Commonwealth Fund InternationalHealth Policy Survey of Sicker Adults surveyedadults with health problems in six countrieswho met at least one of four criteria: ratedtheir health as fair or poor; reported that they
had a serious illness, injury, or disability thatrequired intensive medical care in the past twoyears; reported that in the past two years theyhad major surgery; or had been hospitalized in the past two years. The sample size was700-750 adults in Australia, Canada and NewZealand and 1,500 or more in the UnitedKingdom, United States and Germany.Interviews were conducted by telephonebetween March and May 2005.
The 2002 Commonwealth Fund InternationalHealth Policy Survey of Adults with HealthProblems conducted telephone interviews withadults who met at least one of the followingcriteria: Self-reported health status is fair orpoor; serious illness in the past two years; hospitalized or had major surgery in the pasttwo years. Sample size: Australia, 844; Canada,750; New Zealand, 750; United Kingdom, 750;United States, 755. Survey conducted March25-May 13, 2002.
Chart 4.5 Survey results are based on telephone interviewswith nationally representative samples of theCanadian public, doctors, nurses, pharmacistsand health administrators. Fielding of thequestionnaire was conducted between October3 and November 8, 2007. Sample Size 1,223.
223

Chart 4.6 Risk-adjusted rate of in-hospital hip fractureamong acute-care inpatients age 65+ years, per1,000 discharges. A logistic regression model isfitted with age, sex, whether a surgical procedurewas provided and the following pre-admissioncomorbid conditions: cancer, seizure, syncope,stroke, coma, cardiac arrest, anoxic braininjury, poisoning, delirium and other psychosis,trauma and musculoskeletal/connective tissuedisorder (MCC-8) as independent variables. Co-efficients derived from the logistic modelare used to calculate the probability of in-hospital hip fracture for each case (episode).The expected number of in-hospital hip fracturesof a region is the sum of these case probabilitiesfor that region. The risk-adjusted in-hospital hipfracture rate (RAR) is calculated by dividingthe observed number of in-hospital hip fracturesof each region by the expected number of in-hospital hip fractures of the region andmultiplying by the Canadian average rate.Further details at: http://secure.cihi.ca/cihiweb/dispPage.jsp?cw_page=indicators_def_health_system_08_e#2_3
Chart 4.7 From the directory of the Canadian NeurosurgicalSociety and the Royal College of Physiciansand Surgeon, 194 neurosurgeons were identified.Ten were ineligible because they were residents,fellows or not in active practice. Sample size138 neurosurgeons (68% response rate).
Chart 4.8Secondary analysis of pre-existing studies. Fordetails see Muscedere et al, 2007.
Chart 4.9Canada rates exclude Quebec.
Chart 4.10
Chart 4.11Healthcare-associated MRSA case includes allnewly identified MRSA isolates that wereacquired in the participating CNISP hospitals.Note the CNISP Report also provides data onoverall incidence rates (which are considerablyhigher than the healthcare-associated rates).Overall rates include community-associatedinfections. These were not reported in the charts, as they reflect factors outside the immediate control of safety system and healthcare organizations.
Chart 4.12Prospective surveillance for Clostridium difficile-associated diarrhea (CDAD) was conducted among patients hospitalized inCanadian acute-care hospitals participating in CNISP between November 1, 2004 and April 30, 2005. A total of 34 hospitals participatedin the surveillance activity including one non-CHEC hospital from Ontario. (This indicateshospitals affiliated with the CNISP.) Of these,16 hospitals admitted pediatric patients under
the age of 18 years. All hospitalized patientsone year of age and older meeting the casedefinition for CDAD were eligible for enrollment.Both community-acquired (CA-CDAD) andhealthcare-associated (HA-CDAD) cases wereincluded. The following case definition wasutilized for CDAD: 1) either diarrhea for morethan two days; or fever, abdominal pain and/orileuses with laboratory confirmation of a positivetoxin assay for C. difficile; or 2) diagnosis ofpseudomembranous colitis on colonoscopy orhistological/pathological diagnosis of CDAD.The infection was considered healthcare-associated if the patient’s symptoms occurredat least 72 hours after admission or symptomsresulted in re-admission of a patient who hadbeen hospitalized within the previous twomonths of the current admission date, and who was not a resident in a chronic-care facilityor nursing home. Patients who met the casedefinition for CDAD but did not meet the surveillance definition for healthcare-associatedCDAD were considered to have acquired CDADin the community. Incidence and rates of CDADwere calculated by province or region usingpatient admissions and patient-days fordenominator. Further details available at:http://www.phac-aspc.gc.ca/nois-sinp/pdf/c-difficile_cnisp-pcsin-eng.pdf
Chart 4.13 The 2006 Commonwealth Fund InternationalHealth Policy Survey of Primary Care Physicians
224
Quality of Healthcare in Canada: A Chartbook
was conducted by telephone and post betweenFebruary and July 2006. The sample coveredprimary-care physicians and the sample sizeswere as follows: Australia, 1,003; Canada, 578; Germany, 1,006; Netherlands, 931; New Zealand, 503; U.K., 1,063; U.S., 1,004.
Chart 4.14
Chart 4.15The SIC survey is an online survey completedby hospital management staff as part of theHospital Report: Acute Care project. The 2008SIC was completed by 103 of 123 acute carehospitals in Ontario (84% participation rate).Questions regarding the provision of feedback tofront-line staff and the presence of designatedsafety officers were included in the 2008 SICsurvey but the results were not reported in the2008 CIHI Patient Safety analysis in brief.
Chart 4.16 See Chart 4.4
Chart 4.17 See Chart 4.4
Chart 5.1
Chart 5.2
Chart 5.3
Chart 5.6
Chart 5.8
Chart 5.9
Chart 5.11The 2008 Commonwealth Fund InternationalHealth Policy Survey screened random samplesof adults aged 18+ years to identify those whorated their health as fair or poor; reported thatthey had a serious illness, injury, or disabilitythat required intensive medical care in the pasttwo years; reported that in the past two yearsthey had major surgery; or had been hospitalizedin the past two years. Full sample sizes:Australia (750), Canada (2,635), France (1,202),Germany (1,201), Netherlands (1,000), NewZealand (751), United Kingdom (1,200) andUnited States (1,205). Interviews were conductedby telephone between March and May 2008.The 2005 Commonwealth Fund InternationalHealth Policy Survey of Sicker Adults surveyedadults with health problems in six countrieswho met at least one of four criteria: ratedtheir health as fair or poor; reported that theyhad a serious illness, injury, or disability thatrequired intensive medical care in the past twoyears; or reported that in the past two yearsthey had major surgery or had been hospitalized.The sample size was 700-750 adults in Australia,Canada and New Zealand and 1,500 or more inthe United Kingdom, United States and Germany.
Interviews were conducted by telephone betweenMarch and May 2005.
Chart 5.2See Chart 5.1
Chart 5.3See Chart 5.1
Chart 5.4
Chart 5.7
Chart 5.10
Chart 5.12Canadian Survey of Experiences with PrimaryHealth Care (CSE-PHC) was conducted withCanadians aged 18+ years living in privatedwellings in the 10 provinces and the threeterritories. Persons living on Indian reserves orCrown lands, residents of institutions, full-timemembers of the Canadian Armed Forces andresidents of certain remote regions wereexcluded. The sample for this survey wasdrawn from the Canadian Community HealthSurvey (CCHS, record number 3226), Cycle 4.1,and consisted of 16,482 respondents. Theresponse rate was 71.0%. Further details at:http://www.statcan.gc.ca/cgi-bin/imdb/p2SV.pl?Function=getSurvey&SDDS=5138&lang=en&db=imdb&adm=8&dis=2
225

Chart 5.5
Chart 5.6See Chart 5.1
Chart 5.7See Chart 5.4
Chart 5.8See Chart 5.1
Chart 5.9See Chart 5.1
Chart 5.10See Chart 5.4
Chart 5.11See Chart 5.1
Chart 5.12See Chart 5.4
Chart 6.1Mortality was tracked for more than a decadeamong a 15% sample of the adult populationof Canada (approx 2.7 million) who completedthe 1991 census long-form questionnaire.During the follow-up period (June 4, 1991 to December 31, 2001), there were more than260,000 deaths in the sample. For furtherdetails see Wilkins et al., 2008.
Chart 6.2 Details athttp://www4.hrsdc.gc.ca/[email protected]?iid=3#M_3
Chart 6.3See Chart 6.1
Chart 6.4
Chart 6.8
Chart 6.9
Chart 6.11
Chart 6.13
Chart 6.14Analysis by the Manitoba Centre for HealthPolicy using the following database files: • Hospital claims (records of hospital admissions) • Medical claims (records of visits to physicians
outside of those by a hospital in-patient) • Physician files to identify the type of provider
(e.g. general practitioner versus specialist)• Home care (records of the use of provincial
home care services) • Long-term care, primarily in personal-care
homes (nursing homes) • The registry files (records of the time a person
is registered as a resident of Manitoba, aswell as their age, sex and area of residence)
• Vital statistics (records of births and deaths) • Pharmaceutical claims (pharmaceutical use
from the Drug Program Information Network)
• Manitoba Immunization Monitoring System(MIMS) (for rates of childhood and adultimmunizations)
• 2001 public-use census files (for neighbourhood-level socio-economic information)
For further details, see: http://mchp-appserv.cpe.umanitoba.ca/reference/sexdiff.pdf
Chart 6.5
Chart 6.6The 2008 Commonwealth Fund InternationalHealth Policy Survey screened random samplesof adults aged 18+ years to identify those whorated their health as fair or poor or who had aserious illness or disability, major surgery orbeen hospitalized (for conditions other thanchildbirth) in the preceding two years. Fullsample sizes: �Australia (750), Canada (2,635),France (1,202), Germany (1,201), Netherlands(1,000), New Zealand (751), United Kingdom(1,200) and United States (1,205). Interviewswere conducted by telephone between Marchand May 2008.
Chart 6.6See Chart 6.5
Chart 6.7
Chart 6.8See Chart 6.4
226
Quality of Healthcare in Canada: A Chartbook

Chart 6.9See Chart 6.4
Chart 6.10Based on CCHS 2005, population aged 12+years living in private households. For the diabetes module, sample size=3,924. Furtherdetails at: http://www.statcan.gc.ca/pub/82-003-x/2008003/article/10663-eng.pdf
Chart 6.11See Chart 6.4
Chart 6.12See http://secure.cihi.ca/cihiweb/en/downloads/Reducing_Gaps_in_Health_Report_EN_081009_3.pdf
Chart 6.13See Chart 6.4
Chart 6.14See Chart 6.4
Chart 6.15Computerized laboratory data from six of thenine geographically defined health regions inAlberta covering more than 8% of the region’spopulation. Includes residents aged 20+ yearswho had 1 or more serum creatinine levelmade during July 1, 2003-June 30, 2004.Excluded kidney transplant recipients. For further details, see Gao et al., 2008.
Chart 6.16Data drawn from the Saskatchewan DiabetesDatabase (SDD) and includes those who had atleast one HbA1c test done (or one LDL cholesterolmeasurement) in the measurement year. Labrecords with missing test data were excluded.For further details see: http://www.hqc.sk.ca/download.jsp?2z6ed94Gr0iMC4qBWunaBDBIzBf0QfLQkUwK4QBZaJukPeUN9CnxMA==
227

ACLS Advanced cardiac life support
ACSC Ambulatory care sensitive conditions
AHRQ Agency for Healthcare Research and Quality
AMI Acute myocardial infarction
ASMR Age-standardized mortality rate
CA Community-acquired
CABG Coronary artery bypass graft
CAEP Canadian Association of Emergency Physicians
CAPER Canadian Post-M.D. Education Registry
CCHS Canadian Community Health Survey
CDA Canadian Diabetes Association
CDAD Clostridium difficile-associated diarrhea
CDS Canadian Diabetes Strategy
CHD Coronary heart disease
CIHI Canadian Institute for Health Information
CNISP Canadian Nosocomial InfectionSurveillance Program
COPD Chronic obstructive pulmonary disease
CPHI Canadian Population Health Initiative
CPR Cardiopulmonary resuscitation
CPSI Canadian Patient Safety Institute
CSE-PHC Canadian Survey of Experiences withPrimary Health Care
CT Computerized tomography
CTAS Canadian Triage and Acuity Scale
CVD Cerebrovascular disease
DAD Discharge abstract database
DTN Door to needle
EARSS European Antimicrobial ResistanceSurveillance System
ED Emergency department
EHR Electronic health record
EPR Electronic patient record
FOBT Fecal occult blood test
GDP Gross domestic product
HA Healthcare-associated
HAI Healthcare-associated infection
HIT Health information technology
HPV Human papillomavirus
HSPRN Health System Performance Research Network
IAPO International Alliance of Patients’ Organizations
ICD International Classification of Diseases
ICES Institute for Clinical Evaluative Sciences
ICU Intensive care unit
IHD Ischemic heart disease
LDL Low-density lipoprotein
ME Medication error
MIMS Manitoba Immunization Monitoring System
MRSA Methicillin-resistant Staphylococcus aureus
NACRS National Ambulatory Care Reporting System
NCQA National Committee for Quality Assurance
NPS National Physician Survey
OECD Organisation for Economic Co-operationand Development
PHAC Public Health Agency of Canada
PMR Premature mortality rate
PPP Purchase price parity
PROM Patient-reported outcome measure
PSA Prostate-specific antigen
PYLL Potential years of life lost
RAR Risk-adjusted rate
RSR Relative survival ratio
rTPA Recombinant tissue plasminogen activator
SES Socio-economic status
SHA System of Health Accounts
SIC System Integration and Change survey(Ontario)
TIA Transient ischemic attack
UK United Kingdom
US United States
UTI Urinary tract infection
VAP Ventilator-associated pneumonia
WHO World Health Organization
228Quality of Healthcare in Canada: A Chartbook
ACRONYMS

Agency for Healthcare Research and Quality[AHRQ] (2007) National Healthcare Quality and Disparities Report. Available online at:http://www.ahrq.gov/qual/qrdr07.htm[last accessed May 22, 2009]
Atzema C, Austin P, Tu J, Schull M. (2009)Emergency department triage of acute myocardial infarction patients and the effecton outcomes. Ann Emerg Med. 53 (6): 736-45
Australian Council for Safety and Quality inHealth Care (2004) Charting the Safety andQuality of Health Care in Australia Availableonline at: http://www.health.gov.au/internet/safety/publishing.nsf/Content/F3D3F3274D393DFCCA257483000D8461/$File/finlchrtbk16305.pdf[last accessed May 22, 2009]
Baker GR, et al. (2004) The Canadian AdverseEvents Study: the incidence of adverse eventsamong hospital patients in Canada. CMAJ 170(11):1678-1686
Boudreau R et al. (2004) Improving the timelinessof written patient notification of mammographyresults by mammography centers. Breast J. 10(1):10-19
Brennan T, Leape L, Laird N, et al. (1991)Incidence of adverse events and negligence inhospitalized patients. NEJM 324 (6): 370-7
Brook R et al. (1986) A method for the detailedassessment of the appropriateness of medicaltechnologies. International Journal of TechnologyAssessment in Health Care 2(1): 53-63
Canada Health Infoway (2008) Annual Report2007-08. Available online at: http://www2.infoway-inforoute.ca/Documents/Infoway_Annual _Report_2007-2008_Eng.pdf[last accessed May 22, 2009]
Canadian Association of Emergency Physicians(2005) Taking Action on the Issue of Overcrowdingin Canada’s Emergency Departments. Availableonline at: http://www.waittimealliance.ca/waittimes/CAEP.pdf [last accessed May 22, 2009]
Canadian Cancer Society (2009) CanadianCancer Statistics 2009. Available online at:http://www.cancer.ca/Canada-wide/About%20cancer/Cancer%20statistics/Canadian%20Cancer%20Statistics.aspx?sc_lang=en[last accessed May 22, 2009]
Canadian Dental Association (online) DentalHealth Services in Canada in 2007. Availableonline at: http://www.cda-adc.ca/_files/cda/news_events/health_statistics/dhsc2007.pdf[last accessed May 22, 2009]
Canadian Diabetes Association (2008) ClinicalPractice Guidelines. Available online at:http://www.diabetes.ca/files/for-professionals/CPGExecSummaryEssentials.pdf andhttp://www.diabetes.ca/files/cpg2008/cpg-2008.pdf[last accessed May 22, 2009]
Canadian EMR (online). Available online at:http://www.canadianemr.ca/
Canadian Stroke Strategy (online). Availableonline at: http://www.canadianstrokestrategy.ca/eng/resourcestools/monitor&eval.html[last accessed May 22, 2009]
Carstairs V, Morris R. (1991) Deprivation andHealth in Scotland. Aberdeen, Scotland:Aberdeen University Press, 1991
229
REFERENCES
Centre for Spatial Economics (2008) The economiccost of wait times in Canada. Available online at:http://www.cma.ca/multimedia/CMA/Content_Images/Inside_cma/Media_Release/pdf/2008/EconomicReport.pdf[last accessed May 22, 2009]
Chaudhry B et al. (2006) Systematic review:impact of health information technology onquality, efficiency, and costs of medical care.Ann Intern Med. 144(10):742-52.
Chief Public Health Officer (2008) Annualreport. Available online at: http://www.phac-aspc.gc.ca/publicat/2008/cphorsphc-respcacsp/index-eng.php [last accessed May 22, 2009]
CIHI (2001) Hospital Morbidity Database TabularReports 2000/2001. Available online at:http://secure.cihi.ca/cihiweb/products/HospitalMorbidityTabularReports2000-2001.pdf[last accessed May 22, 2009]
CIHI (2002) Returning to Hospital: Readmissionrates across Canada. Available online at:http://secure.cihi.ca/cihiweb/dispPage.jsp?cw_page=media_29may2002_b3_e[last accessed May 22, 2009]
CIHI (2005) Medication Incident Reporting andPrevention Systems: Environmental scan.Available online at: http://secure.cihi.ca/cihiweb/en/downloads/CMIRPS_Environ_Scan_FINAL1.pdf[last accessed May 22, 2009]
CIHI (2007) Medical Imaging in Canada.Available online at: http://secure.cihi.ca/cihiweb/products/MIT_2007_e.pdf[last accessed May 22, 2009]
CIHI (2007b) Patient Safety in Canada: An update.Available online at: http://www.cihi.ca/cihiweb/en/downloads/Patient_Safety_AIB_EN_070814.pdf[last accessed 22 May 2009]
CIHI (2007c) Drug Claims by Seniors: Ananalysis focusing on potentially inappropriatemedication use, 2000 – 2006. Availableonline at: http://secure.cihi.ca/cihiweb/products/Potentially_Inappropriate_Medications_EN.pdf[last accessed May 22, 2009]
CIHI (2007d) Survey: Priority Areas for Wait Time Reduction: What We Know andWhat We Don’t Know Available online at:http://www.longwoods.com/product.php?productid=18921 [last accessed May 22, 2009]
CIHI (2008) Health Indicators, 2008 Availableonline at: http://secure.cihi.ca/cihiweb/dispPage.jsp?cw_page=PG_1350_E&cw_topic=1350&cw_rel=AR_152_E [last accessed 22 May 2009]
CIHI (2008b) Health Care in Canada 2008.Available online at: http://secure.cihi.ca/cihiweb/dispPage.jsp?cw_page=PG_1472_E&cw_topic=1472&cw_rel=AR_43_E [last accessed 22 May 2009]
CIHI (2008c) Hospital Mental Health Servicesin Canada, 2005-2006. Available online at:http://secure.cihi.ca/cihiweb/products/Hmhdb_annual_report_2008_e.pdf[last accessed May 22, 2009]
CIHI (2008d) Wait Times Tables – A Comparisonby Province, 2008. Available online at:http://secure.cihi.ca/cihiweb/products/Final_Wait_Times_AIB_EN_080229.pdf[last accessed May 22, 2009]
CIHI (2008e) National Health ExpenditureTrends, 1975-2008. Available online at:http://secure.cihi.ca/cihiweb/products/nhex_2008_en.pdf [last accessed May 22, 2009]
CIHI (2008f) Canada’s Health Care Providers,1997 to 2006: A Reference Guide. Availableonline at: http://secure.cihi.ca/cihiweb/products/HealthCareProv_RefGuideENweb.pdf[last accessed May 22, 2009]
CIHI (2008g) Patient Safety in Ontario AcuteCare Hospitals: A Snapshot of Hospital-AcquiredInfection Control Practices, 2008. Availableonline at: http://secure.cihi.ca/cihiweb/products/PSAF_AIB_2008_10_23_e.pdf[last accessed May 22, 2009]
230
Quality of Healthcare in Canada: A Chartbook

CIHI (2008h) Primary Health Care (PHC)Indicators Chartbook: An Illustrative Exampleof Using PHC Data for Indicator ReportingAvailable online at: http://secure.cihi.ca/cihiweb/dispPage.jsp?cw_page=PG_1650_E&cw_topic=1650&cw_rel=AR_2490_E
CIHI (2009) Wait Times Tables – A Comparisonby Province, 2009. Available online at:http://secure.cihi.ca/cihiweb/dispPage.jsp?cw_page=PG_2010_E&cw_topic=2010&cw_rel=AR_1909_E [last accessed May 22, 2009]
Clinical Excellence Commission (2008) Qualityof Healthcare in NSW: a chartbook. Availableonline at: http://www.cec.health.nsw.gov.au/moreinfo/chartbook.html[last accessed May 22, 2009]
CNISP (2007) Clostridium difficile AssociatedDiarrhea in Acute-Care Hospitals Participatingin CNISP: November 1, 2004 to April 30, 2005.Available online at: http://www.phac-aspc.gc.ca/nois-sinp/pdf/c-difficile_cnisp-pcsin-eng.pdf[last accessed May 22, 2009]
CNISP (2008) Surveillance for Methicillin-resistant Staphylococcus aureus (MRSA) inPatients Hospitalized in Canadian Acute-CareHospitals Participating in CNISP 2006-2007Preliminary Results. Available online at:http://www.phac-aspc.gc.ca/nois-sinp/reports-rapport/mrsa-sarm_result-eng.php[last accessed May 22, 2009]
Coleman et al. (2008) Cancer survival in fivecontinents: a worldwide population-basedstudy (CONCORD). Lancet Oncol 9: 730-56
Commonwealth Fund (2004) InternationalHealth Policy Survey of Adults’ Experienceswith Primary Care. Available online at:http://www.commonwealthfund.org/Content/Surveys/2004/2004-Commonwealth-Fund-International-Health-Policy-Survey-of-Adults-Experiences-with-Primary-Care.aspx[last accessed May 22, 2009]
Commonwealth Fund (2005) InternationalHealth Policy Survey of Sicker Adults. Availableonline at: http://www.commonwealthfund.org/Content/Surveys/2005/2005-Commonwealth-Fund-International-Health-Policy-Survey-of-Sicker-Adults.aspx [last accessed May 22, 2009]
Commonwealth Fund (2007) International HealthPolicy Survey in Seven Countries. Availableonline at: http://www.commonwealthfund.org/Content/Surveys/2007/2007-International-Health-Policy-Survey-in-Seven-Countries.aspx[last accessed May 22, 2009]
Commonwealth Fund (2008) International HealthPolicy Survey of Sicker Adults. Availableonline at: http://www.commonwealthfund.org/Content/Surveys/2008/2008-Commonwealth-Fund-International-Health-Policy-Survey-of-Sicker-Adults.aspx [last accessed May 22, 2009]
Conference Board of Canada (online) Mortalitydue to circulatory disease. Available online at:http://www.conferenceboard.ca/HCP/Details/Health/mortality-circulatory-diseases.aspx#context[last accessed May 22, 2009]
Conference Board of Canada (online b)Mortality Due Mental Disorders. Availableonline at: http://www.conferenceboard.ca/HCP/Details/Health/mortality-mental-disorders.aspx[last accessed May 22, 2009]
Coulter A and Ellis J. (2006) Patient-focusedinterventions: A review of the evidence.London: The Health Foundation
231

CPSI (online) Overview. Available online at:http://www.patientsafetyinstitute.ca/English/About/overview/Pages/default.aspx[last accessed May 22, 2009]
Davis K, Schoen C, Schoenbaum S et al. (2007)Mirror, mirror on the wall: An internationalupdate on the comparative performance ofAmerican health care. Commonwealth Fund,New York
DCCT (Diabetes Control and ComplicationsTrial Research Group (1993) The effect ofintensive treatment of diabetes on the development and progression of long-termcomplications in insulin-dependent diabetesmellitus. New England Journal of Medicine329: 977-86
Department of Health (2009) Guidance on theroutine collection of Patient Reported OutcomeMeasures (PROMs) Available online at:http://www.dh.gov.uk/en/Publicationsandstatistics/Publications/PublicationsPolicyAndGuidance/DH_092647 [last accessed May 22, 2009]
EARSS (2007) Annual Report. Available onlineat: http://www.rivm.nl/earss/Images/EARSS%202007_FINAL_tcm61-55933.pdf[last accessed May 22, 2009]
Evans R and McGrail K. (2008). Richard III,Barer-Stoddart and the Daughter of Time.Healthcare Policy 3(3): 18-28
Eyles J and Birch S. (1993) A population needs-based approach to health-care resourceallocation and planning in Ontario: A linkbetween policy goals and practice? Can J Public Health 84:112-117
Eyles J, Birch S, Chambers S, Hurley J,Hutchison B. (1991) A needs-based methodologyfor allocating health care resources in Ontario,Canada: Development and an application. Soc Sci Med 33:489-500
Fitch K et al. (2001) The RAND/UCLAAppropriateness Method Users’ Manual.Available online at: http://www.rand.org/pubs/monograph_reports/MR1269/[last accessed May 22, 2009]
Flood CM and Archibald T. (2001) The illegality of private health care in Canada.Canadian Medical Association Journal; 164(6):825-830. Available online at:http://www.cmaj.ca/cgi/reprint/164/6/825[last accessed May 22, 2009]
Fransoo R et al. (2005) Sex Differences inHealth Status, Health Care Use and Quality ofCare: A Population-Based Analysis forManitoba’s Regional Health Authorities.Available online at: http://mchp-appserv.cpe.umanitoba.ca/reference/sexdiff.pdf[last accessed May 22, 2009]
Gao S, Manns B, Culleton B et al. (2008)Access to health care among status Aboriginal people with chronic kidney disease.CMAJ 179(10): 1007-12
Government of Canada (2006) The Human Faceof Mental Health and Mental Illness in Canada.Available online at: http://www.phac-aspc.gc.ca/publicat/human-humain06/pdf/human_face_e.pdf[last accessed May 22, 2009]
Grol R, Wensing M, Mainz J et al. (1999)Patients’ priorities with respect to general practice care: an international comparison.Family Practice 16: 4-11
Hardcastle J et al. (1996) Randomised controlledtrial of faecal-occult blood screening for colorectal cancer. Lancet 348:1472-7
Health Canada (1998) Economic Burden ofIllness in Canada. Available online at:http://www.phac-aspc.gc.ca/publicat/ebic-femc98/index-eng.php [last accessed May 22, 2009]
232
Quality of Healthcare in Canada: A Chartbook

Health Canada (2003) A statistical profile ofFirst Nations in Canada for the year 2000
Health Canada (2004) A Ten Year Plan toStrengthen Health Care. Available online at:http://www.hc-sc.gc.ca/hcs-sss/delivery-prestation/fptcollab/2004-fmm-rpm/nr-cp_9_16_2-eng.php[last accessed May 22, 2009]
Health Canada (2005) Canada’s Health CareSystem. Available online at: http://www.hc-sc.gc.ca/hcs-sss/alt_formats/hpb-dgps/pdf/pubs/2005-hcs-sss/2005-hcs-sss_e.pdf[last accessed May 22, 2009]
Health Canada (2008) Canada Health ActAnnual Report 2007-8 Available online at:http://www.hc-sc.gc.ca/hcs-sss/pubs/cha-lcs/2008-cha-lcs-ar-ra/index-eng.php[last accessed May 22, 2009]
Health Canada (2009) A Statistical Profile ofFirst Nations in Canada: Determinants ofHealth 1999 – 2003 Available online at:http://www.hc-sc.gc.ca/fniah-spnia/pubs/aborig-autoch/2009-stats-profil/index-eng.php[last accessed May 22, 2009]
Health Canada (online) First Nations, Inuit andAboriginal Health – Suicide Prevention.Available online at: http://www.hc-sc.gc.ca/fniah-spnia/promotion/suicide/index-eng.php[last accessed May 22, 2009]
Health Canada (online b) Influenza. Availableonline at: http://www.hc-sc.gc.ca/hl-vs/iyh-vsv/diseases-maladies/flu-grippe-eng.php[last accessed May 22, 2009]
Health Canada (online c) Primary Health Careand Health System Renewal. Available onlineat: http://www.hc-sc.gc.ca/hcs-sss/prim/renew-renouv-eng.php [last accessed May 22, 2009]
Health Canada (online d) A 10-Year Plan toStrengthen Health Care. Available online at:http://www.hc-sc.gc.ca/hcs-sss/delivery-prestation/fptcollab/2004-fmm-rpm/index-eng.php[last accessed May 22, 2009]
Health Care in Canada (2007) Survey. Availableonline at: http://www.hcic-sssc.ca/index_e.asp[last accessed May 22, 2009]
Health Council of Canada (2008) Fixing theFoundation: An Update on Primary HealthCare and Home Care Renewal in Canada.Available online at: http://healthcouncilcanada.ca/docs/rpts/2008/phc/HCC_PHC_Main_web_E.pdf[last accessed May 22, 2009]
Health Council of Canada (2008) CanadianSurvey of Experiences with Primary HealthCare in 2007. Available online at:http://www.healthcouncilcanada.ca/docs/rpts/2008/phc/HCC%20PHC_Supplement_ENG%20FA_WEB.pdf [last accessed May 22, 2009]
Health Council of Canada (2009) A StatusReport of The National Pharmaceuticals Strategy.Available online at: http://www.healthcouncilcanada.ca/docs/rpts/2009/HCC_NPS_StatusReport_web.pdf [last accessed May 22, 2009]
Health Quality Council Saskatchewan (2008)Quality Insight report. Available online at:http://www.hqc.sk.ca/portal.jsp?Gy/R9/4fEXtjGGxUa5nZszBIzBf0QfLQkUwK4QBZaJsWHawXTufIaFVvI5thiwzu [last accessed May 22, 2009]
Heart and Stroke Foundation (online) Statistics.Available online at: http://www.heartandstroke.com/site/c.ikIQLcMWJtE/b.3483991/k.34A8/Statistics.htm [last accessed May 22, 2009]
Heart and Stroke Foundation (online b) ReportCards on Health. Available online at:http://www.heartandstroke.com/site/apps/nlnet/content2.aspx?c=ikIQLcMWJtE&b=4955951&ct=5591565 [last accessed May 22, 2009]
233

Hospital Report Research Collaborative (2008)Hospital performance results: 2008, Acute Care.Available online at: http://www.hospitalreport.ca/downloads/2008/acute_2008.html[last accessed May 22, 2009]
IAPO (2006) Perceptions of Healthcare, Canada.Available online at: http://www.patientsorganizations.org/attach.pl/770/388/IAPO%20Report%20Canada.pdf[last accessed May 22, 2009]
Institute for Clinical Evaluative Science (2009)Registry of the Canadian Stroke Network:Report on the 2004/05 Ontario Stroke Audit.Available online at: http://www.ices.on.ca/file/RCSN_2004-05%20Ontario%20Stroke%20Audit%20Report_Final_April%2006.pdf[last accessed May 22, 2009]
Institute of Medicine (2001) Crossing the QualityChasm: A new health system for the 21st century.Washington DC: National Academy Press
Jhawar B, Mitsis D and Duggal N. (2007)Wrong-sided and wrong-level neurosurgery: anational survey. J Neurosurg Spine7: 467-472
Lemstra M and Neudorf C. (2008) HealthDisparity in Saskatoon. Available online at:http://www.saskatoonhealthregion.ca/your_health/documents/PHO/HealthDisparityExecSummary.pdf[last accessed May 22, 2009]
Kim T, Oh P, and Simor A. (2001) The economicimpact of methicillin-resistant Staphylococcusaureus in Canadian hospitals. Infection Controland Hospital Epidemiology 22(2): 99-104
Leatherman S and McCarthy D. (2002) Qualityof Health Care in the United States: A chartbook.New York: The Commonwealth Fund
Leatherman S and Sutherland K. (2003) TheQuest for Quality in the NHS: A mid-termevaluation of the ten-year quality agenda.London: TSO (The Stationery Office)
Leatherman S and Sutherland K. (2005) TheQuest for Quality in the NHS: A chartbook onquality of care in the UK. Oxford: Radcliffe
Leatherman S, Sutherland K and Airoldi M. (2008)Bridging the Quality Gap: Stroke. London: The Health Foundation
Leatherman S and Sutherland K. (2008) TheQuest for Quality: refining the NHS reforms.London: Nuffield Trust
Leddy K et al. (2003). Timeliness in ambulatorycare treatment. An examination of patient satisfaction and wait times in medical practicesand outpatient test and treatment facilities. J Ambul Care Manage. 26(2): 138-49
Lindsay P et al. (2008) Canadian best practicerecommendations for stroke care. CMAJ 179(12):S1-S25. Available online at: http://www.cmaj.ca/cgi/reprint/179/12/S1[last accessed May 22, 2009]
Mandel J et al. (1993) Reducing mortality fromcolorectal cancer by screening for fecal occultblood. Minnesota Colon Cancer Control Study.N Engl J Med 328:672
Mandel J et al. (1999). Colorectal cancer mortality: effectiveness of biennial screeningfor fecal occult blood. Journal of the NationalCancer Institute 91:434-37
Manton K. (1991) The dynamics of populationaging: Demography and policy analysis.Milbank Mem Fund Q 69(2):309-340
Muscedere J, Martin C and Heyland D. (2008)The impact of ventilator-associated pneumoniaon the Canadian health care system. Journal ofCritical Care 23: 5-10
National Centre for Health Outcomes Development(2005) Patient Involvement and Collaborationin Shared Decision-making: a StructuredReview to inform Chronic Disease Management.Available online at: http://phi.uhce.ox.ac.uk/pdf/phig_patient_involvement_summary.pdf[last accessed May 22, 2009]
234
Quality of Healthcare in Canada: A Chartbook

National Committee for Quality Assurance(2006) The State of Health Care Quality.Available online at: http://www.ncqa.org/tabid/836/Default.aspx [last accessed May 22, 2009]
National Institute for Health and ClinicalExcellence (2007) Secondary prevention in primary and secondary care for patients following a myocardial infarction. Availableonline at: http://guidance.nice.org.uk/CG48[last accessed May 22, 2009]
National Physician Survey (2007) Availableonline at: http://www.nationalphysiciansurvey.ca/nps/2007_Survey/Results/physician2_can-e.asp[last accessed May 22, 2009]
NHS Information Centre (online) NHSImmunisation Statistics, 2007-08. Availableonline at: http://www.ic.nhs.uk/statistics-and-data-collections/health-and-lifestyles/immunisation/nhs-immunisation-statistics-england-2007-08-%5Bns%5D [last accessed May 22, 2009]
Nolte E and McKee M. (2004) Does HealthcareSave Lives? Avoidable mortality revisited.London: Nuffield Trust. Available online at:http://www.nuffieldtrust.org.uk/ecomm/files/21404avoidablemortality2.pdf[last accessed May 22, 2009]
Nolte E and McKee M. (2008) Measuring thehealth of nations: updating an earlier analysis.Health Affairs 27 (1): 58-71
O’Donnell D et al. (2007) Canadian ThoracicSociety recommendations for management ofchronic obstructive pulmonary disease – 2007update. Can Respir J ;14(Suppl B):5B-32B
Organisation for Economic Cooperation andDevelopment [OECD] (2002) Measuring Up:Improving health system performance in OECDcountries. Paris: OECD
Organisation for Economic Cooperation andDevelopment [OECD] (2008) OECD Health Data2008: Statistics and indicators for 30 countries.Paris: OECD
Park R et al. (1986) Physician ratings of appropriate indications for six medical andsurgical procedures. American Journal ofPublic Health. 76 (7): 766-772
Public Health Agency of Canada/Health Canada(1998) Economic Burden of Illness in Canada.Available online at: http://www.phac-aspc.gc.ca/publicat/ebic-femc98/index-eng.php[last accessed May 22, 2009]
Public Health Agency of Canada (2007) Lifeand Breath: Respiratory Disease in Canada.Available online at: http://www.phac-aspc.gc.ca/cd-mc/crd-mrc/index-eng.php[last accessed May 22, 2009]
Public Health Agency of Canada (2008)Canadian Perinatal Health Report. Availableonline at: http://www.phac-aspc.gc.ca/publicat/2008/cphr-rspc/pdf/cphr-rspc08-eng.pdf[last accessed May 22, 2009]
Public Health Agency of Canada (2008b)Report on Public State of Canada. Availableonline at: http://www.phac-aspc.gc.ca/publicat/2008/cphorsphc-respcacsp/index-eng.php[last accessed May 22, 2009]
Public Health Agency of Canada (online) Diabetes.Available online at: http://www.phac-aspc.gc.ca/cd-mc/diabetes-diabete/index-eng.php[last accessed May 22, 2009]
Reason J. (1997) Managing the Risks ofOrganizational Accidents. Ashgate Publishing Co.,Burlington, Vermont
Romanow Commission (2002) Building onValues: The future of health care in Canada.Available online at: http://dsp-psd.pwgsc.gc.ca/Collection/CP32-85-2002E.pdf[last accessed May 22, 2009]235

Royal College of Physicians (2008) How theNHS manages heart attacks. Available online at:http://www.rcplondon.ac.uk/clinical-standards/organisation/partnership/Documents/Minap-2008.pdf [last accessed May 22, 2009]
Sanmartin C and Gilmore J. (2008) Diabetes:Prevalence and care practices. Health Reports19(3): 1-5 Available online at: http://www.statcan.gc.ca/pub/82-003-x/2008003/article/10663-eng.pdf [last accessed May 22, 2009]
Safer Healthcare Now! (2009) AccomplishmentReport. Available online at: http://www.saferhealthcarenow.ca/EN/about/Overview/Documents/2009%20SHN%20Accomplishment%20Report.pdf[last accessed May 22, 2009]
Saultz J and Lochner J. (2005) Interpersonalcontinuity of care and care outcomes: a criticalreview. Ann Fam Med. 3(2):159-66
Sewitch M et al. (2008) Colorectal cancerscreening in Canada: results of a national survey. Chronic Diseases in Canada 29 (1).Available online at: http://www.phac-aspc.gc.ca/publicat/cdic-mcc/29-1/pdf/cdic29-1-2eng.pdf[last accessed May 22, 2009]
Shekelle P et al. (2006) Costs and benefits ofhealth information technology. Evid RepTechnol Assess (Full Rep).132:1-71
Starfield B and Shi L. (2002) Policy relevantdeterminants of health: an international perspective. Health Policy. 60(3):201-18
Statistics Canada (online a) Ten leading causesof death, Canada, 2004 and 2005. Availableonline at http://www.statcan.gc.ca/pub/84-215-x/2009000/tbl/tbl1-eng.htm[last accessed May 22, 2009]
Statistics Canada (online b) Five-year relative survival rate. Available online at:http://www.statcan.gc.ca/pub/82-401-x/2006000/considerations/hlt/4064333-eng.htm[last accessed May 22, 2009]
Tu JV, Khalid L, Donovan L et al. (2008)Indicators of quality of care for patients withacute myocardial infarction. CMAJ 179(9):909-15.
UBC Centre for Health Services and PolicyResearch (2008) The Canadian RX Atlas [2nd edition] Available online at:http://www.chspr.ubc.ca/files/publications/2008/CanRxAtlas/Canadian_Rx_Atlas_2nd_Edition.pdf[last accessed May 22, 2009]
Vincent C, Neale G, Woloshynowych M. (2001)Adverse events in British hospitals: preliminaryretrospective record review. BMJ 322(7285):517-19
Wilkins K and Shields M. (2008) Correlates ofmedication error in hospitals. Health Reports 19(2)
Wilkins R. (2007) Mortality by neighborhoodincome in urban Canada, 1971 through 2001.Health Analysis and Measurement Seminar,Ottawa, January 16
Wilkins R et al. (2008) The Canadian censusmortality follow-up study, 1991 through 2001.Health Reports 19(3) 25-43
Wilson R, Runciman W, Gibberd R et al. (1995)The Quality in Australian Health Care Study.Med J Aust 163(9): 458-76
World Health Organization (2004) WorldAlliance for Patient Safety. Available online at:http://www.who.int/patientsafety/en/[last accessed May 22, 2009]
World Health Organization (2009) Cancer KeyFacts. Available online at: http://www.who.int/mediacentre/factsheets/fs297/en/index.html[last accessed May 22, 2009]
Zoutman DE, Ford BD, Bryce E et al. (2003)The state of infection surveillance and controlin Canadian acute care hospitals. Am J InfectControl 31:266-72
236
Quality of Healthcare in Canada: A Chartbook

237
Notes

238
Quality of Healthcare in Canada: A Chartbook
Notes

239
Notes


