Quantification of stochastic noise of splicing and polyadenylation in Entamoeba histolytica Chung-Chau Hon 1,2, *, Christian Weber 1,2 , Odile Sismeiro 3 , Caroline Proux 3 , Mikael Koutero 3 , Marc Deloger 1,2 , Sarbashis Das 5 , Mridula Agrahari 4 , Marie-Agnes Dillies 3 , Bernd Jagla 3 , Jean-Yves Coppee 3 , Alok Bhattacharya 4,5 and Nancy Guillen 1,2 1 Institut Pasteur, Unite ´ Biologie Cellulaire du Parasitisme, De ´ partement Biologie cellulaire et infection, F-75015 Paris, France, 2 INSERM U786, F-75015 Paris, France, 3 Institut Pasteur, Plate-forme Transcriptome et Epige ´ nome, De ´ partement Ge ´ nomes et Ge ´ ne ´ tique, F-75015 Paris, France, 4 Jawaharlal Nehru University, School of Life Sciences, New Delhi 110067, India, and 5 Jawaharlal Nehru University, School of Computational and Integrative Sciences, New Delhi 110067, India Received July 17, 2012; Revised November 3, 2012; Accepted November 5, 2012 ABSTRACT Alternative splicing and polyadenylation were observed pervasively in eukaryotic messenger RNAs. These alternative isoforms could either be consequences of physiological regulation or sto- chastic noise of RNA processing. To quantify the extent of stochastic noise in splicing and polyadenylation, we analyzed the alternative usage of splicing and polyadenylation sites in Entamoeba histolytica using RNA-Seq. First, we identified a large number of rarely spliced alternative junctions and then showed that the occurrence of these alter- native splicing events is correlated with splicing site sequence, occurrence of constitutive splicing events and messenger RNA abundance. Our results implied the majority of these alternative splicing events are likely to be stochastic error of splicing machineries, and we estimated the corres- ponding error rates. Second, we observed extensive microheterogeneity of polyadenylation cleavage sites, and the extent of such microheterogeneity is correlated with the occurrence of constitutive cleavage events, suggesting most of such micro- heterogeneity is likely to be stochastic. Overall, we only observed a small fraction of alternative splicing and polyadenylation isoforms that are unlikely to be solely stochastic, implying the functional relevance of alternative splicing and polyadenylation in E. histolytica is limited. Lastly, we revised the gene models and annotated their 3 0 UTR in AmoebaDB, providing valuable resources to the community. INTRODUCTION In higher eukaryotes, alternative splicing and poly- adenylation, which generate multiple isoforms from a single messenger RNA (mRNA) precursor (pre-mRNA), are the major mechanisms for expanding the diversity of their transcriptomes and proteomes (1,2). Numerous studies demonstrated alternative splicing is pervasive in higher eukaryotes. For example, 95% of multi-exon genes undergo alternative splicing in human (3,4) and at least 42% of intron-containing genes are alternatively spliced in Arabidopsis thaliana (5). Moreover, micro- heterogeneity (6) and long-range heterogeneity (7) of polyadenylation site usage in eukaryotic mRNAs are also found to be extensive. Recent studies of polyadenyla- tion site heterogeneity using RNA-Seq further demon- strated the pervasiveness of alternative polyadenylation in animals (2,8,9) and plants (10,11). Functional conse- quences of physiologically regulated alternative splicing are well documented (12). Also, the impacts of alternative polyadenylation on mRNA coding capacity, localization, translation efficiency and stability have also been described (13). Nonetheless, the proportion of these alter- native isoforms being physiologically regulated versus those that are solely derived from the inherent stochasti- city of RNA processing (14) is largely unknown. How much of the observed alternative splicing and polyadenylation are a consequence of stochastic noise of RNA processing? A number of studies attempted to address this question. Based on comparative analyses of human and mouse expressed sequence tags (EST) data, Sorek et al. (15) proposed a significant portion of alterna- tive isoforms is likely to be non-functional, and might be resulted from aberrant rather than regulated splicing *To whom correspondence should be addressed. Tel: +33 1 45 68 86 75; Fax: +33 1 45 68 86 74; Email: [email protected]1936–1952 Nucleic Acids Research, 2013, Vol. 41, No. 3 Published online 20 December 2012 doi:10.1093/nar/gks1271 ß The Author(s) 2012. Published by Oxford University Press. This is an Open Access article distributed under the terms of the Creative Commons Attribution License (http://creativecommons.org/licenses/by-nc/3.0/), which permits non-commercial reuse, distribution, and reproduction in any medium, provided the original work is properly cited. For commercial re-use, please contact [email protected]. Downloaded from https://academic.oup.com/nar/article-abstract/41/3/1936/2902702 by guest on 16 March 2018
Transcript
Quantification of stochastic noise of splicing andpolyadenylation in Entamoeba histolyticaChung-Chau Hon1,2,*, Christian Weber1,2, Odile Sismeiro3, Caroline Proux3,
Mikael Koutero3, Marc Deloger1,2, Sarbashis Das5, Mridula Agrahari4,
Marie-Agnes Dillies3, Bernd Jagla3, Jean-Yves Coppee3, Alok Bhattacharya4,5 and
Nancy Guillen1,2
1Institut Pasteur, Unite Biologie Cellulaire du Parasitisme, Departement Biologie cellulaire et infection, F-75015Paris, France, 2INSERM U786, F-75015 Paris, France, 3Institut Pasteur, Plate-forme Transcriptome etEpigenome, Departement Genomes et Genetique, F-75015 Paris, France, 4Jawaharlal Nehru University, Schoolof Life Sciences, New Delhi 110067, India, and 5Jawaharlal Nehru University, School of Computational andIntegrative Sciences, New Delhi 110067, India
Received July 17, 2012; Revised November 3, 2012; Accepted November 5, 2012
ABSTRACT
Alternative splicing and polyadenylation wereobserved pervasively in eukaryotic messengerRNAs. These alternative isoforms could either beconsequences of physiological regulation or sto-chastic noise of RNA processing. To quantify theextent of stochastic noise in splicing andpolyadenylation, we analyzed the alternative usageof splicing and polyadenylation sites in Entamoebahistolytica using RNA-Seq. First, we identified alarge number of rarely spliced alternative junctionsand then showed that the occurrence of these alter-native splicing events is correlated with splicingsite sequence, occurrence of constitutive splicingevents and messenger RNA abundance. Ourresults implied the majority of these alternativesplicing events are likely to be stochastic error ofsplicing machineries, and we estimated the corres-ponding error rates. Second, we observed extensivemicroheterogeneity of polyadenylation cleavagesites, and the extent of such microheterogeneity iscorrelated with the occurrence of constitutivecleavage events, suggesting most of such micro-heterogeneity is likely to be stochastic. Overall, weonly observed a small fraction of alternative splicingand polyadenylation isoforms that are unlikely to besolely stochastic, implying the functional relevanceof alternative splicing and polyadenylation inE. histolytica is limited. Lastly, we revised the genemodels and annotated their 30UTR in AmoebaDB,providing valuable resources to the community.
INTRODUCTION
In higher eukaryotes, alternative splicing and poly-adenylation, which generate multiple isoforms from asingle messenger RNA (mRNA) precursor (pre-mRNA),are the major mechanisms for expanding the diversity oftheir transcriptomes and proteomes (1,2). Numerousstudies demonstrated alternative splicing is pervasive inhigher eukaryotes. For example, �95% of multi-exongenes undergo alternative splicing in human (3,4) andat least 42% of intron-containing genes are alternativelyspliced in Arabidopsis thaliana (5). Moreover, micro-heterogeneity (6) and long-range heterogeneity (7) ofpolyadenylation site usage in eukaryotic mRNAs arealso found to be extensive. Recent studies of polyadenyla-tion site heterogeneity using RNA-Seq further demon-strated the pervasiveness of alternative polyadenylationin animals (2,8,9) and plants (10,11). Functional conse-quences of physiologically regulated alternative splicingare well documented (12). Also, the impacts of alternativepolyadenylation on mRNA coding capacity, localization,translation efficiency and stability have also beendescribed (13). Nonetheless, the proportion of these alter-native isoforms being physiologically regulated versusthose that are solely derived from the inherent stochasti-city of RNA processing (14) is largely unknown.
How much of the observed alternative splicing andpolyadenylation are a consequence of stochastic noise ofRNA processing? A number of studies attempted toaddress this question. Based on comparative analyses ofhuman and mouse expressed sequence tags (EST) data,Sorek et al. (15) proposed a significant portion of alterna-tive isoforms is likely to be non-functional, and might beresulted from aberrant rather than regulated splicing
1936–1952 Nucleic Acids Research, 2013, Vol. 41, No. 3 Published online 20 December 2012doi:10.1093/nar/gks1271
� The Author(s) 2012. Published by Oxford University Press.This is an Open Access article distributed under the terms of the Creative Commons Attribution License (http://creativecommons.org/licenses/by-nc/3.0/), whichpermits non-commercial reuse, distribution, and reproduction in any medium, provided the original work is properly cited. For commercial re-use, please [email protected].
Downloaded from https://academic.oup.com/nar/article-abstract/41/3/1936/2902702by gueston 16 March 2018
events. Melamud and Moult (14) further showed that thenumber of alternative isoforms and their abundance canbe predicted by a simple stochastic noise model,demonstrating most alternative splicing in humans is aconsequence of stochastic noise in the splicingmachineries. More recently, Pickrell et al. (16) usedRNA-Seq to demonstrate the existence of a large classof low abundance and unconserved isoforms, presentingempirical data to support the hypothesis of noisy splicing.The extent of stochastic noise in polyadenylation is lesswell studied, despite this the genome-wide atlas ofpolyadenylation site was mapped in a number of modelorganisms (2,9,11). Quantifying the properties of alterna-tive splicing and polyadenylation events in wider range ofeukaryotes would certainly help to clarify the inherentstochasticity of these processes, and hence provideinsight into the prevalence of functionally relevant alter-native isoforms.
In this study, we sequenced the poly(A)+transcriptomeof Entamoeba histolytica at saturated depth and quantifiedthe extent of alternative usage of splicing andpolyadenylation sites in its mRNAs. E. histolytica is anenteric parasite in humans, which causes amoebiasis in�10% of the infected individuals, resulting in 50 millioncases of dysentery annually (17). Entamoeba belongs to theAmoebozoa kingdom, which represent one of the earliestbranches from the last common ancestor of all eukaryotesand is phylogenetically distinct from ‘model organisms’ ofanimals, fungi and plants (18). While most of the obser-vations on alternative splicing and polyadenylation werederived from studying these model organisms of animals,fungi and plants, it is therefore interesting to extend theobservations to other less characterized kingdoms.
Initial analyses of E. histolytica genome in 2005(assembly of �23Mb with 888 scaffolds) predicted 9938coding genes (average size: 1.17 kb), comprising 49%region of the genome (19). About 25% of these geneswere predicted to contain introns, and only 6% of themcontain multiple introns (19). This initial analysisprovided the first blueprint of E. histolytica genome tothe research community, which opened the avenue topost-genomic high-throughput studies, e.g. tran-scriptomics and proteomics. Nonetheless, the genome isAT rich and highly repetitive, and thus, this initialassembly might contain misassembled regions and par-tially sequenced or unidentified genes (20). Therefore,the genome was reassembled 5 years after its initialanalyses, with >100 artifactual tandem duplicationseliminated, reducing the assembly size to �20Mb with1496 scaffolds (21). Re-annotation of the new assemblyreduced the predicted gene number to 8201, and 40% ofthe original gene models were changed (21). Even so, mostof the gene models were solely based on in silico predictionand lack of supporting experimental data, e.g. comple-mentary DNA (cDNA)/EST.
The primary goal of this study is to quantify the hetero-geneity of splicing and polyadenylation in E. histolytica,an organism with few introns and short 30 untranslatedregion (UTR) (22,23), providing insights into the stochas-tic noise of these processes in lower eukaryotes. Inaddition, as resources for the Entamoeba community, we
revised the gene model annotations of E. histolytica inAmoebaDB based on our sequencing data.
MATERIALS AND METHODS
E. histolytica strains, RNA extraction, construction andsequencing of cDNA libraries
Two well-characterized strains of E. histolytica,HM1:IMSS and Rahman, were cultivated axenically inTYI-S-33 medium at 37�C, with three biological replicatesfor each. Trophozoites in log phase of growth were col-lected. HM1:IMSS is a prototype virulent strain, andRahman is an avirulent strain (24). Total RNA was ex-tracted from each of the biological replicates (n=6) usingTrizol reagents, and poly(A)+mRNA was purified fromtotal RNA using Dynabeads according manufacturer’s in-structions (Invitrogen). For high-throughput sequencing,paired-end cDNA libraries (n=6) were prepared frompoly(A)+ mRNA according to manufacturer’s instruc-tions (mRNA-Seq 8-Sample Prep Kit, Illumina). cDNAfragments of �200 bp were purified from each library andwere sequenced from both ends for 100 bp, using anIllumina HiSeq2000 instrument according manufacturer’sinstructions (Illumina). The RNA-Seq data have been de-posited in the European Nucleotide Archive (http://www.ebi.ac.uk/ena/data/view/ERP001024).
Reference genome and gene annotations
Genome scaffolds of E. histolytica HM1:IMSS version 1.3in AmoebaDB were used as the reference genome for allanalyses (25). Gene models were retrieved fromAmoebaDB version 1.3; repetitive elements were definedby previously annotations (26).
Read mapping and splicing junction identification
Reads with longer than 50 nt flagged with Illumina’s lowquality flag ‘B’ were removed from the data sets. The readswere mapped, as pairs, onto the reference genome usingBowtie version 0.12.7 (27) with the following parameters:(i) maximum two mismatches were allowed in a 50-nt seedregion (i.e. �n 2 �l 50); and (ii) reads mapped to >50 lo-cations were discarded (i.e. �m 50), and reads mapped tomultiple locations were reported only once (i.e. �k 1). Toidentify the splicing junctions, the unaligned reads fromBowtie were mapped using HMMSplicer version 0.95(28) with following parameters: (i) maximum twomismatches in second half matching (i.e. �e 2); (ii) max-imum intron size of 1000 nt (i.e. �k 1000); and (iii) anchorsize of 10 nt (i.e.�a 10). To be conservative, we have chosenHMMSplicer cutoff scores of 700 for a single read(default = 600) and 500 for multiple reads (default=400),which are both higher than the default values.
Definition of splicing efficiency, junction clusters andconstitutive isoforms
First, we pooled the mapping results of all libraries todefine transcribed fragments (i.e. transfrags). A transfragis defined as a continuous genomic region of �100 nt thatis covered by �3 reads per nucleotide with gap size �20 nt.
Nucleic Acids Research, 2013, Vol. 41, No. 3 1937
Downloaded from https://academic.oup.com/nar/article-abstract/41/3/1936/2902702by gueston 16 March 2018
Junctions identified in all libraries were also pooled.Splicing efficiency of a junction on an mRNA is definedas the ratio of the number of reads supporting thisjunction to the coverage (per nucleotide) of the correspond-ing mRNA. By definition, ideally, splicing efficiency of 1implies 100% of the pre-mRNA molecules were spliced atthis particular junction. We collapsed the junctions into‘clusters’ as follows. Junctions spanning across multiplenon-overlapping junctions were defined as ‘super-junctions’ (which involve exon skipping), and the restwere defined as ‘infer-junctions’. Then, super- andinfer-junctions were subjected to ‘clustering’ separately.Clustering refers to collapsing of overlapping junctionsinto clusters, and each cluster is represented by a ‘represen-tative junction’, which has the highest number of support-ing reads. Each infer-junction cluster was then classifiedeither as ‘constitutive’ or ‘alternative’. A junction (andthus the cluster it belongs to) is said to be ‘constitutive’(or otherwise ‘alternative’) if the ratio of its exonicflanking coverage to intronic flanking coverage >0.3, i.e.at least one-third of all reads covering the junction region,is spliced (explained in detailed in SupplementaryFigure S1). Constitutive junctions hence refer to junctionsthat are constitutively spliced on a given pre-mRNA.Constitutive isoform of a gene was constructed based onthe combinations of constitutive junction clusters andoverlapping transfrags. These constitutive isoforms werethen used to revise the gene models. Please seeSupplementary Figure S2 for a detailed workflow.
Correlating splicing efficiency to the degree of sequenceconservation of splicing sites
We quantified the degree of sequence conservation ofsplicing sites and investigate its correlation with splicingefficiency. We used ‘consensus value (CV)’, adopted fromShapiro and Senapathy (29) with slight modifications,which reflects the sequence similarity of a splicing site tothe consensus of a reference set of splicing sites. For thereference set of splicing site, we used the top 5% (n=242)splicing junctions with highest splicing efficiency. Forsplicing site sequences, we refer to the 20-mers ofintronic sequences next to the 50 and 30 splicing sitesexcluding the GU-AG site, i.e. position +3 to +12 of 50
splicing sites and �12 to �3 of 30 splicing sites. Then, wealigned these sequences and established a referenceposition-specific scoring matrix (PSSM) based on thealignment. We calculate the CV of each splicing site as:
CV ¼
Pi
fi,n �Pi
fi,min
Pi
fi,max �Pi
fi,min
0@
1A,
where i is the position of a nucleotide along the 20-mermentioned earlier; n is the actual nucleotide sequence atposition i; fi, n is the relative frequency of nucleotide n inthe reference PSSM; fi, min is the relative frequency of therarest nucleotide at position i in the reference PSSM; fi, max
is the relative frequency of most common nucleotideat position i in the reference PSSM. Therefore, CV is anumber ranging from 0 to 1, quantifying the sequence
conservation between a single splicing site and a groupof most efficiently spliced sites (i.e. reference PSSM). Toinvestigate the correlation between CV and splicingefficiency, splicing site sequences of discrete splicing effi-ciency intervals (in log10 scale, bin width=0.1) werepooled, and the mean CV were plotted against the meansplicing efficiency within each interval. Sequence logosand conservation at particular positions (i.e. measured inentropy ‘bits’) were calculated using Weblogo (30).
Discovering the motifs for splicing sites of alternativeintron creation events
Enrichment of sequence motifs around the alternativelycreated introns was tested using discriminative regularexpression motif elicitation (DREME) (31). DREMEperforms discriminative discovery of motif that isenriched in a positive set in comparison with a negativeset. First, intronic (20 nt) and exonic (50 nt) sequencesflanking the splicing sites of alternative intron creationjunctions were extracted. Alternative intron creation junc-tions were defined as non-stochastic (n=137, as positiveset) and stochastic (n=332, as negative set) when itssplicing efficiency is �0.13 and �0.013, respectively.Flanking sequences of constitutive splicing sites(n=2269) and coding sequences randomly sampledfrom non-intronic genes (n=5000) were used as controlpositive set and negative set, respectively. Enrichment ofmotifs of �4 nt and �10 nt was tested in the positive setsagainst the negative sets using DREME (31).
Gene model revision
We developed a Perl script to scan for the intersectionsbetween the constitutive isoform (from our RNA-Seq dataset) and existing gene models (from AmoebaDB), andautomatically categorized the conflicts between them.These conflicts were then revised manually to define aset of bona fide gene models that satisfies the followingcriteria. Inherent criterion: it contains a complete openreading frame (ORF) and is located at least 100 nt awayfrom ambiguous regions of the scaffold (i.e. scaffold endsand regions with ‘Ns’); coverage criterion: >95% area ofits ORF is covered by at least one read in the pooled data;junction criterion: all of its junctions (if any) are validatedin the pooled data set. A novel transcript was conserva-tively defined as transfrags located at least 100 nt awayfrom existing annotations and ambiguous regions. Pleasesee Supplementary Figure S3 for detailed workflow.
Identifying the polyadenylation sites from reads
The criteria used here are primarily based on Lee et al.(32). Briefly, reads containing five or more consecutive ‘A’at their end (or ‘T’ at their beginning, which will be reversecomplemented in downstream analyses) were selectedfrom each of the six libraries, and redundant reads wereremoved. These non-redundant reads were pooled. Thesereads potentially contain the sequence of mRNA poly(A)tails. The A stretch at the end were trimmed, and the readswith minimum 18 nt after trimming were mapped tothe reference genome using Bowtie with parameters ‘�n2 �k 1 �m 50 �1 30’. To distinguish poly(A) tracks of
1938 Nucleic Acids Research, 2013, Vol. 41, No. 3
Downloaded from https://academic.oup.com/nar/article-abstract/41/3/1936/2902702by gueston 16 March 2018
true polyadenylation from poly(A) tracks of internalpoly(A) stretches on the mRNAs themselves (i.e. falsepositives), we analyzed the base compositions surroundingthe end of the mapped reads and discard those that mightnot represent true polyadenylation. Reads with the follow-ing properties were regarded as false positives andremoved. (i) Reads with �5 nt immediate downstream ofthe end site are A’s; (ii) depending on the actual length ofthe poly(A) stretch of the read (e.g. N nt), reads with 70%of N nt downstream of the end site are A’s; and (iii) readswith �8 nt within 10 nt immediate upstream of the end siteare A’s. The polyadenylation sites were then defined as theimmediate downstream base of the reads. To ensure theidentified polyadenylation sites are not false positivesderived from low quality base calls, reads with qualityscores in any of the upstream and downstream 5ntflanking the polyadenylation site <20 were furtherremoved. These procedures should be able to removefalse positives derived from internal poly(A) stretchesand low quality base calls.
Assigning the poly(A) site clusters to gene models
As most of the observed polyadenylation sites appear asclusters (6), we grouped the poly(A) sites into clusters byallowing an optimal maximum intra-cluster distance (at12 nt) between sites (Figure 7A). A poly(A) cluster wasthen represented by the poly(A) site with highest numberof supporting reads (i.e. peak), and these peak positionswere used in all downstream analyses. A poly(A) cluster isdefined as valid when the number of reads at the peakposition is �2. To assign poly(A) tails to mRNAs, wesearched for poly(A) clusters within 200 nt downstreamof their stop codons on the same strand and recordedthe size of the coverage gap between the poly(A) clustersand the stop codon. A poly(A) tail is defined as valid whencoverage gap is �10 nt. Length of 30UTR of an mRNA isdefined as distance between the nucleotide (inclusive) afterits stop codon and the nucleotide (inclusive) before peaksite of the farthest valid poly(A) clusters.
Definition of microheterogeneity of polyadenylation andlong-range alternative polyadenylation
Microheterogeneity of polyadenylation is defined as thealternative poly(A) sites within a poly(A) cluster.Long-range alternative polyadenylation in mRNAs,including multiple distinct poly(A) clusters in 30UTRand poly(A) clusters within ORF, were defined accordingto the following criteria. To be conservative, we onlyconsider poly(A) clusters having �3 supporting readswith average poly(A) track length �10 nt. For multipledistinct poly(A) clusters in 30UTR, the clusters have tobe at least 25 nt away from each other and within 100 ntfrom stop codons of corresponding mRNAs. A minimuminter-cluster distance of 25 nt was chosen because >98%of poly(A) clusters are sized �25 nt (Figure 7B).A maximum distance of 100 nt from stop codon waschosen because >97% of all poly(A) sites are within100 nt from their corresponding stop codon. For poly(A)clusters within ORF, the clusters have to be �25 ntupstream to the corresponding stop codons, and the
number of A’s in the 10 nt upstream and downstream ofthe peak site has to be �4. A cutoff of minimum 25 ntupstream to stop codon was chosen to avoid the possibil-ity that the poly(A) clusters within ORF were actually partof the poly(A) clusters at 30UTR. A cutoff of maximumfour As in the 10 nt flanking the peak site was chosen toavoid the possibility that the A-tracks on poly(A) readswere artifactual because of A-rich regions on mRNA.
Discovering the sequences motifs for polyadenylation
The sequences immediate upstream and downstream(50 nt on each side) of the poly(A) site of all mRNAs(n=5018) were used to scan for conserved motifs usingDREME (31). The immediate upstream or downstreamsequences were thus used as the positive sets, and thefarther upstream (at position �200) or downstream (atposition +150) sequences of the same length were usedas the negative sets. Highly stringent E-value (10�50) waschosen to avoid spurious motifs. To visually investigatethe positional enrichment of these discovered motifs sur-rounding the polyadenylation sites, the total occurrence ofthese motifs was searched along the sequences surround-ing (200 nt) the poly(A) sites.
Counting the occurrence of AAWUDA motifs
A motif, AAWUDA, was found significantly enriched ataround 20 nt upstream of all poly(A) clusters at 30UTR(see ‘Results’ section). To investigate the occurrence ofthis motif in long-range alternative poly(A) clusters in30UTR (n=102) and within ORFs (n=59), we extracted15 nt from position �25 to �10 nt of their peak sites andcounted the occurrence of the motif and the proportion ofits variants (i.e. AAUUAA, AAUUUA, AAAUAA, AAAUUA, AAUUGA and AAAUGA). To assess the back-ground occurrence of this motif in the target sequences, wecounted both real sequences and permutated sequences(i.e. the 15 nt real sequence being randomly shuffled).As positive and negative controls, sequences extractedfrom 30UTRs with a single poly(A) cluster (n=4173)and random genomic sequences of the same length(n=10000) were also counted, respectively.
Identifying differentially expressed alternative splicingisoforms between HM1:IMSS and Rahman
Non-stochastic splicing isoforms (n=194) were defined asmentioned in the ‘Results’ section, and their genomic co-ordinates were combined with that of the reference genemodels (n=7312, revised gene models) into a singleannotation file in general transfer format (GTF). Wethen remapped the reads of the six libraries separatelyonto these reference and alternative isoforms usingTopHat version 2.0.4 (33) by supplying the mentionedGTF file, and de novo identification of splicing junctionwas disabled. Default settings were used for other param-eters. Outputs from TopHat were then analyzed usingCufflinks package version 2.0.2 (34) for identification ofdifferentially expressed alternative splicing isoforms. Wealso counted the number of reads supporting these alter-native junctions between the two strains. If the readnumber of a junction is �5 in both strains and the fold
Nucleic Acids Research, 2013, Vol. 41, No. 3 1939
Downloaded from https://academic.oup.com/nar/article-abstract/41/3/1936/2902702by gueston 16 March 2018
change of read number between the two strains is �3, thealternative isoform derived from this junction is said toexpress at substantially different levels. To assess the re-producibility of the biological replicates, we performedheuristic clustering and principle component analysison their expression profiles (i.e. fragment per kilobaseper millions values of all bona fide genes estimated inCufflinks) using CummeRbund version 1.99.1 (http://compbio.mit.edu/cummeRbund/) and FactoMiner (35),respectively.
Identifying variability in alternative poly(A) clustersbetween HM1:IMSS and Rahman
For alternative poly(A) clusters, we considered only themultiple poly(A) clusters in 30 UTR (n=102) andpoly(A) clusters within ORF (n=59) as defined in the‘Results’ section. For each of these alternative poly(A)clusters in each of the strains, we calculated the proportionof the alternative poly(A) events in the total poly(A) eventsof the corresponding genes (denoted prptnAlt) as thefollowing:
prptnAlt ¼Reads in the alternative polyðAÞ cluster
Reads in all polyðAÞ clusters of the gene
To be conservative, we considered only alternativepoly(A) clusters with at least 10 reads in the pooled dataset of six libraries. The proportion of an alternativepoly(A) cluster is said to be ‘substantially shifted’between two strains when the fold change of prptnAltbetween two strains is �2.
Analyses of gene ontology (GO)
We investigated the functional themes of the non-stochasticalternatively spliced genes and genes with long-range alter-native polyadenylation sites using GO::TermFinder,which visualizes the gene ontology (GO) of a list of genesand performs enrichment tests (36). GO annotation ofE. histolytica was retrieved from AmoebaDB. A thresholdof P-value �0.05 and a false discovery rate �10% waschosen to define significant enrichment.
RESULTS
Data set coverage
In this study, we sequenced the poly(A)+transcriptome ofthe prototype virulent strain, HM1:IMSS, and the aviru-lent strain, Rahman (24), with three biological replicateseach (n=6). The six data sets consist of �1000 millionreads of 100 nt in total, covering the �20Mb genome at�5000 times. Details of the data set were summarized inSupplementary Table S1. First, the six data sets were in-dependently mapped to the genome (see ‘Materials andMethods’ section). Then, we assessed the reproducibilityof the biological replicates. Both principle componentanalyses and heuristic clustering of their expressionprofiles (see ‘Materials and Methods’ section) suggestthe replicates are generally reproducible, and the expres-sion profiles from the two strains are readily distinguish-able from each other (Supplementary Figure S4). For the
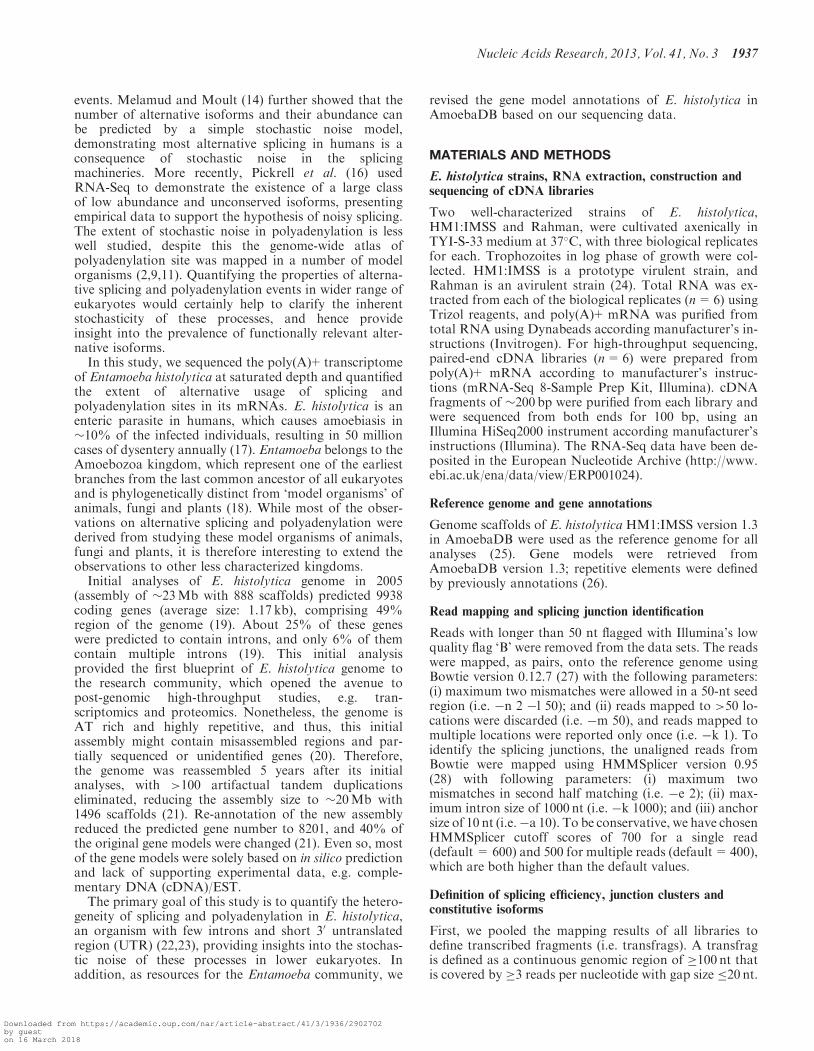
purposes of gene model revision, as well as splicing junc-tions and polyadenylation sites identification, we pooledthe mapping results (i.e. junctions and read pileupcoverage) from the six data sets and evaluated itscoverage on the annotated gene models. More than 98%of the annotated coding region was covered by at leasttwo reads (Figure 1A), implying our data set is saturatedand deep enough to cover most of annotated coding tran-scripts. Then, we quantified the portions of genome beingtranscribed as poly(A)+RNA (Figure 1B). Here, we focuson the ‘non-repetitive and non-structural RNA’ genome,i.e. genomic regions excluding ribosomal RNA, transferRNA and repetitive elements (Figure 1C, left panel).About 86% of the ‘non-repetitive and non-structuralRNA’ genome was covered by at least two reads(Figure 1B), implying at least 86% of the ‘non-repetitiveand non-structural RNA’ genome is transcribed(Figure 1C, right panel). We also noticed �24% tran-scribed area is unannotated (Figure 1C, right panel),reflecting the incompleteness of the current gene modelannotation. Therefore, we identified novel coding tran-scripts and revised the existing gene models, defininga set of bona fide gene models (n=7312), which will bedescribed in the last section. It should be noted that‘mRNAs’ and ‘gene models’ discussed in the followingsections refer to these bona fide gene models.
Existence of a large number of unannotated junctions
To assess the extent of alternative splicing, we systematic-ally analyzed the splicing junctions on a genome-wide scale.Here, we confine our discussion to canonical junctionsmapped within the ORF of mRNAs on the same strand(n=6417). First, 2089 of 2557 (�81%) junctionsannotated in AmoebaDB were confirmed by our data set,i.e. 468 of them were left unconfirmed (SupplementaryFigure S5A). These unconfirmed junctions might beeither because of (i) our data coverage is not wide anddeep enough; or (ii) these junctions do not exist in reality(i.e. intron prediction errors). A previous study suggestedthat skewed ratio of intron length categories of 3n, 3n+1and 3n+2 could be indicators of intron prediction errors,as intron lengths are not expected to respect coding frame(37). We thus compared the intron length category ratio ofthe confirmed and unconfirmed AmoebaDB junctions. Inunconfirmed junctions, both 3n+1 (�36%) and 3n+2(�38%) are substantially more frequent than 3n introns(�25%), whereas in the confirmed junctions, the ratio of3n+1 (�34%), 3n+2 (�35%) and 3n introns (�31%) ismostly unbiased (Supplementary Figure S5B). Forinstance, �50% of these unconfirmed junctions arelocated either in proximity to the ambiguous genomicregions (n=154), or within repetitive regions (n=77),which are prone to assembly errors (SupplementaryFigure S5A). We manually inspected some of these uncon-firmed junctions located close to contig breaks andobserved frame-shifting (i.e. 3n+1 or 3n+2) artifactualintrons were often predicted to ‘rescue’ a false stop codonfor the ORF (explained in Supplementary Figure S5C).These data suggest a substantial proportion of these uncon-firmed junctions might be errors of intron prediction and
1940 Nucleic Acids Research, 2013, Vol. 41, No. 3
Downloaded from https://academic.oup.com/nar/article-abstract/41/3/1936/2902702by gueston 16 March 2018
do not exist. In fact, 30% of unconfirmed junctions(n=163) were corrected and led to modifications of genemodels (discussed later). Notably, only 74 of them, i.e.<3% of all junctions annotated in AmoebaDB, couldneither be confirmed nor explained as earlier, implyingthe depth of our data set should be enough to covermost, if not all, of the splicing junctions. Interestingly,the number of junctions identified here (n=6417) substan-tially outnumbered the confirmed AmoebaDB junctions(n=2089), suggesting the existence of a large number ofunannotated junctions on mRNAs (n=4328).
Most of the unannotated junctions are rarely spliced
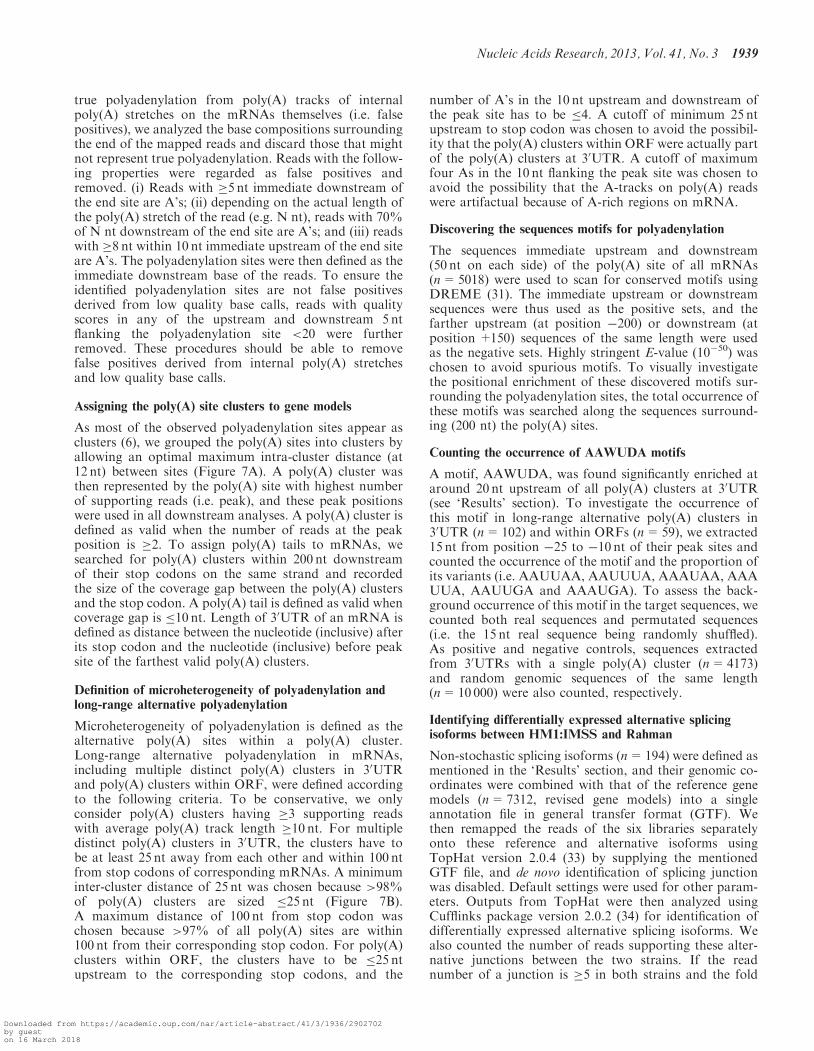
To gain more insights into the aforementioned unannot-ated junctions, we investigated their splicing efficiency.We define ‘splicing efficiency’ as the ratio between thenumber of reads supporting a junction to the coverage(per nucleotide) of the corresponding mRNA (see‘Materials and Methods’ section). The median splicing ef-ficiency of junctions annotated in AmoebaDB (n=2089)and those that are not annotated in AmoebaDB(n=4328) are �0.46 and �0.0012, respectively(Figure 2). It implies most of the unannotated junctionsare rarely spliced, comparing with the junctions annotatedin AmoebaDB that are often spliced. Then, we used the5% percentile of the splicing efficiency of junctionsannotated in AmoebaDB (�0.03; Figure 2, dotted line)as the cutoff to define whether a junction is rarely oroften spliced. Often-spliced junctions refer to junctionsthat are frequently, or constitutively, spliced off fromthe pre-mRNA molecules, whereas rarely-spliced junc-tions refer to the opposite scenario. There are 2262
often-spliced junctions, which, by definition, include95% of the junctions annotated in AmoebaDB, and 227unannotated junctions. On the other hand, there are 4155rarely-spliced junctions, which are mostly unannotated.These results indicate most of the unannotated junctionsare rarely spliced.
Splicing site sequence of the rarely-spliced junctions areless conserved
We reasoned if the majority of these rarely-spliced junc-tions were functionally relevant, their splicing efficiencyshould be regulated through physiological mechanisms
A
C
B
2 4 6 8 1075
80
85
90
minimum number of reads
%ar
eaof
non-
repe
titiv
e&
non-
stru
ctur
alR
NA
geno
me
2 4 6 8 1095
96
97
98
99
100
minimum number of reads
%ar
eaof
codi
ngre
gion
29%unannotated
% area transcribed in non-repetitive & non-structural RNA genome
62%transcribedcoding gene
2%non-transcribed
coding gene
12%non-transcribed
unannotated
86%transcribed
in total
80%non-repetitive &
non-structural RNAgenome
24%transcribed
unannotated
0.07%tRNA & rRNA
20%repetitive elements
51%coding gene
% area of genome by AmoebaDB annotations
Figure 1. Data set coverage and proportion of transcribed genomic region. (A) Coverage of the annotated coding regions at various depths. Thedata suggest our data set covered most of the coding regions. (B) Coverage of ‘non-repetitive and non-structural RNA’ genome at various depths.(C) Left panel: composition of annotated genomic regions. The ‘non-repetitive and non-structural RNA’ genome refers to the genome excludingribosomal RNAs, transfer RNAs and repetitive elements. Right panel: proportion of transcribed area of the ‘non-repetitive and non-structural RNA’genome. About 24% of the ‘non-repetitive and non-structural RNA’ genome is transcribed but unannotated.
102103
n=2089 n=4328 ft li dy
100101
often-splicejunctionsn= 2262
ffeci
enc
10-310-210-1
l li d
0.03
licin
g ef
f
10-610-510-4
rare y-sp cejunctionsn=4155og
10 s
pl
10-7
junctionst t d
junctions nott t d
l
anno a ein AmoebaDB
anno a ein AmoebaDB
Figure 2. Defining often- and rarely-spliced junctions by splicing effi-ciency. The ‘boxes and whiskers’ represent the 5th, 25th, 50th, 75th and95th percentiles. The dots represent data points below and above the5th and 95th percentiles. The cutoff for defining often- andrarely-spliced is indicated by a dotted line.
Nucleic Acids Research, 2013, Vol. 41, No. 3 1941
Downloaded from https://academic.oup.com/nar/article-abstract/41/3/1936/2902702by gueston 16 March 2018
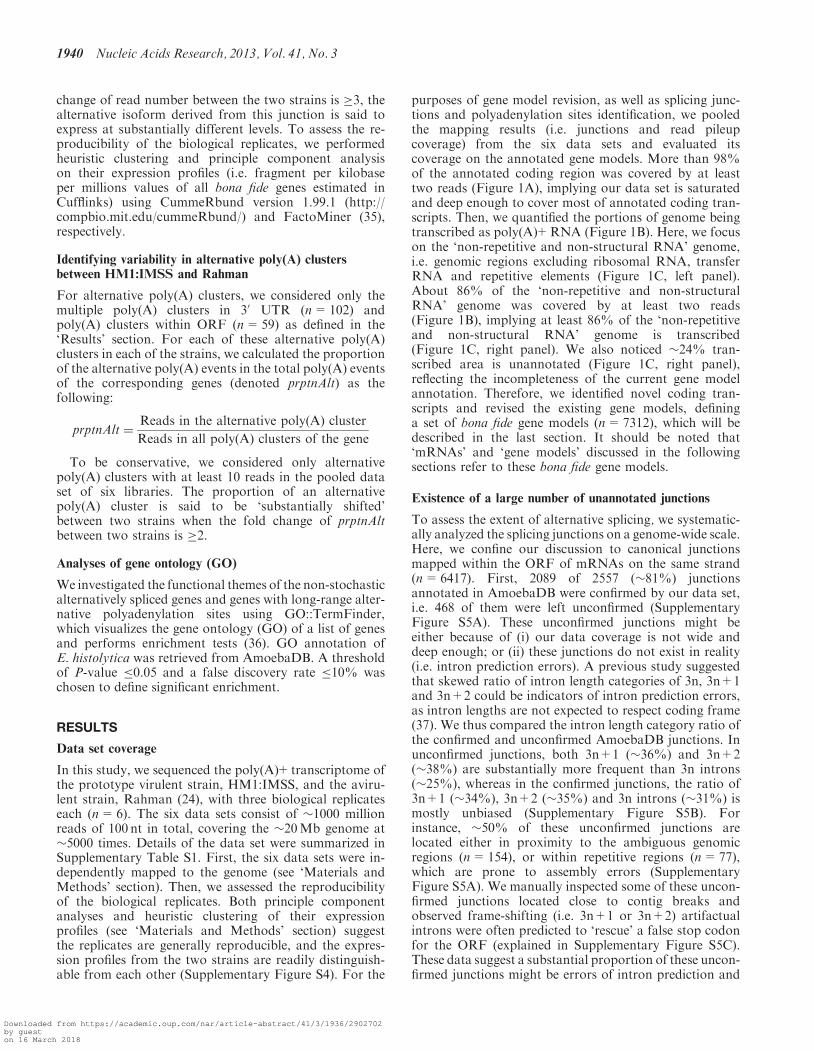
rather than determined by splicing site sequence.Alternatively, if majority of the rarely-spliced splicingjunctions were a consequence of stochastic noise ofsplicing machineries, their splicing efficiency should be de-pendent on splicing site sequences, assuming certain com-position of splicing site sequence was inherently morepreferred by the splicing machineries. To this end, weinvestigated the correlation between splicing efficiencyand sequence conservation of all junctions. First, theoften-spliced junctions showed conserved splicing site se-quences of 50-GUUUGUU-UAG-30 (Figure 3A), agreeingwith the reported sequence in a previous study (23).However, the rarely-spliced junctions are generally lessconserved (Figure 3B), suggesting the splicing efficiencyof a junction might be correlated with its splicing sitesequence. To further investigate such correlation, wepooled the sequences of splicing sites within discrete inter-vals of splicing efficiency and plotted the degree of sequenceconservation within each interval (Figure 3C). As expected,sequence conservation (measured in entropy ‘bits’) of the50-GUUUGUU-UAG-30 motif decreases with splicing effi-ciency (Figure 3C). To quantify such correlation, weplotted the mean CV against the mean splicing efficiencyof each interval (Figure 3D). CV is a measurement ofsequence similarity of a splicing site to the consensus ofmost efficiently spliced junctions (see ‘Materials andMethods’ section). The mean CV of splicing sites is signifi-cantly correlated with their mean splicing efficiency(Pearson’s correlation coefficient=0.97, P< 0.0001, 95%CI 0.92–0.99). It suggests the splicing sites of less efficientlyspliced junctions are diverged from that of the most effi-ciently spliced junctions, and such divergence is quantita-tively correlated with splicing efficiency. These resultsdemonstrated the observed splicing efficiency of most junc-tions is dependent on composition of sequence motifsaround the splicing site. It implies the splicing machineries
in Entamoeba have a preference for specific splicing sitesequence, and such preference seems to be the majorfactor affecting the splicing efficiency of most junctions.Taken together, these data strongly suggest the splicing ef-ficiency of majority of the rarely-spliced junctions isdetermined by splicing site sequence rather than regulatedthrough physiological mechanisms, implying they are likelyto be a consequence of stochasticity of splicing machineries.In fact, �69% of the rarely-spliced junctions overlap withat least one often-spliced junction (i.e. appear as ‘junctionclusters’ as in Figure 4A); such association implies thoseoften and ‘constitutive’ splicing events might be thesource of these rare and ‘alternative’ splicing events. Inthe following sections, we defined the constitutive and al-ternative splicing events and investigated the correlationbetween their occurrences.
Definition of constitutive and alternative splicing events
To this end, we reconstructed the constitutive isoformsof all mRNAs and defined three types of alternativesplicing events, including alternative 50 or 30 splicing,exon skipping and intron creation. First, we collapsed alloverlapping junctions as clusters (Figure 4A), and categor-ize them as ‘constitutive’ or ‘alternative’ junction clusters,based on the ratio of exonic to intronic coverage surround-ing the junction (explained in Supplementary Figure S1).A constitutive junction cluster, by definition, implies itsintronic regions are constitutively being spliced off fromthe pre-mRNA. Alternative 50 or 30 splicing events weredefined as alternative junctions within a constitutivejunction cluster (n=1647; Figure 4A). Exon skippingevents were defined as alternative junctions that spanacross multiple constitutive junction clusters (n=99;Supplementary Figure S1). Intron creation events weredefined as alternative junctions that do not overlap withany constitutive junction cluster (n=1667; Supplementary
B
C
A D
Figure 3. Splicing efficiency is correlated with splicing site sequence conservation. (A) Weblogo of often-spliced junctions. (B) Weblogo ofrarely-spliced junctions. (C) Degree of conservation of junction sequences pooled at discrete intervals of splicing efficiency. Each line represents agroup of junction sequences pooled at discrete intervals of splicing efficiency, same as in (D). The entropy value (bits) at each position is calculatedusing Weblogo. (D) Positive correlation between CV and splicing efficiency. Each data point represents a group of junction sequences pooled atdiscrete intervals of splicing efficiency. The error bars represent standard error of the mean.
1942 Nucleic Acids Research, 2013, Vol. 41, No. 3
Downloaded from https://academic.oup.com/nar/article-abstract/41/3/1936/2902702by gueston 16 March 2018
Figure S1). It should be noted that alternative junctionsmapped to non-unique regions were discarded in all down-stream analyses to avoid potential artifacts. Next, weinvestigated the properties of these three types of alterna-tive splicing events.
Alternative 50 or 30 splicing events are more likely to occurin more often spliced junctions
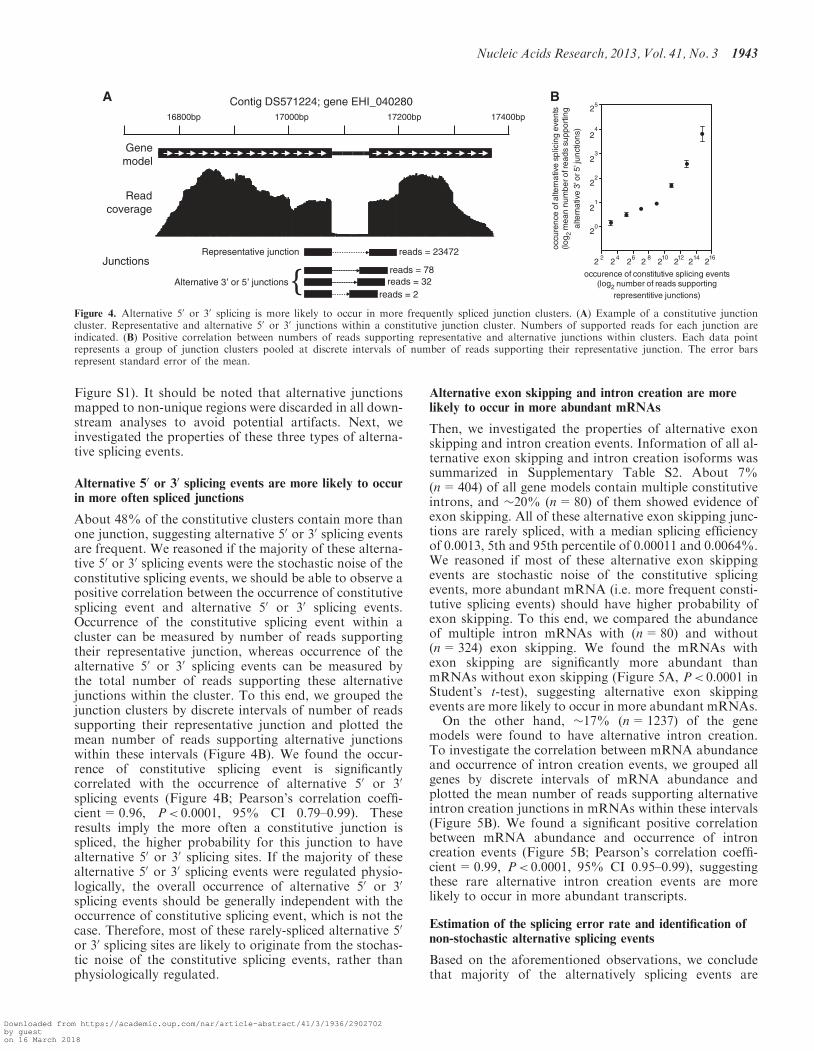
About 48% of the constitutive clusters contain more thanone junction, suggesting alternative 50 or 30 splicing eventsare frequent. We reasoned if the majority of these alterna-tive 50 or 30 splicing events were the stochastic noise of theconstitutive splicing events, we should be able to observe apositive correlation between the occurrence of constitutivesplicing event and alternative 50 or 30 splicing events.Occurrence of the constitutive splicing event within acluster can be measured by number of reads supportingtheir representative junction, whereas occurrence of thealternative 50 or 30 splicing events can be measured bythe total number of reads supporting these alternativejunctions within the cluster. To this end, we grouped thejunction clusters by discrete intervals of number of readssupporting their representative junction and plotted themean number of reads supporting alternative junctionswithin these intervals (Figure 4B). We found the occur-rence of constitutive splicing event is significantlycorrelated with the occurrence of alternative 50 or 30
splicing events (Figure 4B; Pearson’s correlation coeffi-cient=0.96, P< 0.0001, 95% CI 0.79–0.99). Theseresults imply the more often a constitutive junction isspliced, the higher probability for this junction to havealternative 50 or 30 splicing sites. If the majority of thesealternative 50 or 30 splicing events were regulated physio-logically, the overall occurrence of alternative 50 or 30
splicing events should be generally independent with theoccurrence of constitutive splicing event, which is not thecase. Therefore, most of these rarely-spliced alternative 50
or 30 splicing sites are likely to originate from the stochas-tic noise of the constitutive splicing events, rather thanphysiologically regulated.
Alternative exon skipping and intron creation are morelikely to occur in more abundant mRNAs
Then, we investigated the properties of alternative exonskipping and intron creation events. Information of all al-ternative exon skipping and intron creation isoforms wassummarized in Supplementary Table S2. About 7%(n=404) of all gene models contain multiple constitutiveintrons, and �20% (n=80) of them showed evidence ofexon skipping. All of these alternative exon skipping junc-tions are rarely spliced, with a median splicing efficiencyof 0.0013, 5th and 95th percentile of 0.00011 and 0.0064%.We reasoned if most of these alternative exon skippingevents are stochastic noise of the constitutive splicingevents, more abundant mRNA (i.e. more frequent consti-tutive splicing events) should have higher probability ofexon skipping. To this end, we compared the abundanceof multiple intron mRNAs with (n=80) and without(n=324) exon skipping. We found the mRNAs withexon skipping are significantly more abundant thanmRNAs without exon skipping (Figure 5A, P< 0.0001 inStudent’s t-test), suggesting alternative exon skippingevents are more likely to occur in more abundant mRNAs.On the other hand, �17% (n=1237) of the gene
models were found to have alternative intron creation.To investigate the correlation between mRNA abundanceand occurrence of intron creation events, we grouped allgenes by discrete intervals of mRNA abundance andplotted the mean number of reads supporting alternativeintron creation junctions in mRNAs within these intervals(Figure 5B). We found a significant positive correlationbetween mRNA abundance and occurrence of introncreation events (Figure 5B; Pearson’s correlation coeffi-cient=0.99, P< 0.0001, 95% CI 0.95–0.99), suggestingthese rare alternative intron creation events are morelikely to occur in more abundant transcripts.
Estimation of the splicing error rate and identification ofnon-stochastic alternative splicing events
Based on the aforementioned observations, we concludethat majority of the alternatively splicing events are
reads = 23472
reads = 78 reads = 32
reads = 2
Representative junction
Readcoverage
Junctions
Contig DS571224; gene EHI_040280
Alternative 3 or 5 junctions
16800bp 17000bp 17200bp 17400bp
Genemodel
2 4 6 8 10 12 14 16
0
1
2
3
4
5
2 2 2 2 2 2 2 2
2
2
2
2
2
2
occurence of constitutive splicing events(log2 number of reads supporting
representitive junctions)
occu
renc
eof
alte
rnat
ive
splic
ing
even
ts(lo
g 2m
ean
num
bero
frea
dssu
ppor
ting
alte
rnat
ive
3'or
5'ju
nctio
ns)
A B
Figure 4. Alternative 50 or 30 splicing is more likely to occur in more frequently spliced junction clusters. (A) Example of a constitutive junctioncluster. Representative and alternative 50 or 30 junctions within a constitutive junction cluster. Numbers of supported reads for each junction areindicated. (B) Positive correlation between numbers of reads supporting representative and alternative junctions within clusters. Each data pointrepresents a group of junction clusters pooled at discrete intervals of number of reads supporting their representative junction. The error barsrepresent standard error of the mean.
Nucleic Acids Research, 2013, Vol. 41, No. 3 1943
Downloaded from https://academic.oup.com/nar/article-abstract/41/3/1936/2902702by gueston 16 March 2018
generally rare, and their occurrence is correlated withsplicing site sequence, occurrence of constitutive splicingevents and mRNA abundance. These results impliedmajority of these alternative splicing events seem to bederived from stochastic errors of splicing machineries ina probabilistic manner. We thus view functionally relevantalternative splicing events as physiologically regulated se-lection of spliced sites from a large pool of stochasticallyspliced alternative sites. Understanding the properties ofthese stochastic erroneous events certainly help us toidentify the physiologically regulated events, which aremore likely to be functionally relevant. To this end, weattempted to estimate the error rate for different types ofalternative splicing events. Our goal is to identify the al-ternative splicing events that are substantially deviatedfrom the estimated error rates, which are more likely torepresent the non-stochastic alternative splicing events.First, we presume the alternative junctions with lessconserved splicing site sequence, i.e. unconserved alterna-tive junctions with low CV, are more likely to be solelystochastic. Then, we used the 5th percentile CV of all con-stitutive junctions (i.e. 0.7) as the cutoff to define theseunconserved alternative junctions. These unconserved al-ternative junctions will be used for error rate estimationsas described in the following section.To estimate the error rate for alternative 50 or 30 splicing
events, we first identified the constitutive junction clustersthat contain only the aforementioned unconserved alter-native junctions. Then, we calculated the ratio ofread number supporting the alternative junctions to thatof the constitutive junction in each cluster (n=128clusters). Theoretically, this ratio represents the numberof unconserved alternative splicing events per constitutivesplicing event (i.e. error rate). The observed median is
0.4%, with 5th and 95th percentile of 0.002% and 13%.Using the 95th percentile as the cutoff, we thereforedefined non-stochastic alternative 50 or 30 splicing eventsas alternative junctions with supporting read number>13% of that of the constitutive junction (n=55 out of1647). We used the same cutoff to identify non-stochasticexon skipping events, i.e. alternative exon skipping junc-tions with supporting read number >13% of that ofthe skipped representative junctions (n=1 out of 99).To estimate the error rate for intron creation events,we first identified all intron creation events that consistof unconserved alternative junctions (n=980).Theoretically, the splicing efficiency of these alternativeintron creation junctions represents the probability of apre-mRNA molecule with an unconserved alternativeintron created (i.e. error rate). The observed median is0.1%, with 5th and 95th percentile of 0.0004% and 2%.Using the 95th percentile as the cutoff, we thereforedefined non-stochastic intron creation events as alterna-tive junctions with splicing efficiency >2% (n=136of 1667). It should be noted that these error rate estima-tions do not represent the inherent error rate of thesplicing machineries themselves, but rather represent theobserved error rate, resulting from the combinatory effectssplicing machineries errors and RNA quality controlmachineries e.g. non-sense mediated decay pathway.
Possible origins of the non-stochastic alternativesplicing events
To investigate whether these non-stochastic alternativesplicing events tend to co-occur in multiple introns onthe same transcript, we summarized the occurrence ofnon-stochastic alternative splicing sites in genes with
A B
Figure 5. Alternative exon skipping and intron creation are more likely to occur in more abundant transcripts. (A) Abundance of multi-intronmRNA with and without exon skipping events. Asterisks: P< 0.0001 in Student’s t-test. The ‘boxes and whiskers’ represent the 5th, 25th, 50th, 75thand 95th percentiles. (B) Positive correlation of mRNA abundance with the occurrence with intron creation events. Each data point represents agroup of mRNA pooled at discrete intervals of mRNA abundance. The error bars represent standard error of the mean.
1944 Nucleic Acids Research, 2013, Vol. 41, No. 3
Downloaded from https://academic.oup.com/nar/article-abstract/41/3/1936/2902702by gueston 16 March 2018
multiple constitutive introns (i.e. multi-intron genes).Non-stochastic alternative splicing sites were found in 31of 447 multi-intron genes. Almost all (n=30) of these 31multi-intron genes have non-stochastic alternative splicingsites in only one of its constitutive introns. This observa-tion suggests efficient alternative splicing sites do not tendto co-occur in multiple introns of the same transcript,implying a closer physical proximity between constitutiveintrons and the machineries needed for efficient alternativesplicing does not seem to increase the probability of anintron being alternatively spliced.
To determine whether particular regulatory sequenceswere enriched around the splicing sites of thesenon-stochastic alternative intron creation events, we per-formed a discriminative discovery of motifs in flankingsequence of splicing site of non-stochastic alternativeintron creation events (see ‘Materials and Methods’section). As a control, we first used the flanking sequencesof the constitutive splicing sites as the positive set andrandom coding sequences of non-intronic genes as thenegative set. As expected, we identified the GUUG motifat the 50 constitutive splicing sites, corresponding to the GUUGUU motif as described in Figure 3A. Next, we usedthe sequences flanking the splicing sites of thenon-stochastic and stochastic alternative intron creationevents as the positive and negative set, respectively.Again, we only identified the GUUG motif at the 50
splicing site, and no additional significant motif wasidentified (data not shown). In fact, this observationreinforced our earlier observation that the splicing effi-ciency of a junction is correlated with the conservationof this GUUGUU motif at the 50 splicing site sequence(Figure 3C and D). Therefore, we conclude that no add-itional regulatory sequence was found to be associatedwith non-stochastic alternative junctions except the GUUGUU motif at the 50 splicing site.
Implications on the prevalence of functionally relevantalternative splicing isoforms
We consider the aforementioned ‘non-stochastic’ alterna-tive splicing events (n=194) are less likely to be solelystochastic and more likely to be physiologically regulated.These alternative splicing events and the supporting evi-dences in the six libraries were listed in SupplementaryTable S3). To investigate the functional themes of thesenon-stochastic alternatively spliced genes, we summarizedtheir gene ontologies and performed an enrichment testusing GO::TermFinder. Although we did not find any sig-nificantly enriched functional themes, a summary of thegene ontologies of these non-stochastic alternativelyspliced genes can be found in Supplementary Figure S6.In fact, >80% of these non-stochastic alternatively junc-tions (n=159) are expected to cause frame shifts to theoriginal ORF of the mRNA (Supplementary Table S3).Alternatively speaking, only 33 of them are expected togenerate alternative transcripts without premature stopcodons. If we presume coding potential (i.e. with orwithout premature stop codons) of an alternative tran-script is crucial to its functional relevance, then the preva-lence of functionally relevant alternative splicing isoforms
in E. histolytica would be limited. To summarize, despitethe pervasiveness of alternative splicing events, most ofthem are likely to be stochastic, and the functionalimpact of alternative splicing in E. histolytica is minimal.
Majority of the identified poly(A) sites are genuine
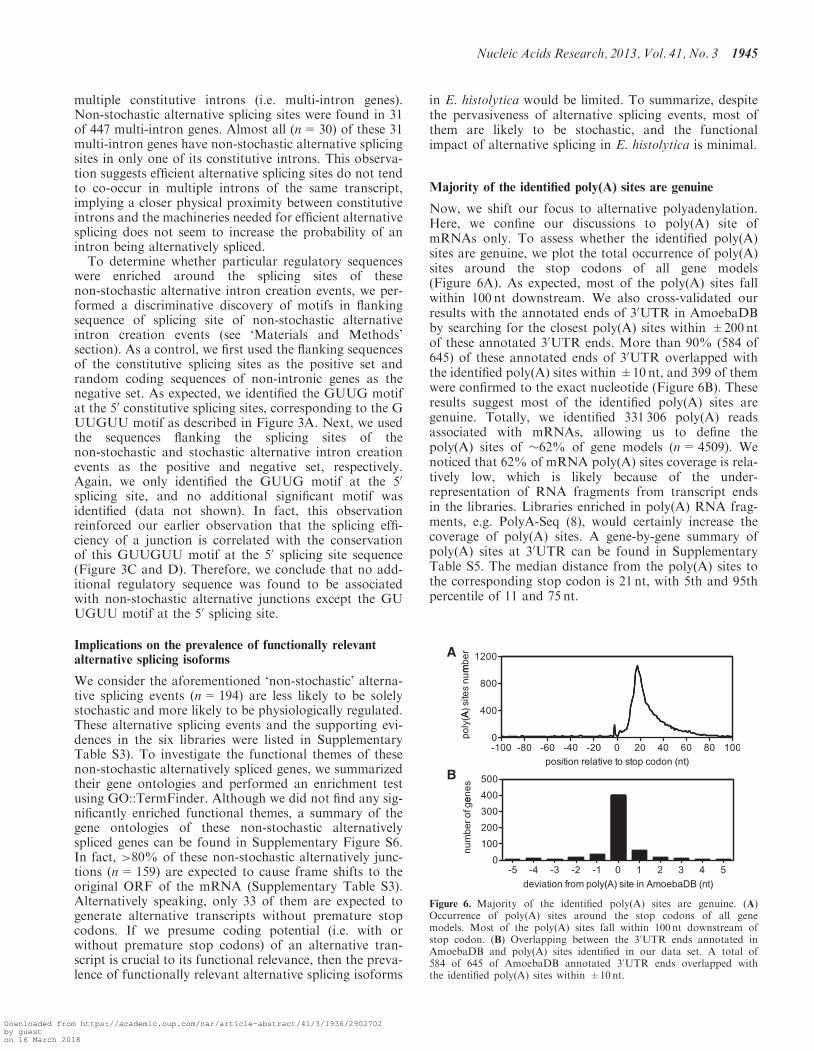
Now, we shift our focus to alternative polyadenylation.Here, we confine our discussions to poly(A) site ofmRNAs only. To assess whether the identified poly(A)sites are genuine, we plot the total occurrence of poly(A)sites around the stop codons of all gene models(Figure 6A). As expected, most of the poly(A) sites fallwithin 100 nt downstream. We also cross-validated ourresults with the annotated ends of 30UTR in AmoebaDBby searching for the closest poly(A) sites within ±200 ntof these annotated 30UTR ends. More than 90% (584 of645) of these annotated ends of 30UTR overlapped withthe identified poly(A) sites within ±10 nt, and 399 of themwere confirmed to the exact nucleotide (Figure 6B). Theseresults suggest most of the identified poly(A) sites aregenuine. Totally, we identified 331 306 poly(A) readsassociated with mRNAs, allowing us to define thepoly(A) sites of �62% of gene models (n=4509). Wenoticed that 62% of mRNA poly(A) sites coverage is rela-tively low, which is likely because of the under-representation of RNA fragments from transcript endsin the libraries. Libraries enriched in poly(A) RNA frag-ments, e.g. PolyA-Seq (8), would certainly increase thecoverage of poly(A) sites. A gene-by-gene summary ofpoly(A) sites at 30UTR can be found in SupplementaryTable S5. The median distance from the poly(A) sites tothe corresponding stop codon is 21 nt, with 5th and 95thpercentile of 11 and 75 nt.
A
B
Figure 6. Majority of the identified poly(A) sites are genuine. (A)Occurrence of poly(A) sites around the stop codons of all genemodels. Most of the poly(A) sites fall within 100 nt downstream ofstop codon. (B) Overlapping between the 30UTR ends annotated inAmoebaDB and poly(A) sites identified in our data set. A total of584 of 645 of AmoebaDB annotated 30UTR ends overlapped withthe identified poly(A) sites within ±10 nt.
Nucleic Acids Research, 2013, Vol. 41, No. 3 1945
Downloaded from https://academic.oup.com/nar/article-abstract/41/3/1936/2902702by gueston 16 March 2018
Microheterogeneity in poly(A) cleavage sitesare stochastic
Microheterogeneity in poly(A) cleavage sites in highereukaryotes is well documented (6). Here, we quantifiedsuch microheterogeneity observed in E. histolytica. First,we grouped the poly(A) sites into clusters by allowingcertain cutoffs on the maximum distance between siteswithin a cluster. About 85% of sites can be grouped as
clusters if we allow a cutoff of maximum 12 nt betweensites, and further increasing the cutoff did not increasethe percentage of clustered site significantly (Figure 7A).The result suggests most of the sites were in proximity toother sites within a range of 12 nt, and therefore, we chose12 nt as the cutoff to define poly(A) clusters. In fact,95% of poly(A) clusters are sized <20 nt (Figure 7B).Information of all poly(A) site clusters was summarizedin Supplementary Table S4. Each poly(A) cluster was
A
C
D E
B
Figure 7. Microheterogeneity in poly(A) cleavage sites are stochastic. (A) Defining microheterogeneity [i.e. poly(A) site clusters] using maximumintra-cluster distance. Further increasing the maximum intra-cluster distance >12 nt (dotted line) did not substantially increase the percentage ofclustered poly(A) sites. (B) Defining long-range heterogeneity based on poly(A) site cluster size. About 98% of clusters are <25 nt; therefore, a cutoffof 25 nt was chosen to define long-range heterogeneity. (C) Example of microheterogeneity within a poly(A) site cluster. The constitutive site wasindicated with an arrow, while the other sites are alternative sites. (D) Histogram of the proportion of reads supporting constitutive and alternativecleavage sites within poly(A) site clusters. Position 0 corresponds to constitutive cleavage site. The average proportion of reads supporting consti-tutive events in all clusters is >0.75. (E) Positive correlation between the number of reads supporting constitutive and alternative cleavage site withinclusters. Each data point represents a poly(A) site cluster.
1946 Nucleic Acids Research, 2013, Vol. 41, No. 3
Downloaded from https://academic.oup.com/nar/article-abstract/41/3/1936/2902702by gueston 16 March 2018
represented by a constitutive site (i.e. the ‘peak’ with mostnumber of reads), and the rest were termed alternativesites (Figure 7C). We defined microheterogeneity as thealternative sites within clusters. To investigate the usageof constitutive site versus alternative sites within clusters,we calculated the proportion of reads supporting the con-stitutive site and its surrounding sites in each cluster.Then, we plotted the average proportion of reads support-ing each relative positions of all clusters (Figure 7D).Most of the alternative sites were located within ±5ntto the corresponding constitutive site, reflecting theinherent limits of the range of such microheterogeneity(Figure 7D). These alternative sites contributed less thana proportion of 0.25 of all cleavage events within a clusteron average, as the average proportion of reads supportingconstitutive sites is >0.75 (Figure 7D). These resultssuggest that although microheterogeneity of poly(A)cleavage site seem to be ubiquitous, majority of thecleavage events (>75%) still occur on the constitutivesite. To this end, we reasoned if such microheterogeneityis because of stochastic noise of the constitutive cleavageevents, we should be able to observe a positive correlationbetween the occurrence of constitutive cleavage eventsand the amount of microheterogeneity within clusters.We measured these two properties by the number ofreads supporting the constitutive sites and the totalnumber of reads supporting the alternative sites within acluster, respectively. As shown in Figure 7E, these two par-ameters are highly correlated (Pearson’s correlation coef-ficient=0.81, P< 0.0001, 95% CI 0.80–0.82), implyingthe extent of microheterogeneity within a cluster increaseswith the occurrence of constitutive cleavage events.Therefore, such microheterogeneity is likely to bebecause of stochastic noise of the constitutive cleavageevents within clusters.
Long-range alternative poly(A) events in mRNA arelimited
Now, we consider long-range heterogeneity of poly(A)events, including multiple distinct poly(A) clusters in30UTR and poly(A) clusters within ORF (see ‘Materialsand Methods’ section). Multiple distinct poly(A) clustersin 30UTR were observed in 51 genes, and poly(A) clusterswithin ORF were observed in 59 genes, while threegenes have both types of alternative poly(A) events (i.e.totally 107 genes were affected, listed in SupplementaryTables S5 and S6). Gene ontologies of these alternativelypolyadenylated genes were summarized in SupplementaryFigure S7. A list of these alternatively polyadenylatedgenes can be found in Supplementary Table S5. Furtheranalyses of sequence properties of these long-range alter-native poly(A) clusters (discussed later) suggest these al-ternative poly(A) events are mostly genuine. It is notedthat 20 of the 59 genes with poly(A) clusters mappedwithin ORF have no poly(A) cluster mapped within 30
UTR. To estimate the extent alternative polyadenylationin E. histolytica, we calculated the percentage of geneswith long-range alternative poly(A) events in two poolsof genes, (i) genes with polyadenylation sites mappedwithin 30UTR (n=87 out of 4509 genes, �1.9%); and
(ii) genes with at least 10 supporting reads in its prominentpoly(A) cluster within 30UTR (i.e. please refer to‘mostRdPolyARdNum’ column in Supplementary TableS5; n=51 of 1995 genes, �2.4%). These results suggestthat although long-range heterogeneity of poly(A) eventsis observed in E. histolytica, these alternative poly(A)events seems to only occur in a limited proportion ofgenes (�1.9 to �2.4%). In fact, given its relatively short30UTR (median of 21 nt), we do not expect too muchlong-range alternative polyadenylation in 30UTR ofmRNAs in E. histolytica, in contrast to the pervasive alter-native polyadenylation in other characterized modelorganisms (2).
Having summarized the microheterogeneity and long-range heterogeneity of poly(A) sites, we next explore thebase compositions and sequence motifs surroundingpoly(A) sites of coding genes. We aligned 200-nt sequencesurrounding all poly(A) clusters in the 30 UTR of mRNAs(n=5018). The base composition profile is characterizedby a narrow A-rich peak at around �20 nt, and a broadU-rich region surrounding the cleavage site (Figure 8A).The A-rich peak at �20 nt corresponds to the location ofcanonical polyadenylation signal sequence found in othermodel organisms (8). It should also be noted that the en-richment of C at �1 nt (Figure 8A) supports the observa-tion that a CA dinucleotide immediately 50 to the cleavagesite is preferred but not absolutely required (38). UsingDREME, we identified an AAWUDA motif at aroundthe �20 nt (E-value= 4.4�368) (Figure 8B and C),resembling the canonical polyadenylation signal AAUAAA in mammalian species (8). This AAWUDA motif(Figure 8C) is highly position-specific at �20 nt(Figure 8B). In addition, we also identified U-rich motifsat immediate upstream (UUUUUW, E-value=4.8�74)and downstream (UUUUWW, E-value=2.8�328) of thepoly(A) site (data not shown). These two U-rich motifscorrespond to the broad U-rich region in the base compos-ition profile surrounding the poly(A) site (Figure 8A). Insummary, three sequence characteristics, includingAAWUDA motif at �20 nt, enrichment of C at �1 ntand a broad U-rich region surrounding the poly(A) site,seem to play roles in determining the cleavage site ofpolyadenylation.
Occurrence of AAWUDA motif in different types ofpoly(A) clusters
To this end, we investigated the occurrence of AAWUDAmotif and the proportion of its variants in different typesof poly(A) clusters. We categorized the poly(A) clustersinto three types, (i) single poly(A) clusters at 30UTR(n=4173); (ii) multiple poly(A) clusters at 30UTR(n=102); and (iii) poly(A) clusters within ORF(n=59). Sequences of 15-nt region at around 20 ntupstream of these poly(A) clusters were extracted, andthe occurrence of AAWUDA motif was counted. As anegative control, random genomic sequences of the samelength (15 nt, n=10000) were also counted. Permutatedsequences from each type were also counted as
Nucleic Acids Research, 2013, Vol. 41, No. 3 1947
Downloaded from https://academic.oup.com/nar/article-abstract/41/3/1936/2902702by gueston 16 March 2018
background controls (see ‘Materials and Methods’section). About 59% of the real sequences extractedfrom single poly(A) clusters at 30UTR were found tocontain AAWUDA motif, which is substantially higherthan both that of the corresponding permutated sequences
and the random genomic sequences (Figure 8D), suggest-ing the presence of AAWUDA motif in the upstream ofthese poly(A) clusters is non-random. This result alsoimplies the AAWUDA motif is absent in �41% of thesepoly(A) clusters. It should be noted that we only
AAUUGA AAUUAA AAUUUAAAAUAA AAAUUA AAAUGA
single poly(A)
n=4173
multiple poly(A)
n=102
poly(A) clusters
within ORF
n=59
random genomic
sequences
n=10000
real datapermutated data
percentage of
poly(A) cluster with AAWUDA
motif at position -20nt
proportion of
AAWUDA motif variants
in real data
types of
poly(A) cluster
59%51%
46%
13%19% 19%
10% 12%
26% 20% 34%7%
24% 24% 20%
17%
20%18%
23% 13%
14%
17%
9%
32%
17%
11%17%
9%5%7% 3%
15%
-100 -80 -60 -40 -20 0 20 40 60 80 1000
10
20
30
40
50
relative position to constitutive poly(A) site (nt)
occu
renc
eof
mot
ifin
sequ
ence
(%)
A
B
C
D
0.0
1.0
2.0
bits AAA
UUUGAA-100 -80 -60 -40 -20 0 20 40 60 80 100
0
20
40
60
80
100A CGU
relative position to constitutive poly(A) site (nt)
base
com
posi
tions
(%)
Figure 8. Sequence characteristics surrounding polyadenylation sites. (A) Base compositions surrounding poly(A) sites of coding genes. (B)Positional occurrence of the AAWUDA motif along the sequences surrounding poly(A) sites. This motif is enriched around position �20 nt.Position 0 corresponds to constitutive cleavage site. (C) Weblogo of the AAWUDA motif identified in DREME. The entropy value (bits) ateach position is calculated using Weblogo. (D) Occurrence of the AAWUDA motif between position �25 nt to �10 nt of different types ofpoly(A) cluster. Middle panel: percentage presence of AAWUDA motif in real and permutated sequence of the corresponding poly(A) clustertypes. Lower panel: proportion of AAWUDA motif variants in real sequence of the corresponding poly(A) cluster types. Random genomic sequencesof same length were used as control.
1948 Nucleic Acids Research, 2013, Vol. 41, No. 3
Downloaded from https://academic.oup.com/nar/article-abstract/41/3/1936/2902702by gueston 16 March 2018
considered the six predefined variants within a narrowwindow of 15 nt, and therefore, this percentage of‘signaless’ poly(A) clusters could be over-estimated.Further analyses of these ‘signaless’ poly(A) clusters didnot yield any significant sequence patterns. Nonetheless, itwas reported that a canonical polyadenylation signalsequence might not be an absolute prerequisite for apolyadenylation event, as �13% of mRNA isoformpoly(A) sites in Caenorhabditis elegans (9) do notcontain any recognizable polyadenylation signalsequences. About 51 and 46% of multiple poly(A)clusters at 30UTR and poly(A) clusters within ORF werefound to contain the AAWUDA motif, respectively,which are comparable with that of the single poly(A)clusters at 30UTR and substantially higher than that ofthe corresponding permutated sequences, suggestingthese long-range alternative poly(A) clusters are likely tobe genuine. Finally, the proportion of variant AAUUGA(blue slices in pie charts of Figure 8D) in all types ofpoly(A) clusters (�20–34%) are consistently and substan-tially higher than that of the random genomic sequences(�7%), further supporting the occurrence of AAWUDAmotif around different types of poly(A) clusters arenon-random. Taken together, these data further supportthat the AAWUDA motif is a genuine polyadenylationsignal sequence in E. histolytica.
Variability of alternative polyadenylation and splicingbetween HM1:IMSS and Rahman strain
To investigate the variability of alternative poly(A)clusters between the two strains, we calculated thechange of proportion of these poly(A) events in the totalnumber of poly(A) events of the corresponding genes
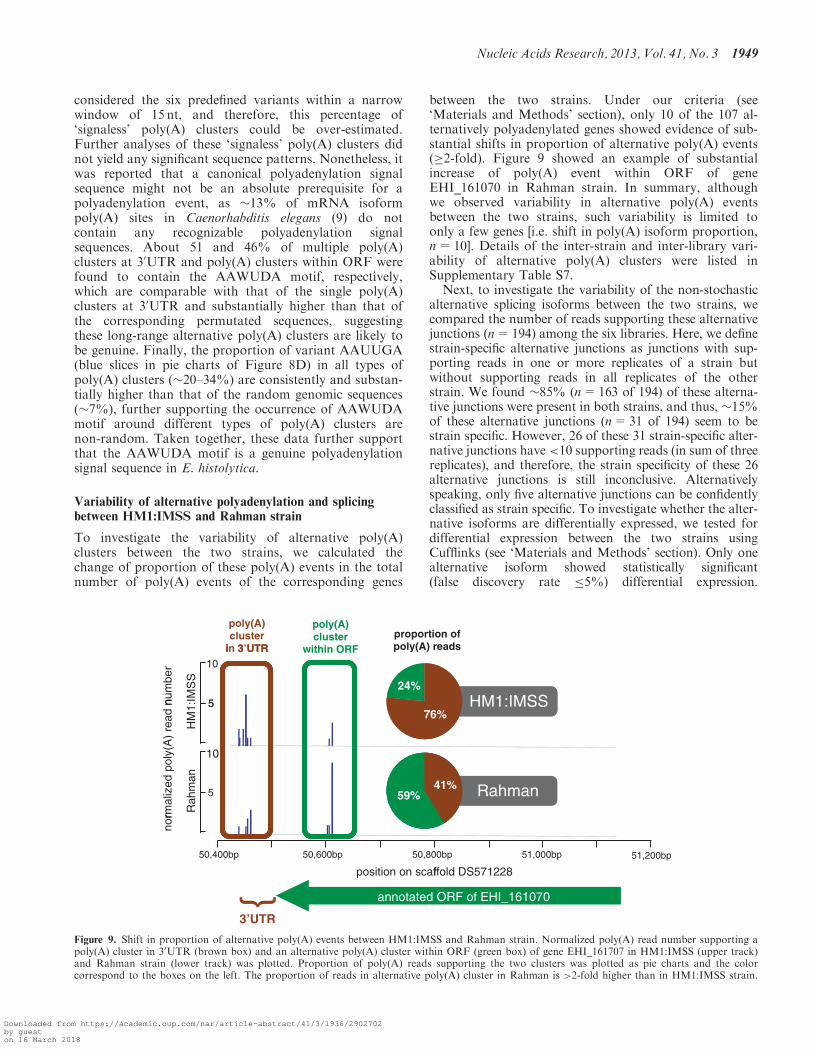
between the two strains. Under our criteria (see‘Materials and Methods’ section), only 10 of the 107 al-ternatively polyadenylated genes showed evidence of sub-stantial shifts in proportion of alternative poly(A) events(�2-fold). Figure 9 showed an example of substantialincrease of poly(A) event within ORF of geneEHI_161070 in Rahman strain. In summary, althoughwe observed variability in alternative poly(A) eventsbetween the two strains, such variability is limited toonly a few genes [i.e. shift in poly(A) isoform proportion,n=10]. Details of the inter-strain and inter-library vari-ability of alternative poly(A) clusters were listed inSupplementary Table S7.Next, to investigate the variability of the non-stochastic
alternative splicing isoforms between the two strains, wecompared the number of reads supporting these alternativejunctions (n=194) among the six libraries. Here, we definestrain-specific alternative junctions as junctions with sup-porting reads in one or more replicates of a strain butwithout supporting reads in all replicates of the otherstrain. We found �85% (n=163 of 194) of these alterna-tive junctions were present in both strains, and thus, �15%of these alternative junctions (n=31 of 194) seem to bestrain specific. However, 26 of these 31 strain-specific alter-native junctions have <10 supporting reads (in sum of threereplicates), and therefore, the strain specificity of these 26alternative junctions is still inconclusive. Alternativelyspeaking, only five alternative junctions can be confidentlyclassified as strain specific. To investigate whether the alter-native isoforms are differentially expressed, we tested fordifferential expression between the two strains usingCufflinks (see ‘Materials and Methods’ section). Only onealternative isoform showed statistically significant(false discovery rate �5%) differential expression.
poly(A)cluster
i 3 UTR
poly(A) cluster proportion of
poly(A) reads
HM1:IMSSnum
ber 10
5
in 3’UTR within ORF
24%
IMS
S
HM1:IMSS
10ly(A
) re
ad n 5
76%
HM
1:
5
rmal
ized
po
Rahman
Rah
man
nor
position on scaffold DS571228
50,400bp 50,600bp 50,800bp 51,000bp 51,200bp
f
annotated ORF of EHI_161070{
3’UTR
59%41%
Figure 9. Shift in proportion of alternative poly(A) events between HM1:IMSS and Rahman strain. Normalized poly(A) read number supporting apoly(A) cluster in 30UTR (brown box) and an alternative poly(A) cluster within ORF (green box) of gene EHI_161707 in HM1:IMSS (upper track)and Rahman strain (lower track) was plotted. Proportion of poly(A) reads supporting the two clusters was plotted as pie charts and the colorcorrespond to the boxes on the left. The proportion of reads in alternative poly(A) cluster in Rahman is >2-fold higher than in HM1:IMSS strain.
Nucleic Acids Research, 2013, Vol. 41, No. 3 1949
Downloaded from https://academic.oup.com/nar/article-abstract/41/3/1936/2902702by gueston 16 March 2018
We also empirically compared the fold change of numberof reads supporting the alternative junctions between thetwo strains (see ‘Materials and Methods’ section). Only 21alternative junctions showed fold change of supportingreads �3 between the two strains. Details of the inter-strainvariability of alternative splicing isoforms were listed inSupplementary Table S8. In summary, although weobserved differences in alternative splicing between thetwo strains, such differences are limited to a smallnumber of genes (i.e. strain-specific splicing isoform,n=5; differentially expressed splicing isoforms, n=21).To this end, we summarized the GO terms of the genes
that exhibit variability of alternative polyadenylation orsplicing between the two strains (n=10+5+21 asdescribed earlier). Although we did not find any signifi-cantly enriched functional themes, a summary of the geneontologies of these genes can be found in SupplementaryFigure S8. In conclusion, inter-strain variability in alter-native splicing and polyadenylation was only observed ina small fraction of genes, and thus, we expect the contri-bution of alternatively splicing and polyadenylation to thephenotypic differences (e.g. virulence) between the twostrains is likely to be limited. Experimental validation ofthe previously listed genes might shed light on this aspect.
Identification of novel coding transcripts
The genome of E. histolytica was sequenced in 2005 (19),and was then re-assembled and re-annotated recently (21).The current assembly, which consists of 1496 scaffolds, isoften considered as ‘unfinished’, i.e. it might containnumerous misassembled regions and wrongly annotatedgene models (20). Therefore, as a part of the effort toimprove the gene model annotations, we identified 181novel coding transcripts. We considered these novelcoding transcripts bona fide, as they were curatedmanually to ensure the start and stop codons are locatedat the extremities of the transcripts, based on the fact thatUTR of Entamoeba mRNA is extremely short (39). Mostof these novel ORFs (i.e. 159 of 181) are shorter than300 nt (average &268 nt), reflecting the fact that ORFsof <100 codons were basically ignored in previous genepredictions (21). Identities of the predicted proteins werethen annotated using InterProScan and BLAST.Interestingly, �30 and �16% of these short peptides arepredicted to contain transmembrane domains andcoiled-coil domains, respectively. In addition, a numberof small peptides with well-known functions were alsoidentified, e.g. G-protein subunit gamma (EHI_C00092),amoebapore (EHI_C00062), ferredoxin (EHI_C00161),thioredoxin (EHI_C00011), etc. In particular,amoebapores, which are �77-residue amphipathicpeptides that are able to form transmembrane poreswith a hydrophilic hole in membranes of target cells, arethought to be an important virulence factor (40). A betterannotated catalog of these small peptides might thereforelead to the discovery of novel virulence factors. All ofthese novel coding transcripts (except EHI_C00151) areexpressed in both HM1:IMSS and Rahman strains.Functional annotations, as well as the read counts of
these genes in both strains, were listed in SupplementaryTable S9.
Validation and revision of existing gene models
Finally, we revised 720 existing gene models and validatedmost of the rest, defining a set of 7312 bona fide genemodels (including the 181 novel genes mentioned previ-ously). Alternatively speaking, �15% (n=1220) of theexisting gene models could not be validated, while�73% (n=892) of these ‘invalid’ models were becauseof conflicts with inherent criterion (see ‘Materials andMethods’ section), i.e. either lack of a complete ORF(e.g. pseudogene) or located at the proximity of ambigu-ous genomic regions (e.g. scaffold breaks). In fact,majority of these unvalidated gene models are repetitive,with only <25% of them being unique (see ‘Materials andMethods’ section, Supplementary Figure S9). It thusagrees with fact that (i) repetitive sequences tend tocreate breaks in the scaffolds; and (ii) pseudogenes areoften repetitive. About 44% of the modified gene modelsinvolve changes in junctions (i.e. novel, missed andmodified junctions in Supplementary Figure S10A),while most of them (n=189) involve incorporation ofnew junctions into the gene models (SupplementaryFigure S10B). In addition, based on manual curation, 59and 12 existing gene models were split (SupplementaryFigure S10C) and fused (Supplementary Figure S10D),respectively. On the other hand, �47 and 5% of themodified gene models involved extension (SupplementaryFigure S10E) and shortening (SupplementaryFigure S10F) of transcript ends, respectively. All finalizedgene models, as well as the RNA-Seq data, can be foundin the next release of AmoebaDB (25). Information ongene model revision was summarized in SupplementaryTable S10. In summary, we defined a set bona fide genemodels (n=7312), and �62% (n=4509) of them areannotated with 30UTR. These annotations represent amajor leap forward in the genome biology of theparasite since its genome was sequenced, providingvaluable resources to the research community.
Our primary aim was to assess the extent of alternativesplicing and polyadenylation, as well as their functionalrelevance, in E. histolytica. Functional significances of al-ternative splicing and polyadenylation are undoubted, butonly limited to a handful of well-studied examples (12,13).Although numerous studies demonstrated the pervasive-ness of alternative splicing and polyadenylation in highereukaryotes, little is known about the functional relevanceof the resulting RNA isoforms. Here, we emphasize theimportance of quantifying such heterogeneity to distin-guish physiologically regulated events from inherently sto-chastic events, which both result in mRNA diversity. Wetherefore estimated the error rates of splicing andidentified the alternative splicing events that are lesslikely to be solely stochastic. For instance, only 33 of
1950 Nucleic Acids Research, 2013, Vol. 41, No. 3
Downloaded from https://academic.oup.com/nar/article-abstract/41/3/1936/2902702by gueston 16 March 2018
them are not likely to be solely stochastic and expected togenerate alternative transcripts without premature stopcodons, suggesting alternative splicing is not likely to dra-matically expand the proteome diversity of E. histolytica.On the other hand, we quantified the extent of stochasticmicroheterogeneity of polyadenylation and defined acutoff of 25 nt to identify long-range heterogeneity thatis less likely to solely stochastic. In fact, long-range alter-native polyadenylation seems to occur in small proportionof genes (estimated to be �1.9 to �2.4%), suggesting al-ternative polyadenylation only plays a limited role in ex-panding the transcriptome diversity of E. histolytica. Also,variability of the non-stochastic alternatively spliced andlong-range alternative polyadenylated isoforms are limitedbetween HM1:IMSS and Rahman strain. In summary, weexpect the functional impacts of these alternative splicingand polyadenylation events are only limited to a smallproportion of genes in this organism.
Evidence and consequence of noisy splicing
Most, if not all, biological processes, including splicing,have inherent error rates. To the best of our knowledge,the number of analyses of splicing noise based on empiricaldata is limited. Melamud and Moult (14) analyzed thehuman EST libraries and showed that the number ofisoforms and their abundance can be predicted through asimple stochastic noise model that takes into account onlythe number of introns and expression level of a gene.Alternatively speaking, they found the number of detectedalternative splicing reactions increases with the total numberof observed splicing reaction, strongly supportting the hy-pothesis that most alternative splicing is a consequence ofstochastic noise in the splicing machinery and has no func-tional significance. More recently, using RNA-Seq, Pickrellet al. demostrated the existence of a large class of low abun-dance alternative isoforms. They found little evidence ofevolutionary conservation in the splicing sites of theseisoform, and splicing error rate is correlated with intronlength, suggesting that the majority are because of errone-ous splicing site choice (16). In this study, there are threemain observations supporting the notion that the majorityof alternative junctions are consequence of splicing noise,including (i) splicing efficiency is correlated with splicing sitesequence conservation (Figure 3); (ii) most of therarely-spliced alternative 50 or 30 splicing sites are dependenton the occurrence of the constitutive splicing events(Figure 4); and (iii) exon skipping and intron creation aremore likely to occur in more abundant transcripts(Figure 5). Although we expect most of these isoforms arelikely to be non-functional, from a evolutionary standpoint,these isoforms might provide the substrate for a yet to beknown selection process, which selects for a functionallyrelevant isoform and ultimately contributes to the emer-gence of novel biological properties. Skandalis et al. (41)investigated the alternative splicing patterns of DNA poly-merase b among primate species and found the frequency ofunproductive alternative splicing is correlated well with lifehistory of parameters, such as the maximal longevity ofeach species. They speculate unproductive alternativesplicing may have adaptive significance even if the
transcripts themselves are non-functional. In any case,quantification of these unproductive alternative splicingwould be the stepping stone to understand their evolution-ary significance.
Heterogeneity of poly(A) site in an early branchingeukaryote
Tian et al. (42) reported that heterogeneity of poly(A)cleavage usually occurs within 24 nt after the 50-mostcleavage site in human and mouse genes. Our observationis comparable with theirs, with �97% of poly(A) clusterssized <24 nt. Tian et al. (42) also showed that the numberof cleavage sites is correlated with the number of support-ing cDNA/ESTs, suggesting such microheterogeneity isgenerally stochastic. Here, we further quantified thisconcept by demonstrating a strong correlation betweenthe occurrence of constitutive and alternative cleavageevents, suggesting the inherent stochastic errors of themore frequent constitutive cleavage events are the originof the less frequent alternative cleavage events. Theseresults suggest the origin of microheterogeneity inpoly(A) cleavage site seems to be universal from lowerto higher eukaryotes. However, the pervasiveness oflong-range heterogeneity of poly(A) site in higher eukary-otes, e.g. 69.1% of human genes have multiple poly(A)clusters (8), seems to be lacking in E. histolytica. In fact,only a small proportion of genes (estimated to be �1.9 to�2.4%) were found to have long-range heterogeneity ofpoly(A) site in E. histolytica. The relative short 30UTR(median 21 nt) and the lack of extensive alternativepolyadenylation might imply the regulatory roles of30UTR in E. histolytica are relatively limited whencompared with other higher eukaryotes (13).
SUPPLEMENTARY DATA
Supplementary Data are available at NAR Online:Supplementary Tables 1–10 and Supplementary Figures1–10.
ACKNOWLEDGEMENTS
A.B. thanks the Department of Biotechnology,Government of India, for support.
FUNDING
French National Research Agency [ANR-2010-GENM-011-01, GENAMIBE to N.G.]; French NationalResearch Agency (to C.C.H., M.K. andM.D.); CSIR-SRFfellowship (to S.D.); BNP Paribas (CIB for Health andMedical Research) (to N.G. and A.B.). Funding for openaccess charge: French National Research Agency [ANR-2010-GENM-011-01, GENAMIBE to N.G.].
Conflict of interest statement. None declared.
Nucleic Acids Research, 2013, Vol. 41, No. 3 1951
Downloaded from https://academic.oup.com/nar/article-abstract/41/3/1936/2902702by gueston 16 March 2018
1. Keren,H., Lev-Maor,G. and Ast,G. (2010) Alternative splicingand evolution: diversification, exon definition and function.Nat. Rev. Genet., 11, 345–355.
2. Ozsolak,F., Kapranov,P., Foissac,S., Kim,S.W., Fishilevich,E.,Monaghan,A.P., John,B. and Milos,P.M. (2010) Comprehensivepolyadenylation site maps in yeast and human reveal pervasivealternative polyadenylation. Cell, 143, 1018–1029.
3. Pan,Q., Shai,O., Lee,L.J., Frey,B.J. and Blencowe,B.J. (2008)Deep surveying of alternative splicing complexity in the humantranscriptome by high-throughput sequencing. Nat. Genet., 40,1413–1415.
4. Wang,E.T., Sandberg,R., Luo,S., Khrebtukova,I., Zhang,L.,Mayr,C., Kingsmore,S.F., Schroth,G.P. and Burge,C.B. (2008)Alternative isoform regulation in human tissue transcriptomes.Nature, 456, 470–476.
5. Filichkin,S.A., Priest,H.D., Givan,S.A., Shen,R., Bryant,D.W.,Fox,S.E., Wong,W.K. and Mockler,T.C. (2010) Genome-widemapping of alternative splicing in Arabidopsis thaliana. GenomeRes, 20, 45–58.
6. Pauws,E., van Kampen,A.H., van de Graaf,S.A., de Vijlder,J.J.and Ris-Stalpers,C. (2001) Heterogeneity in polyadenylationcleavage sites in mammalian mRNA sequences: implications forSAGE analysis. Nucleic Acids Res., 29, 1690–1694.
7. Iseli,C., Stevenson,B.J., de Souza,S.J., Samaia,H.B.,Camargo,A.A., Buetow,K.H., Strausberg,R.L., Simpson,A.J.,Bucher,P. and Jongeneel,C.V. (2002) Long-range heterogeneity atthe 3’ ends of human mRNAs. Genome Res., 12, 1068–1074.
8. Derti,A., Garrett-Engele,P., Macisaac,K.D., Stevens,R.C.,Sriram,S., Chen,R., Rohl,C.A., Johnson,J.M. and Babak,T. (2012)A quantitative atlas of polyadenylation in five mammals. GenomeRes., 22, 1173–1183.
9. Mangone,M., Manoharan,A.P., Thierry-Mieg,D., Thierry-Mieg,J.,Han,T., Mackowiak,S.D., Mis,E., Zegar,C., Gutwein,M.R.,Khivansara,V. et al. (2010) The landscape of C. elegans 3’UTRs.Science, 329, 432–435.
10. Wu,X., Liu,M., Downie,B., Liang,C., Ji,G., Li,Q.Q. andHunt,A.G. (2011) Genome-wide landscape of polyadenylation inArabidopsis provides evidence for extensive alternativepolyadenylation. Proc. Natl Acad. Sci. USA, 108, 12533–12538.
11. Shen,Y., Ji,G., Haas,B.J., Wu,X., Zheng,J., Reese,G.J. andLi,Q.Q. (2008) Genome level analysis of rice mRNA 3’-endprocessing signals and alternative polyadenylation. Nucleic AcidsRes., 36, 3150–3161.
12. Kalsotra,A. and Cooper,T.A. (2011) Functional consequencesof developmentally regulated alternative splicing. Nat. Rev.Genet., 12, 715–729.
13. Gilmartin,G.M. (2005) Eukaryotic mRNA 3’ processing: acommon means to different ends. Genes Dev., 19, 2517–2521.
14. Melamud,E. and Moult,J. (2009) Stochastic noise in splicingmachinery. Nucleic Acids Res., 37, 4873–4886.
15. Sorek,R., Shamir,R. and Ast,G. (2004) How prevalent isfunctional alternative splicing in the human genome? TrendsGenet., 20, 68–71.
16. Pickrell,J.K., Pai,A.A., Gilad,Y. and Pritchard,J.K. (2010) Noisysplicing drives mRNA isoform diversity in human cells. PLoSGenet., 6, e1001236.
and Sucgang,R. (2005) Comparing the Dictyostelium andEntamoeba genomes reveals an ancient split in the Conosalineage. PLoS Comput. Biol., 1, e71.
19. Loftus,B., Anderson,I., Davies,R., Alsmark,U.C., Samuelson,J.,Amedeo,P., Roncaglia,P., Berriman,M., Hirt,R.P., Mann,B.J.et al. (2005) The genome of the protist parasite Entamoebahistolytica. Nature, 433, 865–868.
20. Loftus,B.J. and Hall,N. (2005) Entamoeba: still more to belearned from the genome. Trends Parasitol., 21, 453.
21. Lorenzi,H.A., Puiu,D., Miller,J.R., Brinkac,L.M., Amedeo,P.,Hall,N. and Caler,E.V. (2010) New assembly, reannotation andanalysis of the Entamoeba histolytica genome reveal new genomic
features and protein content information. PLoS Negl. Trop. Dis.,4, e716.
22. Zamorano,A., Lopez-Camarillo,C., Orozco,E., Weber,C.,Guillen,N. and Marchat,L.A. (2008) In silico analysis of EST andgenomic sequences allowed the prediction of cis-regulatoryelements for Entamoeba histolytica mRNA polyadenylation.Comput. Biol. Chem., 32, 256–263.
24. Davis,P.H., Schulze,J. and Stanley,S.L. Jr (2007) Transcriptomiccomparison of two Entamoeba histolytica strains with definedvirulence phenotypes identifies new virulence factor candidatesand key differences in the expression patterns of cysteineproteases, lectin light chains, and calmodulin. Mol. Biochem.Parasitol., 151, 118–128.
25. Aurrecoechea,C., Barreto,A., Brestelli,J., Brunk,B.P., Caler,E.V.,Fischer,S., Gajria,B., Gao,X., Gingle,A., Grant,G. et al. (2011)AmoebaDB and MicrosporidiaDB: functional genomic resourcesfor Amoebozoa and Microsporidia species. Nucleic Acids Res., 39,D612–D619.
26. Lorenzi,H., Thiagarajan,M., Haas,B., Wortman,J., Hall,N. andCaler,E. (2008) Genome wide survey, discovery and evolutionof repetitive elements in three Entamoeba species. BMCGenomics, 9, 595.
27. Langmead,B., Trapnell,C., Pop,M. and Salzberg,S.L. (2009)Ultrafast and memory-efficient alignment of short DNAsequences to the human genome. Genome Biol., 10, R25.
28. Dimon,M.T., Sorber,K. and DeRisi,J.L. (2010) HMMSplicer: atool for efficient and sensitive discovery of known and novelsplice junctions in RNA-Seq data. PLoS One, 5, e13875.
29. Shapiro,M.B. and Senapathy,P. (1987) RNA splice junctions ofdifferent classes of eukaryotes: sequence statistics and functionalimplications in gene expression. Nucleic Acids Res., 15, 7155–7174.
30. Crooks,G.E., Hon,G., Chandonia,J.M. and Brenner,S.E. (2004)WebLogo: a sequence logo generator. Genome Res., 14, 1188–1190.
32. Lee,J.Y., Park,J.Y. and Tian,B. (2008) Identification of mRNApolyadenylation sites in genomes using cDNA sequences, expressedsequence tags, and Trace. Methods Mol. Biol., 419, 23–37.
33. Trapnell,C., Pachter,L. and Salzberg,S.L. (2009) TopHat:discovering splice junctions with RNA-Seq. Bioinformatics, 25,1105–1111.
34. Trapnell,C., Roberts,A., Goff,L., Pertea,G., Kim,D., Kelley,D.R.,Pimentel,H., Salzberg,S.L., Rinn,J.L. and Pachter,L. (2012)Differential gene and transcript expression analysis of RNA-seqexperiments with TopHat and Cufflinks. Nat. Protoc., 7, 562–578.
35. Le,S., Josse,J. and Husson,F. (2008) FactoMineR: An R packagefor multivariate analysis. J. Stat. Softw., 25, 1–18.
36. Boyle,E.I., Weng,S., Gollub,J., Jin,H., Botstein,D., Cherry,J.M.and Sherlock,G. (2004) GO::TermFinder–open source software foraccessing gene ontology information and finding significantlyenriched Gene Ontology terms associated with a list of genes.Bioinformatics, 20, 3710–3715.
38. Chen,F., MacDonald,C.C. and Wilusz,J. (1995) Cleavage sitedeterminants in the mammalian polyadenylation signal. NucleicAcids Res., 23, 2614–2620.
39. Bhattacharya,A., Satish,S., Bagchi,A. and Bhattacharya,S. (2000)The genome of Entamoeba histolytica. Int. J. Parasitol., 30,401–410.
40. Bracha,R., Nuchamowitz,Y. and Mirelman,D. (2002) Amoebaporeis an important virulence factor of Entamoeba histolytica.J. Biosci., 27, 579–587.
41. Skandalis,A., Frampton,M., Seger,J. and Richards,M.H. (2010)The adaptive significance of unproductive alternative splicing inprimates. RNA, 16, 2014–2022.
42. Tian,B., Hu,J., Zhang,H. and Lutz,C.S. (2005) A large-scaleanalysis of mRNA polyadenylation of human and mouse genes.Nucleic Acids Res., 33, 201–212.
1952 Nucleic Acids Research, 2013, Vol. 41, No. 3
Downloaded from https://academic.oup.com/nar/article-abstract/41/3/1936/2902702by gueston 16 March 2018