1 SCIENTIFIC REPORTS | 6:25101 | DOI: 10.1038/srep25101 www.nature.com/scientificreports Quantification of topological features in cell meshes to explore E-cadherin dysfunction Tânia Mestre 1,* , Joana Figueiredo 2,3,* , Ana Sofia Ribeiro 2,3 , Joana Paredes 2,3,4 , Raquel Seruca 2,3,4 & João Miguel Sanches 1 In cancer, defective E-cadherin leads to cell detachment, migration and metastization. Further, alterations mediated by E-cadherin dysfunction affect cell topology and tissue organization. Herein, we propose a novel quantitative approach, based on microscopy images, to analyse abnormal cellular distribution patterns. We generated undirected graphs composed by sets of triangles which accurately reproduce cell positioning and structural organization within each image. Network analysis was developed by exploring triangle geometric features, namely area, edges length and formed angles, as well as their variance, when compared with the respective equilateral triangles. We generated synthetic networks, mimicking the diversity of cell-cell interaction patterns, and evaluated the applicability of the selected metrics to study topological features. Cells expressing wild-type E-cadherin and cancer-related mutants were used to validate our strategy. Specifically, A634V, R749W and P799R cancer-causing mutants present more disorganized spatial distribution when compared with wild-type cells. Moreover, P799R exhibited higher length and angle distortions and abnormal cytoskeletal organization, suggesting the formation of very dynamic and plastic cellular interactions. Hence, topological analysis of cell network diagrams is an effective tool to quantify changes in cell-cell interactions and, importantly, it can be applied to a myriad of processes, namely tissue morphogenesis and cancer. Cadherins are a superfamily of transmembrane proteins that comprises more than one hundred members in humans, including classical proteins, protocadherins and cadherin-related proteins 1 . e main function of cad- herin receptors lies in their contribution to the preserve cell-cell cohesion in solid tissues of the body 1,2 . Cell-cell adhesion is crucial for the assembly of individual cells and, therefore, responsible for the formation and mainte- nance of the normal epithelia architecture 3 . E-cadherin is the main component of the Adherens Junctions and, as such, the major contributor to adhe- sion mechanisms 4,5 . is transmembrane glycoprotein belongs to the subfamily of classical, also known as type I cadherins, and it is composed by two main structural domains: the extracellular and the cytoplasmic domain 4,5 . e extracellular domain establishes a homophilic binding to other E-cadherin molecules on neighbouring cells, while the cytoplasmic domain assembles with catenins, linking this protein complex to the actin cytosqueleton and, consequently, ensuring a regular epithelia structure 4–8 . e combination of mechanical and signal-transducer properties of E-cadherin is responsible for cell-cell aggregation and suppression of cell invasion, in a process dependent on the presence of Ca 2+ 9,10 . us, given the pivotal role of E-cadherin for epithelia homeostasis, it is not surprising that alterations in E-cadherin expression or structural modifications in its encoding gene (CDH1) can result in loss of cell-cell adhesion and in profound epithelia changes that can culminate in highly invasive and lethal diseases such as cancer 2,5,11,12 . In recent years, a number of quantitative methods to evaluate cellular adhesion abnormalities have been established. Methods such as atomic force microscopy (AFM), fluorescence resonance energy transfer (FRET), fluorescence recovery aſter photobleaching (FRAP), as well as cell aggregation assays have been used to meas- ure the strength of cadherin-dependent adhesion and detect possible disturbances of cell-cell attachment mech- anisms 13–18 . However, aside of being difficult to implement and unable to quantify cell-cell adhesion within 1 Institute for Systems and Robotics, Instituto Superior Técnico, Lisboa, Portugal. 2 Instituto de Investigação e Inovação em Saúde (i3S), Porto, Portugal. 3 Institute of Molecular Pathology and Immunology of the University of Porto (IPATIMUP), Porto, Portugal. 4 Department of Pathology and Oncology, Medical Faculty of the University of Porto, Porto, Portugal. * These authors contributed equally to this work. Correspondence and requests for materials should be addressed to R.S. (email: [email protected]) or J.M.S. (email: [email protected]) Received: 28 January 2016 Accepted: 08 April 2016 Published: 06 May 2016 OPEN
Quantification of topological features in cell meshes to explore E-cadherin dysfunctionTânia Mestre1,*, Joana Figueiredo2,3,*, Ana Sofia Ribeiro2,3, Joana Paredes2,3,4, Raquel Seruca2,3,4 & João Miguel Sanches1
In cancer, defective E-cadherin leads to cell detachment, migration and metastization. Further, alterations mediated by E-cadherin dysfunction affect cell topology and tissue organization. Herein, we propose a novel quantitative approach, based on microscopy images, to analyse abnormal cellular distribution patterns. We generated undirected graphs composed by sets of triangles which accurately reproduce cell positioning and structural organization within each image. Network analysis was developed by exploring triangle geometric features, namely area, edges length and formed angles, as well as their variance, when compared with the respective equilateral triangles. We generated synthetic networks, mimicking the diversity of cell-cell interaction patterns, and evaluated the applicability of the selected metrics to study topological features. Cells expressing wild-type E-cadherin and cancer-related mutants were used to validate our strategy. Specifically, A634V, R749W and P799R cancer-causing mutants present more disorganized spatial distribution when compared with wild-type cells. Moreover, P799R exhibited higher length and angle distortions and abnormal cytoskeletal organization, suggesting the formation of very dynamic and plastic cellular interactions. Hence, topological analysis of cell network diagrams is an effective tool to quantify changes in cell-cell interactions and, importantly, it can be applied to a myriad of processes, namely tissue morphogenesis and cancer.
Cadherins are a superfamily of transmembrane proteins that comprises more than one hundred members in humans, including classical proteins, protocadherins and cadherin-related proteins1. The main function of cad-herin receptors lies in their contribution to the preserve cell-cell cohesion in solid tissues of the body1,2. Cell-cell adhesion is crucial for the assembly of individual cells and, therefore, responsible for the formation and mainte-nance of the normal epithelia architecture3.
E-cadherin is the main component of the Adherens Junctions and, as such, the major contributor to adhe-sion mechanisms4,5. This transmembrane glycoprotein belongs to the subfamily of classical, also known as type I cadherins, and it is composed by two main structural domains: the extracellular and the cytoplasmic domain4,5. The extracellular domain establishes a homophilic binding to other E-cadherin molecules on neighbouring cells, while the cytoplasmic domain assembles with catenins, linking this protein complex to the actin cytosqueleton and, consequently, ensuring a regular epithelia structure4–8. The combination of mechanical and signal-transducer properties of E-cadherin is responsible for cell-cell aggregation and suppression of cell invasion, in a process dependent on the presence of Ca2+ 9,10. Thus, given the pivotal role of E-cadherin for epithelia homeostasis, it is not surprising that alterations in E-cadherin expression or structural modifications in its encoding gene (CDH1) can result in loss of cell-cell adhesion and in profound epithelia changes that can culminate in highly invasive and lethal diseases such as cancer2,5,11,12.
In recent years, a number of quantitative methods to evaluate cellular adhesion abnormalities have been established. Methods such as atomic force microscopy (AFM), fluorescence resonance energy transfer (FRET), fluorescence recovery after photobleaching (FRAP), as well as cell aggregation assays have been used to meas-ure the strength of cadherin-dependent adhesion and detect possible disturbances of cell-cell attachment mech-anisms13–18. However, aside of being difficult to implement and unable to quantify cell-cell adhesion within
1Institute for Systems and Robotics, Instituto Superior Técnico, Lisboa, Portugal. 2Instituto de Investigação e Inovação em Saúde (i3S), Porto, Portugal. 3Institute of Molecular Pathology and Immunology of the University of Porto (IPATIMUP), Porto, Portugal. 4Department of Pathology and Oncology, Medical Faculty of the University of Porto, Porto, Portugal. *These authors contributed equally to this work. Correspondence and requests for materials should be addressed to R.S. (email: [email protected]) or J.M.S. (email: [email protected])
their natural context, these methods also fail in determine the consequences of loss of adhesion within a tissue. Therefore, the development of alternative methods addressing this issue became an urgent need in cell biology field.
In this work, we propose a quantitative imaging tool to detect abnormal epithelial organization, based on 2D in situ microscopy images of cells stained with DAPI. We used cell nucleus staining to create artificial cellular networks, from which we could extract quantitative data regarding cell distribution patterns, intercellular dis-tance and cell-cell contact distortion. To validate the accuracy of our strategy, cells expressing wild-type (WT) E-cadherin and a panel of cancer-related E-cadherin mutants, leading to aberrant E-cadherin expression and impacting adhesion competence were used16,19–25.
ResultsNetwork design. In this work, we developed a quantitative method to evaluate morphological and structural effects of adhesion loss. For that purpose, cell-based graphs (networks) were created using images of DAPI-stained cells and connecting triplets of neighbouring cells. An efficient analytical pipeline for the network was then developed and validated in a well-known model of loss of cell adhesiveness15,16,20–23,26–32.
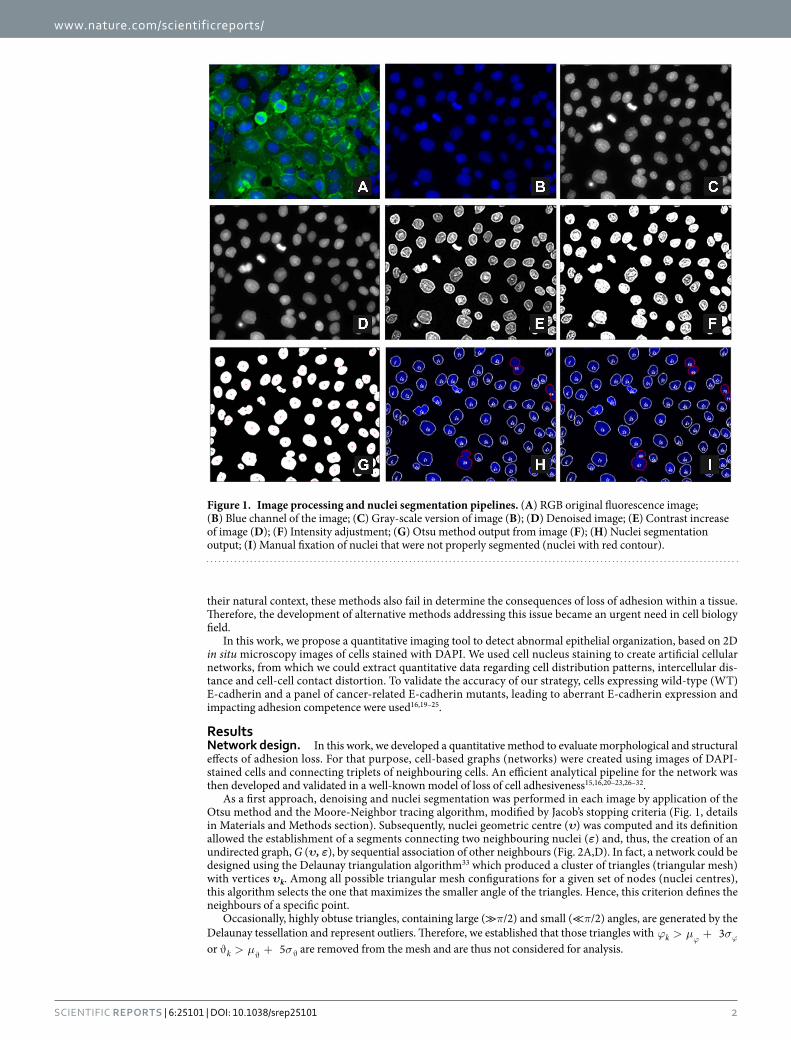
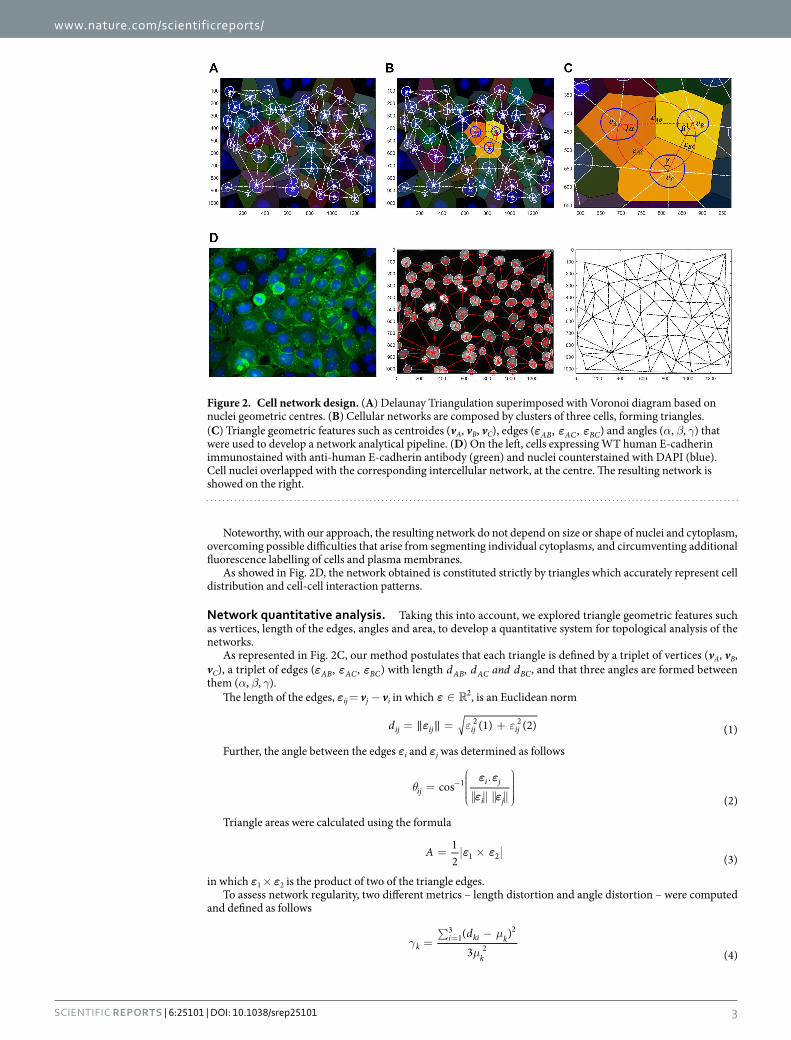
As a first approach, denoising and nuclei segmentation was performed in each image by application of the Otsu method and the Moore-Neighbor tracing algorithm, modified by Jacob’s stopping criteria (Fig. 1, details in Materials and Methods section). Subsequently, nuclei geometric centre (υ) was computed and its definition allowed the establishment of a segments connecting two neighbouring nuclei (ε) and, thus, the creation of an undirected graph, G (υ, ε), by sequential association of other neighbours (Fig. 2A,D). In fact, a network could be designed using the Delaunay triangulation algorithm33 which produced a cluster of triangles (triangular mesh) with vertices υk. Among all possible triangular mesh configurations for a given set of nodes (nuclei centres), this algorithm selects the one that maximizes the smaller angle of the triangles. Hence, this criterion defines the neighbours of a specific point.
Occasionally, highly obtuse triangles, containing large (≫π/2) and small (≪ π/2) angles, are generated by the Delaunay tessellation and represent outliers. Therefore, we established that those triangles with ϕ µ σ> +ϕ ϕ3k or µ σϑ > +ϑ ϑ5k are removed from the mesh and are thus not considered for analysis.
Figure 1. Image processing and nuclei segmentation pipelines. (A) RGB original fluorescence image; (B) Blue channel of the image; (C) Gray-scale version of image (B); (D) Denoised image; (E) Contrast increase of image (D); (F) Intensity adjustment; (G) Otsu method output from image (F); (H) Nuclei segmentation output; (I) Manual fixation of nuclei that were not properly segmented (nuclei with red contour).
Noteworthy, with our approach, the resulting network do not depend on size or shape of nuclei and cytoplasm, overcoming possible difficulties that arise from segmenting individual cytoplasms, and circumventing additional fluorescence labelling of cells and plasma membranes.
As showed in Fig. 2D, the network obtained is constituted strictly by triangles which accurately represent cell distribution and cell-cell interaction patterns.
Network quantitative analysis. Taking this into account, we explored triangle geometric features such as vertices, length of the edges, angles and area, to develop a quantitative system for topological analysis of the networks.
As represented in Fig. 2C, our method postulates that each triangle is defined by a triplet of vertices (vA, vB, vC), a triplet of edges (ε ε ε, ,AB AC BC) with length d d and d,AB AC BC, and that three angles are formed between them (α, β, γ).
The length of the edges, εij = vj − vi in which ε ∈ 2, is an Euclidean norm
ε ε ε= = +‖ ‖d (1) (2) (1)ij ij ij ij2 2
Further, the angle between the edges εi and εj was determined as follows
ε ε
ε εθ =
.
−
cos(2)
iji j
i j
1
Triangle areas were calculated using the formula
ε ε= ×A 12 (3)1 2
in which ε1 × ε2 is the product of two of the triangle edges.To assess network regularity, two different metrics – length distortion and angle distortion – were computed
and defined as follows
γµ
µ=∑ −= d( )
3 (4)k
i ki k
k
13 2
2
Figure 2. Cell network design. (A) Delaunay Triangulation superimposed with Voronoi diagram based on nuclei geometric centres. (B) Cellular networks are composed by clusters of three cells, forming triangles. (C) Triangle geometric features such as centroides (vA, vB, vC), edges (ε ε ε, ,AB AC BC) and angles (α, β, γ) that were used to develop a network analytical pipeline. (D) On the left, cells expressing WT human E-cadherin immunostained with anti-human E-cadherin antibody (green) and nuclei counterstained with DAPI (blue). Cell nuclei overlapped with the corresponding intercellular network, at the centre. The resulting network is showed on the right.
Here, k = 1… NT, being NT the total number of triangles of a mesh, and µ = ∑ = dk i ki13 1
3 , the mean length of the triangle edges.γk measures the length variance of the kth triangle when compared to the ideal equilateral triangle, for which
γk = 0. This metric is invariant to the size of triangles due the term µk2 at the denominator. Similarly, ϕk measures
the variance of the angles in comparison with an equilateral shape.Overall, our strategy proposes four parameters to characterize the cell-based networks: i) edges length (dij); ii)
triangle area (Ai); iii) length distortion (γk); and iv) angle distortion (ϕk).
Synthetic networks reflect the diversity of cell spatial distribution. In order to test the sensitivity of our parameters for evaluation of cellular connection patterns, synthetic networks were generated and distorted under controlled conditions.
Mimicking the networks derived from the fluorescence microscopy images, these synthetic networks were strictly composed by triangles and the distribution of the nodes was performed based on a pre-defined number of points (#56) in a plane, in such way that the final size of these synthetic planes would correspond to the size of the microscopy images (Fig. 3A). Subsequently, random alterations of the original nodes (pk) were imposed as follows
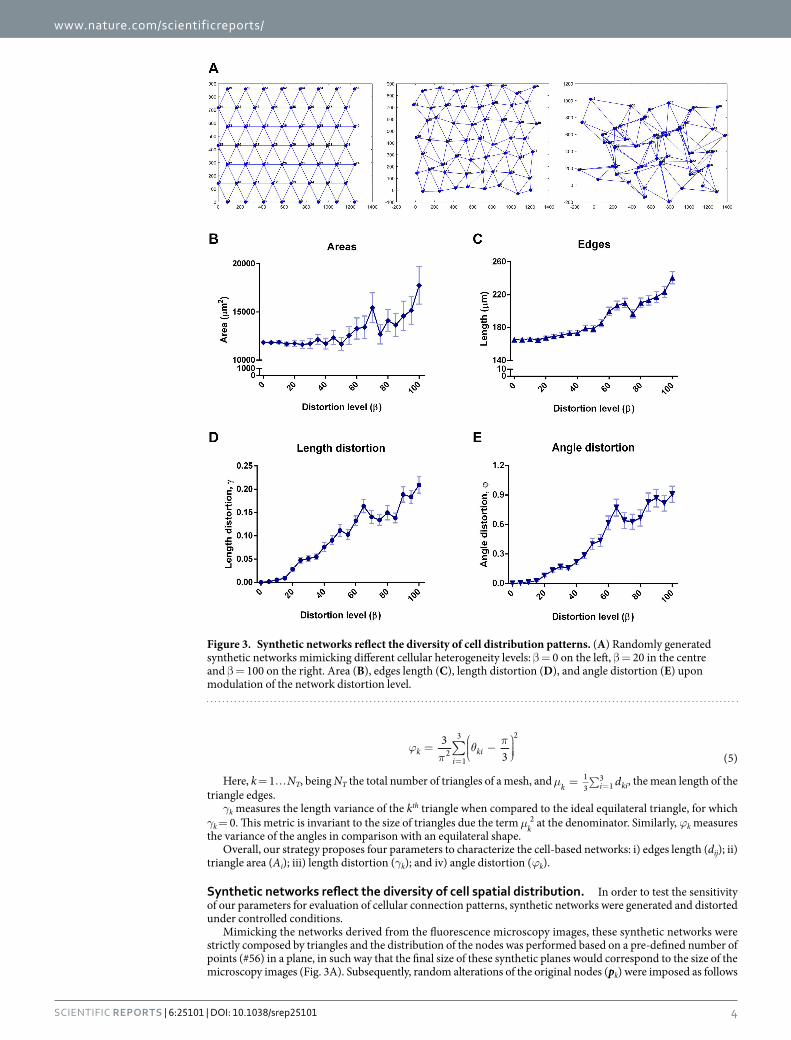
Figure 3. Synthetic networks reflect the diversity of cell distribution patterns. (A) Randomly generated synthetic networks mimicking different cellular heterogeneity levels: β = 0 on the left, β = 20 in the centre and β = 100 on the right. Area (B), edges length (C), length distortion (D), and angle distortion (E) upon modulation of the network distortion level.
Here, η ~ N(μ, I) is a bivariate Gaussian distribution with zero mean (μ = [0 0]T) and a 2 × 2 identity covar-iance matrix. β is the parameter used to control the distortion level of the network. A homogeneous network is characterized by β = 0 and the most heterogeneous network displays β = 100 (Fig. 3A).
We verified that higher levels of distortion correlate with increased areas and edges length (distances), as well as with higher length and angle distortions, resembling a more heterogeneous and disorganized pattern of cell-cell connections (Fig. 3B–E).
E-cadherin pathogenic mutations induce higher cellular heterogeneity and abnormal epithelia organization. To test whether our method was able to detect abnormal organizational states as a consequence of adhesion deficiency, we applied our strategy to 2D in situ images of cells transfected with WT E-cadherin and three loss-of-function mutants (A634V, R749W and P799R; Fig. 4A)19–21,23.
Despite of an identical epithelia appearance of mutant and WT cell lines under normal culture conditions, immunofluorescence staining and cell-cell aggregation assays demonstrated that all mutants impair normal E-cadherin membranous expression and cell-cell compaction – both remarkable features of cell-cell adhesion dysfunction – corroborating previous results (Fig. 4B and C upper panel)16,20–22,25.
As observed in Fig. 4C, the generated networks were able to accurately replicate the distribution pattern of cells. Further, we verified that mutant networks display a more scatter and disorganized phenotype when compared with the regular appearance of the WT network. In fact, network data analysis showed that all E-cadherin mutants present statistically significant higher triplet areas and internuclear distances than the WT E-cadherin-expressing cells (p < 0.0001, Fig. 5A,B). The mean area of the mutants A634V, R749W and P799R was respectively 2115, 1979 and 2098 μ m2, while the area of WT cells was 1526 μ m2 (Fig. 5A). Moreover, the WT cells are spaced 62.61 μ m in average from each other, whereas the internuclear distance of A634V mutant was 73.77 μ m, R749W was 71.79 μ m and P799R displayed a mean distance of 73.82 μ m. These results indicate that, when compared with WT cells, E-cadherin mutants are loosely attached and present an extended cytoplasm which is suggestive of loss of polarity and increased ability for membrane protrusion formation.
Interestingly, we verified that the P799R mutant, affecting the intracellular portion of E-cadherin close to the β -catenin binding domain, present statistically significant higher length distortion (γk, p = 0.0069) and angle dis-tortion (ϕk, p = 0.016), which are associated to a more irregular networks and disorganized epithelial structures (Fig. 5C,D). By contrast, the extracellular mutant A634V and the juxtamembrane mutant R749W showed less evident length and angle distortions, when compared with the WT counterpart.
These results strongly suggest that E-cadherin mutant P799R present major alterations in cellular organization patterns and we hypothesize that this effect could be due to its inability to bind the actin cytosqueleton. Indeed, by performing the actin staining of P799R and WT cells, we could observe a marked difference in the cytoskel-eton structure of both cell types (Fig. 5E). In the presence of the P799R mutation, there is an increased number of stress fibres that span the whole length of the cell, suggesting a stronger and expanded cell-matrix attachment.
Taken together, these findings demonstrate that our analytical strategy applied to cell-based networks is an effective tool to detect and quantify changes in cell-cell interaction and cell distribution patterns that result from E-cadherin loss of function.
DiscussionCell-cell adhesion regulates almost all cellular functions by controlling polarity, cell division, intracellular organ-ization and tissue structure3,34. Loss of adherence is therefore a crucial step for cancer progression by its strong contribution for loss of differentiated characteristics and increased cell invasive capabilities12.
In this work, we propose a quantitative approach, based on 2D in situ images, to analyse abnormal cellular distribution patterns that arise as a consequence of loss of cell-cell adhesion mediated by E-cadherin dysfunction. For that purpose, images of cells stained with DAPI were used, enabling the creation of intercellular networks composed by sets of triangles which accurately reproduce cell positioning (geometrical centre of each nuclei) and organization (connection with neighbouring cells/nuclei) in each image (Fig. 6). The processing pipeline applied to each image was composed by a denoising algorithm, followed by contrast and intensity adjustments, nuclei seg-mentation and geometric cell centres computation, and finally graph construction. An automatically-generated network was thus obtained and further explored.
We established a protocol for quantitative analysis of the network taking advantage of geometric features regarding triangles, namely the area, the length of the edges and the formed angles, as well as their variance, when compared with equilateral triangles (length distortion and angle distortion). The applicability of these parameters was then tested in synthetic networks distorted under controlled conditions, mimicking the diversity of cell-cell interaction patterns and cell spatial distribution of real cell cultures. We found that modelling of distortion parameter allows the generation of more heterogeneous and disordered networks, characterized by higher areas and triangle edges, as well as increased distance and angle variances. These events clearly epitomize episodes of cell-cell adhesion impairment in which cells lose polarity and, consequently, present decreased height, extended cytoplasm and increased cell-matrix interaction (basal cell surface)35–37.
A well-known model of adhesion dysfunction, induced by pathogenic E-cadherin mutations associated to hereditary diffuse gastric cancer, was used to validate this hypothesis16,21,25,28–30,32,38–40. Cells expressing WT or different E-cadherin mutants were subjected to our analytical pipeline, and clear differences were found between their distribution patterns. All the mutant networks present a more disorganized spatial distribution when com-pared with that of the WT cells. In addition, higher triangle areas and edges were produced by the connection of mutant cells.
Interestingly, the P799R mutation, affecting the cytoplasmic domain of E-cadherin, also exhibited higher dis-tance and angle distortions when compared with the WT cell line, suggesting the formation of very dynamic and plastic cellular interactions. In fact, we have previously demonstrated that this mutant affects the binding
Figure 4. E-cadherin pathogenic mutations generate abnormal patterns of cell distribution. (A) Illustration of E-cadherin structure and organization. E-cadherin mature protein comprises a large extracellular domain composed by 5 cadherin repeats, a transmembrane segment and a cytoplasmic domain. The cytoplasmic domain of E-cadherin bridges the actin cytoskeleton through a complex of proteins including p120-, β - and α -catenins. The location of the germline E-cadherin mutations used in this study is represented. (B) Phase contrast microscopy images of CHO cells stably transfected with the WT, A634V, R749W or P799R hE-cadherin. Cell–cell aggregation ability is showed below. The images shown are representative of three independent experiments. (C) In the upper panel, immunofluorescence images of WT and A634V, R749W or P799R cells showing aberrant E-cadherin expression of mutants. E-cadherin is labeled in green and nuclei are counterstained with DAPI (blue). In the middle panel, cell nuclei overlapped with the corresponding network. Final networks from WT and mutant E-cadherin cells are presented in the lower panel.
of E-cadherin to PIPKIγ , a fundamental regulator of E-cadherin function and trafficking, compromising cad-herin stability at the plasma membrane16,32,41. An unstable cadherin/catenin complex cannot link the actin cytoskeleton and, as a result, cells lose their polarity, change their epithelial appearance and acquire motile abili-ties5,9,42. Accordingly, we have showed that P799R cells display an abnormal cytoskeletal organization, suggestive
Figure 5. E-cadherin dysfunctional cells display longer and more heterogeneous intercellular connections than the WT E-cadherin cells. Cellular networks obtained from cells expressing WT and mutant E-cadherin were quantitatively analyzed regarding triplet area (A), edges length (B), length distortion (C) and angle distortion (D). Graphs show the average ± SE, and *represents p ≤ 0.05, **p ≤ 0.01, ***p ≤ 0.001 and ****p ≤ 0.0001. (E) FITC-conjugated phalloidin staining of F-actin in WT and P799R expressing cells and the corresponding networks.
of increased cell-matrix interactions. This cascade effect can even culminate with an abnormal activation of cancer-related signalling such as RTK (receptor tyrosine kinase), WNT and RHO GTPases pathways5,9,19,32,42.
Despite not being a direct measure of adhesiveness, the study of cellular distribution, through creation of artificial networks, revealed to be very sensitive concerning functional consequences of adhesion loss. Contrarily, assays such as atomic force microscopy (AFM), dual micropipette assay (DPA), fluorescence resonance energy transfer (FRET) and fluorescence recovery after photobleaching (FRAP) provide direct measures of contact strength, however the results do not represent what is observed in real tissues or cell cultures, as these techniques require artificial constructs, specific extracellular matrices or can only be applied in single cell stages13.
Different bioimaging tools have been developed to study cell adhesion patterns but so far they were only able to distinguish abrupt phenotype changes. Nawrocki-Raby B. and collaborators proposed an original system to quantify the spatiotemporal collective behavior of different bronchial and mammary epithelial cell lines by using time-lapse videomicroscopy images and graphical geometrical methods43. Nonetheless, the authors could only recognize two gross phenotypes among ten different cell lines: a group of highly cohesive cells with a cluster-type spatial distribution, and a second group of very dispersed cells with random spatial distribution43. More recently, others have developed a method to characterize cell organization in light microscopy section images of wood44. Using a classical Watershed algorithm, it was possible to evaluate cell density and directional arrangements dur-ing tissue development and growth, but quantitative data extracted was scarce and poorly explored44. In this
Figure 6. Scheme representing the application of cellular networks to detect cell-cell adhesion dysfunction. (A) Cells expressing WT or a pathogenic mutant form of E-cadherin constitute, respectively, well-established models of adhesion competence and impairment. (B) Networks from both cell populations can be generated based on in situ fluorescence microscopy images of cells with nuclear staining. (C) The resulting networks, strictly composed by triangular shapes, are quantitatively analysed and changes in cell-cell connection and cell distribution patterns can be easily identified.
regard, our method brings new advances to the field since it combines an improved sensitivity to subtle adhesion alterations and an innovative quantitative approach to capture them. In addition, the use of nuclei geometrical centers to generate cell-based graphs is a huge advantage since there is no need for segmenting individual cyto-plasms or additional fluorescence labelling of cells and plasma membranes.
Overall, our findings demonstrated that the analysis of cell network diagrams detect and quantify changes in cell-cell connection and cell distribution patterns elicited by E-cadherin dysfunction. Furthermore, this new approach proved to be an easy, fast and reliable technique that can be applied to a wide range of cellular condi-tions involving cell-cell interactions, maintaining their natural tissue context.
Materials and MethodsCell Culture. Chinese Hamster Ovary (CHO) cells (ATCC number: CCL-61, Barcelona, Spain) stably trans-fected with vectors encoding the WT or the E-cadherin mutants A634V, R749W and P799R, as previously described16, were maintained at 37 °C under 5% CO2 humidified air, in α -MEM (+ ) medium (Gibco, Invitrogen) supplemented with 10% fetal bovine serum (HyClone, Perbio), 1% penicillin/streptomycin (Gibco, Invitrogen) and 5 μ g/ml blasticidin (Gibco, Invitrogen).
Fluorescence Staining. Cells were seeded on 6-well plates on top of glass coverslips and grown to at least 80% confluence. Fixation was performed in ice-cold methanol for 20 minutes, followed by washing and blocking in 5% bovine serum albumin (BSA) in phosphate buffered saline (PBS) for 30 minutes, at room temperature. To determine the pattern of E-cadherin expression in WT and mutant cells, the mouse monoclonal E-cadherin antibody (BD Biosciences) was used at 1:300 dilution in PBS with BSA 5%, and incubated for 1 hour at room temperature. An Alexa Fluor 488 goat anti-mouse (1:500, Invitrogen) was applied for 1 hour in dark, as secondary antibody. The coverslips were mounted on slides using Vectashield (Vector Laboratories) with DAPI. For F-actin staining, cells were fixed in 4% paraformaldehyde (4 °C for 30 minutes) and FITC-conjugated phalloidin (Sigma) was used at 1:500 dilution. Acquisitions were made on a Carl Zeiss Apotome Axiovert 200M Fluorescence Microscope system (Carl Zeiss, Jena, Germany), using × 40 objectives and fixed illumination. Images were cap-tured with an Axiocam HRm camera and the Zeiss Axion Vision 4.8 software.
Slow aggregation assay. Cell-cell adhesive properties of cells expressing WT and mutant E-cadherin were assessed by slow aggregation assays as described previously21. Wells of a 96-well-plate were coated with 50 ml of an agar solution: 100 mg Bacto-Agar (BD Biosciences) in 15 ml of sterile PBS. Upon agar solidification, 200 μ l of a cellular suspension with 1× 10⁵ cells/ml were seeded in each well (corresponding to 2 × 10⁴ cells/well). Experimental conditions were always performed in triplicate. The plate was then incubated at 37 °C, in a humid-ified atmosphere with 5% CO2, for 48 h. Aggregation was evaluated under an inverted microscope and photo-graphed with a Nikon (Tokyo, Japan) digital camera.
Image processing. A pre-processing pipeline was applied to 2D in situ images in order to remove noise, increase contrast and adjust the dynamic range of image intensities (Fig. 1 and Supplemental Figure S1). Denoising was performed as described previously, assuming a Poissonian model for pixel intensity45. This algo-rithm, designed in a Bayesian framework, uses a Log-Total Variation prior favouring piecewise constant solutions for nuclei mask estimation and segmentation purposes. To reduce blur and enhance the contrast between the nuclei and the background, the denoised image was then sharpen by high passing filtering. Finally, image inten-sity was scaled to reinforce the bi-modality of its histogram and assist the segmentation procedure. A limiting saturation step was applied, in which the highest (Iij > 0.5) and lowest (Iij < 0.1) intensities were saturated at the maximum (Iij = 1) and at the minimum (Iij = 0), respectively. The central range of intensities (0.1 < Iij < 0.5), corresponding to transition pixels, was expanded leading to a quasi-binary result. A final binary mask with the non-segmented nuclei was obtained using the classical Otsu method46. Small black regions (Iij = 0) and connected components (white regions) that have fewer than N = 60 pixels were removed.
Nuclei segmentation. The segmentation of each nucleus was performed by computing the contours of the connected components using the Moore-Neighbor tracing algorithm, modified by Jacob’s stopping criteria46. Each nucleus contour (k), was represented by a sorted list of nk coordinates, defined as follows
≤ <x n y n n n[ ( ), ( )], 0 (7)k k k
The contour was subsequently filled to produce a binary mask bk,
=b b i j{ ( , )} (8)k k
in which
=
∈b i j I k nucleusotherwise
( , ) 10 (9)
kij
th
This was obtained using the poly2mask function of the image processing toolbox from MatLab. Nuclei not properly segmented were manually fixed. The geometric centres of the segmented nuclei, υ ∈k
2, were also computed and calculated from bk as follows
Statistical Analysis. Quantitative parameters of WT and E-cadherin mutant cells were statistically analysed using Mann-Whitney tests from GraphPad Prism software. In all analysis p < 0.05 was required for statistical significance.
References1. Wheelock, M. J. & Johnson, K. R. Cadherins as modulators of cellular phenotype. Annu Rev Cell Dev Biol 19, 207–235, doi: 10.1146/
annurev.cellbio.19.011102.111135 (2003).2. Berx, G. & van Roy, F. Involvement of members of the cadherin superfamily in cancer. Cold Spring Harb perspect biol 1, a003129, doi:
10.1101/cshperspect.a003129 (2009).3. Green, K. J., Getsios, S., Troyanovsky, S. & Godsel, L. M. Intercellular junction assembly, dynamics, and homeostasis. Cold Spring
Harb perspect biol 2, a000125, doi: 10.1101/cshperspect.a000125 (2010).4. van Roy, F. & Berx, G. The cell-cell adhesion molecule E-cadherin. Cell Mol Life Sci 65, 3756–3788, doi: 10.1007/s00018-008-8281-1
(2008).5. Paredes, J. et al. Epithelial E- and P-cadherins: role and clinical significance in cancer. Biochim Biophys Acta 1826, 297–311, doi:
10.1016/j.bbcan.2012.05.002 (2012).6. Aberle, H., Schwartz, H. & Kemler, R. Cadherin-catenin complex: protein interactions and their implications for cadherin function.
J Cell Biochem 61, 514–523, doi: 10.1002/(SICI)1097-4644(19960616)61:4< 514::AID-JCB4> 3.0.CO;2-R (1996).7. Ozawa, M., Baribault, H. & Kemler, R. The cytoplasmic domain of the cell adhesion molecule uvomorulin associates with three
independent proteins structurally related in different species. EMBO J 8, 1711–1717 (1989).8. Yap, A. S., Niessen, C. M. & Gumbiner, B. M. The juxtamembrane region of the cadherin cytoplasmic tail supports lateral clustering,
adhesive strengthening, and interaction with p120ctn. J Cell Biol 141, 779–789 (1998).9. Cavallaro, U. & Christofori, G. Cell adhesion and signalling by cadherins and Ig-CAMs in cancer. Nat Rev Cancer 4, 118–132, doi:
10.1038/nrc1276 (2004).10. Shapiro, L. et al. Structural basis of cell-cell adhesion by cadherins. Nature 374, 327–337, doi: 10.1038/374327a0 (1995).11. Carneiro, P. et al. E-cadherin dysfunction in gastric cancer–cellular consequences, clinical applications and open questions. FEBS
lett 586, 2981–2989, doi: 10.1016/j.febslet.2012.07.045 (2012).12. Jeanes, A., Gottardi, C. J. & Yap, A. S. Cadherins and cancer: how does cadherin dysfunction promote tumor progression? Oncogene
27, 6920–6929, doi: 10.1038/onc.2008.343 (2008).13. Kashef, J. & Franz, C. M. Quantitative methods for analyzing cell-cell adhesion in development. Dev biol 401, 165–174, doi:
10.1016/j.ydbio.2014.11.002 (2015).14. Boterberg, T., Bracke, M. E., Bruyneel, E. A. & Mareel, M. M. Cell aggregation assays. Methods Mol Med 58, 33–45, doi: 10.1385/1-
59259-137-X:033 (2001).15. Suriano, G. et al. The intracellular E-cadherin germline mutation V832 M lacks the ability to mediate cell-cell adhesion and to
suppress invasion. Oncogene 22, 5716–5719, doi: 10.1038/sj.onc.1206672 (2003).16. Figueiredo, J. et al. The importance of E-cadherin binding partners to evaluate the pathogenicity of E-cadherin missense mutations
associated to HDGC. Eur J Hum Genet: EJHG 21, 301–309, doi: 10.1038/ejhg.2012.159 (2013).17. Canel, M. et al. Quantitative in vivo imaging of the effects of inhibiting integrin signaling via Src and FAK on cancer cell movement:
effects on E-cadherin dynamics. Cancer Res 70, 9413–9422, doi: 10.1158/0008-5472.CAN-10-1454 (2010).18. Bajpai, S. et al. {alpha}-Catenin mediates initial E-cadherin-dependent cell-cell recognition and subsequent bond strengthening.
Proc Natl Acad Sci USA 105, 18331–18336, doi: 10.1073/pnas.0806783105 (2008).19. Mateus, A. R. et al. EGFR regulates RhoA-GTP dependent cell motility in E-cadherin mutant cells. Hum Mol Genet 16, 1639–1647,
doi: 10.1093/hmg/ddm113 (2007).20. Suriano, G. et al. E-cadherin germline missense mutations and cell phenotype: evidence for the independence of cell invasion on the
motile capabilities of the cells. Hum Mol Genet 12, 3007–3016, doi: 10.1093/hmg/ddg316 (2003).21. Suriano, G. et al. Identification of CDH1 germline missense mutations associated with functional inactivation of the E-cadherin
protein in young gastric cancer probands. Hum Mol Genet 12, 575–582 (2003).22. Simoes-Correia, J. et al. Endoplasmic reticulum quality control: a new mechanism of E-cadherin regulation and its implication in
cancer. Hum Mol Genet 17, 3566–3576, doi: 10.1093/hmg/ddn249 (2008).23. Kaurah, P. et al. Founder and recurrent CDH1 mutations in families with hereditary diffuse gastric cancer. JAMA 297, 2360–2372,
doi: 10.1001/jama.297.21.2360 (2007).24. Keller, G. et al. Germline mutations of the E-cadherin(CDH1) and TP53 genes, rather than of RUNX3 and HPP1, contribute to
genetic predisposition in German gastric cancer patients. J Med Genet 41, e89 (2004).25. Sanches, J. M. et al. Quantification of mutant E-cadherin using bioimaging analysis of in situ fluorescence microscopy. A new
approach to CDH1 missense variants. Eur J Hum Genet: EJHG 23, 1072–1079, doi: 10.1038/ejhg.2014.240 (2015).26. Guilford, P. et al. E-cadherin germline mutations in familial gastric cancer. Nature 392, 402–405, doi: 10.1038/32918 (1998).27. Simoes-Correia, J. et al. E-cadherin destabilization accounts for the pathogenicity of missense mutations in hereditary diffuse gastric
cancer. PLoS One 7, e33783, doi: 10.1371/journal.pone.0033783 (2012).28. Oliveira, C., Pinheiro, H., Figueiredo, J., Seruca, R. & Carneiro, F. E-cadherin alterations in hereditary disorders with emphasis on
hereditary diffuse gastric cancer. Prog Mol Biol Transl Sci 116, 337–359, doi: 10.1016/B978-0-12-394311-8.00015-7 (2013).29. Corso, G. et al. E-cadherin germline mutation carriers: clinical management and genetic implications. Cancer Metastasis Rev 33,
1081–1094, doi: 10.1007/s10555-014-9528-y (2014).30. van der Post, R. S. et al. Hereditary diffuse gastric cancer: updated clinical guidelines with an emphasis on germline CDH1 mutation
carriers. J Med Genet 52, 361–374, doi: 10.1136/jmedgenet-2015-103094 (2015).31. Zhang, L. et al. The germline CDH1 c.48 G > C substitution contributes to cancer predisposition through generation of a pro-
invasive mutation. Mutat Res 770, 106–111, doi: 10.1016/j.mrfmmm.2014.10.001 (2014).32. Figueiredo, J. & Seruca, J. Germline missense mutants in hereditary diffuse gastric cancer. Spot Fam Hered Gastric Cancer 7, 77–86,
doi: 10.1007/978-94-007-6570-2_7 (2013).33. Okabe, A., Boots, B., Sugihara, K., Chiu, S. N. & Kendall, D. G. Definitions and Basic Properties of Voronoi Diagrams, in Spatial
Tessellations: Concepts and Applications of Voronoi Diagrams. John Wiley & Sons, 43–112 (2000).34. Baum, B. & Georgiou, M. Dynamics of adherens junctions in epithelial establishment, maintenance, and remodeling. J Cell Biol 192,
907–917, doi: 10.1083/jcb.201009141 (2011).35. DuFort, C. C., Paszek, M. J. & Weaver, V. M. Balancing forces: architectural control of mechanotransduction. Nat Rev Mol Cell Biol
36. Weber, G. F., Bjerke, M. A. & DeSimone, D. W. Integrins and cadherins join forces to form adhesive networks. J Cell Sci 124, 1183–1193, doi: 10.1242/jcs.064618 (2011).
37. Royer, C. & Lu, X. Epithelial cell polarity: a major gatekeeper against cancer? Cell Death Differ 18, 1470–1477, doi: 10.1038/cdd.2011.60 (2011).
38. Oliveira, C., Pinheiro, H., Figueiredo, J., Seruca, R. & Carneiro, F. Familial gastric cancer: genetic susceptibility, pathology, and implications for management. Lancet Oncol 16, e60–70, doi: 10.1016/S1470-2045(14)71016-2 (2015).
39. Suriano, G. et al. Characterization of a recurrent germ line mutation of the E-cadherin gene: implications for genetic testing and clinical management. Clin Cancer Res 11, 5401–5409, doi: 10.1158/1078-0432.CCR-05-0247 (2005).
40. Brooks-Wilson, A. R. et al. Germline E-cadherin mutations in hereditary diffuse gastric cancer: assessment of 42 new families and review of genetic screening criteria. J Med Genet 41, 508–517 (2004).
41. Ling, K. et al. Type Igamma phosphatidylinositol phosphate kinase modulates adherens junction and E-cadherin trafficking via a direct interaction with mu 1B adaptin. J Cell Biol 176, 343–353, doi: 10.1083/jcb.200606023 (2007).
42. Christofori, G. New signals from the invasive front. Nature 441, 444–450, doi: 10.1038/nature04872 (2006).43. Nawrocki Raby, B. et al. Quantitative cell dispersion analysis: new test to measure tumor cell aggressiveness. Int J Cancer 93, 644–652
(2001).44. Brunel, G., Borianne, P., Subsol, G., Jaeger, M. & Caraglio, Y. Automatic Characterization of the Cell Organization in Light
Microscopic Images of Wood: Application to the Identification of the Cell File. IEEE 4th Intern Symp Plant Growth Model Simul Visual Applications 58–65, doi: 10.1109/PMA.2012.6524813 (2012).
45. Rodrigues, I. C. & Sanches, J. M. Convex total variation denoising of Poisson fluorescence confocal images with anisotropic filtering. IEEE Trans Image Process: IEEE Signal Process Society 20, 146–160, doi: 10.1109/TIP.2010.2055879 (2011).
46. Gonzalez, R. C., Woods, R. E. & Eddins, S. L. Digital Image Processing Using MATLAB. Prentice Hall, 624 (2003).
AcknowledgementsThis work was financed by FEDER - Fundo Europeu de Desenvolvimento Regional funds through the COMPETE 2020 - Operacional Programme for Competitiveness and Internationalisation (POCI), Portugal 2020, and by Portuguese funds through FCT - Fundação para a Ciência e a Tecnologia/Ministério da Ciência, Tecnologia e Inovação in the framework of the project “Institute for Research and Innovation in Health Sciences” (POCI-01-0145-FEDER-007274), as well as the projects PTDC/BIM-ONC/0171/2012, PTDC/BIM-ONC/0281/2014, PTDC/BBB-IMG/0283/2014 and Post-Doctoral grants SFRH/BPD/87705/2012-JF and SFRH/BPD/75705/2011-ASR. We acknowledge the Programa IFCT (FCT Investigator) for funding JP research and the American Association of Patients with Hereditary Gastric Cancer “No Stomach for Cancer” for funding the project “Today’s present, tomorrow’s future on the study of germline E-cadherin missense mutations”. We also thank Dr. Cecília Durães for assistance in statistical analyses and Dr. Ana Rita Mateus for technical support regarding F-actin staining.
Author ContributionsT.M. and J.F. performed the experiments, analyzed the data and wrote the manuscript. A.S.R. participated in the acquisition and analysis of data. J.P. analyzed the data and contributed to the design of the project and manuscript preparation. R.S. and J.M.S. were responsible for the conception and design of the experimental system, the analysis and interpretation of data, and the review of the manuscript. All authors approved the manuscript final version.
Additional InformationSupplementary information accompanies this paper at http://www.nature.com/srepCompeting financial interests: The authors declare no competing financial interests.How to cite this article: Mestre, T. et al. Quantification of topological features in cell meshes to explore E-cadherin dysfunction. Sci. Rep. 6, 25101; doi: 10.1038/srep25101 (2016).
This work is licensed under a Creative Commons Attribution 4.0 International License. The images or other third party material in this article are included in the article’s Creative Commons license,
unless indicated otherwise in the credit line; if the material is not included under the Creative Commons license, users will need to obtain permission from the license holder to reproduce the material. To view a copy of this license, visit http://creativecommons.org/licenses/by/4.0/