Ma et al. Future Cities and Environment (2015) 1:7 DOI 10.1186/s40984-015-0005-8
TECHNICAL ARTICLE Open Access
Quantify the energy and environmentalbenefits of implementing energy-efficiencymeasures in China’s iron and steel productionDing Ma1,2,3, Wenying Chen1,2* and Tengfang Xu3,4*
Abstract
As one of the most energy-, emission- and pollution-intensive industries, iron and steel production is responsiblefor significant emissions of greenhouse gas (GHG) and air pollutants. Although many energy-efficiency measureshave been proposed by the Chinese government to mitigate GHG emissions and to improve air quality, lacking fullunderstanding of the costs and benefits has created barriers against implementing these measures widely. Thispaper sets out to advance the understanding by addressing the knowledge gap in costs, benefits, and cost-effectiveness of energy-efficiency measures in iron and steel production. Specifically, we build a new evaluationframework to quantify energy benefits and environmental benefits (i.e., CO2 emission reduction, air-pollutantsemission reduction and water savings) associated with 36 energy-efficiency measures. Results show that inclusion ofbenefits from CO2 and air-pollutants emission reduction affects the cost-effectiveness of energy-efficiency measuressignificantly, while impacts from water-savings benefits are moderate but notable when compared to the effects byconsidering energy benefits alone. The new information resulted from this study should be used to augment futureprograms and efforts in reducing energy use and environmental impacts associated with steel production.
Keywords: Iron and steel; Energy-efficiency measure; Energy benefits; Environmental benefits; Cost effectiveness
IntroductionChina is currently facing significant challenges in energyuse, and emissions of associated air pollutants and carbonemissions. Controlling emissions of air pollutants and CO2
not only is important for protecting the environment, butalso is essential for achieving sustainability in thecountry’s economic and societal development. Accord-ing to International Energy Agency (IEA), more thanone-third of global energy consumption and 36 % ofCO2 emissions are attributable to manufacturing indus-tries (IEA, 2007). According to the 5th Assessment Report(AR5) of the Intergovernmental Panel on Climate Change(IPCC), greenhouse gas (GHG) emissions from industry(30 % of total global GHG emissions) arise mainly frommaterial processing. For example, production of iron andsteel and nonmetallic minerals results in 44 % of all
* Correspondence: [email protected]; [email protected] Center for Contemporary Management (RCCM), TsinghuaUniversity, 100084 Beijing, China3Lawrence Berkeley National Laboratory, 1 Cyclotron Road, 94720 Berkeley,CA, USAFull list of author information is available at the end of the article
industrial CO2 emissions (IPCC, 2014). The crude steelproduction in China was 731 Million tonnes (Mt) in 2012,accounting for half of the world’s total annual production(WSA, 2013). With such a high level of production andrelated energy consumption and CO2 emissions, China’siron and steel industry must play an important role in thecountry’s energy savings and emission reduction programs(Wang 2014b).To improve energy efficiency and mitigate CO2 emis-
sions, Chinese governments have implemented many effi-ciency measures since the last decade. During the 11th andthe 12th Five Year Plan (FYP), the National Developmentand Reform Commission (NDRC) released a series ofNational Extension Directories of Important EnergyConservation Technology (NDRC, 2008, 2009, 2011a,2011b, 2012, 2013); the Ministry of Industry and Infor-mation Technology (MIIT) established the Energy Sav-ings and Emission Reduction Information Platform andreleased the Guidebook of Advanced and ApplicableEnergy Savings and Emission Reduction Technologies inIron and Steel Industry in 2012 (MIIT, 2012a, 2012b).
distributed under the terms of the Creative Commons Attribution Licensehich permits unrestricted use, distribution, and reproduction in any medium,.
Ma et al. Future Cities and Environment (2015) 1:7 Page 2 of 13
In addition, NDRC, MIIT and the Ministry of Environ-mental Protection (MEP) jointly issued the Cleaner Pro-duction Evaluation System for the Iron and Steel Industryin 2012 (MEP, 2013). These government agencies pro-posed about 60 energy-saving and emission-reductionmeasures for the iron and steel industry collectively. Al-though many of the measures have been proposed, lackingfull understanding of costs and benefits has created bar-riers against implementing these measures widely. It is im-portant to evaluate cost effectiveness of energy-efficiencymeasures and select the most suitable and cost effectivemeasures for implementation.
Literature reviewDeveloping bottom-up energy system models and energyconservation supply curves (CSC) are two commonmethods for quantitative analyses of specific energy-efficiency measures. With the bottom-up modeling method,Wen et al. (2014) applied the AIM model to estimate thepotentials of energy conservation and CO2 mitigation inChina’s iron and steel industry during 2010–2020. Xu et al.(2014) and Karali et al. (2014) used the ISEEM model toanalyze the roles of energy-efficiency measures in achievingspecific carbon reduction targets in the same industry ofU.S. Chen et al. (2014) also applied the China-TIMESmodel to study the carbon mitigation strategies and corre-sponding impacts. Using the CSC method, Morrow et al.(2014) analyzed 25 energy-efficiency measures applicable toIndia’s iron and steel industry. Earlier, Hasanbeigi et al.(2013) assessed the costs of energy savings and emission re-ductions from applying energy-efficiency measures in theChina’s iron and steel sector. Recently, Li and Zhu (2014)also estimated the costs of energy savings and CO2 emis-sion reduction in China’s iron and steel production. Thesepapers report important works for specific energy-efficiencymeasures of iron and steel industry; however, knowledgegaps still exist. On one hand, detailed analyses of energy-efficiency measures promoted by the Chinese governmentduring the 11th and the 12th FYP are limited in those stud-ies; on the other hand, the majority of these studies onlyquantify energy-savings benefits, whereas non-energy bene-fits are neglected, such as carbon-emission mitigation, air-pollutants reduction, and water savings that are veryimportant for China’s sustainable development.From a macro-perspective, inclusion of non-energy bene-
fits would result in reducing costs and improving cost-effectiveness of energy-efficiency measures, thus influencethe assessment of cost-effective potentials (Worrell et al.,2003). There are many types of non-energy benefits, suchas: (1) saved water and minimized wastes, (2) reducedGHG emissions, (3) reduced air pollutant emissions, (4)saved labor and time, (5) improved working environment(Worrell et al., 2003; Lung et al., 2005; IEA, 2012). Giventhe limitations, uncertainties, and challenges of quantifying
non-energy benefits, this study focused on three types ofenvironmental benefits, namely the carbon emission reduc-tion, the air pollutants reduction, and the water-savingsbenefits. This paper aims to advance the understanding ofcosts, benefits, and cost-effectiveness of energy-efficiencymeasures in China’s iron and steel industry, by includingboth energy- and environmental benefits.
Overview of China’s iron and steel productionChina’s iron and steel industry has grown rapidly in recentdecades. The rapid growth has been attributed largely toincreasing domestic demand; this growth is expected tocontinue in the coming years. During 1996–2012, China’scrude steel production increased from 107 to 731 Mt; itscorresponding share of world steel production increasedfrom 13.5 to 50.0 %. Additionally, China’s iron and steelindustry made great progress in improving energy effi-ciency during the past decade. Average intensity of totalenergy use in key steel enterprises decreased from 761kgce (kilogram of coal equivalent)/tonne steel in 2004 to592 kgce/tonne in 2013. From 2004 to 2013, energy inten-sity of iron-making process decreased from 466 to 398kgce/tonne iron; BOF (Basic oxygen furnace) process de-creased from 26.6 to negative 7.7 kgce/tonne; and EAF(Electric arc furnace) process decreased from 209.9 to60.8 kgce/tonne. Large “efficiency gap” still exists betweenthe lowest and the highest energy intensity enterprises, asshown in Table 1 (Wang 2005, 2009, 2011, 2014a, 2014b).
MethodologyIn order to quantify energy and environmental benefitsof implementing energy-efficiency measures in China’siron and steel production, and to evaluate their impactson cost effectiveness of the measures, we use the com-piled data and information from literature reviews anddeveloped a new evaluation framework in this paper, asshown in Fig. 1.
Data collection and basic assumptionThe analysis for China’s iron and steel industry is basedon both international and Chinese technologies. Manyenergy-efficiency measures promoted by NDRC andMIIT are used in this analysis because other studies donot provide consistent and comprehensive data onenergy-savings, emission-reduction, or associated costsof different energy-efficiency measures (NDRC, 2008,2009, 2011a, 2011b, 2012, 2013; MIIT, 2012a, 2012b).We use 2012 as the base year because that was the latest
year for which energy and environmental data have beenpublished by China’s national statistical agencies at the timeof this study. Data on total production of different productsare obtained from China Iron and Steel Association (CISA,2013) and the World Steel Association (WSA, 2013). Forestimating the adoption rates and technology availability of
Table 1 Process primary energy intensity for Chinese key steel enterprises (kgce/tonne)
Sintering Pelleting Coking Iron-making BOF EAF Rolling Integrated energy consumption
The average primary energy intensity of key steel enterprises by process (kgce per tonne of product)
2004 66.4 42.0 142.2 466.2 26.6 209.9 92.9 761.0
2007 55.2 30.1 121.7 426.8 6.0 81.3 63.1 628.0
2010 52.7 29.4 105.9 407.8 −0.2 74.0 61.7 604.6
2013 49.1 28.3 100.5 398.1 −7.7 60.8 59.5 592.0
Lowest primary energy intensity of key steel enterprises by process (kgce per tonne of product)
2004 52.1 19.2 88.1 395.4 −3.8 146.3 53.7 -
2007 38.0 18.2 82.8 377.9 −16.1 46.7 28.2 -
2010 43.1 17.6 63.6 343.2 −13.3 27.5 25.9 -
2013 35.4 14.5 59.2 320.0 −23.6 21.9 32.3 -
Highest primary energy intensity of key steel enterprises by process (kgce per tonne of product)
2004 108.6 83.3 229.2 591.8 75.2 325.5 286.9 -
2007 85.3 51.3 434.6 569.3 38.0 171.6 220.7 -
2010 66.8 45.5 188.3 502.8 29.1 221.33 255.7 -
2013 56.8 44.9 154.6 474.0 14.9 176.6 209.5 -
Note: Negative value means this process can produce additional energy, such as converter gas
Ma et al. Future Cities and Environment (2015) 1:7 Page 3 of 13
different measures, we developed a questionnaire and sentit to several experts in the Chinese iron and steel industry.Additionally, we obtained data from two recent reports:Key Industrial Energy-efficient and Emission ReductionTechnologies and Measures (MIIT, 2012b) and RoadmapStudy on Achieving Technical Energy Conservation Poten-tial in China’s Industrial Sector by 2020 (ERI, 2013).The carbon emission factors for fuels used for calculat-
ing CO2 emissions from energy consumption are taken
Fig. 1 Evaluation framework for quantifying energy and environmental ben
from the IPCC Guidelines for National Greenhouse GasInventories (IPCC, 2007). The emissions factor for elec-tricity in 2012 is assumed to be 0.77 kg CO2/kWh (NBS,2013a). Given most of the fossil fuels used in the China’siron and steel industry are coal and coke, we use theweighted average CO2 emission factor for coal and cokeconsumed in the iron and steel industry in 2012 as theCO2 emission factor for fuel in this research, which isapproximately 83.8 kg CO2/GJ (NBS, 2013a). In the
efits
Ma et al. Future Cities and Environment (2015) 1:7 Page 4 of 13
processes of steel production and power generation, thereare usually air pollution removal facilities, such as desulfur-ization equipment and de-nitrification equipment. For sim-plicity, we estimate the air pollutant emission factors basedon the emissions and energy consumption in steel andpower sectors, which are approximately 5 kg/tce and1,654 kg/GWh for SO2, 2 kg/tce and 2,114 kg/GWhfor NOx, and 4 kg/tce and 462 kg/GWh for PM10
(NBS, 2013a, 2013b). Additionally, we assume that im-pacts from interactions among energy efficiency mea-sures are minimal, i.e., measures are analyzed as if theywere implemented separately. For this reason and toavoid overestimation of total cumulative energy-savingpotential, we have used the lower end of energy-savingrange that was available for each energy-efficiencymeasure. We also estimate the average water coeffi-cients (i.e., water volumes per energy production unit)based on published water factors in fuel production,and power generation processes, as shown in Table 2.The average unit price of electricity is assumed to be
120 $/MWh (SERC, 2011), while the average unit priceof thermal coal for industrial use is approximately 111$/tonne in 2012, which is used as the fuel price in thisreport (CCTD, 2013). To convert costs reported in RMBto US dollars, we use an average exchange rate of 6.31RMB/US$ (CFETS, 2013).
Estimate energy savings, emission reductions, and watersavingsThe technical potential of fuel savings and electricity sav-ings from energy-efficiency measure j can be calculatedusing Eq. (1) and Eq. (2), respectively
SFj ¼ Pi⋅ 100%−kj� �
⋅TAj⋅RFj; in GJ ð1Þ
SEj ¼ Pi⋅ 100%−kj� �
⋅TAj⋅REj; in kWh ð2Þ
Where
Table 2 Summary of water coefficients in fuel production and powe
Type Unit Wa
Coal production m3/TJ 4.0
Coke production m3/TJ 0.0
Nature gas production m3/TJ 0.0
Crude oil production m3/TJ 44
Unconventional Oil production m3/TJ 6.0
Uranium m3/TJ 2.0
Thermal power m3/MWh 2.8
Nuclear power m3/MWh 2.6
Wind Power m3/MWh 0.0
PV power m3/MWh 0.1
SFj = technical potential of fuel savings from measure j(GJ);SEj = technical potential of electricity savings from
measure j (kWh);Pi = production in step i (Mt);kj = current adoption rate of measure j (%);TAj = technology availability of measure j, the extent
to which the remaining adoption potential of the tech-nology in Chinese iron and steel industry;RFj = specific fuel savings for measure j (GJ/Mt-pro-
duction i);REj = specific electricity savings for measure j (kWh/
Mt-production i).The air pollutants considered in this study are SO2, NOx,
and PM10, without considering PM2.5 because of a lack ofreliable emission and cost data for PM2.5. Reduction of pol-lutant emissions (CO2, SO2, NOx, and PM10) correspondingto measure j can be calculated using Eq. (3).
RCj ¼ SFj⋅EF1 þ SEj⋅EF2; in tonne ð3Þ
WhereRCj = emissions reduction corresponding to measure j,
tonne;EF1 = direct emission coefficient of fuels (tonne/GJ);EF2 = indirect emission coefficient of electricity
(tonne/kWh).Water withdrawal is an important indicator for the iron
and steel industry and power industry (NDRC 2013). Inthis study, we only consider energy related water savings,based on the energy savings and water coefficients, asshown in Eq. (4).
WSj ¼ SFj⋅WF1 þ SEj⋅WF2 ð4Þ
WhereWSj = total water savings due to measure j (m3);WF1 = average water withdrawal coefficient for fuel
production (m3/GJ);
r generation processes
ter coefficient Data source
Hejazi et al. (2014)
2 Pan et al. (2012)
1 Hejazi et al. (2014)
.0 Hejazi et al. (2014)
Hejazi et al. (2014)
Hejazi et al. (2014)
5 Pan et al. (2012)
McMahon and Price (2011); Li et al. (2012)
04 Li et al. (2012); Davis et al. (2013)
Davis et al. (2013)
Ma et al. Future Cities and Environment (2015) 1:7 Page 5 of 13
WF2 = average water withdrawal coefficient for powergeneration (m3/kWh).
Quantify the benefits and evaluate the cost-effectivenessTo quantify the emission reduction benefits, we use theconcept of an air pollutant (AP) price index, as shown inEq. (5) (Mao et al., 2012; 2014).
AP ¼ A⋅RCCO2 þ B⋅RCSO2 þ C⋅RCNOx þ D⋅RCPM10; in
ð5Þ
WhereRCC02, RCSO2, RCNOx, and RCPM10 represents the
emission reduction of CO2, SO2, NOx, and PM10, re-spectively, in tonne.A, B, C, and D is the price weighting factor of CO2,
SO2, NOx, and PM10, respectively, in $/tonne.A is the average carbon price, based on historical trading
volumes and trading turnovers in China’s seven regionalcarbon markets, i.e., Beijing, Shanghai, Tianjin, Shenzhen,Guangdong, Hubei, and Chongqing (WHECA, 2014). Asthere are no trading markets for air pollutants in China, weuse external environmental damage cost as the weightingfactors of SO2, NOx, and PM10 (Zhang et al., 2007; Maoet al., 2012). The price weighting factors are listed inTable 3.In this study, we define the carbon abatement cost for
a specific measure as the change of total costs dividedby the CO2 reduction potentials, as shown in Eq. (6).
cj ¼Pi⋅ 1−kj
� �⋅TAj⋅
Ij⋅r1− 1þrð Þ−nð Þ þ ΔOMj
h i−Bj
RCCO2;jð6Þ
Wherecj = carbon abatement cost for an energy-efficiency
measure j ($/tonne);Pi = production in step i (Mt);kj = current adoption rate of measure j (%);TAj = technology availability of measure j, the extent
to which the remaining adoption potential of the tech-nology in Chinese iron and steel industry;Ij = change in total capital investment for an energy-
efficiency measure j ($/tonne);ΔOMj = change in non-energy annual operation and
maintenance cost for measure j ($/tonne);
Table 3 Price weighting factors for CO2 and air pollutant emissions
Price weighting factors Zhang et al. (2007) Yang et al. (2013)
CO2 ($/tonne) (WHECA, 2014) - -
SO2 ($/tonne) 1006.1 3680.0
NOx ($/tonne) 902.0 2438.0
PM10 ($/tonne) 7720.0 2623.9
r = discount rate (15 %), it should be noted that thechoice of the discount rate depends on the purpose andapproach of the analysis (prescriptive versus descriptive)used (Hasanbeigi et al., 2013).n = lifetime (years);Bj = benefits of measure j ($), include energy benefits
(i.e., reduced energy costs) and environmental benefits(i.e., emission reduction benefits and reduced watercosts);RCCO2, j = annual reduction of CO2 emissions for meas-
ure j.The cost-effectiveness for specific measure is deter-
mined by the carbon abatement cost: A negative cost cjmeans the measure j is cost-effective.If we consider the change in measure cost and energy-
savings benefits only, Eq. (6) becomes the following
c1 ¼P⋅ 1−kð Þ⋅TA⋅ I⋅r
1− 1þrð Þ−nð Þ þ ΔOMh i
−p1⋅SF−p2⋅SE
RCCO2
ð7Þ
If we consider the change in measure cost, energy-savings benefits, and carbon-reduction benefits, Eq. (6)becomes the following:
c2 ¼P⋅ 1−kð Þ⋅TA⋅ I⋅r
1− 1þrð Þ−nð Þ þ ΔOMh i
−p1⋅SF−p2⋅SE−AP
RCCO2
ð8Þ
If we consider the change in measure cost, energy-savings benefits, and environmental benefits (CO2 andair pollutant emission reduction benefits and water sav-ings), Eq. (6) becomes the following:
c3 ¼P⋅ 1−kð Þ⋅TA⋅ I⋅r
1− 1þrð Þ−nð Þ þ ΔOMh i
−p1⋅SF−p2⋅SE−AP−p3⋅WS
RCCO2
ð9Þ
WhereP1 = average fuel price ($/GJ);P2 = average electricity price ($/kWh);AP denotes the total emission reduction benefits; see
Eq. (5);P3 = average water price ($/m3);WS = total water savings (m3).
in the iron and steel industry
Wei and Zhou (2003) Liu et al. (2014) Low Average High
- - 3.5 6.0 11.0
983.0 1056.6 983.0 1682.0 3680.0
1311.5 750.0 750.0 1350.0 2438.0
360.0 1169.5 360.0 2968.0 7720.0
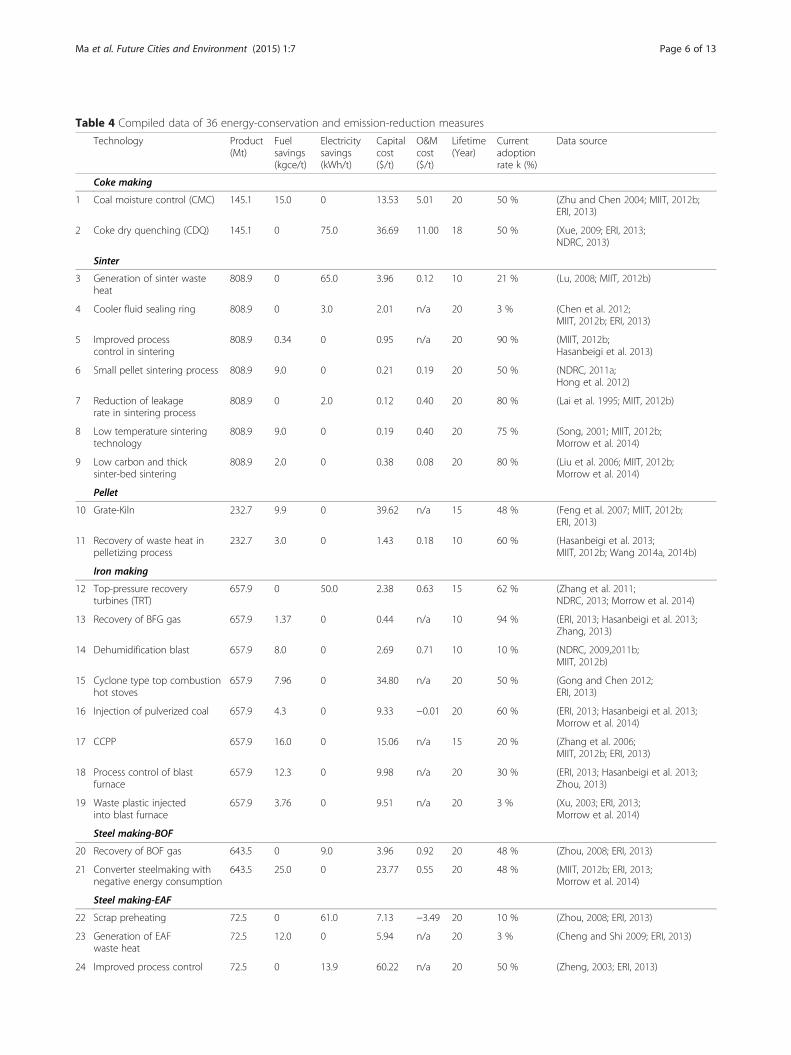
Table 4 Compiled data of 36 energy-conservation and emission-reduction measures
Technology Product(Mt)
Fuelsavings(kgce/t)
Electricitysavings(kWh/t)
Capitalcost($/t)
O&Mcost($/t)
Lifetime(Year)
Currentadoptionrate k (%)
Data source
Coke making
1 Coal moisture control (CMC) 145.1 15.0 0 13.53 5.01 20 50 % (Zhu and Chen 2004; MIIT, 2012b;ERI, 2013)
Ma et al. Future Cities and Environment (2015) 1:7 Page 7 of 13
Typical energy-savings and emission-reduction measuresConsidering data uncertainties and information availabilityfor some measures (e.g., emerging measures), we selected36 energy-efficiency measures for the analyses and presen-tations in this study. Table 4 presents the compiled resultsfrom these measures, including energy savings, capital andchange in O&M costs, adoption rates in 2012, and prod-uct amount for each process in China.
Results and discussionTechnical energy savings and environmental impactsTable 5 summarizes the technical potential of energysavings, emission reduction, and water savings for eachenergy-efficiency measure in China’s iron and steelproduction.For individual measure, the regenerative burner meas-
ure (measure #28) exhibits the largest technical potentialin energy savings (24,734 GWh electricity), emission re-ductions (19.1 Mt CO2, 40.9 kiloton (kt) SO2, 52.3 kt NOx,
and 11.4 kt PM10), and water savings (559.7 million m3);the recovery of BFG gas (measure #13) has the lowesttechnical potential in energy savings (37.7 ktce fuel), emis-sion reductions (0.1 Mt CO2, 0.2 kt SO2, 0.1 kt NOx, and0.1 kt PM10), and water savings (0.1 million m3).
27 energy-saving measures are process technologiesand the other nine measures are technologies for wasteenergy recovery. The 27 measures account for 82.8 % offuel savings and 64.4 % of electricity savings, while theother nine measures are responsible for 17.2 % of fuelsavings and 35.6 % of electricity savings. The largest po-tentials for energy savings and emission reduction comefrom the iron-making processes (27.0 %) and hot-rollingprocesses (25.0 %); the pellet process has the lowest po-tential for emission reduction (about 1.0 %).For the 36 energy-efficiency measures, technical poten-
tial of total energy savings are about 36.5 Mtce fuels and78,659 GWh electricity, corresponding to 7.8 % fuel savingsand 15.1 % electricity savings, respectively. Annual emis-sion reduction is 150.4 Mt CO2, 321.8 kt SO2, 243.7 ktNOx, and 180.0 kt PM10, corresponding to 10.0 %, 13.4 %,25.0 %, and 10.0 % of the total emissions (by type), respect-ively; Water savings are 1,842.2 million m3 (51.5 % of an-nual consumption in the sector).
CO2 abatement cost analysesBased on the main technical cost data (change in capital andO&M costs), and associated benefits (energy savings, emis-sion reduction, and water savings), CO2 abatement costs are
Table 5 Technical potentials of energy savings, emission reduction, and water savings in China’s iron and steel industry (2012)
No. Energy savings Emission reduction (1,000 tonne) Water savings(million m3)Fuel savings (1,000 tce) Electricity savings (GWh) CO2 SO2 NOx PM10
1 761.5 - 1,868 4.0 1.6 3.0 1.3
2 - 3,249 2,512 5.4 6.9 1.5 73.5
3 - 21,716 16,787 35.9 45.9 10.0 491.4
4 - 665 514 1.1 1.4 0.3 15.1
5 115.5 - 283 0.6 0.2 0.5 0.2
6 2,548.2 - 6,251 13.4 5.4 10.0 4.3
7 - 227 175 0.4 0.5 0.1 5.1
8 1,274.1 - 3,125 6.7 2.7 5.0 2.2
9 226.5 - 556 1.2 0.5 0.9 0.4
10 838.5 - 2,057 4.4 1.8 3.3 1.4
11 182.5 - 448 1.0 0.4 0.7 0.3
12 - 8,750 6,764 14.5 18.5 4.0 198.0
13 37.7 - 93 0.2 0.1 0.1 0.1
14 1,473.7 - 3,615 7.7 3.1 5.8 2.5
15 1,832.9 - 4,496 9.6 3.9 7.2 3.1
16 792.1 - 1,943 4.2 1.7 3.1 1.3
17 2,210.5 - 5,422 11.6 4.7 8.7 3.8
18 3,965.2 - 9,727 20.8 8.4 15.7 6.7
19 1,679.6 - 4,120 8.8 3.6 6.6 2.9
20 - 486 376 0.8 1.0 0.2 11.0
21 5,855.9 - 14,364 30.7 12.4 23.1 9.9
22 - 2,786 2,153 4.6 5.9 1.3 63.0
23 529.8 - 1,230 2.8 1.1 2.1 0.9
24 - 775 599 1.3 1.6 0.4 17.5
25 - 1,766 1,365 2.9 3.7 0.8 40.0
26 1,262.6 6,215 7,901 16.9 15.8 7.9 142.8
27 - 6,783 5,243 11.2 14.3 3.1 153.5
28 - 24,734 19,119 40.9 52.3 11.4 559.7
29 5,137.0 - 12,601 26.9 10.9 20.3 8.7
30 2,935.0 - 7,199 15.4 6.2 11.6 4.9
31 102.8 - 252 0.5 0.2 0.4 0.2
32 310.8 91 832 1.8 0.9 1.3 2.6
33 222.0 - 545 1.2 0.5 0.9 0.4
34 1,068.7 - 2,621 5.6 2.3 4.2 1.8
35 502.0 138 1,338 2.9 1.4 2.0 4.0
36 677.0 276 1,874 4.0 2.0 2.8 7.4
Total of 36 measures 36,542.1 78,659 150,440 321.8 243.7 180.0 1,842.2
Total in steel sector in 2012 468,020 522,052 1,510,000 2,410 970 1,810 3,580
Savings (or emission reduction)percentage of the total (%)
7.8 % 15.1 % 10.0 % 13.4 % 25.0 % 10.0 % 51.5 %
Ma et al. Future Cities and Environment (2015) 1:7 Page 8 of 13
Ma et al. Future Cities and Environment (2015) 1:7 Page 9 of 13
calculated for each energy-efficiency measure listed inTable 6.Table 6 indicates that both energy-savings benefits and
environmental benefits have important impacts on theCO2 abatement cost. When only energy-savings benefits
Table 6 Costs, benefits, and carbon abatement costs for individual e
No. Technical cost data (million $) Benefits (million $)
Change incapital cost
Change innon-energyO&M cost
Energy savingsbenefits
CO2 mitigationbenefits
1 147 349 119 11.0
2 239 240 399 14.8
3 273 41 2,670 99.1
4 101 - 82 3.0
5 53 - 18 1.7
6 10 56 397 36.9
7 2 46 28 1.0
8 4 58 198 18.4
9 7 9 35 3.3
10 594 - 131 12.1
11 19 12 28 2.6
12 74 115 1,076 39.9
13 3 - 6 0.6
14 102 136 230 21.3
15 1,324 - 285 26.5
16 284 −2 123 11.5
17 368 - 344 32.0
18 532 - 618 57.4
19 702 - 262 24.3
20 35 52 60 2.2
21 951 134 912 84.8
22 54 −168 343 12.7
23 43 - 83 7.7
24 176 −139 95 3.5
25 147 - 217 8.1
26 58 36 961 46.6
27 213 1,334 834 30.9
28 95 110 3,041 112.8
29 144 - 800 74.4
30 45 - 457 42.5
31 61 33 16 1.5
32 23 6 60 4.9
33 14 - 35 3.2
34 240 - 166 15.5
35 36 - 95 7.9
36 30 62 139 11.1
are considered, the abatement costs range from negative$212/tonne CO2 (measure #22) to $312/tonne CO2 (meas-ure #31); when the emission reduction benefits are consid-ered, the abatement cost is reduced further, ranging fromnegative $227/tonne CO2 (measure #22) to 295 $/tonne
nergy-efficiency measures
CO2
mitigation(kt)
CO2 abatementcost ($/tonne CO2)
Air pollutantreduction benefits
Water savingsbenefits
c1 c2 c3
19.4 1.1 1,868 202 185 185
21.3 53.0 2,512 32 17 −7
142.5 354.5 16,787 −140 −155 −179
4.4 10.9 514 37 22 −2
2.9 0.1 283 125 109 108
64.9 3.1 6,251 −53 −69 −70
1.5 3.7 175 119 105 81
32.4 1.6 3,125 −44 −60 −60
5.8 0.3 556 −34 −50 −51
21.3 1.0 2,057 225 209 208
4.6 0.2 448 6 −10 −11
57.4 142.8 6,764 −131 −146 −170
1.0 0.0 93 −36 −53 −53
37.5 1.8 3,615 2 −14 −14
46.7 2.2 4,496 231 215 214
20.2 1.0 1,943 82 65 65
56.3 2.7 5,422 4 −12 −12
100.9 4.9 9,727 −9 −25 −26
42.8 2.1 4,120 107 91 90
3.2 7.9 376 73 58 34
149.1 7.2 14,364 12 −4 −5
18.3 45.5 2,153 −212 −227 −251
13.5 0.6 1,230 −30 −46 −47
5.1 12.7 599 −97 −112 −136
11.6 28.8 1,365 −52 −66 −90
72.9 103.0 7,901 −110 −125 −140
44.5 110.7 5,243 136 122 98
162.3 403.7 19,119 −148 −163 −187
130.8 6.3 12,601 −52 −68 −69
74.7 3.6 7,199 −57 −74 −74
2.6 0.1 252 312 295 294
8.5 1.9 832 −37 −53 −55
5.7 0.3 545 −37 −54 −55
27.2 1.3 2,621 28 12 11
13.7 2.9 1,338 −44 −60 −63
19.0 5.3 1,874 −25 −41 −45
Ma et al. Future Cities and Environment (2015) 1:7 Page 10 of 13
CO2 (measure #31); when energy and all environmentalbenefits (including emission reduction and water-savings)are included, the abatement costs are reduced more, ran-ging from negative $251/tonne CO2 (measure #22) to 294/tonne CO2 (measure #31) $/tonne CO2.The three individual technologies having the lowest re-
duction cost are scrap preheating (measure #22), regen-erative burners (measure #28), and generation of sinterwaste heat (measure #3), all with negative abatementcost. The three technologies with the highest abatementcosts are heat recovery from hot-rolling (measure #31),cyclone type top combustion hot stoves (measure #15),and Grate-Kiln (measure #10), all with positive costs.
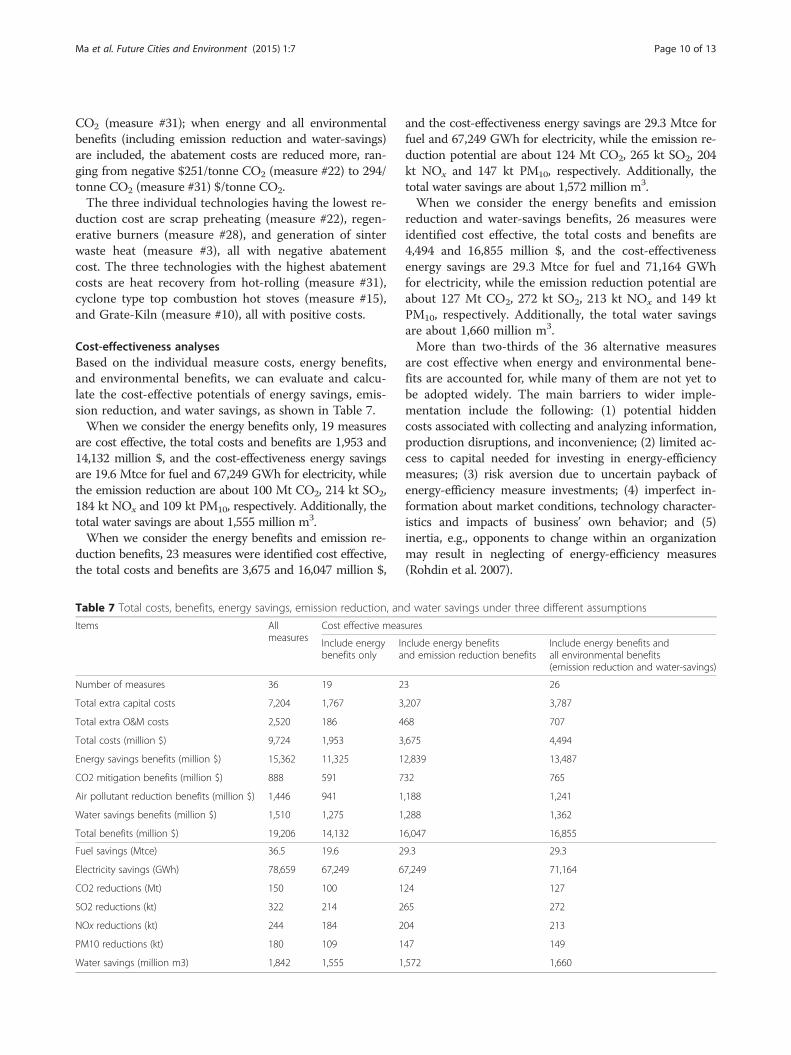
Cost-effectiveness analysesBased on the individual measure costs, energy benefits,and environmental benefits, we can evaluate and calcu-late the cost-effective potentials of energy savings, emis-sion reduction, and water savings, as shown in Table 7.When we consider the energy benefits only, 19 measures
are cost effective, the total costs and benefits are 1,953 and14,132 million $, and the cost-effectiveness energy savingsare 19.6 Mtce for fuel and 67,249 GWh for electricity, whilethe emission reduction are about 100 Mt CO2, 214 kt SO2,184 kt NOx and 109 kt PM10, respectively. Additionally, thetotal water savings are about 1,555 million m3.When we consider the energy benefits and emission re-
duction benefits, 23 measures were identified cost effective,the total costs and benefits are 3,675 and 16,047 million $,
Table 7 Total costs, benefits, energy savings, emission reduction, an
Items Allmeasures
Cost effective meas
Include energybenefits only
Ina
Number of measures 36 19 2
Total extra capital costs 7,204 1,767 3
Total extra O&M costs 2,520 186 4
Total costs (million $) 9,724 1,953 3
Energy savings benefits (million $) 15,362 11,325 1
CO2 mitigation benefits (million $) 888 591 7
Air pollutant reduction benefits (million $) 1,446 941 1
Water savings benefits (million $) 1,510 1,275 1
Total benefits (million $) 19,206 14,132 1
Fuel savings (Mtce) 36.5 19.6 2
Electricity savings (GWh) 78,659 67,249 6
CO2 reductions (Mt) 150 100 1
SO2 reductions (kt) 322 214 2
NOx reductions (kt) 244 184 2
PM10 reductions (kt) 180 109 1
Water savings (million m3) 1,842 1,555 1
and the cost-effectiveness energy savings are 29.3 Mtce forfuel and 67,249 GWh for electricity, while the emission re-duction potential are about 124 Mt CO2, 265 kt SO2, 204kt NOx and 147 kt PM10, respectively. Additionally, thetotal water savings are about 1,572 million m3.When we consider the energy benefits and emission
reduction and water-savings benefits, 26 measures wereidentified cost effective, the total costs and benefits are4,494 and 16,855 million $, and the cost-effectivenessenergy savings are 29.3 Mtce for fuel and 71,164 GWhfor electricity, while the emission reduction potential areabout 127 Mt CO2, 272 kt SO2, 213 kt NOx and 149 ktPM10, respectively. Additionally, the total water savingsare about 1,660 million m3.More than two-thirds of the 36 alternative measures
are cost effective when energy and environmental bene-fits are accounted for, while many of them are not yet tobe adopted widely. The main barriers to wider imple-mentation include the following: (1) potential hiddencosts associated with collecting and analyzing information,production disruptions, and inconvenience; (2) limited ac-cess to capital needed for investing in energy-efficiencymeasures; (3) risk aversion due to uncertain payback ofenergy-efficiency measure investments; (4) imperfect in-formation about market conditions, technology character-istics and impacts of business’ own behavior; and (5)inertia, e.g., opponents to change within an organizationmay result in neglecting of energy-efficiency measures(Rohdin et al. 2007).
d water savings under three different assumptions
ures
clude energy benefitsnd emission reduction benefits
Include energy benefits andall environmental benefits(emission reduction and water-savings)
3 26
,207 3,787
68 707
,675 4,494
2,839 13,487
32 765
,188 1,241
,288 1,362
6,047 16,855
9.3 29.3
7,249 71,164
24 127
65 272
04 213
47 149
,572 1,660
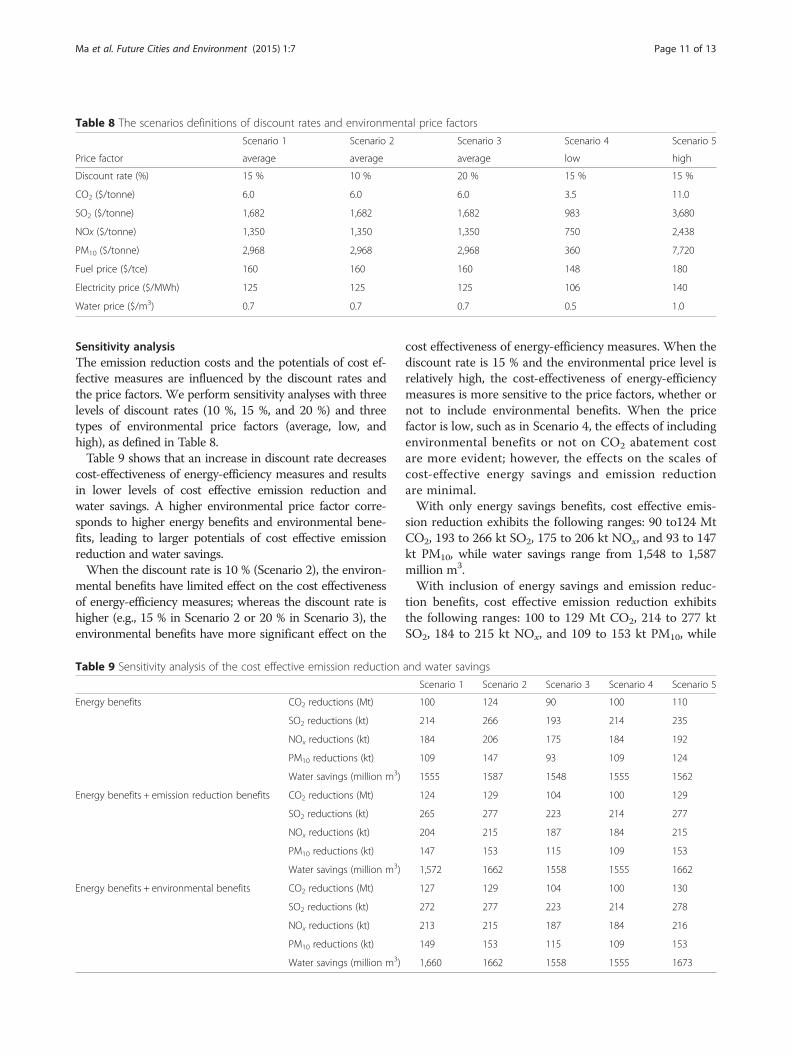
Table 8 The scenarios definitions of discount rates and environmental price factors
Ma et al. Future Cities and Environment (2015) 1:7 Page 11 of 13
Sensitivity analysisThe emission reduction costs and the potentials of cost ef-fective measures are influenced by the discount rates andthe price factors. We perform sensitivity analyses with threelevels of discount rates (10 %, 15 %, and 20 %) and threetypes of environmental price factors (average, low, andhigh), as defined in Table 8.Table 9 shows that an increase in discount rate decreases
cost-effectiveness of energy-efficiency measures and resultsin lower levels of cost effective emission reduction andwater savings. A higher environmental price factor corre-sponds to higher energy benefits and environmental bene-fits, leading to larger potentials of cost effective emissionreduction and water savings.When the discount rate is 10 % (Scenario 2), the environ-
mental benefits have limited effect on the cost effectivenessof energy-efficiency measures; whereas the discount rate ishigher (e.g., 15 % in Scenario 2 or 20 % in Scenario 3), theenvironmental benefits have more significant effect on the
Table 9 Sensitivity analysis of the cost effective emission reduction
Energy benefits CO2 reductions (Mt)
SO2 reductions (kt)
NOx reductions (kt)
PM10 reductions (kt)
Water savings (million m3)
Energy benefits + emission reduction benefits CO2 reductions (Mt)
SO2 reductions (kt)
NOx reductions (kt)
PM10 reductions (kt)
Water savings (million m3)
Energy benefits + environmental benefits CO2 reductions (Mt)
SO2 reductions (kt)
NOx reductions (kt)
PM10 reductions (kt)
Water savings (million m3)
cost effectiveness of energy-efficiency measures. When thediscount rate is 15 % and the environmental price level isrelatively high, the cost-effectiveness of energy-efficiencymeasures is more sensitive to the price factors, whether ornot to include environmental benefits. When the pricefactor is low, such as in Scenario 4, the effects of includingenvironmental benefits or not on CO2 abatement costare more evident; however, the effects on the scales ofcost-effective energy savings and emission reductionare minimal.With only energy savings benefits, cost effective emis-
sion reduction exhibits the following ranges: 90 to124 MtCO2, 193 to 266 kt SO2, 175 to 206 kt NOx, and 93 to 147kt PM10, while water savings range from 1,548 to 1,587million m3.With inclusion of energy savings and emission reduc-
tion benefits, cost effective emission reduction exhibitsthe following ranges: 100 to 129 Mt CO2, 214 to 277 ktSO2, 184 to 215 kt NOx, and 109 to 153 kt PM10, while
Ma et al. Future Cities and Environment (2015) 1:7 Page 12 of 13
cost effective water savings range from 1,555 to 1,662million m3.With inclusion of all environmental benefits (i.e., CO2
emission reduction, air pollutants emission reduction ben-efits, and water savings benefits), cost effective emissionreduction exhibits the following ranges: 100 to 130 MtCO2, 214 to 278 kt SO2, 184 to 216 kt NOx, and 109 to153 kt PM10, while cost effective water savings range from1,555 to 1,673 million m3.
Conclusions and recommendationsIn this paper, we quantify the energy and environmentalbenefits, and evaluate the cost-effectiveness of 36 energy-efficiency measures under different scenarios for Chineseiron and steel industry. The results show that whileenergy-savings benefits are the main driver in reducingthe carbon abatement costs, environmental benefits alsoaffect the cost-effectiveness of the efficiency measures sig-nificantly. Among the environmental benefits, includingemission reduction benefits in calculations reduces thecarbon abatement cost substantially. While the effectsfrom including water-savings benefits are moderate underthe assumptions in this study, such effects may becomemore influential as water price goes up. It is both import-ant and necessary to quantify and monetize environmentalbenefits when evaluating the costs of energy savings andcarbon abatement associated with energy-efficiency mea-sures. Future studies may benefit from including add-itional non-energy benefits.To improve energy efficiency and narrow the “effi-
ciency gap” in iron and steel production addressed inthis paper, we recommend enhancing adoption ofprocess energy-efficiency measures and waste energyrecovery technologies, especially the cost effectivemeasures (e.g., scrap preheating, regenerative burners,and generation of sinter waste heat). We have foundthat more than two-thirds of the 36 efficiency mea-sures are cost effective when energy and environmen-tal benefits are accounted for, while many of them areyet to be adopted more widely. The main barriers towider implementation of cost effective measures arediscussed, including potential hidden, limited accessto capital, risk aversion, imperfect information, etc.Advancing the understanding of cost effectiveness pro-
vides opportunities to diffuse cost barriers against adoptingefficiency measures, and may help to promote effectiveprograms and policies to overcome the barriers, such asdevelopment of energy-efficiency information resources,technical assistance in identifying energy-efficiency mea-sures, and financing programs for efficiency measures. Thenew information resulted from this study should be usedto augment future programs and efforts in reducing en-ergy use and environmental impacts associated withsteel production.
Competing interestsThe authors declare that they have no competing interests.
Authors’ contributions1) DM carried out literature reviews and analysis, drafted the manuscript,and participated in its revisions; 2) WC served as DM's academic advisorproviding guidance; 3) TX oversaw the development of the manuscriptincluding scope and methodologies, performing editing, revising, andfinalizing the manuscript; and corresponding with Journal office throughoutthe publication process. All authors read and approved the final manuscript.
Author details1Research Center for Contemporary Management (RCCM), TsinghuaUniversity, 100084 Beijing, China. 2Institute of Energy Environment andEconomy, Tsinghua University, 100084 Beijing, China. 3Lawrence BerkeleyNational Laboratory, 1 Cyclotron Road, 94720 Berkeley, CA, USA. 4ChineseUniversity of Hong Kong, Hong Kong, SAR, China.
Received: 2 March 2015 Accepted: 1 May 2015
ReferencesCCTD (The China Coal Trade Market Website) (2013) The coal market of China in
November 2013., Available at: http://www.cctd.com.cn/China Foreign Exchange Rate System (CFETS) (2013) Available at:
http://www.chinamoney.com.cn/index.htmlChen S, Lei P, Huang D, Gao J (2012) The application of new cooler fluid sealing
ring in Pan steel enterprise. (In Chinese)Chen W, Yin X, Ma D (2014) A bottom-up analysis of China’s iron and steel
industrial energy consumption and CO2 emissions. Appl Energ136(2014):1174–1183
Cheng Z, Shi G (2009) The domestic development trend of the latest electricfurnace waste heat recovery technology, The 7th China Steel Conference,2009, Beijing, China., In Chinese
CISA (China Iron and Steel Industry Association) (2013) China Steel statisticalYearbook 2013
Davis E, Kyle P, Edmonds J (2013) An integrated assessment of global andregional water demands for electricity generation to 2095. Adv Water Resour52:296–313
ERI (Energy Research Institute, NDRC, China) (2013) Roadmap study on achievingtechnical energy conservation potential in China’s industrial sector by 2020.China Science and Technology Press, Beijing (In Chinese)
Feng J, Sun Z, Zhang Y, Zhang Y, Yang J (2007) Mass and thermal balance andenergy-saving analysis of the grate-klinkiln system. Sintering Pelletizing32(6):29–34 (In Chinese)
Gong B, Chen X (2012) The application of cyclone type top combustion hotstove in the pebble furnace renovation project, 303–306. (In Chinese)
Hasanbeigi A, Morrow W, Sathaye J, Masanet E, Xu T (2013) A bottom-up modelto estimate the energy efficiency improvement and CO2 emission reductionpotentials in the Chinese iron and steel industry. Energy 50(2013):315–325
Hejazi M, Edmonds J, Clarke L, Kyle P, Davies E, Chaturvedi V (2014) Long-termglobal water projections using six socioeconomic scenarios in an integratedassessment modeling framework. Technol Forecast Soc Change81(2014):205–226
Hong Y, Zhang Y, Wang H, Luo C (2012) Application and efficiency of Pellet sinteringin Tongsteel sintering plant. Sintering Pelletizing 34(4):28–31 (In Chinese)
IEA (International Energy Agency) (2007) Tracking industrial energy efficiency andCO2 emissions., Available at: http://www.iea.org/publications/freepublications/publication/tracking-industrial-energy-efficiency-and-co2-emissions.html
IEA report, Ryan L, Campbell N (2012) Spreading the Net: The multiple benefits ofenergy efficiency improvements.
IPCC (Intergovernmental Panel on Climate Change) (2007) IPCC Guidelines forNational Greenhouse Gas Inventory 2006
IPCC (2014) IPCC Annual Report 5: Mitigation of climate change., Available at:http://ipcc.ch/report/ar5/wg3/
Karali N, Xu T, Sathaye J (2014) Reducing energy consumption and CO2emissions by energy efficiency measures and international trading: a bottom-up modeling for the U.S. iron and steel sector. Appl Energ 120(2014):133–146
Lai Q, Gan Q, Yang S (1995) Investigation on air leakage of Pan-Gang sinteringmachines and reduction of leakage rate. Iron Steel Vanadium Titanium16(1):32–39 (In Chinese)
Ma et al. Future Cities and Environment (2015) 1:7 Page 13 of 13
Li X, Feng K, Siu Y, Hubacek K (2012) Energy-water nexus of wind power inChina: the balancing act between CO2 emissions and water consumption.Energy Policy 45(2012):440–448
Li Y, Zhu L (2014) Cost of energy saving and CO2 emissions reduction in China’siron and steel sector. Appl Energ 130(2014):603–616
Liu X, Fu H, Wu H (2006) Application and discussion on sintering technology oflow carbon and thick sinter bed. Metallurgical Collections 1:27–29(In Chinese)
Liu Z, Lieu J, Zhang X (2014) The target decomposition model for renewableenergy based on technological progress and environmental value. EnergyPolicy 68(2014):70–79
Lu H (2008) The basic characters of waste heat of sintering process and theinfluence of them on waste heat electricity generating. Sintering Pelletizing33(1):35–38 (In Chinese)
Lung R, Mckane A, Leah R, Marsh D (2005) Ancillary savings and productionbenefits in the evaluation of industrial energy efficiency measures. LawrenceBerkeley National Laboratory, CA, US. ACEEE Summer Study on EnergyEfficiency in Industry, Washington DC., Available at: https://getinfo.de/app/Ancillary-Savings-and-Production-Benefits-in-the/id/BLCP%3ACN059445375
Ma J, Sun K (2013) The heat transfer of enhanced blackbody radiationtechnology. Energ Conserv Petro Chem Ind 3:37–39 (In Chinese)
Mao X, Xing Y, Hu T, Zeng A, Liu S (2012) An environmental-economic analysis ofcarbon, sulfur and nitrogen co-reduction path for China’s power industry.China Environ Sci 32(4):748–756 (In Chinese)
Mao X, Zeng A, Hu T, Xing Y, Zhou J, Liu Z (2014) Co-control of local air pollutants andCO2 from the Chinese coal-fired power industry. J Clean Prod 67(2014):220–227
McMahon J, Price S (2011) Water and energy interactions. Annu Rev EnvironResour 36(2011):163–191, Available at: http://ssrn.com/abstract=1955078
MEP (The Ministry of Environmental Protection) (2013) The cleaner productionevaluation system for the iron and steel industry. (In Chinese)
MIIT (The Ministry of Industry and Information Technology) (2012a) The Energysavings and emission reduction information platform
MIIT (The Ministry of Industry and Information Technology) (2012b) Key industrialenergy-efficient and emission reduction technologies and measures.(In Chinese)
Morrow W, Hasanbeigi A, Sathaye J, Xu T (2014) Assessment of energy efficiencyimprovement and CO2 emission reduction potentials in India’s cement andiron & steel industries. J Clean Prod 65(2014):131–141
NBS (National Bureau of Statistics) (2013a) China Energy Statistical Yearbook 2013.China Statistic Press, Beijing, China
NBS (National Bureau of Statistics) (2013b) China Environment StatisticalYearbook 2013. China Statistic Press, Beijing, China
NDRC (2008) National Extension Directory of Important Energy ConservationTechnology 1. National Development and Reform Commission, Beijing,China. (In Chinese)
NDRC (2009) National Extension Directory of Important Energy ConservationTechnology 2. National Development and Reform Commission, Beijing,China. (In Chinese)
NDRC (2011a) National extension directory of important energy conservationtechnology 3. National Development and Reform Commission, Beijing, China.(In Chinese)
NDRC (2011b) national extension directory of important energy conservationtechnology 4. National Development and Reform Commission, Beijing, China.(In Chinese)
NDRC (2012) National extension directory of important energy conservationtechnology 5. National Development and Reform Commission, Beijing, China.(In Chinese)
NDRC (2013) National extension directory of important energy conservationtechnology 6. National Development and Reform Commission, Beijing,China., In Chinese
Pan L (2002) Development and application of the regenerative burners. ShanghaiMetals 24(4):42–45 (In Chinese)
Pan L, Liu P, Ma L, Li Z (2012) A supply chain based assessment of water issues inthe coal industry in China. Energy Policy 48(2012):93–102
Rohdin P, Thollander P, Solding P (2007) 2007, Barriers to and drivers for energyefficiency in the Swedish foundry industry. Energy Policy 35(1):672–677
SERC (State Electricity Regulatory Commission) (2011) The electricity price ofChina in 2010
Song M, Li M, Yu H (2009) Research on refining process of ultra-low-carbon steelfor thin slab casting. Steel Making 25(3):8–10 (In Chinese)
Song Y (2001) Application of low temperature sinter technique. SinteringPelletizing 26(5):50–52
Wang R (2014a) Application of the technology of power generation withlow-pressure steam from recovered waste heat in a pelletizing plant.Metallurgical Power 3:38–40 (In Chinese)
Wang W (2005) Process energy consumption and saving potential of iron andsteel enterprise. Metallurgical Management 6(2005):32–34 (In Chinese)
Wang W (2009) Energy consumption of key iron and steel enterprise in 2010.World metals. (In Chinese)
Wang W (2011) Energy consumption of key iron and steel enterprise in 2010.World metals. (In Chinese)
Wang W (2014b) Energy consumption of key iron and steel enterprises in 2013.World metals., In Chinese
Wei X, Zhou H (2003) Evaluating the environmental value schedule of pollutantsmitigated in China thermal power industry. Res Environ Sci 16(1):53–56(In Chinese)
Wen Z, Meng F, Chen M (2014) Estimates of the potential for energyconservation and CO2 emissions mitigation based on Asian-PacificIntegrated Model (AIM): the case of the iron and steel industry in China. JClean Prod 65(2014):120–130
WHECA (Wu Han Energy Conservation Association) (2014) The regional carbonmarket in China., Available at: http://www.wuhaneca.org/view.php?id=34845
Worrell E, Laitner J, Ruth M, Finman H (2003) Productivity benefits of industrialenergy efficiency measures. Energy 28(11):1081–1098
Xu G (2003) The application of waste plastic in iron-making process. Environ Eng21(1):78–81 (In Chinese)
Xu T, Karali N, Sathaye J (2014) Undertaking high impact strategies: the role ofnational efficiency measures in long-term energy and emission reduction insteel making. Appl Energ 122(2014):179–188
Xue X (2009) Economic benefit of CDQ project in independent coking enterprise.Shan Xi Energ Conserv 5:56–57 (In Chinese)
Yang B (2011) Development and practice of multislit rolling technique on the barrolling. Xinjiang Iron Steel 3:4–6 (In Chinese)
Yang X, Teng F, Wang G (2013) Incorporating environmental co-benefits intoclimate policies: a regional study of the cement industry in China. ApplEnerg 112(2013):1446–1453
Zhang C, Zheng W, Zhou J, Shang G, Li X, Gan L (2011) The development andapplication of CDQ and TRT in China’s Iron and steel Industry. (In Chinese)
Zhang H, Li Z, Jia W, Li Y (2006) The selection and application of CCPP in Han-Gang.Energ Res Consumpt 6:38–42 (In Chinese)
Zhang K (2013) Recovery, utilization and balancing of BFG. Tianjin Metallurgy4:61–63 (In Chinese)
Zhang Q, Tian W, Wei Y, Chen Y (2007) External costs from electricity generationof China up to 2030 in energy and abatement scenarios. Energy Policy35(2007):4295–4304
Zheng X (2003) The process control system of the UHP EAF in Huaiyin steelgroup. Shanghai Metals 25(6):19–21 (In Chinese)
Zhou C (2013) Process control in BOF iron-making system. China WesternTechnol 12(3):31–32 (In Chinese)
Zhou X (2008) Scraps preheating in steelmaking and analysis on its energysavings profit. Special Steel Technol 14(57):25–28 (In Chinese)
Zhu D, Chen H (2004) Coal moisture control process and its economic effectanalysis. Fuel Chem Process 35(2):7–9 (In Chinese)